Table of Contents Introduction .................................................................................................................................................. 1 Jackson MPO ................................................................................................................................................. 2 Individual County Reports ............................................................................................................................. 9
Hinds County ........................................................................................................................................... 10 Madison County ...................................................................................................................................... 14 Rankin County ........................................................................................................................................ 18
List of Tables 1-1 MPO Total Crashes and Percent Increase ............................................................................................... 2 1-2 MPO Annual Vehicle Miles Traveled....................................................................................................... 3 1-3 MPO Total Traffic Fatalities .................................................................................................................... 5 1-4 MPO Crashes with Serious Injuries ......................................................................................................... 5 1-5 MPO Behavior Related Fatality Data ...................................................................................................... 6 1-6 Highest Crash Occurrences by Hour of Day in the MPO Planning Area ................................................. 7 1-7 MPO Special User Fatal Crash Data ........................................................................................................ 7 1-8 Special User Fatal Crash Summary Jackson MPO 2011-2015 ................................................................. 7 2-1 Hinds County Total Crashes and Percent Increase ............................................................................... 10 2-2 Hinds County Annual Vehicle Miles Traveled ....................................................................................... 10 2-3 Hinds County Total Traffic Fatalities ..................................................................................................... 11 2-4 Hinds County Crashes with Serious Injuries ......................................................................................... 11 2-5 Hinds County Behavior Related Fatality Data ....................................................................................... 12 2-6 Hinds County Special User Fatal Crash Data ......................................................................................... 12 2-7 Special User Fatal Crash Summary Hinds County MPO 2011-2015 ...................................................... 12 2-8 Highest Crash Occurrences by Hour of Day in Hinds County................................................................ 13 3-1 Madison County Total Crashes and Percent Increase .......................................................................... 14 3-2 Madison County Annual Vehicle Miles Traveled .................................................................................. 14 3-3 Madison County Total Traffic Fatalities ................................................................................................ 15 3-4 Madison County Crashes with Serious Injuries .................................................................................... 15 3-5 Madison County Behavior Related Fatality Data .................................................................................. 16 3-6 Madison County Special User Fatal Crash Data .................................................................................... 16 3-7 Special User Fatal Crash Summary Madison County MPO 2011-2015 ................................................. 16 3-8 Highest Crash Occurrences by Hour of Day in Madison County........................................................... 17 4-1 Rankin County Total Crashes and Percent Increase ............................................................................. 18 4-2 Rankin County Annual Vehicle Miles Traveled ..................................................................................... 18 4-3 Rankin County Total Traffic Fatalities ................................................................................................... 19 4-4 Rankin County Crashes with Serious Injuries........................................................................................ 19 4-5 Rankin County Behavior Related Fatality Data ..................................................................................... 20 4-6 Rankin County Special User Fatal Crash Data ....................................................................................... 20 4-7 Special User Fatal Crash Summary Rankin County MPO 2011-2015 .................................................... 20 4-8 Highest Crash Occurrences by Hour of Day in Rankin County .............................................................. 21
Funding Disclaimer
This document was prepared and published by the Jackson Metropolitan Planning Organization (MPO) and is prepared in cooperation with and financial assistance from the following public agencies: the Mississippi Department of Transportation, the Federal Highway Administration and the Federal Transit Administration under the Metropolitan Planning Program. The contents of this report do not necessarily reflect the official views or policy of the funding agencies.
Non-Discrimination Policy I Equal Employment Opportunity Employer
The Central Mississippi Planning and Development District (CMPDD) does not discriminate on the basis of race, color, religion, sex, age, national origin, disability, political affiliation, or belief in admission to, access to, or operations of its programs, services, or activates. CMPDD provides an equal employment opportunity to all its employees and applicants for employment.
1
Introduction This report is designed to provide an analysis of the available crash data for the Jackson Urbanized Area (JUA). It focuses specifically on the number and types of crashes that have occurred and the resulting injuries or deaths. Crash data used by the Jackson Metropolitan Planning Organization (MPO) to develop this 2017 Safety Analysis Report was obtained from the National Highway Traffic Safety Administration (NHTSA) and from data provided to the Mississippi Department of Transportation (MDOT) by the Mississippi Department of Public Safety (MDPS). Though data provided by the MDOT identifies fatal crashes in the Jackson MPO Planning Area, the data provided by the NHTSA is considered the “official” dataset each state will use to assess fatal crashes and to develop performance measures and set targets to reduce those crash types. Therefore, for purposes of this report all fatal crash data comes from the NHTSA. However, the NHTSA dataset does not include and is not considered the “official” dataset for serious injury crashes. Thus, the data provided by the MDOT to the MPO will be used to identify and assess serious injury crashes. Reducing the total amount of fatal and severe injury crashes in the MPO planning area are both considered high priorities by the MPO in aiding the state in meeting its overall goals set forth in the SHSP. This report covers a five year analysis period from 2011-2015. This is due to the fact that the most recent NHTSA data available for fatal crashes is 2015, therefore, data provided by the MDOT for serious injury crashes will be used to cover the same time frame as well.
Federal regulations require each MPO to develop a Metropolitan Transportation Plan (MTP). A MTP must provide for consideration and implementation of projects, strategies, and services that address eight planning factors. One of those eight factors to be addressed is safety. Title 23 of the United States Code Part 134 (h)(1) states: In general.—The metropolitan planning process for a metropolitan planning area under this section shall provide for consideration of projects and strategies that will— “increase the safety of the transportation system for motorized and non-motorized users.” Volume II of the 2040 MTP for the Jackson Urbanized Area addresses the safety requirement. The Jackson MPO’s 2017 Safety Analysis Report in no way should be construed to take the place of the findings identified in the 2040 MTP, but rather to serve as a supplement to that plan. The MPO places a priority on supporting the findings and implementation of the 2040 MTP. This report does not identify specific high priority crash locations, but rather provides an overview of the crash trends affecting the Jackson MPO planning area.
The Safe, Accountable, Flexible, Efficient Transportation Equity Act – A Legacy for Users (SAFETEA-LU) transportation bill, passed in 2006, established the Highway Safety Improvement Program (HSIP) as a core Federal program. The funding for this program is to be used by States to reduce the number of traffic fatalities and serious injuries on all public roads. In order to receive funding under this Program, states are required to develop Strategic Highway Safety Plan’s (SHSP’s). A SHSP is a five-year, data-driven, comprehensive safety plan that establishes statewide safety goals and provides strategies necessary for reducing traffic related fatalities and serious injuries. The Moving Ahead for Progress in the 21st Century (MAP-21) and Fixing America’s Surface Transportation (FAST) acts both continued the HSIP with a sustained focus on achieving a significant reduction in traffic fatalities and serious injuries on all public roads, including non-State-owned public roads and roads on tribal lands.
In 2007, the MDOT and the MDPS jointly developed the state’s first SHSP. The 2007 SHSP set a statewide goal of reducing traffic-related fatalities in the State to 700 by 2011. The implementation of identified safety strategies in the SHSP resulted in the State meeting its goal in 2009. In 2013, the MDOT and MDPS completed an update of the SHSP with a new goal of reducing annual traffic fatalities by 25% by 2017. This report will be used by the MPO to aid local jurisdictions in identifying areas that experience recurring crashes and developing implementable strategies that can be used by those jurisdictions aimed at reducing crashes that will support the MDOT and MDPS in meeting their overall statewide goal.
2
Jackson MPO The Jackson MPO Planning Area includes portions of Hinds, Madison and Rankin Counties and the municipalities within those counties. Based on the 2010 Census, the total population for the MPO Planning Area is approximately 457,000. This is roughly 15% of the state of Mississippi’s total population. However, over the five year analysis period of this report (2011-2015) the Jackson MPO Planning Area has 21.3% of the state’s total crashes, 15.1% of crashes with serious injuries and, according to the National Highway Traffic Safety Administration (NHTSA), 9.9% of the state’s fatalities that are a result of traffic crashes. Over the past five years the amount of crashes in the MPO Planning Area has increased by 21.2% (See Table 1-1). During that same time period the annual vehicle miles traveled increased by over 400,000 or 8.6% (See Table 1-2). The increase in traffic can be considered a contributing factor to the overall increase in crashes and crashes with serious injuries and fatalities in the MPO Planning Area; however, other factors also contribute to this increase. These range from distracted driving, driving without a seatbelt, speeding, tailgating, driver fatigue, aggressive driving and driving while impaired, just to name a few.
Table 1-1
*Data provided by the Mississippi Department of Transportation (MDOT) and the Mississippi Department of Public Safety (MDPS)
4.1%6.6% 0.8%
8.3%
14,130 14,710 15,687 15,819 17,126
02,0004,0006,0008,000
10,00012,00014,00016,00018,000
2011 2012 2013 2014 2015
CRAS
HES
MPO Total Crashes and Percent Change Annually
3
Table 1-2
*Data provided by the MDOT The top five causes of crashes in the MPO area make up 80.0% of all crashes types with 38.1% of all crashes involving automobiles being rear ended while moving slowly or at a complete stop. While infrastructure improvements at locations with high volumes of rear ending may aid in reducing these types of crashes, or other crash types for that matter, the overarching problem cannot be addressed with infrastructure improvements alone. Extensive education and enforcement programs are crucial when attempting to reduce automobile crashes. Typically, a large number of traffic accidents can be attributed to distracted driving. Distracted driving is any activity that diverts attention from driving, including talking or texting on your phone, eating and drinking, talking to people in your vehicle, rubber necking, operating entertainment or navigation systems—anything that takes your attention away from the task of safe driving. According to information taken from the MDOT’s Driver Safety Education Program, drivers who use handheld devices are four times more likely to be involved in a crash resulting in serious injury. Drivers who text while driving are 23 times more likely to be involved in an accident. In addition, MDOT’s site notes that sending or receiving a text takes a driver’s eyes from the road for an average of 4.6 seconds, the equivalent - at 55 MPH - of traveling the length of an entire football field, blind. Recently, there has been a nationwide focus to raise awareness of crashes involving distracted driving to reduce resulting traffic fatalities and injuries. As mentioned above, distracted driving can include many actions, but using cell phones to talk or text is currently one of the more problematic distractions and a focus for the national campaign against distracted driving. Mississippi’s crash data was reviewed in an attempt to quantify and document the effects of distracted driving, but, currently, the state’s crash data does not allow for the identification of distracted driving with the current crash report form. Due to the national priority set on the topic, a concerted effort to reduce distracted driving through education and enforcement campaigns should be a major focus statewide. The MDOT, MDPS and
Most Common Crash Types in the MPO Planning Area
Rear End 38.1%
Angle 16.2%
Sideswipe 13.4%
Run Off Road - Right 7.1%
Left turn same roadway 5.2%
-2.4%2.0% 1.0%
8.0%
5,503.505,369.19 5,474.83 5,531.33
5,974.70
5,000.00
5,200.00
5,400.00
5,600.00
5,800.00
6,000.00
6,200.00
2011 2012 2013 2014 2015
MILL
ION
VEHI
CLE
MILE
S TRA
VELE
D
MPO Vehicle Miles Traveled and Percent Change Annually
4
Mississippi Office of Highway Safety (MOHS) each produce safety resource materials and have developed ad campaigns specifically aimed at reducing distracted driving and improving driver behavior. Some examples of these campaigns include Click it or Ticket, Drive Sober or Get Pulled Over and Pay Attention or Pay a Fine, just to name a few. Continuing, and where applicable improving, these campaigns is essential to curbing driver behavior which results in so many crashes, especially those resulting in serious injury and death. As noted above, there should be an emphasis on reducing distracted driving through education and enforcement, however, there are also proven safety countermeasures that if implemented correctly could also have a significant impact on improving driver awareness and reducing the total amount and, in some instances, severity of crashes in the MPO Planning Area. These include:
Safety Edge Roundabouts Corridor Access Management Backplates with Retroreflective Borders Longitudinal Rumble Strips and Stripes Enhanced Delineation and Friction for Horizontal Curves Medians and Pedestrian Crossing Islands in Urban and Suburban Areas Pedestrian Hybrid Beacon Road Diets
Though not all of these countermeasures are applicable for reducing distracted driving, each does provide enhanced safety features when implemented. For example, rumble strips are used to aid in reducing distracted driving and drowsy driving, whereas, roundabouts and road diets are used to aid in reducing travel speed. Each aiding in improving overall driver behavior and improving safety.
Another major concern in the MPO planning area is roadway departure crashes. Adding enhanced edge lines, rumble strips, enhanced curve delineation and safety edge, especially along roadways with narrow or no paved shoulders, are each low cost safety countermeasures that can typically be implemented in a short to moderate time frame. Detailed descriptions of each of these countermeasures, as well as the ones mentioned previously, are available on the Federal Highway Administration’s (FHWA’s) website at https://safety.fhwa.dot.gov/provencountermeasures/.
*Safety edge treatment examples.
While a goal of the MPO is to reduce crashes as a whole, the major focus is to find ways to reduce crashes that result in serious injury or even worse death. Tables 1-3 and 1-4, respectively, show the amount of fatalities and serious injuries that occurred due to crashes in the MPO planning area between 2011-2015. For the five year period there was an average of 61.4 fatalities per year with the highest total being 77 fatalities in 2015. There was a significant jump between 2014 and 2015 showing a 28.3% increase. For the five year period as a whole the number of fatalities caused by crashes increased by 40.0% from 55 to 77.
5
Table 1-3
*Data provided by the National Highway Traffic Safety Administration (NHTSA)
The average amount of crashes that resulted in serious injury for the five year period was 51 per year with the highest total being 59 in 2012. There was a significant reduction in crashes resulting in serious injuries between 2013 and 2014 showing a 21.8% decrease. For the five year period as a whole the number of serious injury related crashes decreased by 7.7% from 52 to 48. That being said, this could be the result of there being an increase in the severity of crashes from those with serious injuries to those resulting in fatalities as the amount of fatalities increased over the same five year period. It is vital for Local Public Agencies (LPA’s) in the MPO planning area to work jointly with partners such as the MPO and the MDOT to identify countermeasures that may be implemented that would aid in reducing the amount of crashes that result in fatalities or serious injuries and improving safety for all users of the transportation system.
Table 1-4
*Data provided by the MDOT and the MDPS
9.1%-8.3%
9.1%
28.3%
55 60 55 6077
0102030405060708090
2011 2012 2013 2014 2015
FATA
LITIE
S
MPO Total Traffic Fatalities and Percent Change Annually
13.5%-6.8%
-21.8%11.6%
52 59 5543 48
0
10
20
30
40
50
60
70
1 2 3 4 5
CRAS
HES
MPO Crashes with Serious Injuries and Percent Change Annually
Mississippi Office of Highway Safety (MOHS) each produce safety resource materials and have developed ad campaigns specifically aimed at reducing distracted driving and improving driver behavior. Some examples of these campaigns include Click it or Ticket, Drive Sober or Get Pulled Over and Pay Attention or Pay a Fine, just to name a few. Continuing, and where applicable improving, these campaigns is essential to curbing driver behavior which results in so many crashes, especially those resulting in serious injury and death. As noted above, there should be an emphasis on reducing distracted driving through education and enforcement, however, there are also proven safety countermeasures that if implemented correctly could also have a significant impact on improving driver awareness and reducing the total amount and, in some instances, severity of crashes in the MPO Planning Area. These include:
Safety Edge Roundabouts Corridor Access Management Backplates with Retroreflective Borders Longitudinal Rumble Strips and Stripes Enhanced Delineation and Friction for Horizontal Curves Medians and Pedestrian Crossing Islands in Urban and Suburban Areas Pedestrian Hybrid Beacon Road Diets
Though not all of these countermeasures are applicable for reducing distracted driving, each does provide enhanced safety features when implemented. For example, rumble strips are used to aid in reducing distracted driving and drowsy driving, whereas, roundabouts and road diets are used to aid in reducing travel speed. Each aiding in improving overall driver behavior and improving safety.
Another major concern in the MPO planning area is roadway departure crashes. Adding enhanced edge lines, rumble strips, enhanced curve delineation and safety edge, especially along roadways with narrow or no paved shoulders, are each low cost safety countermeasures that can typically be implemented in a short to moderate time frame. Detailed descriptions of each of these countermeasures, as well as the ones mentioned previously, are available on the Federal Highway Administration’s (FHWA’s) website at https://safety.fhwa.dot.gov/provencountermeasures/.
*Safety edge treatment examples.
While a goal of the MPO is to reduce crashes as a whole, the major focus is to find ways to reduce crashes that result in serious injury or even worse death. Tables 1-3 and 1-4, respectively, show the amount of fatalities and serious injuries that occurred due to crashes in the MPO planning area between 2011-2015. For the five year period there was an average of 61.4 fatalities per year with the highest total being 77 fatalities in 2015. There was a significant jump between 2014 and 2015 showing a 28.3% increase. For the five year period as a whole the number of fatalities caused by crashes increased by 40.0% from 55 to 77.
6
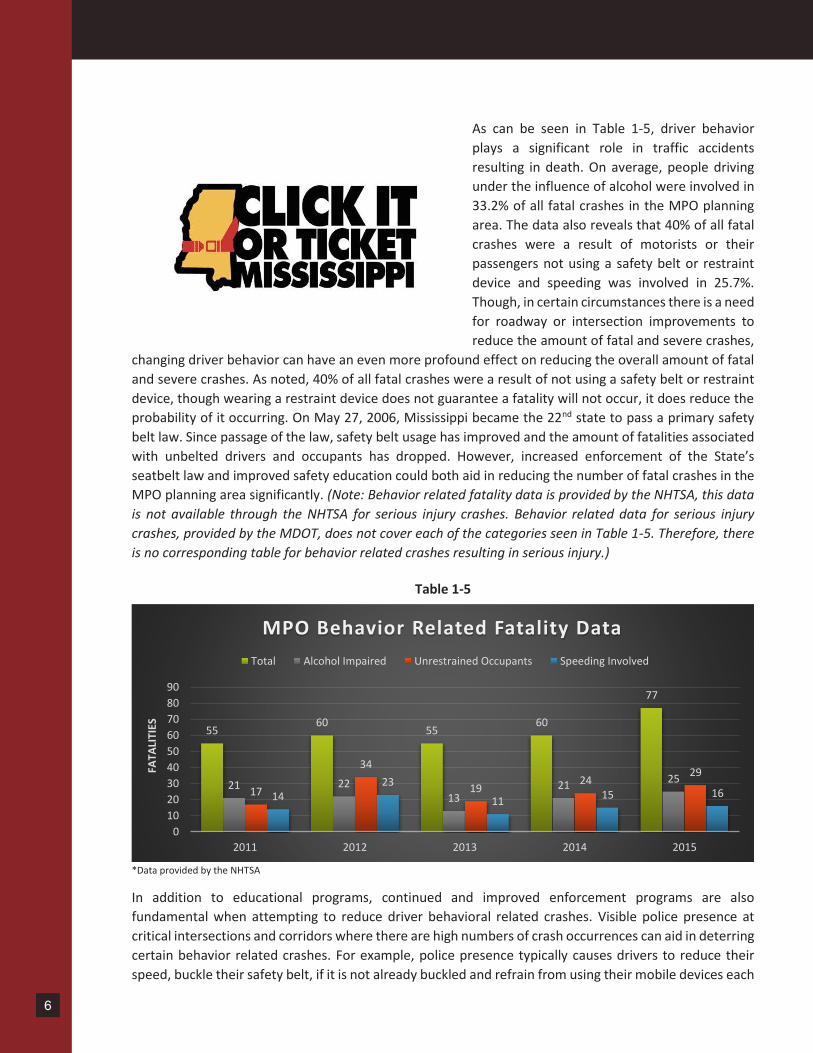
As can be seen in Table 1-5, driver behavior plays a significant role in traffic accidents resulting in death. On average, people driving under the influence of alcohol were involved in 33.2% of all fatal crashes in the MPO planning area. The data also reveals that 40% of all fatal crashes were a result of motorists or their passengers not using a safety belt or restraint device and speeding was involved in 25.7%. Though, in certain circumstances there is a need for roadway or intersection improvements to reduce the amount of fatal and severe crashes,
changing driver behavior can have an even more profound effect on reducing the overall amount of fatal and severe crashes. As noted, 40% of all fatal crashes were a result of not using a safety belt or restraint device, though wearing a restraint device does not guarantee a fatality will not occur, it does reduce the probability of it occurring. On May 27, 2006, Mississippi became the 22nd state to pass a primary safety belt law. Since passage of the law, safety belt usage has improved and the amount of fatalities associated with unbelted drivers and occupants has dropped. However, increased enforcement of the State’s seatbelt law and improved safety education could both aid in reducing the number of fatal crashes in the MPO planning area significantly. (Note: Behavior related fatality data is provided by the NHTSA, this data is not available through the NHTSA for serious injury crashes. Behavior related data for serious injury crashes, provided by the MDOT, does not cover each of the categories seen in Table 1-5. Therefore, there is no corresponding table for behavior related crashes resulting in serious injury.)
Table 1-5
*Data provided by the NHTSA
In addition to educational programs, continued and improved enforcement programs are also fundamental when attempting to reduce driver behavioral related crashes. Visible police presence at critical intersections and corridors where there are high numbers of crash occurrences can aid in deterring certain behavior related crashes. For example, police presence typically causes drivers to reduce their speed, buckle their safety belt, if it is not already buckled and refrain from using their mobile devices each
of which is a change in driver behavior. These changes in behavior could lead to a significant reduction in crashes in the MPO planning area.
In addition to having increased police presence at critical intersections and corridors, improving police presence at times of day when there are a high number of crash occurrences is also critical. As can be seen from Table 1-6, 46.8% of all crashes in the MPO planning area take place during six hours of the day. The highest amount of crashes take place from 5:00 – 5:59 P.M., which is a peak travel hour during the day for people leaving work headed home. The top three time periods range from 3:00 – 5:59 P.M. and make up 26.2% of all crashes. As mentioned above, it is believed that increasing police presence during these hours of the day could result in less crashes due to improved driver behavior.
Table 1-6
*Data provided by the MDOT and the MDPS
Table 1-7
*Data provided by the NHTSA
Highest Crash Occurrences by Hour of Day in the MPO Planning Area
MPO Special User Fatal Crash DataTotal Motorcycle Pedestrian Bicycle
8
Table 1-8 Special User Fatal Crash Summary Jackson MPO 2011-2015
Special User Description Fatalities Per Year Average
Single Highest
Year
% of Total Fatal Accidents
Motorcyclists Involves a person operating a motorcycle or moped 6.4 2014 10.4% Pedestrians Involves a person not in or on a vehicle 10.4 2015 16.9% Bicyclists Involves a person operating a bicycle 1 2011 1.6%
Table 1-7, on the previous page, provides information about special users of the transportation system in the MPO planning area. This table shows the total amount of fatalities for all modes of transportation in green and the amount of those fatalities involving special users of the system. Table 1-8 provides a breakdown of the five year 2011-2015 reporting period for special users.
As mentioned earlier in this report, distracted driving plays a significant role in automobile accidents. That being said, distracted walking plays an even greater role in pedestrian accidents. Texting and driving is a known danger, but distracted walking results in more injuries per mile than distracted driving. Consequences include bumping into walls, falling down stairs, tripping over clutter or stepping into traffic. Though injuries from car accidents involving texting are often more severe, physical harm resulting from texting and walking occurs more frequently, research shows. An analysis of hospital data conducted at Ohio State University found that injuries involving pedestrians on their cell phones more than doubled between 2005 and 2010. While motorists should not use their cell phones when driving due to the increased probability of a traffic accident, pedestrians have an equal responsibility to pay attention to their surroundings to reduce their chances of being involved in an accident as well.
General Crash Statistics for MPO Planning Area
82.1% of all crashes in the MPO Planning Area occurred during dry conditions 74.4% of all crashes occurred during daylight conditions 55.8% of all crashes occurred at intersections 45.8% of all intersection crashes are when a car is rear ended while moving slowly or stopped
9
Table 1-8 Special User Fatal Crash Summary Jackson MPO 2011-2015
Special User Description Fatalities Per Year Average
Single Highest
Year
% of Total Fatal Accidents
Motorcyclists Involves a person operating a motorcycle or moped 6.4 2014 10.4% Pedestrians Involves a person not in or on a vehicle 10.4 2015 16.9% Bicyclists Involves a person operating a bicycle 1 2011 1.6%
Table 1-7, on the previous page, provides information about special users of the transportation system in the MPO planning area. This table shows the total amount of fatalities for all modes of transportation in green and the amount of those fatalities involving special users of the system. Table 1-8 provides a breakdown of the five year 2011-2015 reporting period for special users.
As mentioned earlier in this report, distracted driving plays a significant role in automobile accidents. That being said, distracted walking plays an even greater role in pedestrian accidents. Texting and driving is a known danger, but distracted walking results in more injuries per mile than distracted driving. Consequences include bumping into walls, falling down stairs, tripping over clutter or stepping into traffic. Though injuries from car accidents involving texting are often more severe, physical harm resulting from texting and walking occurs more frequently, research shows. An analysis of hospital data conducted at Ohio State University found that injuries involving pedestrians on their cell phones more than doubled between 2005 and 2010. While motorists should not use their cell phones when driving due to the increased probability of a traffic accident, pedestrians have an equal responsibility to pay attention to their surroundings to reduce their chances of being involved in an accident as well.
General Crash Statistics for MPO Planning Area
82.1% of all crashes in the MPO Planning Area occurred during dry conditions 74.4% of all crashes occurred during daylight conditions 55.8% of all crashes occurred at intersections 45.8% of all intersection crashes are when a car is rear ended while moving slowly or stopped
Individual County Reports The previous section provided crash data and statistics for the Jackson MPO planning area as a whole, which includes Hinds, Madison and Rankin Counties. Also in the previous section proposed safety countermeasures were discussed that if implemented could reduce the amount and severity of crashes in the planning area. The following sections provide crash data and statistics for each county within the planning area, but does not include proposed safety countermeasures. This is due to the fact that each of the discussed countermeasures from the previous section can also be applied to priority crash sites in each individual county. As mentioned in the introduction, this report does not identify specific high priority crash locations, but rather provides an overview of the crash trends affecting the Jackson MPO planning area. MPO staff may use the Safety Analysis Management System (SAMS) crash data, provided by the MDOT, to work with the LPA’s in the planning area to identify specific crash locations that are candidates for low cost safety countermeasure treatments that can be put into place in a timely manner and will further the implementation of the SHSP vision toward zero deaths.
54.1%
17.9%
28.0%
Percentage of MPO Total Crashes from 2011-2015
Hinds
Madison
Rankin
10
Hinds County Based on the 2010 Census, Hinds County’s total population within the MPO Planning Area is 233,706 which is roughly 51% of the Jackson MPO Planning Area’s total population. However, Hinds County has 54.1% of the total crashes, 49.6% of crashes with serious injuries and 54.4% of the MPO’s fatalities that are a result of traffic crashes. For the past five years the amount of crashes in Hinds County has increased by 1,280 or 15.9% (See Table 2-1). During that same time period the annual vehicle miles traveled increased by 116,000 or 3.8% (See Table 2-2).
Table 2-1
*Data provided by the Mississippi Department of Transportation (MDOT) and the Mississippi Department of Public Safety (MDPS)
Table 2-2
*Data provided by the MDOT
2.6%3.4% 0.9%
10.5%
7,850 8,052 8,322 8,394
9,273
7,000
7,500
8,000
8,500
9,000
9,500
2011 2012 2013 2014 2015
CRAS
HES
Hinds County Total Crashes and Percent Change Annually
-2.7% 0.6%0.9%
5.1%
3,065.422,983.69 3,000.44 3,027.95
3,181.40
2,850.00
2,900.00
2,950.00
3,000.00
3,050.00
3,100.00
3,150.00
3,200.00
2011 2012 2013 2014 2015
MILL
ION
VEHI
CLE
MILE
S TRA
VELE
D
Hinds County Vehicle Miles Traveled and Percent Change Annually
11
Hinds County Based on the 2010 Census, Hinds County’s total population within the MPO Planning Area is 233,706 which is roughly 51% of the Jackson MPO Planning Area’s total population. However, Hinds County has 54.1% of the total crashes, 49.6% of crashes with serious injuries and 54.4% of the MPO’s fatalities that are a result of traffic crashes. For the past five years the amount of crashes in Hinds County has increased by 1,280 or 15.9% (See Table 2-1). During that same time period the annual vehicle miles traveled increased by 116,000 or 3.8% (See Table 2-2).
Table 2-1
*Data provided by the Mississippi Department of Transportation (MDOT) and the Mississippi Department of Public Safety (MDPS)
Table 2-2
*Data provided by the MDOT
2.6%3.4% 0.9%
10.5%
7,850 8,052 8,322 8,394
9,273
7,000
7,500
8,000
8,500
9,000
9,500
2011 2012 2013 2014 2015
CRAS
HES
Hinds County Total Crashes and Percent Change Annually
-2.7% 0.6%0.9%
5.1%
3,065.422,983.69 3,000.44 3,027.95
3,181.40
2,850.00
2,900.00
2,950.00
3,000.00
3,050.00
3,100.00
3,150.00
3,200.00
2011 2012 2013 2014 2015
MILL
ION
VEHI
CLE
MILE
S TRA
VELE
D
Hinds County Vehicle Miles Traveled and Percent Change Annually
The top five causes of crashes in Hinds County make up 77.6% of all crashes types in the county while 35.3% of all crashes involve automobiles being rear ended while moving slowly or at a complete stop.
Table 2-3
*Data provided by the National Highway Traffic Safety Administration (NHTSA)
Table 2-4
*Data provided by the MDOT and the MDPS
7.4%-6.9%
-29.6%
26.3%
27 29 2719
24
0
5
10
15
20
25
30
35
2011 2012 2013 2014 2015
CRAS
HES
Hinds County Crashes With Serious Injuries and Percent Change Annually
Most Common Crash Types in Hinds County
Rear End 35.3%
Sideswipe 16.1%
Angle 15.6%
Run Off Road - Right 6.5%
Left Turn Same Roadway 4.1%
-9.4% -3.4%10.7%
51.6%
32 29 28 31
47
0
10
20
30
40
50
2011 2012 2013 2014 2015
FATA
LITIE
S
Hinds County Total Traffic Fatalities and Percent Change Annually
12
Table 2-5
*Data provided by the NHTSA
Table 2-6
*Data provided by the NHTSA
Table 2-7
Special User Fatal Crash Summary Hinds County 2011-2015
Special User Description
Fatalities Per Year Average
Single Highest
Year
% of Total Fatal Accidents
Motorcyclists Involves a person operating a motorcycle or moped 2.8 2014 8.4% Pedestrians Involves a person not in or on a vehicle 8.6 2015 25.7% Bicyclists Involves a person operating a bicycle 0.8 2011 2.4%
3229 28
31
47
17
107 9
1512 13
914
19
7 6 4 510
0
10
20
30
40
50
2011 2012 2013 2014 2015
FATA
LITIE
S
Hinds County Behavior Related Fatality DataTotal Alcohol Impaired Unrestrained Occupants Speeding Involved
3229 28
31
47
3 1 16
35 611
7
14
2 0 1 0 10
10
20
30
40
50
2011 2012 2013 2014 2015
FATA
LITIE
S
Hinds County Special User Fatal Crash DataTotal Motorcycle Pedestrian Bicycle
13
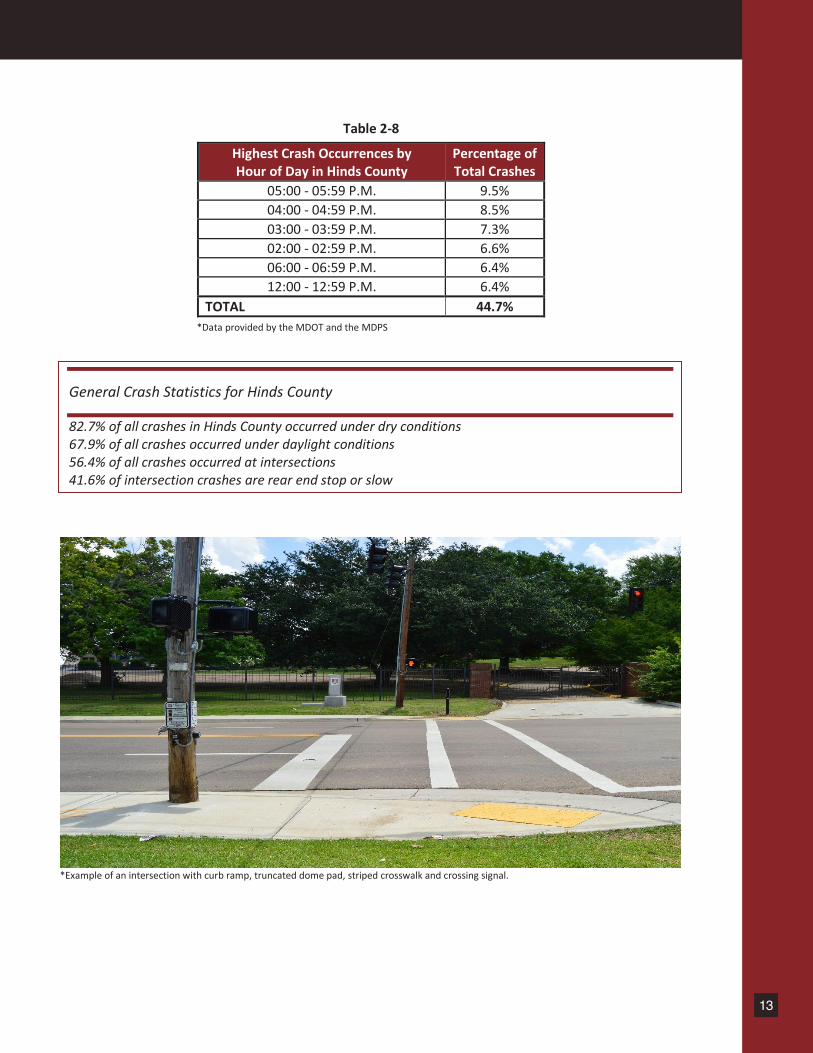
Table 2-8
*Data provided by the MDOT and the MDPS
*Example of an intersection with curb ramp, truncated dome pad, striped crosswalk and crossing signal.
Highest Crash Occurrences by Hour of Day in Hinds County
82.7% of all crashes in Hinds County occurred under dry conditions 67.9% of all crashes occurred under daylight conditions 56.4% of all crashes occurred at intersections 41.6% of intersection crashes are rear end stop or slow
14
Madison County Based on the 2010 Census, Madison County’s total population within the MPO Planning Area is 89,496 which is roughly 20% of the Jackson MPO Planning Area’s total population. However, Madison County has 17.9% of the total crashes, 16.6% of crashes with serious injuries and 15.3% of the MPO’s fatalities that are a result of traffic crashes. For the past five years the amount of crashes in Madison County has increased by 1,046 or 40.1% (See Table 3-1). During that same time period the annual vehicle miles traveled increased by 123,000 or 7.9% (See Table 3-2).
Table 3-1
*Data provided by the Mississippi Department of Transportation (MDOT) and the Mississippi Department of Public Safety (MDPS)
Table 3-2
*Data provided by the MDOT
10.2% 7.0% 6.6% 5.6%
2,369 2,610 2,793 2,977 3,143
0
500
1,000
1,500
2,000
2,500
3,000
3,500
2011 2012 2013 2014 2015
CRAS
HES
Madison County Total Crashes and Percent Change Annually
9.6%
-6.1%
5.4% -0.5%
1,561.56
1,711.45
1,606.82
1,693.48 1,684.63
1,450.00
1,500.00
1,550.00
1,600.00
1,650.00
1,700.00
1,750.00
2011 2012 2013 2014 2015
MILL
ION
VEHI
CLE
MILE
S TRA
VELE
D
Madison County Vehicle Miles Traveled and Percent Change Annually
15
Madison County Based on the 2010 Census, Madison County’s total population within the MPO Planning Area is 89,496 which is roughly 20% of the Jackson MPO Planning Area’s total population. However, Madison County has 17.9% of the total crashes, 16.6% of crashes with serious injuries and 15.3% of the MPO’s fatalities that are a result of traffic crashes. For the past five years the amount of crashes in Madison County has increased by 1,046 or 40.1% (See Table 3-1). During that same time period the annual vehicle miles traveled increased by 123,000 or 7.9% (See Table 3-2).
Table 3-1
*Data provided by the Mississippi Department of Transportation (MDOT) and the Mississippi Department of Public Safety (MDPS)
Table 3-2
*Data provided by the MDOT
10.2% 7.0% 6.6% 5.6%
2,369 2,610 2,793 2,977 3,143
0
500
1,000
1,500
2,000
2,500
3,000
3,500
2011 2012 2013 2014 2015
CRAS
HES
Madison County Total Crashes and Percent Change Annually
9.6%
-6.1%
5.4% -0.5%
1,561.56
1,711.45
1,606.82
1,693.48 1,684.63
1,450.00
1,500.00
1,550.00
1,600.00
1,650.00
1,700.00
1,750.00
2011 2012 2013 2014 2015
MILL
ION
VEHI
CLE
MILE
S TRA
VELE
D
Madison County Vehicle Miles Traveled and Percent Change Annually
The top five causes of crashes in Madison County make up 80.6% of all crashes types in the county while 36.8% of all crashes involve automobiles being rear ended while moving slowly or at a complete stop.
Table 3-3
*Data provided by the National Highway Traffic Safety Administration (NHTSA)
Table 3-4
*Data provided by the MDOT and the MDPS
28.6%
-33.3%
83.3%
27.3%
79
6
1114
02468
10121416
2011 2012 2013 2014 2015
FATA
LITIE
S
Madison County Total Traffic Fatalities and Percent Change Annually
Most Common Crash Types in Madison County
Rear End 36.8%
Angle 16.6%
Sideswipe 10.5%
Deer 8.4%
Run Off Road - Right 8.3%
150.0%
40.0%
-28.6%
-70.0%
4
1014
10
302468
10121416
2011 2012 2013 2014 2015
CRAS
HES
Madison County Crashes With Serious Injuries and Percent Change Annually
16
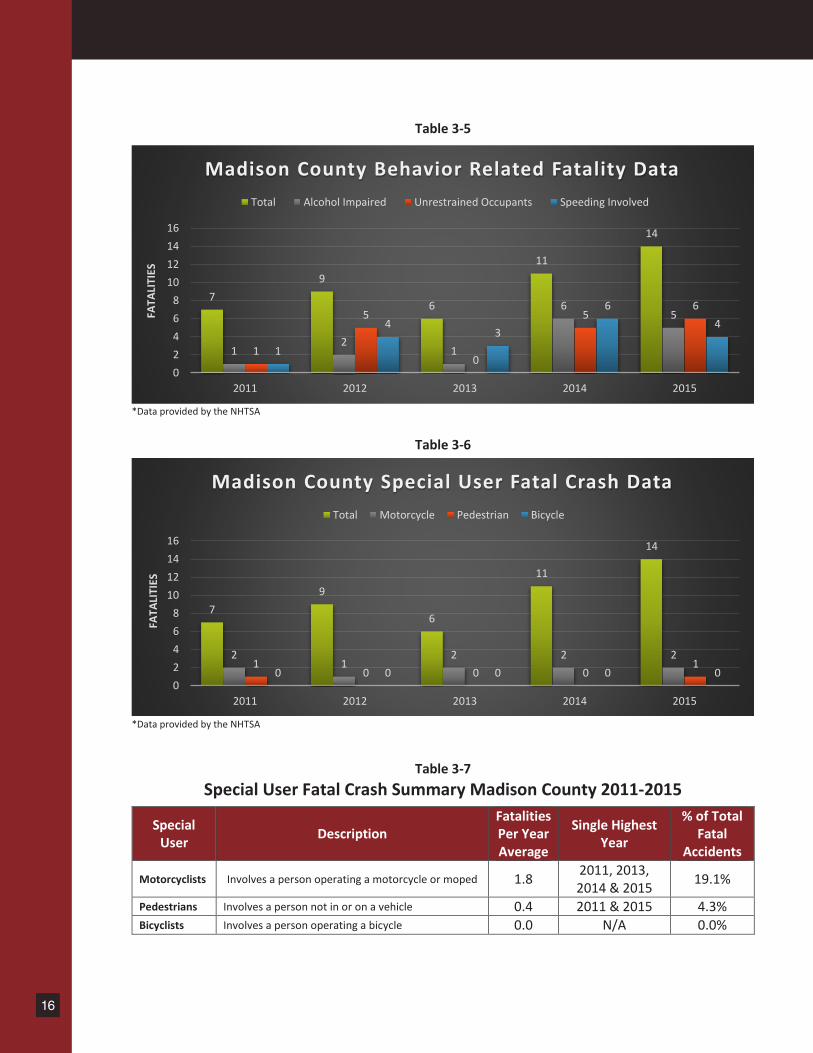
Table 3-5
*Data provided by the NHTSA
Table 3-6
*Data provided by the NHTSA
Table 3-7 Special User Fatal Crash Summary Madison County 2011-2015
Special User Description
Fatalities Per Year Average
Single Highest Year
% of Total Fatal
Accidents
Motorcyclists Involves a person operating a motorcycle or moped 1.8 2011, 2013, 2014 & 2015 19.1%
Pedestrians Involves a person not in or on a vehicle 0.4 2011 & 2015 4.3% Bicyclists Involves a person operating a bicycle 0.0 N/A 0.0%
79
6
11
14
12
1
65
1
5
0
56
1
43
64
02468
10121416
2011 2012 2013 2014 2015
FATA
LITIE
S
Madison County Behavior Related Fatality DataTotal Alcohol Impaired Unrestrained Occupants Speeding Involved
79
6
11
14
21
2 2 21
0 0 01
0 0 0 0 002468
10121416
2011 2012 2013 2014 2015
FATA
LITIE
S
Madison County Special User Fatal Crash DataTotal Motorcycle Pedestrian Bicycle
17
Table 3-5
*Data provided by the NHTSA
Table 3-6
*Data provided by the NHTSA
Table 3-7 Special User Fatal Crash Summary Madison County 2011-2015
Special User Description
Fatalities Per Year Average
Single Highest Year
% of Total Fatal
Accidents
Motorcyclists Involves a person operating a motorcycle or moped 1.8 2011, 2013, 2014 & 2015 19.1%
Pedestrians Involves a person not in or on a vehicle 0.4 2011 & 2015 4.3% Bicyclists Involves a person operating a bicycle 0.0 N/A 0.0%
79
6
11
14
12
1
65
1
5
0
56
1
43
64
02468
10121416
2011 2012 2013 2014 2015
FATA
LITIE
S
Madison County Behavior Related Fatality DataTotal Alcohol Impaired Unrestrained Occupants Speeding Involved
79
6
11
14
21
2 2 21
0 0 01
0 0 0 0 002468
10121416
2011 2012 2013 2014 2015
FATA
LITIE
S
Madison County Special User Fatal Crash DataTotal Motorcycle Pedestrian Bicycle
Table 3-8 Highest Crash Occurrences by
Hour of Day in Madison County Percentage of Total Crashes
TOTAL 47.1% *Data provided by the MDOT and the MDPS
*Example of guardrail
General Crash Statistics for Madison County
80.0% of all crashes in Madison County occurred under dry conditions 72.8% of all crashes occurred under daylight conditions 49.3% of all crashes occurred at intersections 47.56% of intersection crashes are rear end stop or slow
18
Rankin County Based on the 2010 Census, Rankin County’s total population within the MPO Planning Area is 133,881 which is roughly 29% of the Jackson MPO Planning Area’s total population. However, Rankin County has 28.0% of the total crashes, 33.9% of crashes with serious injuries and 30.3% of the MPO’s fatalities that are a result of traffic crashes. For the past five years the amount of crashes in Rankin County has increased by 1,030 or 25.5% (See Table 4-1). During that same time period the annual vehicle miles traveled increased by just over 98,000 or 5.2% (See Table 4-2).
Table 4-1
*Data provided by the Mississippi Department of Transportation (MDOT) and the Mississippi Department of Public Safety (MDPS)
Table 4-2
*Data provided by the MDOT
3.5%12.9% -2.7% 5.9%
3,911 4,048 4,572 4,448 4,710
0
1,000
2,000
3,000
4,000
5,000
2011 2012 2013 2014 2015
CRAS
HES
Rankin County Total Crashes and Percent Change Annually
-1.9%
5.6%
-1.8%
3.4%
1,885.791,850.83
1,954.261,919.68
1,984.00
1,750.00
1,800.00
1,850.00
1,900.00
1,950.00
2,000.00
2011 2012 2013 2014 2015
MILL
ION
VEHI
CLE
MILE
S TRA
VELE
D
Rankin County Vehicle Miles Traveled and Percent Change Annually
19
The top five causes of crashes in Rankin County make up 84.3% of all crashes types in the county while 44.3% of all crashes involve automobiles being rear ended while moving slowly or at a complete stop.
Table 4-3
*Data provided by the National Highway Traffic Safety Administration (NHTSA)
Table 4-4
*Data provided by the MDOT and the MDPS
Most Common Crash Types in Rankin County
Rear End 44.3%
Angle 16.9%
Sideswipe 10.0%
Run Off Road – Right 7.4%
Left turn same roadway 5.7%
37.5% -4.5%-14.3%
-11.1%
1622 21
18 16
0
5
10
15
20
25
2011 2012 2013 2014 2015
FATA
LITIE
S
Rankin County Total Traffic Fatalities and Percent Change Annually
-4.8%
-30.0% 0.0%
50.0%
21 2014 14
21
0
5
10
15
20
25
2011 2012 2013 2014 2015
CRAS
HES
Rankin County Crashes with Serious Injuries and Percent Change Annually
20
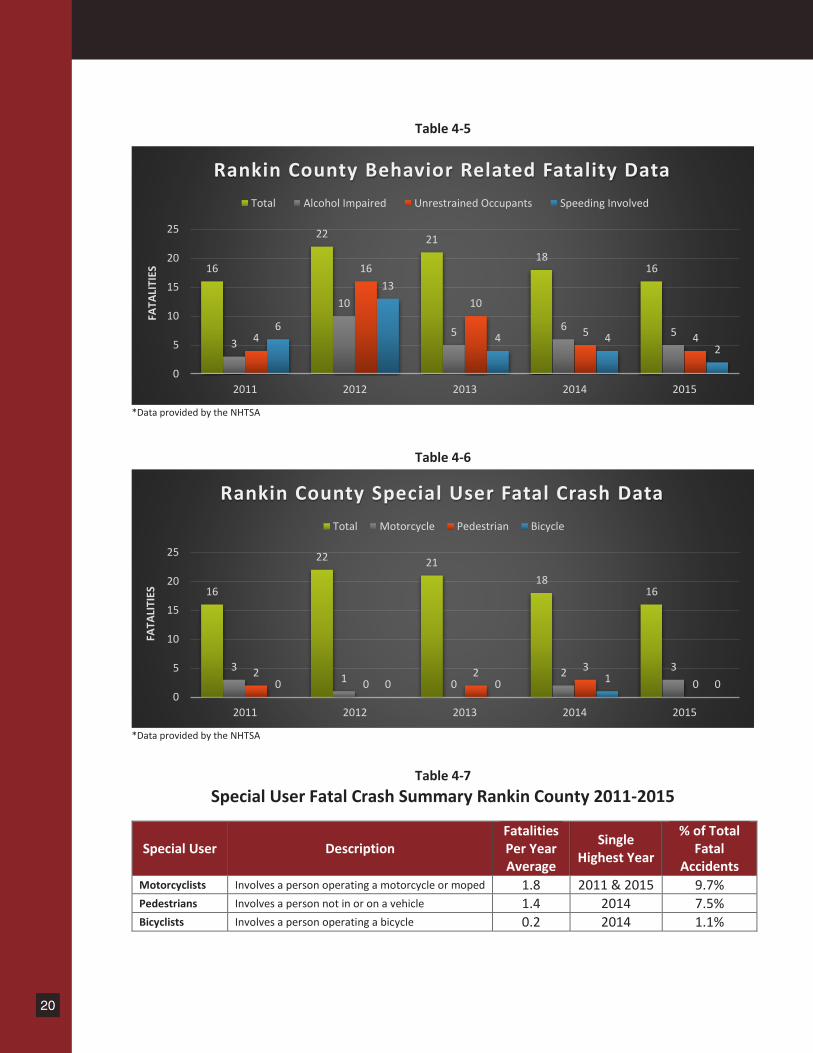
Table 4-5
*Data provided by the NHTSA
Table 4-6
*Data provided by the NHTSA
Table 4-7 Special User Fatal Crash Summary Rankin County 2011-2015
Special User Description Fatalities Per Year Average
Single Highest Year
% of Total Fatal
Accidents Motorcyclists Involves a person operating a motorcycle or moped 1.8 2011 & 2015 9.7% Pedestrians Involves a person not in or on a vehicle 1.4 2014 7.5% Bicyclists Involves a person operating a bicycle 0.2 2014 1.1%
16
22 2118
16
3
10
5 6 54
16
10
5 46
13
4 42
0
5
10
15
20
25
2011 2012 2013 2014 2015
FATA
LITIE
S
Rankin County Behavior Related Fatality DataTotal Alcohol Impaired Unrestrained Occupants Speeding Involved
16
22 2118
16
31 0
2 320
2 300 0 0 1 0
0
5
10
15
20
25
2011 2012 2013 2014 2015
FATA
LITIE
S
Rankin County Special User Fatal Crash DataTotal Motorcycle Pedestrian Bicycle
21
Table 4-5
*Data provided by the NHTSA
Table 4-6
*Data provided by the NHTSA
Table 4-7 Special User Fatal Crash Summary Rankin County 2011-2015
Special User Description Fatalities Per Year Average
Single Highest Year
% of Total Fatal
Accidents Motorcyclists Involves a person operating a motorcycle or moped 1.8 2011 & 2015 9.7% Pedestrians Involves a person not in or on a vehicle 1.4 2014 7.5% Bicyclists Involves a person operating a bicycle 0.2 2014 1.1%
16
22 2118
16
3
10
5 6 54
16
10
5 46
13
4 42
0
5
10
15
20
25
2011 2012 2013 2014 2015
FATA
LITIE
S
Rankin County Behavior Related Fatality DataTotal Alcohol Impaired Unrestrained Occupants Speeding Involved
16
22 2118
16
31 0
2 320
2 300 0 0 1 0
0
5
10
15
20
25
2011 2012 2013 2014 2015
FATA
LITIE
S
Rankin County Special User Fatal Crash DataTotal Motorcycle Pedestrian Bicycle
Table 4-8
*Data provided by the MDOT and the MDPS
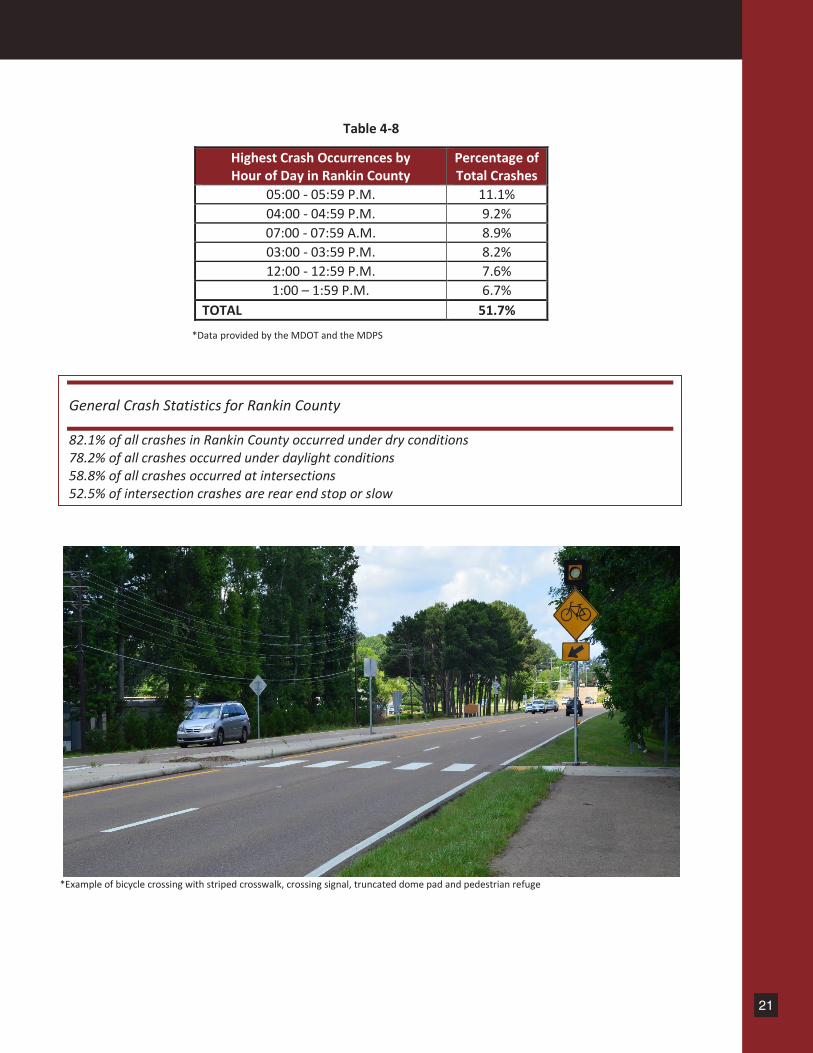
*Example of bicycle crossing with striped crosswalk, crossing signal, truncated dome pad and pedestrian refuge
Highest Crash Occurrences by Hour of Day in Rankin County
82.1% of all crashes in Rankin County occurred under dry conditions 78.2% of all crashes occurred under daylight conditions 58.8% of all crashes occurred at intersections 52.5% of intersection crashes are rear end stop or slow
22
Resources Mississippi Department of Transportation (MDOT) – Mississippi Strategic Highway Safety Plan (SHSP)
Mississippi Department of Transportation (MDOT) – Safety Analysis Management System (SAMS)
Mississippi Department of Public Safety (MDPS) – Mississippi Traffic Safety Data Book - 2014
Federal Highway Administration (FHWA)
National Highway Traffic Safety Administration (NHTSA)
Mississippi Office of Highway Safety (MOHS)
Central Mississippi Planningand Development District