1 UNITED STATES ENVIRONMENTAL PROTECTION AGENCY * f REGION II JACOB K. JAV1TS FEDERAL BUILDING J|j4| -a M~~ NEW YORK. NEW YORK 1O278 To All Interested Parties: The U.S. Environmental Protection Agency (EPA) released a Review Copy of the Phase 2 Work Plan for the Hudson River PCBs site Reassessment RI/FS on June 5, 1992. The work plan describes the work that EPA is planning to conduct during this phase of the study. Within the review copy, there are several item;, that may be misleading or confusing to reviewers of the document and therefore, EPA has prepared this errata sheet. Please note the following changes to the Review Copy of the Phase 2 Work Plan: 1. p. 2-1, last paragraph - EPA is not planning to do any groundwater or air monitoring during the Phase 2 work effort. Please delete the reference to such work. 2. p. 3-6, first full paragraph - EPA does not expect to conduct any total water column analysis using 1-liter samples by NYSDEC methods, as had been proposed in the Phase 2A Sampling Plan. Instead, the techniques to be used for suspended matter and dissolved phase PCB congener-specific analyses will provide EPA with total water column information. 3. p. 4-3, 4.2.2 - EPA does not intend to conduct groundwater sampling for congener-specific data at the Hudson Falls GE plant as part of the Phase 2 work effort. 4. p. 6-1, first paragraph - EPA does not intend to collect air monitoring data as part of the Phase 2 work effort. 5. p. 8-4, 8.4.2 - At this time, EPA does not intend to conduct any bench or laboratory scale treatability studies during the Reassessment process. 6. p. A-9, third bullet - As stated above, EPA does not plan to analyze a subset of water column samples by NYSDEC methods using 1-liter samples. This reference should be deleted. 7. p. A-18, Table A.1.1 - As stated above, EPA is not planning to conduct total water column analysis using 1-liter samples as analyzed by NYSDEC methods. The references to such sampling on this table should be deleted. 312076 PRINTED ON RECYCLED PAPER
Transcript
1 UNITED STATES ENVIRONMENTAL PROTECTION AGENCY*f REGION II
JACOB K. JAV1TS FEDERAL BUILDING
J|j4| -a M~~ NEW YORK. NEW YORK 1O278
To All Interested Parties:
The U.S. Environmental Protection Agency (EPA) released a ReviewCopy of the Phase 2 Work Plan for the Hudson River PCBs siteReassessment RI/FS on June 5, 1992. The work plan describes thework that EPA is planning to conduct during this phase of thestudy. Within the review copy, there are several item;, that maybe misleading or confusing to reviewers of the document andtherefore, EPA has prepared this errata sheet.
Please note the following changes to the Review Copy of thePhase 2 Work Plan:
1. p. 2-1, last paragraph - EPA is not planning to do anygroundwater or air monitoring during the Phase 2 work effort.Please delete the reference to such work.
2. p. 3-6, first full paragraph - EPA does not expect to conductany total water column analysis using 1-liter samples by NYSDECmethods, as had been proposed in the Phase 2A Sampling Plan.Instead, the techniques to be used for suspended matter anddissolved phase PCB congener-specific analyses will provide EPAwith total water column information.
3. p. 4-3, 4.2.2 - EPA does not intend to conduct groundwatersampling for congener-specific data at the Hudson Falls GE plantas part of the Phase 2 work effort.
4. p. 6-1, first paragraph - EPA does not intend to collect airmonitoring data as part of the Phase 2 work effort.
5. p. 8-4, 8.4.2 - At this time, EPA does not intend to conductany bench or laboratory scale treatability studies during theReassessment process.
6. p. A-9, third bullet - As stated above, EPA does not plan toanalyze a subset of water column samples by NYSDEC methods using1-liter samples. This reference should be deleted.
7. p. A-18, Table A.1.1 - As stated above, EPA is not planningto conduct total water column analysis using 1-liter samples asanalyzed by NYSDEC methods. The references to such sampling onthis table should be deleted.
312076PRINTED ON RECYCLED PAPER
Please note these corrections while reviewing and commenting onthe Phase 2 Work Plan. EPA still requests that all comments onthe work plan be submitted by July 10, 1992.
If you have any questions specific to these revisions, pleasefeel free to contact me at (212) 264-7508.
Sincerely yours,
*
Douglas J. Tomchuk, Project ManagerHudson River PCBs Site Reassessment
312077
PHASE 2 WORK PLAN ANDSAMPLING PLAN - REVIEW COPY
HUDSON RIVER PCB REASSESSMENT RI/FS
ERA WORK ASSIGNMENT NO. 013-2N84
JUNE 1992
Region II
ALTERNATIVE REMEDIAL CONTRACTING STRATEGY (ARCS)FOR
HAZARDOUS WASTE REMEDIAL SERVICES
ERA Contract No. 68-S9-2001
TAMS Consultants, Inc.and
Corporation
312078
PHASE 2 WORK PLAN ANDSAMPLING PLAN - REVIEW COPY
HUDSON RIVER PCB REASSESSMENT RI/FS
ERA WORK ASSIGNMENT NO. 013-2N84
JUNE 1992
Region II
ALTERNATIVE REMEDIAL CONTRACTING STRATEGY (ARCS)FOR
HAZARDOUS WASTE REMEDIAL SERVICES
EPA Contract No. 68-S9-2001
TAMS Consultants, Inc.and
Corporation
312079
PAGE INTENTIONALLY LEFT BLANK
312080
PHASE 2 WORK PLAN
AND SAMPLING PLAN - REVIEW COPY
HUDSON RIVER PCB REASSESSMENT RI/FS
PHASE 2 WORK PLAN CONTENTS
PAGE
1. INTRODUCTION 1-1
1.1 Background 1-1
1.2 Objective and Scope 1-2
2. OVERVIEW OF DATA COLLECTION PROGRAM FOR PHASE 2 2-1
2.1 Summary of the Four Main Data Collection Tasks 2-22.1.1 Congener-Specific Analysis of PCBs 2-2
2.1.2 Water-Column Sampling 2-2
2.1.3 High and Low Resolution Sediment Coring 2-3
2.1.4 Geophysical Surveying and Confirmatory 2-3Sampling
2.2 Data Collection By Study Area 2-4
2.2.1 Study Area A: Fenimore Bridge to Upstream 2-4(RM 209) of Glens Falls
2.2.2 Study Area B: Federal Dam to Fenimore 2-5Bridge
2.2.2.1 Main Data Collection Tasks 2-5
2.2.2.2 Kriging of Sediment Data from 2-9Thompson Island Pool
2.2.2.3 Other Data Collection Tasks 2-102.2.3 Study Area C: RM 55 to Federal Dam 2-10
2.2.4 Study Area D: Battery to RM 55 2-11
i
312081
REVIEW COPYPHASE 2 WORK PLAN CONTENTS
(continued)
PAGE
3. MAIN DATA COLLECTION TASKS 3-1
3.1 Congener-Specific Analysis of PCBs 3-1
3.2 Water-Column Sampling and Analysis 3-2
3.2.1 Transect Sampling 3-3
3.2.2 PCB Equilibrium Study 3-6
3.2.3 Flow-averaged Sampling 3-8
3.2.4 Analysis of Historic Samples 3-10
3.3 Sediment Coring and Analysis 3-11
3.3.1 High Resolution Coring 3-12
3.3.2 Analysis of Archived Sediment Extracts 3-16
3.3.3 Low Resolution Coring 3-18
3.3.4 Confirmatory Sediment Sampling 3-19
3.4 Geophysical Surveying 3-19
4. UPDATE OF TANS/GRADIENT DATABASE 4-1
4.1 Computer Database 4-14.1.1 Historic Data in STORET Database 4-1
4.1.2 GE Remnant Deposit Monitoring Data and HRRS 4-2Data
4.1.3 USGS Water Column Monitoring 4-2
4.1.4 NYSDEC Fish Data 4-3
ii
312082
REVIEW COPYPHASE 2 WORK PLAN CONTENTS
(continued)
PAGE
4.2 Other Data Sources 4-3
4.2.1 Point Source Data 4-3
4.2.2 Other Current RI/FS Investigations 4-34.2.3 Dredge Spoil Disposal Sites 4-4
5. CONTAMINANT FATE AND TRANSPORT ANALYSIS 5-1
5.1 Component 1 - PCB Mass Balance Analysis 5-3
5.1.1 General Concept and Level of Detail 5-35.1.2 Input from Sediments 5-45.1.3 Suspended Sediment/Doc/Water Partitioning 5-6
5.1.4 Evaluation of Degradation and Volatilization 5-7Rates
5.1.5 Uncertainty Analysis 5-9
5.2 Component 2 - Biotic Effects/Fish Population Response 5-9
5.2.1 Food Web Model Approach 5-105.2.2 Equilibrium BAF Approach 5-11
5.2.3 Correlation Analysis Approach 5-15
5.3 Component 3 - Erodibility Analysis 5-17
5.3.1 Hydraulic Studies 5-18
5.3.2 Sediment Erodibility 5-19
iii
312083
REVIEW COPYPHASE 2 WORK PLAN CONTENTS
(continued)
PAGE
6. BASELINE HUNAN HEALTH RISK ASSESSNENT 6-1
6.1 Study Area B 6-1
6.1.1 Exposure Assessment 6-1
6.1.1.1 Fish Consumption 6-1
6.1.1.2 Exposure Point Concentrations 6-2in Fish
6.1.1.3 Uncertainty Analysis 6-2
6.1.2 Toxicity Assessment 6-3
6.1.2.1 Carcinogenic Toxicity 6-3
6.1.2.2 Non-Cancer Toxicity 6-4
6.2 Study Area C 6-4
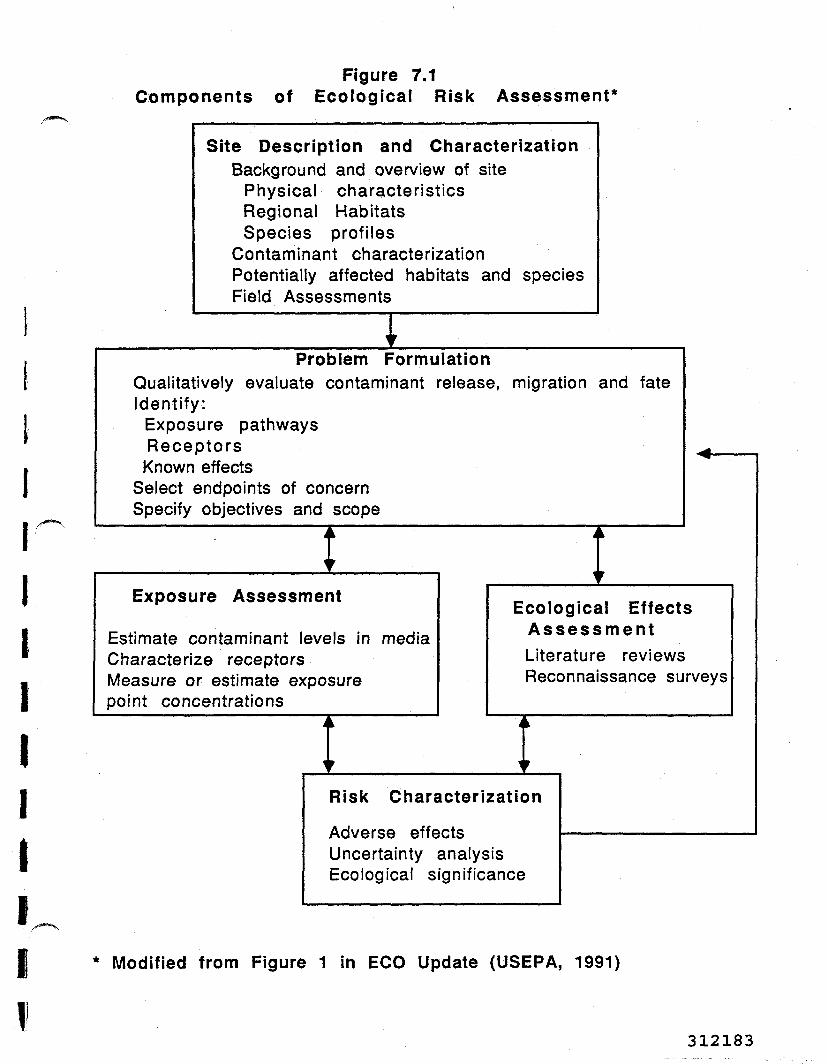
7. BASELINE ECOLOGICAL RISK ASSESSMENT 7-1
7.1 Ecological Study Area Description and Characterization 7-3
7.2 Problem Formulation 7-37.3 Exposure Assessment 7-4
7.4 Ecological Effects Assessment 7-5
7.5 Risk Characterization 7-5
8. FEASIBILITY STUDY ANALYSES 8-1
8.1 Sediment Volumes and Areas 8-1
8.2 Technology and Process Option Screening 8-1
312084
REVIEW COPYPHASE 2 WORK PLAN CONTENTS
(continued)
8.3
8.4
Identification and Evaluation of Technology ProcessOptionsTreatability Study Literature Assessment8.4.1 In Situ Remediation
8.5
8.4.2
Sediment Disturbance Impact Assessment
Thermal/Chemical/Physical SedimentTreatment Systems
PAGE
8-2
8-3
8-3
8-4
8-5
Phase 2 'dork Plan Figures and Tables
PAGE
Figure 2.1 Upper Hudson River Study Areas A and B
Figure 2.2 Lower Hudson River Study Areas C and DFigure 2.3 Proposed Water Column Monitoring StationsFigure 2.4 Proposed High Resolution Coring Locations
for the Upper HudsonFigure 2.5 Historic High Resolution Coring Locations
in the Upper Hudson
Figure 2.6 Anticipated Low Resolution Coring Areafor the Upper Hudson
Figure 2.7 Proposed High Resolution Coring Locationsfor the Lower Hudson
Follows Page 2-14
Follows Figure 2.1
Follows Figure 2.2
Follows Figure 2.3
Follows Figure 2.4
Follows Figure 2.5
Follows Figure 2.6
312085
REVIEW COPYPhase 2 Work Plan Figures and Tables
(continued)
Figure 2.8 Historic High Resolution Coring Locationsin the Lower Hudson
PAGE
Follows Figure 2.7
Figure 3.1 Homolog Content of Some Standard AroclorsFigure 3.2 A Comparison of the Homolog Ratios in
Total PCBs Across the Thompson Island Pool
Figure 3.3 A Comparison of Homolog Mixtures
Figure 3.4 Variation in the Homolog Distributionat the Thompson Island Dam With Time
Figure 3.5 Comparison of Suspended Matter PackedColumn Peak Results From Mechanicville, NY
Figure 3.6 Total PCB Levels in the Hudson River
Figure 3,7 Radionuclide Input to the Hudson Basin
Figure 3.8 Cesium-137 and Total PCBs in a CoreFrom RM 88.6 By Depth
Figure 3.9 Cesium-137 and Total PCBs in a CoreFrom RM 88.6 By Approximate Year ofDeposition
Follows Page 3-20Follows Figure 3.1
Follows Figure 3.2
Follows Figure 3.3
Follows Figure 3.4
Follows Figure 3.5
Follows Figure 3.6
Follows Figure 3.7
Follows Figure 3.8
Table 5.1 Summary of Critical Stress Formulaefor Cohesive Sediment
Figure 5.1 Schematic PCB Mass Balance Model
Figure 5.2 Total PCBs - Yearling Pumpkinseed vs. SummerConcentrations in Water at Stillwater
Figure 5.3 PCB Mass Transport: Corrected Mean MethodEstimates
Follows Page 5-21
Follows Table 5.1
Follows Figure 5.1
Follows Figure 5.2
Figure 7.1 Components of Ecological Risk Assessment Follows Page 7-7
vi
312086
APPENDIXPHASE 2 SAMPLING PLAN CONTENTS
PAGE
A.I Introduction A-l
A.2 Phase 2A Sampling A-2
A.2.1 Establishment of Control Points for A-2Precision Navigation
A.2.2 Geophysical Surveys From The Bakers A-2Falls Pool to the Lock 4 Dam
A.2.2.1 Bakers Falls Pool to River A-3Mile 182
A.2.2.2 Upper Hudson River From River A-5Mile 182 to the Lock 4 Dam
A.2.3 Confirmatory Sampling for Calibration of A-5Geophysical Survey
A.2.4 High Resolution Coring A-6
A.2.5 Water Column Monitoring From Glens A-8Falls to Waterford
A.3 Phase 2B Sampling A-ll
A.3.1 Flow-Averaged Water Column Sampling A-llA.3.2 Analysis of Archived Water Column A-13
Samples on a Congener-Specific BasisA.3.3 Low Resolution Coring of Upper Hudson A-13
Sediments
A.3.4 Sediment Critical Shear Stress Analysis A-15A.3.5 Assessment of In Situ Degradation A-15A.3.6 Reconnaissance Survey A-16
vii
312087
Table A.1.1
Table A.1.2
Figure A.2.1
Figure A.2.2
Figure A.2.3
Figure A.2.4
Figure A.3.1
Figure A.3.2
Figure A.3.3
Figure A.3.4
Plate A.I
Sampling Plan Table, Plates and Figures
Summary of Phase 2A Analytical Program
Summary of Phase 2B Analytical Program
Schematic of Proposed GeophysicalSurvey Grid
Proposed High Resolution CoringLocations for the Lower Hudson
Proposed High Resolution CoringLocations for the Upper Hudson
Proposed Water Column MonitoringStations
Anticipated Low Resolution CoringArea for the Upper HudsonCritical Shear Stress MeasurementSystemHistoric High Resolution CoringLocations in the Lower Hudson
Historic High Resolution CoringLocations in the Upper Hudson
PHASE 2 WORK PLANHUDSON RIVER PCB REASSESSMENT RI/FS
1. INTRODUCTION
1.1 Background
This document describes the work to be performed in Phase 2 of theHudson River PCB Reassessment Remedial Investigation/Feasibility Study (RI/FS).The Hudson River PCB Superfund site extends from Hudson Falls in Warren County,New York to the Battery in New York City. USEPA's previous Feasibility Study(FS), the 1984 No Action Record of Decision for contaminated river sediments andreasons for this Reassessment are described in the Introduction to the Phase 1Report for this Reassessment. As was the case in the 1984 FS and ROD, the scopeof potential remedial activities for this Reassessment is limited to the PCB-contaminated Hudson River sediments between Hudson Falls and Federal Dam at Troy.
In January 1991 USEPA issued a Phase 1 Work Plan describing theactivities to be performed in that phase. In August 1991, USEPA issued a Phase1 Report, entitled Interim Characterization and Evaluation, which described theresults of Phase 1 studies. The findings presented in the Phase 1 Report arebased on analysis of approximately 30,000 records of sediments, water, fish andother data, compiled from numerous sources. The purpose of the Phase 1 analysiswas to:
• provide an interim evaluation, based on existing informationconcerning current levels of PCBs in various media of concernin the river, and changes in these levels;
• provide a preliminary or interim assessment of risks to humanhealth and the environment posed by PCBs in the river; and
• provide the basis for assessing the needs for further samplingand analysis in Phase 2.
1-1 fWS/Gradient
312089
In September 1991, USEPA issued a Phase 2A Sampling Plan. The Phase2A work began in December 1991 and is continuing. The complete Phase 2A effortis described in this document, as it is part of the Phase 2 work.
It is USEPA's continuing goal since this Reassessment commenced tosolicit information and provide feedback to the public through a CommunityInteraction Program (CIP), CIP participants and committees have provided writtenand verbal comments on the Phase 1 Work Plan and Phase 1 Report, and the Scienceand Technical Committee discussed the Phase 2A Sampling Plan. These comments areappreciated; they were reviewed and considered and in several cases wereinstrumental in developing this Phase 2 Work Plan.
1.2 Objective and Scope
The overall objective of Phase 2 is to complete the site character-ization for the Reassessment RI/FS. This will be accomplished by obtaininginformation relating to the nature and extent of the PCB contamination in theriver sediments as described below in Section 2, identifying sources of PCBs tothe sediments and other media also to the extent described later in this WorkPlan, and developing an understanding of the fate and transport of PCBs in theriver system. This information will be utilized to prepare the baseline humanhealth risk assessment and the baseline ecological risk assessment. The resultsof Phase 2 activities will also be used in Phase 3 to define and evaluateremedial alternatives. The Phase 2 effort will culminate in a Phase 2 Report,similar in format to that of the Phase 1 Report.
This document contains two Phase 2 plans: the Phase 2 Work Plan andthe Phase 2 Sampling Plan. The Phase 2 Work Plan follows this Introduction asSections 2 through 8. It describes field investigations and scientific/engineer-ing analyses that will be conducted during Phase 2. The Sampling Plan, containedin Appendix A, describes with more specificity than the Work Plan itself,sampling techniques, locations, and number of samples proposed for Phase 2 fieldinvestigations.
1-2 TAMS/Gnwffenr
312090
The Phase 2 Sampling Plan (Appendix A) distinguishes between fieldstudies for Phase 2A and those for Phase 2B whereas the Work Plan does notdistinguish between phases. The description of Phase 2A in Appendix Aincorporates modifications to the Phase 2A Sampling Plan. The description ofPhase 2B sampling includes field and laboratory studies that will commencefollowing approval of this document and related documents, e.g., Health andSafety Plan, Sampling and Analysis Plan and Quality Assurance Project Plan.
The Reassessment requires knowledge of the source areas of PCBs andthe future impact of PCBs in the Hudson River system under conditions of NoAction and various remedial alternatives. In the Phase 1 Report it wasdetermined that human health risks from Hudson River PCBs are caused primarilyby the consumption of contaminated fish. Therefore, two of the major questionsthat the Reassessment will address are: what is the reduction in PCB levels whichis necessary to decrease fish tissue concentrations to levels that meet humanhealth criteria and; the ancillary question of which source areas, if any, mayrequire remediation in order to achieve that reduction. The effort in Phase 2will focus on obtaining the information necessary to answer these questions amongothers. EPA will utilize this information in Phase 3 to select the mostappropriate remedial alternative based upon this information, in light of therequirements of CERCLA and the National Contingency Plan (NCP).
1-3 TAMS/Gradient
312091
PAGE INTENTIONALLY LEFT BLANK
1-4 TAMS/G/adfe/tf
312092
2. OVERVIEW OF DATA COLLECTION PROGRAM FOR PHASE 2
This section presents an overview of Phase 2 data collection tasksand a summary of these activities by geographic study areas. This section isintended for those readers interested in an overview of proposed Phase 2 efforts.Additional discussion of these tasks occurs in Section 3 and in Appendix A.
The Hudson River PCB Superfund site extends from Hudson Falls, NY atRiver Mile (RM) 197 to the Battery at RM 0. Because of the site's size, threestudy areas have been defined, as well as one additional study area immediatelynorth of the site. The four study areas, shown in Figures 2.1 and 2.2, are:
• Study Area A - The Hudson River above Fenimore Bridge inHudson Falls, NY (RM 197) to upstream (RM 209) of Glens Falls,NY;
• Study Area B - The Hudson River from Fenimore Bridge in HudsonFalls, NY to the Federal Dam at Troy (RM 153);
• Study Area C - The northern, freshwater portion of the tidalHudson River, extending from the Federal Dam (RM 153) to RM55, the average northernmost extent of salt water; and
• Study Area D - The brackish portion of the tidal Hudson River,extending from the average northernmost extent of salt water(RM 55) to the Battery (RM 0).
The Phase 2 data collection program includes many specialized tasksinvolving PCB-congener analyses, geophysical surveys, water and sedimentsampling, groundwater and air sampling and ecological studies. Four main datatasks comprise most of the Phase 2 data collection activities. These tasks arebriefly described first in Section 2.1. Section 2.2 presents the specific datacollection tasks proposed for each study area.
2-1
312093
2.1 Summary of the Four Main Data Collection Tasks
2.1.1 Congener-Specific Analysis of PCBs
Analyses of PCBs have been reported historically on an Aroclor basis(Aroclors are commercial mixtures of PCBs.) This analytical approach has becomequestionable, because Aroclor mixtures released to the environment do not remainthere unaltered. To estimate the effects of processes that alter Aroclormixtures, /.e., absorption, volatilization, oxidation and biodegradation, it willbe necessary to perform congener-specific PCB analyses for all media sampled inPhase 2. The term congener refers to the 209 individual compounds classified asPCBs. Congener-specific analysis can be used to differentiate newly releasedAroclor mixtures from older, altered mixtures. It is expected that a maximum of70 to 80 congeners will be classified in this study, because of calibrationstandard limitations.
2.1.2 Water-Column Sampling
Water-column sampling, to be performed in Study Areas A and B,entails collection of samples to identify sources of PCB loads in the watercolumn. One sampling approach will involve the collection of water-columnsamples at 10 locations in Study Areas A and B. The other sampling approach willinvolve the collection of flow-averaged water-column sample composites. Flow-averaged samples will be collected at a limited number of stations in the UpperHudson to examine the mean PCB loading generated across several important reachesof the river. All samples will be separated into suspended matter and dissolvedphase fractions for analysis. Other pertinent parameters will be measured aswell. Samples will also be collected to study PCB suspended matter-dissolvedphase equilibrium. Archival extracts of water-column samples taken during theperiod 1977 to 1986 from the Lamont-Doherty Geological Observatory and RenssalaerPolytechnic Institute will be reanalyzed to examine historic water-column PCBlevels on the same basis as the current samples.
2-2 TAMS /Gradient
312094
2.1.3 High and Low Resolution Sediment Coring
High resolution sediment coring involves the collection of sedimentcores from depositional zones in all four study areas. These cores are dividedinto thin layers for subsequent PCB congener-specific, radionuclide and otheranalyses. Because sediments are first transported by the water-column assuspended matter, analyses of the radionuclide-dated sediments at depositionallocations can be used to examine historic, water-column PCB transport onsuspended matter. By using data from water-column monitoring and from theliterature, the total water column loading can be examined over time as well.The sediments also record the congener mixture on the suspended matter. Thesedata can be used to examine and fingerprint current and historic PCB sources tothe river and their relative importance. Reanalysis of archived high resolutionsediment core extracts will be compared with current sediment samples to examinein situ degradation.
Low resolution sediment coring involves the collection of sedimentcores in order to determine PCB concentrations in sediment. These cores will bedivided into thick sections for subsequent PCB congener-specific analysis,radionuclide dating, and other analyses. Low resolution sediment coring will beused to examine a limited number of previously defined hot spots in the UpperHudson as well as to classify various sedimentological zones defined on the basisof the geophysical surveys. The samples will assist in defining the depth ofPCB-bearing sediments in Study Area B.
2.1.4 Geophysical Surveying and Confirmatory Sampling
Geophysical surveys will be made of the river bottom in portions ofthe Upper Hudson (Study Area B). These surveys will be made using sonartechniques to map river bathymetry, sediment morphology, sediment texture, andfine grained sediment thicknesses. The sonar results will be calibrated orconfirmed by sediment sampling in the survey areas. Based on the survey resultsmaps of river depth and sediment characteristics will be created. These maps
2-3 IMS/Gradient
312095
will be used in the selection of low resolution coring sites, the estimation ofsediment PCB inventories, the scourability assessment and the Feasibility Study.
2.2 Data Collection Program By Study Area
2.2.1 Study Area A: Fenimore Bridge to Upstream (RH 209) of Glens Falls
Study Area A is defined as the reach of the Hudson River from RM 209(Sherman Island Dam) downstream to Fenimore Bridge at Hudson Falls, NY (seeFigure 2.1). The purpose of delineating a study area above Fenimore Bridge isto identify baseline contaminant inputs to downstream Study Area B. As indicatedin the Phase 1 Report, some release of PCBs may have occurred above FermioreBridge; therefore, it cannot be assumed that river water flowing from Study AreaA is free of contaminants.
The sampling program for Study Area A has been designed to determinecurrent PCB loads entering Study Area B from Study Are* A by sampling the watercolumn upstream of Fenimore Bridge and analyzing the samples for PCBs on acongener-specific basis. Both the water-column transects and the flow-averagedwater sampling will be performed. Historic water column loads of PCBs from StudyArea A to Study Area B will be estimated using data obtained from high resolutionsediment core samples also taken within this study area. Figures 2.3 and 2.4show the water column monitoring and high resolution sediment coring locations,respectively.
In addition to examining the total water column load, the congenercomposition of PCB load in Study Area A will be determined. These data will becompared with downstream congener mixtures to evaluate the importance of PCBsources from Study Area A in downriver areas. Suspended matter/dissolved phasepartitioning data obtained from the water column sampling effort will be used inthe interpretation of the high resolution sediment core samples. The literatureinvestigation will continue in Phase 2 to provide additional data on knownhistoric and current PCB sources, discharges and levels in Study Area A. Thesedata will aid in the interpretation of the Study Area A sample data with the goal
2-4 VMS/Gradient
312096
of estimating current and future sources of PCBs from Study Area A to Study Area
2.2.2 Study Area B: Federal Dam to Fen i more Bridge
Study Area B is defined as the 40 miles of the Upper Hudson beginningat Fenimore Bridge and terminating at the Federal Dam 1n Troy. There are twomajor Hudson tributaries in this reach, the Mohawk and the Hoosic. Althoughthese tributaries are not considered part of the Hudson River site, they may besources of contaminants to the Hudson River.
The principal objective of additional data collection in Study AreaB is to assess the current sources and loads to the area and to evaluate theirimpact within the area as well as on the Lower Hudson (Study Areas C and D).This investigation considers sources and loads under current conditions, as wellas those potentially produced during high flow events. A significant findingfrom Phase 1 is that a large portion of the water column PCB load in Study AreaB appears to enter the river upstream of Rogers Island. Therefore, the datacollection program will focus on parts of the river upstream of Rogers Island,as well as zones of known contamination, such as the Thompson Island Pool.
2.2.2.1 Main Data Collection Tasks
The investigation of Study Area B will include all tasks describedin Section 2.1. The water-column sampling efforts will be conducted to examineconditions under high flow and low flow conditions. (Stations for Study Area Bare shown in Figure 2.3.) The results of the water-column sampling combined withthe flow monitoring data obtained by the US Geological Survey (USGS) will permitthe calculation of PCB water column loads for Study Area B. Estimation of PCBloads passing each sampling location will be used to identify the river segmentscontributing most significantly to those loads. Thus, the water-column studieswill provide an independent confirmation of the relative contribution of theUpper Hudson's sediments to water-column PCB loads. Congener-specific data willprovide assistance in determining potential contaminant sources, since these data
2-5 TAMS /Gradient
312097
will be compared to the congener profile of potential sources. For example, itcan be expected that, in Study Area 6, only sediment-related sources will haveexperienced in situ degradation and, therefore, these sources will yield a watercolumn congener mixture dominated by less chlorinated PCB congeners.
The water-column studies will also address questions related totemporal variability in PCB loads and factors that influence PCB transport. Bothriver flows and PCB loads exhibit strong seasonal variability. It has beenpostulated that PCB transport dominantly occurs during the spring high flowseason when the river's suspended load is high. As flow rates decrease fromspring into summer, both suspended matter and total PCB load diminish. Dataobtained from analysis of suspended and dissolved sample fractions are expectedto permit the examination of temporal variability in water-column PCB load.These data will consequently provide additional insight into the source of water-borne PCBs and the mechanisms influencing contaminant transport. It is importantto note that under nearly all current conditions found in the Hudson, the watercolumn concentrations of PCBs are not limited by the solubility of the congenersbut rather by PCB input and loss rates and by adsorption onto suspendedsediments.
High resolution sediment cores will be obtained at a number of StudyArea B depositional locations using hand coring techniques (see Figure 2.4).Sediment chronology at each coring location will be established using radio-nuclide dating techniques, as described in Section 3.
Because sediment deposited at a specific location is assumed toreflect the composition of suspended matter transported past that point,interpretation of data from the high resolution cores permits identification ofdifferent contaminant sources in current sediment PCB mixtures. Thus, the highresolution program will lend support to results of the water-column studiespreviously described.
In addition to enabling a determination of current, water-column PCBcongener concentrations and contributing sources, the high resolution coring
2-6 TAMS y'Gradient
312098
program will facilitate evaluation of historic PCB levels, loads and sources.These data will be compared to the historic Upper Hudson River, water-columndatabase to obtain a refined estimate of historic, suspended phase PCB loadspassing the coring locations. Using PCB partition data from the Phase 2 datacollection program and the literature, an estimate will also be made of historictotal water-column PCB load. Because In situ PCB degradation may have affectedhigh resolution samples, particular care will be exercised in comparing the data.
A number of archived sediment cores and sediment core extractscollected by previous investigators will be reanalyzed and compared to data fromhigh resolution samples taken during this Phase 2 investigation from the samelocations. Figure 2.5 shows the sampling locations of existing and archived highresolution cores. Archived and Phase 2 sediment sample pairs will be used todetermine in situ degradation rates for PCBs by comparing sediment layers fromthe same time horizon in the paired samples. For example, the layer correspond-ing to 1963 from the archived core will be compared with the 1963 layer from thePhase 2 core. The change in congener composition and concentration divided bythe time between core collection events is expected to yield an estimate of thedegradation rate.
Geophysical measurements, along with confirmatory sampling, willprovide information on river sediment textures, sediment thickness, and rivertopography, so that a plan view of river bottom conditions can be generated.Plate A.I shows the proposed geophysical survey areas. When coupled with othersediment sampling, the geophysical program will provide sufficient data toestimate sediment distribution patterns throughout the most contaminated reachesof Study Area B.
Taken together, the sediment's physical and contamination distribu-tion patterns derived from geophysical measurements and the sampling programsdetailed in this plan constitute much of the basic information needed in Phase2. These data are needed to assess potential PCB sediment sources to the watercolumn, sediment mobility during storm events, operational difficulties likely
2-7 IMS/Gradient
312099
to be associated with sediment removal, and requirements for establishing a long-term monitoring program.
Low resolution sediment coring will be used to examine PCB contamina-tion in a limited number of locations and will allow updating of estimates of thespatial distribution of PCBs to be developed by kriging techniques (see Section2.2.2.2). The low resolution coring program will not be performed on the scaleof NYSDEC'S 1984 effort, but will, instead, be directed at maximizing theinformation that can be extracted from the geophysical surveys, the highresolution coring study and the kriging analysis. Figure 2.6 shows theanticipated locations for low resolution coring.
Some river reaches within Study Area B will be examined intensivelyin order to compare historic and current contaminant levels. Both PCBconcentrations and congener distributions will be examined to determine changesin the sediment inventory over time. In other instances, samples will also belocated so as to examine PCB levels in zones displaying particular geophysicalpatterns as determined from the geophysical investigation. In this ma.iner, itmay be possible to characterize sediment PCB levels extensively without havingto sample intensively. Low resolution coring may also be applied to the BakersFalls Pool and the submerged Remnant Deposit 1, because these locations mayrepresent sources of PCBs to the water-column.
The ultimate use of the low resolution data will be to generateestimates of PCB sediment mass for major zones of contamination. Thisinformation will be used in conjunction with kriging results (see Section 2.2.2.2below), the scourability assessment (Section 5), and other site data to designatePCB contaminated areas potentially subject to scour. Data collected and madeavailable by GE will be included in the evaluation. If appropriate, the GE datawill also be used to estimate which PCB-contaminated sediments represent likelysources of water-column PCBs under average flow conditions.
2-8 TAMS /Gradient
312100
. - 2.2.2.2 Kriging of Sediment Data from Thompson Island Pool
In addition to the main data collection tasks described above,sediment contaminant distribution and mass will be evaluated using geostatisticaltechniques. The 1984 NYSDEC database for the Thompson Island Pool provides theonly basis for a relatively comprehensive assessment of PCB mass distribution inStudy Area B at a particular point in time. Kriging methods, which attempt tofind the minimum variance (most accurate), unbiased estimate of spatiallycorrelated data, will be applied to the 1984 data set with the refinements notedhere.
Although previous attempts to apply gaostatistical analysis to theanalytical data obtained in the 19.84 sediment survey have met with only limitedsuccess,1 available data appear not to have been utilized fully. Most samplescollected in 1984 were first screened by a mass spectrometer; typically, thosetesting high for PCBs were sent for laboratory gas chromatographic (GC) analysis.Thus, the laboratory analyses represent only a fraction of the total data
,„-,. collected. The Phase 2 analysis will use the-screening data as well as the GC• results in the geostatistical analysis. Prior to submission of this Phase 2 Work
Plan, a theoretical approach was developed by TAMS/Gradient to incorporate bothdata sets in the analysis. Preliminary tests of the method on PCB data for thesouthern part of the Thompson Island Pool revealed that the method hassubstantial potential to improve the accuracy of estimation. Also, a shift inthe analysis coordinate system from northing-easting coordinates to a gridaligned with the direction of river flow is expected to improve further thespatial correlation analysis.
Interpretation of estimates of sediment PCB contamination derivedfrom kriging will depend upon how successfully the low resolution cores reproducethe results of the 1984 sediment levels. To the extent that the levels agree,the estimates derived from kriging will be assumed to be good estimates of
^Brown, M.P., M.B. Werner, C.R. Carnsone and M. Klein. 1988. "Distribution and PCBs in the ThompsonIsland Pool and the Hudson River: Final Report of the Hudson River PCB Redamation Demonstration ProjectSediment Survey.* Division of Water, NYSDEC, Albany, NY.
2-9 IMS/Gradient
312101
current conditions in locations where low resolution coring is not performed.To the extent that they do not, then the estimates will not provide a directindication of current sediment levels and additional low resolution coring maybe required.
2.2.2.3 Other Data Collection Tasks
Two other data collection tasks are planned for Study Area B:sampling to assess scourability for contaminant transport modeling (Section 5)and sampling related to the ecological risk assessment (Section 7). These tasksare described/in the referenced sections of this Work Plan and in the Phase 2Sampl ing Flan (Appendix A) .
2.2.3 Study Area C: RM 55 to Federal Dam
Study Area C represents the northern, freshwater portion of theHudson River estuary. The downstream boundary at River Mile 55 was selected,because it is considered to be the average upstream limit of the salt front.
The main objective of the Phase 2 investigation in Study Area C isto evaluate the relative importance of loading from Study Area B to the overallPCB load in Study Area C. An estimate of Upper Hudson PCB loading to the estuarywas provided in the Phase 1 Report. Additional data as previously discussed willbe generated during Phase 2 to update that estimate. Available historic datapoorly accounts for the contribution of the Mohawk River to overall PCB releasesto the estuary; during Phase 2, both water-column samples and a high resolutioncore will be obtained within the Mohawk. Data obtained from these samples willbe used to estimate current and historic PCB loads contributed by the Mohawk tothe Upper Hudson and, in turn, to the estuary.
High resolution coring is the only sampling task scheduled for StudyArea C. High resolution cores to be obtained at several locations within StudyArea C will be analyzed for congener-specific PCBs and a range of otherparameters, which are necessary to evaluate adequately contaminant fate and
2-10
312102
transport. Figure 2.7 shows the high resolution coring locations for StudyArea C. As in Study Areas A and B, the high resolution cores will be used toestimate historic PCB loads passing a particular sampling location. Anassessment of possible sources of the sediment-borne PCBs will be derived fromthe congener-specific profiles of cores collected throughout the length of StudyArea C. Since these cores will be radiometrically dated, a comparison ofcongener profiles in sediments is expected to provide insight as to whether oneupriver source is responsible for the contaminant load or whether multiplesources have contributed to the load.
Archived sediment core sections are also available for historiccoring locations in Area C (see Figure 2.8). These samples will be paired withtheir Phase 2 equivalents to assess in situ degradation in Study Area C.
In addition to Phase 2 sampling, an intensive review of PCB dischargerecords will be conducted to determine the likelihood of other significantreleases to Study Area C. Data research will include discharge permit files(SPDES permits), NYSDEC and NYSDOH records of uncontrolled PCB releases, landfillleachate records, STORE! system water quality data base (for tributary-relatedcontamination), and other information which may be available in local agencyfiles. Once an estimate has been made of the relative importance of currentStudy Area B-derived loads on the total Study Area C PCB burden, it will bepossible to assess the relative impact of remedial alternatives for Study AreaB on Study Area C.
2.2.4 Study Area D: Battery to RN 55
The Hudson River reach covered by Study Area D is the southern partof the estuary. It is defined as a separate study area, because its brackishwater distinguishes it from the typically freshwater part of the estuary.Separating study areas of the estuary at River Mile 55 is also consideredappropriate, because: 1) contaminant discharges from industries in the New YorkCity Metropolitan Area are not expected to migrate upstream of the salt front;
2-11 IMS/Gradient
312103
and 2) the ecosystem and sediment geochemical characteristics upstream of thesalt front are different from those below the salt front.
The focus of investigations in Study Area D will be to establish thesignificance of current PCB releases from the Upper Hudson (Study Area B) to thetotal contaminant burden found within Study Area D by determining the relativeimportance of various PCB inputs from the sediment records and other availablerelease data to the estuary. Once an estimate of the relative burden contributedby various sources has been established, an assessment of the significance ofremedial actions in Study Area B on Study Area D can be made.
A number of sediment cores will be collected within Study,Ares D forpurposes of high resolution analysis (see Figure 2.7). These cores will beanalyzed in the same manner as high resolution samples collected elsewhere in theHudson and the resulting data will be evaluated similarly. Using the suspendedload estimates derived from the high resolution core samples and literature data,total water column PCB concentrations will be computed for current and historicconditions. Since high resolution samples are to be analyzed for PCBs on acongener-specific basis, the historic PCB congener profile will also providesignificant additional insight about sources of the contaminant load. Figure 2.8shows the historic high resolution core locations for Study Area D.
The high resolution core program for Study Area D must be consideredin the context of the total effort described in this plan. Data derived fromsediment cores collected in all four study areas will be needed to evaluate PCBsources and loads within Study Area D. For example, trends in congener patternsobserved in Study Area C samples should continue into samples collected in StudyArea D. Therefore, shifts in congener patterns, for example, from an Aroclor1242 pattern to one representative of a more heavily chlorinated Aroclor, areexpected to be observable when all the high resolution core data are compared.The presence of a discernible congener pattern change from north to south mayimply different sources.
2-12 TAMS /Gradient
312104
A number of analysts have generated estimates of current PCBdischarges to New York Harbor. The Phase 1 Report identified several suchefforts and provided a tabulation of various PCB sources and their magnitudes.In addition, an independent estimate was generated, during Phase 1, of PCB loadscurrently released to the Hudson estuary (Study Area C) from the river aboveFederal Dam (Study Area B). During Phase 2, a projection of long-term PCBloading to the estuary will be formulated, using information derived from thewater column study and the high resolution coring program described earlier inthis plan. The sediment sampling and analysis effort to be conducted within theestuary will provide additional data upon which to base an estimate of therelative importance of various sources of PCBs.
2-13 TAMSI Gradient
312105
PAGE INTENTIONALLY LEFT BLANK
2-14 IMS/Gradient
312106
312107
Hudson River PCB Reassessment RI/FS
Upper Hudson RiverStudy Areas A and B
1AMSmmxam^-AlnuUtnte^^mHm [Figure 2.1
•r;
G R E E N E
Catskilno
«o-f«Troy
S E L A E R
MASSACHUSETTS
STUDY AREAC
CONNECTICUT
STUDY AREAD
#>**
NEW YORKCITY
10
Scale in Miles
Note:
1. Study Area C: Federal Dam to River Mile 55
2. Study Area D: River Mile 55 to The Battery
312108
Hudson River PCB Reassessment RI/FS
Proposed Water ColumnMonitoring Stations
• • i i.
S A B A T O G A C O U N T Y
COI-Jto
W A S H I N G T O NC O U N T Y
STUDY AREAB
S E L A E R C O U N T Y
3 2 1 0
SOU tl UUS
iral^a
Legend(\88) Location of Proposed Core ,_ study Area A; Sherman |s,ond uom to Fenimore Bridge
180 River Mile 2. Study Area B: Fenimore Bridge to Federal Dam
Note:
Note: Mohawk has two proposed core locations near this point.
\Fenimore BridgeGlent !•»->. LI—
S A R A T O G A C O U N T Y
312111
N
I
W A S H I N G T O NC O U N T Y
STUDY AREAB
R E N S S E L A E R C O U N T Y
3 ? ! eSOU H HUS
Note:(g) Locotion of Historic Sediment Core ^ st(jdy Are(j A. Sherman |s|and Dom to Fenimore Bridge
River Mile 2. Study Area B: Fenimore Bridge to Federal Dam
Mohawk has two historic core locations near this point.
312112
STUDY AREAA
I Fenimore Bridge X<#"W A R R E N
a C O U N T YC
Anticipated Low ResolutionCoring Area
W A S H I N G T O NC O U N T Y
S A R A T O G A C O U N T Y
STUDY AREAB
R E J C S S E L A E R C O U N T Y
1. Study Areo A: Shermon Island Dam to Fenimore Bridge
2. Study Area B: Fenimore Bridge to Federal Dam
312113
ALBANY
MASSACHUSETTS
STUDY AREACC O L U M B I A
D U T C H E / S S
CONNECTICUT
STUDY AREAD
R O C K L A N D t f f l
60 ) Location of Proposed Core
100 River Mile 1. Study Area C: Federal Dam to River Mile 55
2. Study Area D: River Mile 55 to The Battery
• I312114
MASSACHUSETTS
[STUDY AREA__C
CONNECTICUT
STUDY AREAD
3eff r'o**
ORK ? 9 ? 1PScale in Miles
Legend
60 ) Location of Historic Sediment Core^~^
100 River Mile
Note:1. Study Area C: Federal Dam to River Mile 55
2. Study Area D: River Mile 55 to The Battery
3. MAIM DATA COLLECTION TASKS
This section presents a detailed discussion of the main datacollection tasks, i.e., congener analyses, water-column sampling, sedimentsampling and geophysical surveys, in order to explain how the data derived fromthese tasks will be specifically utilized for analyses in Phase 2. (Section 2provides an overview of these tasks for the general reader and summarizes datacollection activities by study area.)
3.1 Congener-Specific Analysis of PCBs
As noted in the Phase 1 Report and elsewhere, the nature of PCBcompounds is relatively complex. There are ten homolog groups, varying from oneto ten in the number of chlorine atoms attached to the biphenyl molecule. Withineach homolog group there exists a range of isomers, which vary based on thepositioning of the chlorine atoms around the molecule. The number of isomers perhomolog group varies from one for decachlorobiphenyl to forty-six forpentachlorobiphenyl. Collectively, the isomers are called congeners and referto the 209 individual compounds classified as polychlorinated biphenyls.
The importance of this distinction in PCB classes arises from themeans by which PCBs were produced and eventually released to the environment.PCBs were produced for industrial use as commercial mixtures called Aroclors,which typically contained several homolog groups, each containing many congeners.Analyses of PCBs in the environment have been reported historically on an Aroclorbasis. This analytical approach became questionable, when it became generallyknown that Aroclor mixtures released to the environment did not remain thereunaltered. Instead the mixtures undergo various processes, such as adsorption,volatilization, oxidation and degradation, which alter the present Aroclormixture.
In order to assess the impact of these processes, which vary indegree throughout the Hudson, PCB analyses will be necessary, first on acongener-specific basis. For example, in some cases the variation in congeners
3-1 TAMS /'Gradient
312115
within a single homolog group may be used to define a specific geochemicalprocess. Congener-specific analysis can also be used to differentiate newlyreleased Aroclor mixtures from relatively older, altered congener mixtures.
Congener-specific analyses are proposed for all PCB analyses in Phase2, because of their ability to differentiate fresh Aroclor mixtures from eachother, to separate altered from unaltered mixtures and to differentiate the neteffects of the various geochemical and biodegradation processes. Figure 3.1illustrates the differences among several standard Aroclor mixtures on a homologbasis. Even with these limited 10 basic divisions, differences among themixtures are clear. When congener analyses are applied to environmental samples,these distinct Aroclor signatures plus the alterations as a result of variousprocesses become evident.
In this study, congener-specific analysis is defined to include theseparation of the sample PCB mixtures by gas chromatography into a maximum ofabout 120 peaks (two to three congeners are occasionally represented by a onepeak). Nevertheless, the level of separation to be achieved is sufficient forthe necessary resolution of data.
3.2 Hater-Column Sampling and Analysis
As part of the investigation in Phase 2, a set of water-columnsamples will be collected from the Upper Hudson (Study Areas A and B). Thesesamples will be analyzed for a number of parameters and used to examine bothcurrent PCB loads and geochemical processes affecting those loads.
The data collection program for the water-column consists of fourseparate subtasks:
• Water Column Transects Sampling;• Water Column PCB Equilibratium Study;• Flow-Averaged Water Column Sampling; and• Analysis of Historic Water Column Samples.
3-2 IMS/Gradient
312116
These subtasks are described in Sections 3.2.1, 3.2.2, 3.2.3, and3.2.4.
3.2.1 Transect Sampling
This subtask is designed to collect a series of analytical snap-shots of water column parameters, as a parcel of water travels through the UpperHudson (Study Areas A and B). The transect is defined as a longitudinal seriesof water-column sampling stations in the direction of flow between Glens Fallsand Federal Dam. As a parcel of water travels through these areas, its PCB loadmay change. The purpose of the sampling program is to designate where the PCBload is derived and, once in the water column, how this load is altered ortransferred to the Lower Hudson (Study Areas C and D).
To accomplish the purpose of this subtask, a series of samplingstations will be established to collect samples for the following parameters:
The individual sampling events will be performed so as to follow ina general fashion the same parcel of water as it travels through the UpperHudson. In this manner, changes in the parameters between two successivestations can be measured. Ignoring for the moment geochemical processes,increases in the water-column PCB concentration across a pair of monitoringstations would be interpreted as the result of an additional PCB load originatingin the intervening river section. Decreases in concentration would beinterpreted as the result of dilution by tributary additions or by loss from thewater column. Comparison of the differences in congener mixtures at the two
3-3 TAMS /Gradient
312117
stations would yield information on the nature of the source or the geochemicalprocesses in the intervening river section.
The use of congener-specific data, using preliminary data collectedby General Electric in 1991, is shown in Figure 3.2, which illustrates changesin the water-column homolog mixture between two monitoring points in the UpperHudson on two separate dates. The monitoring points represented are the Route197 Bridge at Fort Edward and the Thompson Island Dam, I.e., the input point andthe output point of the Thompson Island Pool, respectively. The mixture of PCBsin the water-column shifts, as a result of passage through the pool, towardlighter homologs, e.g. the effect 1s more pronounced in May than in April 1991.On the same dates, water-column concentrations increased from Fort Edward to theThompson Island Dam from 16 to 43 ng/L (April 5) and from 12 to 75 ng/L (May 3).A preliminary interpretation of these data suggests that a significant portionof the PCB load on these days was derived from the Thompson Island Pool and thatthe source from the Pool had a significant proportion of mono- anddichlorobiphenyls, unlike any of the known historic releases to the area. Themixture found at Fort Edward appears to be similar to that of Aroclor 1242, asshown in Figure 3.3. It could also be a blend of Aroclor 1242 (80 percent) andAroclor 1254 (20 percent) also shown in Figure 3.3.
The use of congener-specific data can also show the variation oflocal source loadings with time. Figure 3.4, based on GE data, shows variabilityin the congener mixture over time at the Thompson Island Dam, specificallygradual increase in importance of the mono- and dichlorobiphenyls in the loadleaving the pool. The occurrence of In situ biodegradation in the PCBs of theThompson Island Pool would mean that the change in homolog mixture results fromdiffusion of the altered, partially dechlorinated PCBs out of the sediments andinto the water column.
Through collection of information on dissolved and suspended matter,it will be possible to distinguish better among PCB sources. For example, if theThompson Island Pool source of mono- and dichlorobiphenyls is a diffusive one,i.e. PCBs enter the water column in dissolved form, then the distribution of
3-4 TAMS /Gradient
312118
these congener concentrations would shift to the dissolved phase relative to thedissolved-suspended phase equilibrium. Conversely, if these PCBs enter the poolvia scour or resuspension of sediments, then the distribution between dissolvedand suspended matter phases would shift to suspended matter relative toequilibrium. No data are currently available to permit this type of analysis.
The collection of transect samples will permit identification ofthose regions of the river where PCB sources exist and provide information as tothe type or nature of the source. Transect samples also effectively fingerprintthe source by identifying the congener pattern derived from the source, which canthen be traced in downstream reaches.
The measurement of total suspended solids is, however, needed todetermine total PCB flux past any monitoring point. This measurement will becomputed as follows:
Flux = Q x TSS x106 mg
where:Flux = PCB Flux in ng/sQ = Water flow in L/sPCBD1,, = Dissolved phase total PCB concentration in ng/LTSS - Total suspended solids in mg/LPCBSS « Suspended solids total PCB concentration in ng/kg
Measurements of total organic carbon on suspended solids, dissolvedorganic carbon and chlorophyll-a are needed to interpret dissolved-suspendedphase PCB partitioning, because each of these parameters affects equilibriumpartitioning of PCBs in the water column. One or more of these parameters isexpected to correlate with variations in measured dissolved-suspended phase PCBdistributions. Specifically, increases of total organic carbon on suspendedmatter or chlorophyll-a permit a greater fraction of the water-column PCB load
3-5 TAMS /Gradient
312119
to be carried by suspended matter, since these properties would correlate withthe fraction of PCBs adsorbed to particulate matter. Conversely, increases indissolved organic carbon permit a greater fraction of PCBs to exist in thedissolved phase, since the presence of additional dissolved organic carbon wouldhold additional PCBs in solution bound to Dissolved Organic Carbon (DOC).(Herein, the term dissolved phase refers to both dissolved PCBs and PCBs boundto DOC.)
Total water-column PCB analysis will be done in accordance withNYSDEC analytical procedures to provide a tie between the other PCB analyses andstandard NYSDEC results.
The remaining parameters (pH, temperature, conductivity and dissolvedoxygen) are standard water quality parameters. These parameters will bemonitored in the field across water sample locations and within a single samplingcross-section.
3.2.2 PCB Equilibrium Study
This subtask will involve the collection of duplicate water columntransect samples, which will be held for approximately four days prior tofiltration and analysis. The purpose of this subtask is to determine theeffective equilibrium distribution of PCB congeners between dissolved andsuspended matter phases. The basic premise is that PCB equilibration betweenthese phases is not instantaneous in the water column. The samples for thisstudy will be held sufficiently long to permit the system to reach an effectiveequilibrium. By comparing these results to samples that are filtered shortlyafter collection, it will be possible to evaluate the ambient congenerdistribution relative to the equilibrium distribution. The definition ofequilibrium for this system is not necessarily a true thermodynamic one. It isthe point at which little change takes place in the dissolved and suspendedmatter PCB-congener concentrations, i.e. a steady-state end point. In general,this end point appears to be fairly well-defined, based on the relativelyconsistent observed partition coefficients reported in the literature.
3-6 TAMS /Gradient
312120
The differences 1n the PCB-congener distributions at various pointsrelative to equilibrium will be used to define the type of PCB source to theriver and aid in the actual identification. For example, if a sample yields acongener distribution that shows dissolved phase dominance relative toequilibrium, the conclusion would be that the PCB source in the upriver reach waspredominantly a dissolved phase input. Such sources would include PCB diffusionfrom the sediments or a groundwater input. The measured distribution could notbe obtained by sediment scour or a suspended matter input.
Evidence for this lack of equilibrium can be seen in the datacollected on Upper Hudson water column suspended matter in 1983 by Bopp et a7.(1985).1 Their data were derived from eleven sample pairs consisting of a largevolume water sample. One of the pairs was filtered using a glass fiber filter(GFF) several days after collection; the other of the pairs was a large volumefilter (LVF) sample, which was collected in situ by placing a filtering apparatus.directly into the river. The results of one such pair of samples taken atMechanicville, NY are shown in Figure 3.5, showing the packed column peak datafor the samples. Packed column peak analysis separates the congeners intoapproximately 22 peaks and typically yields several congeners for each peak. Ingeneral, the resolution between congeners decreases with increasing peak number.In Figure 3.5, the main peaks represent tri- and tetrachlorobiphenyls, which arethe main components of Aroclor 1242. A clear difference in congener distributionoccurs between the in situ sample (LVF) and the sample held for several days(GFF). This difference in congener pattern was also accompanied by an increasein the total PCB concentration for the peaks shown in the suspended matter on theGFF sample (6.6 mg/kg) relative to the LVF sample (1.25 mg/kg). These resultsplus those of the other sample pairs suggest that PCB inputs upstream ofMechanicville (located between Waterford and Stillwater) in 1983 contained asignificant dissolved phase source and that given sufficient time, the dissolvedPCB would sorb to the suspended matter.
Bopp, R.F., H J. Simpson, and B.L. Deck. 1985. "Release of Polychlorinated Biphenyls from ContaminatedHudson River Sediments.* Final Report NYS C00708 to NYSDEC, Albany, NY. Lamont Doherty GeologicalObservatory of Columbia University, Palisades, NY.
3-7 TAMS /Gradient
312121
Bopp et a7. (1985) note that part of the difference between thesamples may stem from differences in the filters used. The large change in thetotal PCB concentration and the congener pattern, however, would suggest that areal change occurred during sample storage.
Samples for this PCB Equilibrium Study will be collected at 10transect sampling locations, during both a high flow condition and a low flowcondition. These samples should provide equilibrium partition coefficients forthe range of conditions expected in Study Areas A and B.
Dissolved organic carbon will also be measured to evaluate whethermeasured changes in the PCB distribution are related, to changes in thisparameter.
3.2.3 Flow-averaged Sampling
Unlike water-column transects, which are designed to obtainsnapshots, this subtask is designed to determine relatively long-term averagesof water-column conditions. The need for this type of sampling stems from theinherent variability found in water-column samples. Figure 3.6 presentspreliminary GE monitoring data from Study Area B for the period April 1 to June24, 1991. Data were collected three times per week at each sampling station.The measured variability shown by the vertical lines in Figure 3.6 issubstantial. This variability can be attributed to variations in suspendedmatter load, flow and sediment scour, etc.
Flow-averaged sampling avoids those variations by compositingsamples. (The water-column transect study will be subject to these variables, buteffects will be minimized by monitoring appropriate parameters, separatingdissolved from suspended matter PCBs, and by sampling the same parcel of waterthrough Study Areas A and B.)
Figure 3.6 also shows the means in water-column PCB concentrationsin Study Area B using spring 1991 data. The sampling to achieve these results
3-8 IMS/Gradient
312122
were substantial, /.«., 28 points per station for a total of 168 measurements.The flow-averaged sampling program is intended to obtain a similar analysiswithout an extensive analytical program. For the time period shown in Figure3.6, the flow-averaged sampling would have produced three samples for analysisper station instead of twenty eight.
The flow-averaged water-column sampling program entails thecollection of water column samples on a regular basis, essentially every otherday. The volume of water collected on a given day is proportional to the flowmeasured that day by the USGS hydrologic monitoring stations in the Upper Hudson,using a scale developed prior to the onset of samplings. After the requirednumber of samples are collected and the period of sampling is over, these samplesare combined to yield one large sample for PCB analysis. The concentration inthe combined sample is then a flow-weighted average of the water columnconcentrations.
A single combined sample will be generated for monitoring stationsat Glens Falls, Fern more Bridge at Bakers Falls, Route 197 Bridge at Fort Edwardand Thompson Island Dam, for a minimum of three separate sampling periods. Thesesamples will permit the construction of a plot similar to that shown in Figure3.6. The set of sampling stations is limited to four, based on the trend inwater-column loading developed in the Phase 1 Report and supported by the datafrom General Electric, which indicate that PCB loading originates in the reachesbetween these four monitoring stations.
The following analyses will be performed on the flow-averaged watercolumn samples:
• Dissolved phase PCB congeners;• Suspended matter phase PCB congeners;• Dissolved organic carbon;• Total suspended matter; and• Standard water quality parameters - pH, temperature,
conductivity, dissolved oxygen.
3-9 IMS/Gradient
312123
The dissolved and suspended matter phase PCB congener analyses arerequired to describe the flow-averaged total PCB concentration. The informationwill not be equivalent to the water column transect sampling, since the flow-averaged samples will be held for as many as several weeks before filtration,allowing the PCB distribution to equilibrate and losing the information onpotential source type. Thus, the two sampling methods complement each other.The water column transect sampling gives instantaneous congener-relatedconditions, which can be used to locate contaminant sources and examine theeffects of biogeochemical processes while generating an instantaneous PCBloading. The flow-averaged samples describe the mean total PCB loading, butpotentially the congener distribution needed to identify specific sources andbiogeochemical processes is altered.
s
The dissolved organic carbon and total suspended solids analyses willalso be performed on a flow-weighted basis. These parameters are needed for thesame reasons as for the water column transects.
The standard water quality parameters, pH, temperature, conductivityand dissolved oxygen, will be recorded at the time of sample collection. Thesedata will be used qualitatively in support of the other parameters.
3.2.4 Analysis of Historic Samples
Scientists of the Lamont-Doherty Geological Observatory, between 1977and 1986, have collected water-column samples for PCB analysis. These sampleswere separated into dissolved and suspended matter fractions, analyzed usingpacked column gas chromatography and archived. These samples are available forreanalysis on a congener-specific basis for the Phase 2 investigation and willprovide information on the types of PCB congener mixtures historically carriedby the Hudson River. The data will be compared with current congener mixturesto establish how the mixture has changed over time.
3-10 TAMS /Gradient
312124
These archived sample analysis data complement other data sourcesavailable to the Reassessment, including the USGS monitoring records and the highresolution sediment coring effort. The large USGS data set is limited in bothits detection limit and its resolution of PCB congeners. This data set providesmany limited resolution snapshots of the water column PCB concentration. Thehigh resolution sediment core data provides information on PCB congenerconcentrations of historic suspended matter, with a two to three-year level ofresolution. Historic water column samples have the PCB congener resolution ofthe high resolution cores and the instantaneous nature of the USGS data and willbe a useful tool in examining historic trends and extrapolating future trends.
The analysis of historic samples will provide the historic, dissolvedphase PCB congener concentrations, a data set not available from any othersource. These data will be used to assess the accuracy of using literaturepartition coefficient data to predict total water column PCB concentrations,based on suspended matter or high resolution sediment core PCB concentrations.
The analysis of the archived water column extracts will beessentially the same as the analysis of all other PCB samples for the Phase-2investigation.
3.3 Sediment Coring and Analysis
The sediment investigations represent a major portion of the Phase2 investigation, because of the considerable mass of PCBs contained in thesediments and the unique ability of sediments to record historic riverineconditions. The sediment investigations consist of four subtasks:
• High resolution sediment coring;• Low resolution sediment coring;• Analysis of archived sediment extracts; and• Confirmatory sediment sampling.
These subtasks are described in Sections 3.3.1, 3.3.2, 3.3.3 and3.3.4.
3-11 TAMSI Gradient
312125
3,3.1 High Resolution Coring
The goal of this sampling subtask is to collect and analyze sedimentcores from locations 1n all four study areas. These cores will be obtained fromriver areas known or believed to accumulate sediments at a rapid rate, typically1 cm/yr or more. Because these areas rapidly accumulate sediments on a more orless continuous basis, they effectively preserve each year's sediment deposits.Since the river itself is responsible for continuously delivering the sedimentsto these locations as it transports sediments downstream and out to the AtlanticOcean, the sediment deposits at each location represent an average of the watercolumn suspended matter properties. By separating the deposits in annual orbiannual layers, it is possible to examine ths historic trend in water columnsuspended matter properties.
The term high resolution sediment coring refers to the method bywhich sediment cores are collected and separated. After collection, a sedimentcore is gently extruded from the coring tube and sliced into thin layers of 2 to4 cm in thickness. These layers, which approximate annual or biannual depositthickness, permit the analysis of one to two years of sediment accumulation perslice. This technique produces a highly resolved sediment deposition chronology.
Although the process of slicing a sediment core into thin layers isnot sufficient to establish the history of sediment deposition at a givenlocation, natural arid anthropogenic time markers are incorporated into thesuspended matter before it is deposited at a given location. These time markersare the radionuclides Beryllium-7 (Be-7), Cesium-137 (Cs-37) and Cobalt-60 (Co-60). Use of these radionuclides as time markers 1s based on their known rate ofinput to the Hudson Basin.
3-12
312126
r—v Geocheraical application of these radionuclides is diverse and well-documented. They are utilized in lakes, rivers, oceans and estuaries as timemarkers or clocks for establishing sediment deposition rates. The power of thetechniques arises, in part, from the simplicity of measurement. Radionuclidesin sediments are analyzed by simply drying the sediment and placing it in a gammaspectrometer where the gamma radiation given off by the radionuclide can bemeasured and recorded. The sample is left in the counter for a period of hoursto days in order to accumulate sufficient counting statistics. Once counted, thesample can then be used for other chemical analyses as needed. The sensitivityof the measurement is quite high. Typical detection limits are 200 picocurie perkilogram (pCi/kg) for Be-7 to 25 pCi/kg for Cs-137. (A picocurie is a measureof radioactivity. One picocurie represents about 2 disintegrations per minute.)
Radionuclides in the sediments are used in two ways, as a clock inthe case of Be-7 and as an event marker in the case of Cs-137. Be-7 is anaturally occurring radionuclide produced in the upper atmosphere by cosmic
- radiation. Its rate of fallout is fairly constant with time. The fallout rate/,-«-~, at Albany has been measured at 0.018 pCi/cm2 day (Olsen, et al. 1984).2 Because
its input is relatively constant with time, Be-7 is suitable for use as asediment clock. For Be-7 the clock is started at the time of sedimentdeposition. Because Be-7 exhibits an exponential decay with a half life of 53.3days, it will only be detectable in sediments for six months to a year, andvirtually all of the Be-7 will be decayed after one year. Thus, the Be-7 clockis limited to the uppermost sediment layers, typically 2 to 4 cm in depth.
Cs-137, on the other hand, is an anthropogenic radionuclide, producedin atomic weapons testing and nuclear power reactors. Most of its release to theenvironment has resulted historically from atmospheric weapons testing. Thehistoric input of Cs-137 to the New York area has been summarized by Bopp et a7.
2Olsen, OR., I.L. Larson, R.H. Brewster, N.H. Cutshall, R.F. Bopp and HJ. Simpson. 1984. *AGeochemical Assessment of Sedimentation and Contaminant Distribution in the Hudson-Raritan Estuary.*NOAA Technical Report NOS QMS 2, U.S. Dept. of Commerce.
3-13 JWS/Gradient
312127
(1982).3 Figure 3.7 shows the history of atmospheric fallout and nuclearreactor releases to the Hudson Valley. The three main event markers are: 1)appearance of Cs-137 In 1954, as a consequence of the onset of atmospheric atomicweapons testing; 2) a Cs-137 maximum In 1963 corresponding to an extensive amountof atmospheric weapons testing just prior to the Implementation of theatmospheric test ban treaty; and 3) the 1971 Cs-137 release directly to the LowerHudson by the Indian Point nuclear power facility. The Cs-137 peak in 1971 canbe distinguished from the 1963 peak by the presence of Co-60 in the sedimentsassociated with 1971. Co-60 was released along with Cs-137 by the Indian Pointfacility. The impact of the reactor release of Cs-137 to the Lower Hudson islimited to the brackish portion of the estuary (Study Area D). Thus, for StudyAreas A, B and C, there are three time constraints or horizons: Be-7 in surfacesediments, Cs-137 maximum in 1963 and Cs-137 appearance in 1954; Study Area D hasone more, corresponding to the 1971 reactor release.
Because of its geochemistry, the Cs-137 record in the sediments isnot as simple as the history shown in Figure 3.7. Cesium is a particle reactiveelement, which quickly binds to soil and sediment. As a result, a largeinventory in soil was generated as a result of pre-1966 atmospheric fallout.Although the maximum atmospheric input to the Hudson watershed occurred in 1963and has since tapered off greatly, soils in the watershed continue to release Cs-137 to the Hudson River via soil erosion and dissolution. This release is suchthat any post-1954 sediment deposited in the Hudson contains Cs-137. The netresult yields a Cs-137 maximum in 1963 to 1964 sediments, which graduallydecreases to the present.
Figure 3.8 illustrates the Cs-137 record in a Lamont-Doherty corecollected in 1986 at RM 88.6 near Kingston in Study Area C. The profile closelyfits the known Cs-137 input function, yielding an annual deposition rate of 1.5to 1.8 cm/yr. Be-7 was detected only in the top sediment layer (0-2 cm) with adeposition rate of less than 2 cm/yr, consistent with the Cs-137 deposition rate.
, R.F., HJ. Simpson, C.R. Olsen, R.M. Trier and N. Kostyk. 1982. Chlorinated hydrocarbons andradionudide chronologies in sediments in the Hudson River and estuary. Environmental Science and Technology,16: 666-672.
3-14 TAMS /'Gradient
312128
This type of core chronology can be readily converted to a year of depositionrelationship. The total PCB concentration for the core layers is plotted inFigure 3.8. The conversion is shown in Figure 3.9. The approximate uncertaintyin the sediments' ages are shown by the vertical line on the total PCB curve.Like all of the interpretable high resolution cores collected by Lamont-Dohertyin the Lower Hudson, this core shows a PCB maximum in the early 1970s.
The application of radionuclide analysis to sediment cores permitsan estimation of the year of deposition for individual sediment layers. Knowingthe approximate year of deposition and assuming that the sediments deposited thatyear directly reflected water-column conditions, it is then possible to estimatehistoric water-column trends.
Taken alone, the sediment record can be used to evaluatequalitatively long-term transport trends. Because data on water-column flow andsuspended matter levels are available for the Hudson in some coring locations,it is possible to quantitate in these instances historic PCB transport at theselocations. Literature data and data from the Phase 2 water-column studies willbe used to predict the total water column PCB concentrations based on thesediment record. In addition to recording the total PCB transport, sedimentsalso record the PCB congener mixture on the suspended matter. Thus, datedsediment samples can be used to determine the historic mean congener mixtures.To the extent that a specific congener mixture or fingerprint can be tied to asource or source area, the sediment record can then be used to monitor theimportance of the source over time.
Most of the previous high resolution sediment core work was done inthe 1970s and early 1980s. The core collection sites for the Phase 2 highresolution sediment core program were selected with the intention of updatingdata for these previous core locations and examining the most recent sedimentand, therefore water-column trends. By coring at these previously studiedlocations, it is also possible to examine the fate of PCBs within the sediments,as discussed below.
3-15 TAMS/Gradient
312129
Additional parameters to be analyzed as part of the high resolutioncore program are designed to augment the Interpretation of the radionucllde andPCB data. Grain size distribution analysis will reveal any changes in thedeposltlonal environment at the coring location. Total carbon and totalInorganic carbon analyses will be used to examine total organic carbon contentvariations through a core. The total inorganic carbon analysis is expected torepresent a small correction to the total carbon analysis, so that only a limitednumber of total inorganic carbon analyses will be required. The total nitrogenand total organic nitrogen analyses are used in a similar way, except thatorganic nitrogen is measured directly. The differences between total nitrogenand total organic nitrogen measurements are expected to be small, therefore onlya limited number of total organic nitrogen analyses will be performed as a check.The need for the total organic carbon and total organic nitrogen data is two-fold. First, sediment PCB concentration is expected to correlate with total
forganic carbon levels. Second, the organic carbon to nitrogen ratio is anexcellent indicator of wood cellulose. Wood waste materials constitute much ofthe original deposits found behind the Fort Edward Dam. When the dam wasremoved, these woody materials were deposited with the sediments downstream ofFort Edward for many miles. Wood cellulose is characterized by very high C/Nratios relative to typical soil or sediment organic material. Thus, the C/Nratio will be a good indicator of materials deposited following removal of thedam.
The last parameter to be measured for the high resolution sedimentcoring program is reduction-oxidation potential (redox). Reducing sediments havebeen shown to correlate with anaerobic biodegradation in Study Area B byscientists at NYSOOH. The redox measurements should assist in the interpretationof PCB congener distributions in the sediments, since reducing conditionspresumably should correlate with zones of obvious PCB degradation.
3.3.2 Analysis of Archived Sediment Extracts
This subtask is an extension of the high resolution sediment coringprogram. The goal is to reanalyze archived sediment core extracts for comparison
3-16 TAHS /Gradient
312130
Phase 2 sediment core results. Because it 1s possible to date the sedimentlayers from a core, it is also possible to compare sediment layers of the sametime horizon among cores. This subtask will involve the comparison of Phase 2high resolution sediment core layers with their dated counterparts 1n archivedsediment cores. The archived core layers require reanalysis, because they wereoriginally analyzed by packed column gas chromatography. The Phase 2 sedimentcores, like all Phase 2 analyses will be analyzed for PCBs on a congener-specificbasis. Thus, the reanalysis of the archived cores will permit direct comparisonof the two data sets. For example, the core layer corresponding to 1973 in aPhase 2 core collected in 1992 could be directly compared with the core layercorresponding to 1973 collected in a core from the same general location in 1977.This comparison would permit the study of in situ degradation rates over theintervening period, in this case 15 years. Thus, by selecting several layerpairs corresponding to various time intervals, it will be possible to examine theeffects of 7'n situ processes on potential PCB degradation at the coring location.The rate of degradation is an important parameter in estimating future riverconditions, since in situ degradation affects the PCB inventory available forinteractions with other site media. Thus, in areas where 1n situ degradation issubstantial, future PCB levels and inventories may be reduced. Conversely, inareas where little degradation occurs, PCB sediment concentrations are likely toremain relatively constant.
In situ degradation is already known to occur in the sediments of theUpper Hudson although estimates of the rate of degradation are limited. In theLower Hudson, evidence suggests, by comparison, that in situ degradation is slowor absent. By comparing archived and Phase 2 sediment core pairs for Study AreasA, B, C and D, it will be possible to estimate in situ degradation rates withineach area.
The selection of archived sediment core layers for reanalysis willbe based on the strength of dating constraints for the layer. The sedimentlayers most tightly constrained are those corresponding to the 1954 appearanceof Cs-137, the Cs-137 maximum, the 1971 Cs-137/Co-60 maximum (Study Area D only),the early 1970s PCB maximum and the date of collection of the archived core.
3-17 TAMS /'Gradient
312131
3.3.3 Low Resolution Coring
The analytical program for low resolution coring Is similar to thatfor high resolution coring. The difference between the two programs arises fromthe selection of coring sites and the subdivision of cores. The high resolutioncoring effort requires that particularly close attention be given to theselection of coring sites on the basis of the sediment deposition rate. The lowresolution coring does not. While high resolution coring attempts to study watercolumn trends, low resolution coring is intended to obtain estimates of sedimentPCB mass. Thus, the high resolution cores are separated by long distance(typically 10 miles or more), while the low resolution coring locations will belimited to Study Area B, mostly in the region between the Fenimore Bridge and theThompson Island Dam.
The term Tow resolution coring arises from the subdivision of thesecores. In general, low resolution cores will be separated into 5 inch layers (13cm) as compared to the 2 to 4 cm thick layers used in high resolution coreseparation. The relatively thick nature of the core sections in low resolutioncoring will permit only the approximate determination of the total depth ofrecent PCBs and Cs-137 bearing sediment. The purpose of this analysis is todetermine the volume of contaminated sediment in a given area.
The selection of areas to be studied by low resolution coring willbe based on the geophysical survey results and the results of the analysis ofhistorical sediment PCB studies by NYSDEC (see discussion of kriging in Section2). In some instances, the areas for study will be previously determined hotspots, which are deemed important enough to be re-examined by sampling. In othercases, the coring locations will be based on the geophysical surveys alone inorder to classify the type of sediment contamination associated with a givensedimentological zone. In both cases, the interpretation of the coring data willbe closely tied to the geophysical survey results. The final selection of .lowresolution coring sites will be based on the geophysical survey, which will notbe completed until spring 1992.
3-18 TAMS/Gnwfienf
312132
3.3.4 Confirmatory Sediment Sampling
This subtask 1s Intended to provide confirmatory data on the textureof sediments located throughout the geophysical survey area. Sediment texturesdepicted by the geophysical survey Instruments represent relative changes Insediment topography, reflectivity and density. The confirmatory sediment samplesprovide an absolute measure of these sediment properties, which in effect areused to calibrate the geophysical survey data. The confirmatory sediment sampleswill be analyzed for only two parameters, grain-size distribution and a measureof organic carbon. In addition, some sediment cores will be X-rayed to examinesediment density variations. These variations should correspond with those seenby the geophysical surveying equipment. These parameters are sufficient todescribe the sediments for geophysical survey purposes. The sediment parameterswill also be used in the interpretation of other data collected in Phase 2 andwill be particularly useful in the assessment of scourability presented inSection 5.
3.4 Geophysical Surveying
The goal of the geophysical surveying data collection task is toproduce a set of maps detailing bathymetry, sediment morphology, sedimenttexture, and fine grained sediment thicknesses at specific locations within StudyArea B only. These maps will be produced from the analysis of sonar data, whichwill be collected as a part of the geophysical surveys. The sonar results willbe calibrated against the confirmatory sample results discussed above.
The basic principal of the geophysical surveying techniques is theuse of sound as a replacement for light in generating a picture-like mosaic ofthe river bottom. The surveying equipment generates sonic signals, which passthrough the water and are reflected by the bottom materials. The equipment usesseveral frequencies to scan the bottom of the river. As the equipment is pulledthrough the water by a survey vessel, various transponders scan the river bottomby generating and recording sonic signals. The survey vessel follows previouslydefined survey lines to ensure complete coverage of the river bottom.
3-19 TAMS/Gradient
312133
Three transponder systems, a depth transponder, a subbottom profilerand a side scan sonar system, are used. The depth transponder determines riverdepth or bathymetry. The subbottom profiler is capable of penetrating finegrained sediments on the river bottom to determine their thickness. The depthof fine grain sediments is the difference between the river depth measured by thedepth transponder and the depth of the reflection horizon measured by thesubbottom profiler. The side scan sonar is the most sophisticated of the threetransponder systems. This system uses two frequencies of sound to scan the riverbottom. Each of the two frequencies generates its own reflectivity pattern forthe river bottom. Unlike the other two measurement systems, the side scan sonaris able to measure in two dimensions, creating a picture-like image of the riverbottom as the transponder is pulled through the water. The term side scan sonarcomes from the ability of this measurement system to look to the side as well asstraight down. This ability to look to the side is achieved by a sophisticateddata processing scheme that handles the returning sonic signals. The swath ofthe river bottom covered by the side scan sonar is dependent upon the resolutionrequired. For the Phase 2 survey work, the swath will be fairly small, about 75meters (255 ft) wide in order to resolve the bottom features to a resolution ofabout 15 cm (6 in). At this resolution, bottom features such as boulders, logs,and bedrock outcrops are readily discerned. More importantly, areas of gravel,sand, and fine grained material can be discerned as well. The side scan sonarrecord will form the main data set for maps of the river's sediment morphologyand texture.
The geophysical data are compiled, reviewed and linked to shippositioning data collected simultaneously with the geophysical data. Bathymetrywill be used to generate maps of river bottom depth. The side scan sonar tracksare merged together to create mosaic pictures of the river bottom. These mosaicsare then used to produce maps of sediment morphology by interpreting thereflectivity patterns in conjunction with the confirmatory sample resultsdiscussed in Section 3.3.4. The sub-bottom profile data will be used with thesemaps to provide a third dimension measurement and permit the estimation of finegrained sediment volumes in areas of concern.
3-20 TAMS/Gnwfte/if
312134
Figure 3.1Homolog Content of Some Standard Aroclors
a>yoa.
*——
o>0)
a>ooo
Homolog
Note: The symbols indicate the mass percentage represented by the PCB homolog groupon the horizontal axis. The lines connecting the symbols are intended to highlight the homologgroup patterns and do not represent additional data.
312135
C0)o0)o_
o>0)
O)oO
o
Figure 3.2A Comparison of the Homolog Ratios in Total PCBs
Across The Thompson Island PoolApril 5, 1991Data supplied by GE
Ft. Edward
Thompson Isl. Dam
50
45
40
35
30
25
2015
10
5
0
May 3, 1991Data supplied by GE
Ft. Edward
Thompson Isl. Dam
Homolog
Note: The symbols indicate the mass percentage represented by the PCB homolog groupon the horizontal axis. The lines connecting the symbols are intended to highlight the homologgroup patterns and do not represent additional data.
312136
Figure 3.3A Comparison of Homolog Mixtures
a>u
o>a>
O)oooX
Ft. Edward-April 5,1991Aroclor 1242
— A— 80% 1242+ 20% 1254
0
Homolog
Note: The symbols indicate the mass percentage represented by the PCB homolog groupon the horizontal axis. The lines connecting the symbols are intended to highlight the homologgroup patterns and do not represent additional data.
312137
Figure 3-4Variation in the Homolog Distribution at the
Thompson Island Dam with Time
•£ 50
u>Hto
00
Homolog
~ 500) 45
5 «1a. 35.;
S£ia) ^>i
O) 15-:_OO
oX
OO
10 i5-0
50
t 35
20-i
May 3, 1991 Data supplied by GE
ocoa ^ ox
0)o oQ- Sa> O
DOz
oo(Da
May 17, 1991 Data supplied by GE
oco a>
o o•*= x§ ®Q. ^
Homolog
"a0)
ao
oo(Do
Note: The symbols indicate the mass percentage represented by the PCB homolog groupon the horizontal axis. The lines connecting the symbols are intended to highlight the homologgroup patterns and do not represent additional data.
Figure 3.5Comparison of Suspended Matter Packed
Column Peak Results From Mechanicville, N.Y20
aSoa>o_«/>«/>O
Oa>a.
15-
10-
5-
7/19/83 LVF— 0-- 7/19/83 GFF
From Bopp et al, 1985
Note: No data for peak 11 for Mechanicville
3 4 5 6 7 8 9 10 11 12 13 14 15 16Peak Number
Note: The symbols indicate the mass percentage represented by the PCB homolog groupon the horizontal axis. The lines connecting the symbols are intended to highlight the homologgroup patterns and do not represent additional data.
Time history of fallout radionuclides delivered at New York and reactorreleases from the Indian Point facility, decay corrected to 1980.
From Boppetal, 1982
312141
Depth In Core Depth of Be-7Penetration
O«*>c*>VI
<Q>^
sgQ•nO09
O*
<Q
<̂Q
O - —EJ
Approximate Year of Deposition
OMI
G*
TOO
(Q%^O
gg_•oO00</»
OO*
(O
(Q
*s-^ 4. UPDATE OF TAMS/GRADIENT DATABASE
4.1 Computer Database
Phase 1 included the acquisition and analysis of available data onPCBs in the Hudson River. These data were assembled into a computerizeddatabase. Some minor omissions were noted in the Phase 1 Report, and others werenoted in public comments on that report. In Phase 2, the TAMS/Gradient databasewill be updated for all four study areas to include:
• Data inadvertently omitted in Phase 1;
• Data collected by others which have, or will, become avail-able, since Phase 1; and
• Data from Phase 2 sampling and analysis.
All additions to the database will be summarized and identified.When significant additions are made, analyses and findings of the Phase I Report
/*""*** will be checked, updated and utilized. In addition to the sampling and analysisdata generated in Phase 2, additional data for upgrading the TAMS/Gradientdatabase will include, but not be limited to, the items described in subsequentsections.
4.1.1 Historic Data in STORET Database
STORET includes many scattered and miscellaneous records ofmeasurements of PCBs in water, sediment and fish in the Hudson and itstributaries in addition to those used in Phase 1. A complete listing of STORETPCS records for the State of New York will be examined for additional pertinentdata. An important facet of this work for Study Area B will be accession of PCBmeasurements from the Hoosic and Mohawk Rivers.
4-1 IMS/Gradient
312143
4.1.2 GE Remnant Deposit Monitoring Data and HRRS Data
As part of the remedial activities associated with the RemnantDeposits, GE conducted an environmental baseline monitoring program. Thisprogram included monitoring of PCBs in sediment, water, aquatic biota and air.Ten aquatic sampling stations were established: two above the remnant deposits,six within the remnant deposit area, and two downstream. Sampling, performed byHarza in 1989 and 1990, was continued by O'Brien and Gere in 1991. The 1991effort apparently includes biweekly water column analyses at six stations, withweekly congener-specific analyses at an 11 ppt (parts per trillion or ng/L)detection limit. The extensive sampling from this monitoring program willprovide important input to the database. The recent congener-specific samplingwill complement data to be collected in Phase 2.
The GE Hudson River Research Study (HRRS) was conducted betweenAugust and October, 1991 following completion of the Phase 1 Report; the datagenerated have not been integrated into the database, and will be in Phase 2.The HRRS was designed to (1) demonstrate that aerobic PCB biodegradation couldoccur under actual field conditions, based on prior laboratory investigations;(2) identify the key variables that influence the rate and extent of PCBbiodegradation in Hudson River sediments; and (3) investigate the potential fornatural aerobic degradation to occur in these sediments via indigenous PCB-degrading microorganisms.
4.1.3 USGS Water Column Monitoring
In Phase 1, USGS flow data were obtained through the end of WaterYear 1990; PCB and other water quality data were obtained through the end ofWater Year 1989. During Phase 2, attempts will be made to obtain the 1991 flowdata as well as the 1990 and 1991 PCB and water quality data. The availabilityof PCB data will depend on the extent of analysis delays currently beingexperienced by USGS.
4-2 TAMS /Gradient
312144
4.1.4 NYSDEC F1sh Data
The Phase 1 Report utilized NYSDEC fish sampling through 1988. Datafor 1990 and 1991 will be incorporated into the database in Phase 2, once thefinal data are available from NYSDEC.
4.2 Other Data Sources
4.2.1 Point Source Data
There are additional data to be collected on point sources of PCBsto the Hudson system. Table B.2-1 of the Phase 1 Report identified currentlypermitted PCB discharges into the Upper Hudson River drainage basin from theState of New York. In addition, another known source is permitted to dischargePCBs into the Hoosic River by the Commonwealth of Massachusetts. During Phase1, only current (1991) SPDES Permits and Discharge Monitoring Reports wereexamined; examination of older SPDES files for these and other facilities mayprovide additional relevant information.
4.2.2 Other Current RI/FS Investigations
Currently, RI/FS investigations are being performed at the old GECapacitor Manufacturing facility in Hudson Falls. According to NYSDEC,approximately 100 cubic yards of PCB-contaminated soils and oils were removed inJanuary 1990 from an air plenum underneath the plant building. The data obtainedfrom the NYSDEC study along with groundwater sampling for congener-specific datain Phase 2 will be assessed.
The results of another RI/FS study being performed at the Ciba-Geigyfacility upstream of the GE facility will also be reviewed.
4-3 IMS/Gradient
312145
4.2.3 Dredge Spoil Disposal Sites
In Table B.2-2 of the Phase 1 Report, the RGB-contaminated dredgespoil disposal sites located near the Upper Hudson River (Study Area B) wereidentified. These are Old Moreau Dredge Spoil Area, Special Area 13 and MoreauDredge Spoil Disposal Site. These sites are subject to ongoing monitoring byNYSDOT and NYSDEC. All pertinent records will be obtained and evaluated in Phase2.
4-4 TAMS/Gradient
312146
5. CONTAMINANT FATE AND TRANSPORT ANALYSIS
The Reassessment requires knowledge of the future impact of PCBs inthe Hudson River system under conditions of No Action and various remedialalternatives; however, an exhaustive investigation of all aspects of the system,as proposed by some CIP participants, is not considered necessary. Rather, theeffort in Phase 2 must be specifically focused on providing the informationnecessary for an informed decision among alternative remedial actions.
In the Phase 1 Report it was determined that human health risks fromHudson River PCBs are caused primarily by the consumption of contaminated fish.Therefore, the impacts of remedial alternatives on bioaccumulation of PCBs by thefish populations must be considered. Understanding bioaccumulation in fish isalso essential for the evaluation of ecological impacts and risks. To accomplishthis in Phase 2, it is necessary to develop a quantitative understanding of (1)future trends in environmental concentrations of PCBs, and (2) pathways for theaccumulation of PCBs from the environment into the fish population.
The choice among remedial alternatives will require the answers to -several specific questions relating to the future status of PCBs in Hudson Riverfish populations, including the following:
1. When will the PCB levels in the fish population recover tolevels meeting human health criteria under continued NoAction?
2. Can remedies other than No Action significantly shorten thetime required to achieve acceptable risk levels, or could itmake the current condition worse?
3. Are there sediments now buried and effectively sequesteredfrom the food chain which are likely to become "reactivated"following a major flood, resulting in an increase in contami-nation of the fish population?
These questions reflect two different time scales, and a range ofspatial scales. Possibilities of catastrophic flood scour, or sediment
5-1
312147
disequilibration following dredging, are events on a temporal scale of days orweeks, occurring in specific physical locations. On the other hand, the questionof the general recovery of the fish population, particularly under conditions ofNo Action, appears to be measured on the scale of years. Assessing long-termimpacts also has a broad spatial scale, which will be measured over whole reachesof the river.
Obtaining answers to these questions does not require the need of ahighly detailed, dynamic transport model which attempts to describe all aspectsof the system. For instance, modeling the short-term transport of PCBs inriparian systems utilizes computer codes which account for the time-dependentbehavior of flocculating compressible organic sediments. Such state-of-the-artmodels, while difficult to parameterize and calibrate, are useful tools towardunderstanding the dynamic, micro-scale processes of PCB cycling in rivers.Fairly successful results have been obtained in simulating individual events,using a time step of seconds.1 However, the spatial and temporal scales are notrelevant to the questions we need to answer for the Reassessment (requiring long-term, spatially averaged mass balance analysis and event based analysis of scour,but not transport), and thus the expense of implementing such a model cannot bejustified.
"What we need to know" can be best accomplished through a threecomponent approach, focused to the Reassessment as follows:
1. Long-term analysis of Impacts using PCB mass balance approach.This would involve analysis and prediction on a seasonal orannual time scale.
2. Correlation analysis to predict average response of fishpopulations to environmental PCB levels. This involvespredicting future bioaccumulation through observed relation-ships to PCB levels in water and sediment.
3. Erodibility analysis of contaminated sediment areas. Thisinvolves analysis of specific local response to prospective
1Gailani, J., C.K. Ziegler and W. Lick. 1991. The Transport of Suspended Solids in the Fox River. (Draft).Dept. of Mechanical and Environmental Engineering, University of California, Santa Barbara.
5-2 TAMS/Gradient
312148
flood events. Potential scour must be assessed in detail, butnot necessarily the exact details of flood transport.
5.1 Component 1 - PCB Mass Balance Analysis
The objective of this component is to predict the PCB levels in waterand sediment on a year by year and reach by reach average basis. It will be usedto analyze the potential impacts of various remedial and source control schemes,and will provide the input to Component 2, from which fish burden impacts willbe estimated. We will organize the mass balance analysis using the EPA modelingpackage WASP4 (version 4.31, EPA CEAM, Sept. 1991).
5.1.1 General Concept and Level of Detail
The mass balance analysis can be implemented in two stages, of whichthe second will be a detailed application. The first stage involves completionand evaluation of a general inventory of PCB stores and fluxes, and associateduncertainties. This serves to provide the "reality check" on more detailedanalyses. In the second stage, the mass balance approach will be extended intoa large-scale, long-term, quasi-steady model of PCB behavior in the system.2This is generally the approach that Thomann et a7. used for the Lower Hudson(although there are a number of specific criticisms of their methods and assump-tions.) Where our interest is in temporal and spatial average conditions, we canmodel long term PCB behavior by discretizing only to the spatial level of reacheswith a seasonal time step for output, using WASP4. The transport portion ofWASP4 is essentially a mass-balance accounting by segment. Thus, WASP4 providesthe "accounting" framework in which to pose and answer questions relating to themass balance.
The mass balance approach of WASP4 cannot handle the detailedsimulation ;0f a major flood/scour event and corresponding rapid redistribution
quasi-steady here means that sediment derived inputs change only gradually with time and catastrophicreleases are not modeled.
5-3 TAMS/Gradient
312149
of contaminants. However, the mass balance approach is appropriate forevaluating the long term impacts of such a redistribution.
WASP4 is well suited to the task of macroscale analysis due to itslink-node formulation. It allows incorporation of all the stores and fluxes mostimportant to long term PCB status: sediment storage, multiphase transport inwater, transport to and from sediments, volatilization, and degradation. Thechemical transport module, TOXIWASP, allows detailed consideration of chemicalreactions, and the model can simultaneously simulate a number of constituents.In this case we can simulate representative PCB congeners. The generalpartitioning/transport aspects of the model are summarized in Figure 5.1.
In order to implement WASP4, a number of flux parameters must beidentified. Important fluxes include loadings to the river, transport fromsediment to the water-column, from the water-column to air, and advectivetransport out of each reach. Loss or transformation of PCBs by degradation willalso be considered.
5.1.2 Input from Sediments
Perhaps the most important aspect of the analysis is evaluation oftransport of PCBs from in-place sediments to the water column. This consists oftwo separate issues: catastrophic mass erosion of contaminated sediments underextreme flood conditions, and transport from sediments to the water column under"typical" non-catastrophic conditions. The first aspect cannot be handledentirely in the context of macroscale, mass balance modeling, but will beevaluated through erodibility analysis, including hydrodynamic modeling, to bedescribed below. However, the long term impacts of extreme floods can beevaluated in the mass balance context once the potential loading is estimated.
Transport of PCBs from the sediments under "typical" (non-catastroph-ic) conditions involves a number of processes:
1. Diffusion through and out of the sediments of the dissolvedfraction and fraction sorbed to dissolved organic matter.
5-4 IMS/Gradient
312150
I2. Advection through and out of the sediments in baseflow
seepage, of both dissolved and sorbed components.3. Sediment entrainment/exchange, involving exchange of sediment
with the water column from an active mixing zone of thesediment bed.
The macroscale, mass balance model is most applicable to quasi-steadyconditions, in which the sediments and bed configuration change only graduallywith time and are not subject to massive disequilibration. This does not meanthat no scour occurs, only that the bed configuration is nearly stable over time.The mass balance approach thus handles the quasi-steady case in which depositionand resuspension are both present, but nearly in balance with one another overa reasonably large area and time. This is appropriate for the Upper Hudson,where dam structures have a strong influence on sediment deposition, for the timeperiod since the disturbance introduced by removal of the Fort Edward Dam in 1973has died down. Analysis of the data in Phase 1 suggests this assumption isappropriate post-1983. The assumptions are also appropriate for the lower,estuarine Hudson where sedimentation velocities appear to be relatively steadyon a year to year basis.
Phase 2 sampling is designed to identify this portion of the problemin several ways. First, we will be obtaining contemporaneous congener specificPCB levels in water and sediment, allowing direct examination of fluxes.Secondly, high resolution coring in areas without substantial degradation willallow the fitting of diagenetic models to describe sediment deposition andcontaminant fluxes.3 For instance, it has already been demonstrated thatradionuclide profiles can be used to obtain accurate estimates of diffusioncoefficients in Hudson River sediments.4 Finally, the information obtained fromdateable cores can be used to calibrate an annual model of transport in thesystem.
^Berner, R.A. 1980. "Early Diagenesis, A Theoretical Approach". Princeton University Press, Princeton, NJ
4Olsen, C.R., H J. Simpson, T.-H. Peng, Rp. Bopp and R.M. Trier. 1981. Sediment mixing and accumulationrate effects on radionuclide depth profiles in Hudson estuary sediments. Journal of Geophysical Research 86(C11):11020-11028.
5-5 TAMS/'Gradient
312151
5DiToro, D.M. 1985. A particle interaction model of reversible chemical sorption. Chemosphere 14(10):1503-1538.
''Bopp, R.F., HJ. Simpson and B.L. Deck. 1985. Release of Polychlorinated Biphenyls from ContaminatedHudson River Sediments. Final Report NYS C00708 to NYSDEC. Lament Doherty Geological Observatory,Palisades, NY.
7Chin, Y.-P., WJ. Weber and B J. Eadie. 1990. Estimating the effects of dispersed organic polymers on thesorption of contaminants by natural solids. 2. Sorption in the presence of humic and other natural macro-molecules. Environ. Sci. Technol. 24(6): 837-842.
5-6 IMS/Gradient
5.1.3 Suspended Sediment/DOC/Water Partitioning 1
Even though PCB phase partitioning is not instantaneous andreversible it can be assumed so for the long time horizons of the mass balancemodel. We will also assume linear partitioning, which is generally appropriatewhen sorption sites are plentiful. WASP4 also provides the option of making thesorption coefficient dependent on solids concentration, as proposed by DiToro.5
Analysis of multiphase partitioning will be required in the modeling.Much of the transport of PCBs is expected to take place sorbed to fine sediments. a
However, it has also been observed that Hudson River PCB concentrations obtained *by filtering water samples at 0.7 microns may be approximately a factor of 2greater than concentrations obtained by in stream large volume filtration at 1.2microns.6 The reasons for this discrepancy are not clear. In general for ?strongly hydrophobic chemicals such as PCBs we can expect a significant role for *facilitated transport involving binding of PCBs to dissolved organic compounds *(DOC) or, more generally, to non-settling non-filterable organic matter (NSOMX. IChin et al. note that "the amount of polymeric organic matter commonly found in __-»-'-•-, M
natural aqueous systems is apparently enough to effect the partitioning of very jhydrophobic...contaminants such as PCBS..." making the observed partitioncoefficients "highly dependent" on the organic carbon concentration.7 |
WASP4 provides the opportunity to simulate several sediment classes, %including DOC. At least two classes would be needed for PCB modeling besides *DOC, generally representing fine silt particles which are filterable but do not «,
312152
settle out in the upper Hudson, and heavier settleable particles. (Heaviermineral particles are not expected to play an important role in PCB transport.)
At present, data are rather limited on levels of non-filterableorganic matter in the Hudson.
5.1.4 Evaluation of Degradation and Volatilization Rates
Degradation and volatilization rates may vary considerably amongcongeners. It will not be feasible to model all the PCB congeners present in theHudson system. However, we will plan to model the behavior of a representativeselection of congeners typical of Aroclor 1242, Aroclor 1254 and their breakdownproducts.
Rates of natural degradation of PCBs in the sediments of the Hudsonhave been the subject of considerable debate. In the Thompson Island Poolsediments, at least, it is clear that some degree of anaerobic dechlorination ofvarious congeners is taking place. This may be an important source for theloading of mono- and dichlorobiphenyls into the water column. However, it is notyet clear if, or to what degree, these processes represent a significantreduction in mass of PCBs in the sediments.
A significant amount of laboratory scale work has been conducted onthe degradation of PCBs. However, extrapolation of these results to fieldconditions is fraught with uncertainty. Therefore, we will attempt to verifydegradation rates in the field. The primary source of information for this willbe congener analysis of sediment cores. Shifts in congener patterns resultingfrom dechlorination have been reported by previous authors.8 While there is nodoubt that some reductive dechlorination does take place in the sediments, theaverage rate is difficult to determine and may be fairly slow. Further, the
TBopp, R.F., HJ. Simpson and B.L. Deck. 1985. "Release of Polychlorinated Biphenyls from ContaminatedHudson River Sediments.* Final Report NYS C00708 to NYSDEC, Albany, NY. Lament Doberty GeologicalObservatory of Columbia University, Palisades, NY ; Brown, J.F., R.E. Wagner, and D.L. Bedard. 1988. PCBdechlorination in Hudson River sediment. Science 240:1675-1676.
5-7 TAMS /Gradient
312153
process may largely involve the reduction of more reactive congeners and -accumulation of more recalcitrant congeners. Convincing evidence must thus beobtained to attribute- anaerobic dechlorination as a significant means of mass ]loss of buried PCBs.
*«i
In investigating this problem we will continue the work of examiningcongener patterns in the hotspot sediments. If possible, this will be done i& *both low resolution sampling and in intact, dateable high resolution cores, which *would yield an approximate time scale for the reduction process. Finally, we -will attempt to reproduce locations of earlier analyzed and archived cores. This A
should enable direct comparison of the status of PCBs at two different points in!r
time. #
Aerobic degradation takes place in the oxygenated sediments and in flithe water column. Rates in the sediment are again difficult to determine, and
difficult to distinguish from differential desorption of lighter chlorinated |congeners. However, the net effect of these processes can be observed in the ^sediments. For degradation in the water column, our initial approach will be to .._..investigate literature evidence on aerobic degradation rates in order to 4determine if this phenomenon is significant in terms of the PCB mass balance.Additional work to quantify degradation will be needed only to the degree that |model results are sensitive to this rate.
IVolatilization is known to play a significant role in the depletion **
of PCBs in the water column. Photolysis may also be an important loss mechanism r\(vid Lake Ontario TCDD work). Our present plan is to rely on published and -theoretically derived values of these parameters. As with the aerobic r
degradation rates, model results would be subjected to an uncertainty analysis,which might suggest the need for further research on these parameters, if resultsare particularly sensitive to them.
5-8 TAMS/Gradient
312154
^̂ 5.1.5 Uncertainty Analysis
An Important part of the mass balance will be the assessment ofuncertainties. Confidence bounds will be developed for each significant storeand flux in the mass balance. The cumulative impact of uncertainties will beassessed through implementing the mass balance model in a Monte Carlo simulationmode.
5.2 Component 2 - Biotic Effects/Fish Population Response
The previous section covers methods to estimate the long-term,steady-state environmental distribution of PCBs in the Hudson. This in itselfdoes not yield decision criteria for the Reassessment: such criteria depend onanalysis of risks, and human health risks are presented primarily through PCBlevels in the fish population. Thus, the Reassessment requires us to estimatefuture concentrations in the fish population. PCBs may also present directecological risks to the fish population. To accomplish this we propose the useof a correlation analysis approach which relates observed fish PCB burden
( simultaneously to concentrations in both water and sediment.
A number of possible strategies were considered for the predictionof PCB burdens in the fish population, from the very complex to the very simple.A complex approach, which has previously been tried in the Lower Hudson9,constructed a detailed model of PCBs in the food web, thereby enabling predictionof bioaccumulation. The other extreme is to assume a simple equilibriumpartitioning approach, which attempts to relate the concentrations in targetspecies to PCB levels in either the water or sediment, via a bioaccumulationfactor (BAF). The approach proposed is related to the BAF approach, but does notrequire simplistic full equilibrium assumptions. This constitutes a multimediacorrelation analysis, which can be thought of as a multivariate BAF which doesnot impose the assumption of equilibrium between the sediment and water
9Thomann, R.V., J A. Mueller, R.P. Winfield and C.-R. Huang. 1989. "Mathematical Model of the Long-term Behavior of PCBs in the Hudson River Estuary." Report prepared for The Hudson River Foundation, June1989. Grant Nos. 007/87A/030 and 011/88A/030.
5-9 IMS/Gradient
312155
components. It should be noted that the correlation approach implicitly accountsfor all forms of uptake by the fish, from direct partitioning to food chainaccumulation, although only the net effect is observed.
In the following paragraphs we will provide a detailed discussion ofthe characteristics and weaknesses of both the food web and equilibriumpartitioning approaches. This will be followed by a description of the proposedcorrelation analysis.
5.2.1 Food Web Model Approach
The food web approach to predicting PCS bioaccumulation in the fishpopulation is intuitively promising, because it appears to provide a global,causal description of PCB dynamics in biota. However, the approach has manydifficulties. Our conclusion is that this approach would involve a high expense,yet not result in a clear increase in ability to predict PCB burdens. It istherefore not justified as cost effective for the Reassessment.
Essentially, the food web approach requires the prediction of PCBbioaccumulation of most species in the system, not just target species. Thisnecessarily includes many lower trophic level species for which there is nohistorical database of PCB concentrations. Further, the predictiyje ability ofa food web model is dependent on an accurate description of population dynamics -again an area where a historical database is lacking. Acquiring adequate datawould require a massive sampling program, one that would necessarily extend overseveral years in order to remove the effects of natural year to year variability.
The difficulties inherent in the food web approach are quite evidentin the work of Thomann et a7. Their aim was predicting PCB status in the stripedbass population. For this undertaking they had the advantage of detailedpopulation dynamic studies conducted for the licensing of power plant waterintakes. However, other data were lacking and numerous detailed assumptions hadto be made considering the relative importance of different food sources indifferent age classes of the striped bass population. An important shortcoming
5-10 TAMS /Gradient
312156
seems to be that the benthic pathway Into the food chain 1s essentially Ignored.Application of the model resulted In a prediction that by 1992 the median PCBconcentration in three to six-year old striped bass would be below the PDAthreshold of 2 ug/g (wet weight). Although 1992 data are not yet available, themost recent data suggest that this prediction is unlikely to come true.
5.2.2 Equilibrium BAF Approach
Analysis of the historical database in Phase 1 has provided supportfor the idea that PCB concentrations in the fish population, on a lipid-adjustedbasis, can be reasonably predicted directly from environmental concentrationswithout explicit modeling of population dynamics. The empirical evidence issummarized in Figures B.4-25 (reproduced here as Figure 5.2) through B.4-29 ofthe Phase 1 Report, as well as earlier work of Brown et a/.10 These show astrong linear relationship between summer average PCB concentration in water andlipid-adjusted PCB burden in fish. This suggests that summer average (I.e.,nonscouring) water concentrations provide an excellent predictor of fishconcentrations, via a BAF. The strong relationship observed is even morestriking when it is realized that it is accomplished without the benefit of acongener-specific analysis. Presumably, congener data would strengthen thepredictive ability.
Of course, statistical correlations do not themselves imply eithercausality or the ability to extrapolate to future conditions. It is also clearthat much of the statistical strength of the observed correlations between watercolumn and fish PCB concentrations is due to a few early observations, in whichPCB concentrations in both water and fish were high, while more recentobservations are clustered about a constrained subsection of the line. This doesnot mean that the observed correlation is Invalid; rather, it reflects the factthat concentrations in both fish and water have been relatively stable since1981. Further, we must expect a certain amount of "noise" in any correlation
10Brown, M.P., M.B. Werner, RJ. Sloan and K.W. Simpson. 1985. Polychlorinated biphenyls in the HudsonRiver, recent trends in the distribution of PCBs in water, sediment and fish. Environmental Science andTechnology 19(8): 656-661.
5-11 TAMS/Gradient
312157
based on gross estimates of total RGBs rather than Individual congeners given anyshift in congener pattern over time.
The observations presented in Phase 1 address only the correlationbetween PCB concentrations in water and fish PCB burden. However, sedimentstores of PCBs may also provide an important pathway into biota. In Phase 1 wedid not develop a correlation between fish PCB burden and PCB concentrations insediment, because of a lack of an adequate database: The direct sedimentmeasurement we had for Phase 1 are primarily at two points in time (1978 and1984) and, except for limited data in 1978, confined to a location (the ThompsonIsland Pool) where a contemporaneous database for fish concentrations does notexist. Further, most of the sediment data lack measurements of organic carbonfraction (foe), which is essential to calculating the dissolved and/orbioavailable fraction of PCBs in the sediments.
PCB analysis of dateable, high resolution sediment cores affords anopportunity t,o combine the signals of water column and surface sedimentconcentrations. Unfortunately, most of the core data prior to 1978 does notcoincide with NYSDEC standardized analysis of fish PCB burden. In addition, thelocation of extant high resolution cores does not match the NYSDEC fish samplecollection points. Thus, during Phase 1, it was not possible to examine thevalue of PCB data from dateable cores as a predictor of fish concentrations. Thehigh resolution coring program proposed for Phase 2 will remedy this situation.
For a system in which sediment and water are in equilibrium there isalso a strong theoretical basis for the BAF approach. This is based on theconcepts of equilibrium partitioning and fugacity, which imply, for equilibriumconditions, that a BAF approach should be as effective a prediction tool as anyidentifiable food web model.11
nDi Toro, D.M., C.S. Zarba, DJ. Hansen, WJ. Berry, R.C. Swartz, C.E. Cowan, S.P. Pavlou, H.E. Alien,NA. Thomas and P.R. Paquin. 1991. Technical basis for establishing sediment quality criteria for nonionicorganic chemicals using equilibrium partitioning. Environmental Toxicology and Chemistry 10(12): 1541-1583.
5-12 TAMSI Gradient
312158
The basic argument can be introduced by considering the case of aclosed system, constituting a well mixed body of water with no influx or efflux.In this closed system PCB concentrations in all compartments would be inequilibrium, with the concentration in any one compartment derivable fromobservations in any other compartment via an equilibrium partitioning coeffi-cient. Thus, a univariate BAF can be established from measurements in any singlemedium.
As noted above, for hydrophobic contaminants such as PCBs, it isnecessary to describe a three-phase system, in which PCBs in both sediments andwater column are found in dissolved form, sorbed to particulate matter, andcomplexed with dissolved organic compounds (DOC). Fish may accumulate PCBsthrough partitioning from the water column, through ingestion of sediment, orthrough the food chain, while organisms at lower trophic levels may alsoaccumulate PCBs from both water column and sediments. Describing exactaccumulation pathways is the complex task of food chain bioaccumulation models.For an equilibrated system, sediment pore water PCB dissolved concentrationsmight provide a good index of bioavailability, but it is typically a verydifficult task to separate the dissolved and DOC fractions. Fortunately, forlipophilic compounds in sediments at normal organic carbon contents, thepartition coefficients are such that the mass present in dissolved and DOCcomplexed forms is relatively small compared to the total particulate-sorbedmass. This implies that the dissolved portion can be quite well predicted fromthe sediment-water partition coefficient, regardless of DOC levels. (DOCcomplexed mass is, however, important in predicting total flux out of thesediments.) On the other hand, pore water concentrations will vary significantlyin response to the organic carbon content in sediment, /.e., the fraction oforganic carbon in the sediments on a weight basis (foe). Therefore, sedimentconcentration normalized to foe is the best, readily available predictor ofdissolved concentrations in an equilibrium system.12 This approach is under
12Di Toro et al., op. tit
5-13 IMS/Gradient
312159
consideration by ERA Office of Water for establishing sediment quality J. ;criteria.13
Of course, PCBs may enter the food chain both through the dissolvedphase and through ingestion of particulate matter (the DOC complexed phase maybe largely non-bioavailable, as noted above). As Di Toro et a7. state,"biological effects appear to correlate to the interstitial water concentration.This has been interpreted to mean that exposure is primarily via pore water.However, the data correlate equally well with the organic carbon-normalizedsediment concentration... This suggests that the sediment organic carbon is theroute of exposure. In fact, neither of these conclusions necessarily follow from
vthese data". ?
k
The reason for this surprising conclusion is contained in fugaci- fty,14 or chemical potential theory.15 This holds that the biological activity *of a contaminant is controlled by its chemical potential. As discussed by Di *Toro et a/., if pore water and organic carbon are in equilibrium then the ichemical potentials exhibited by the two phases are equal. "Hence, so long as• ' • • -— --|the sediment is in equilibrium with the pore water, the route of exposure is Jimmaterial. Equilibrium experiments cannot distinguish between different routesof exposure." Thus, in the simplified equilibrium case, it is only necessary to Iestimate the chemical potential in one phase. The question then becomes one ofwhich phase is easiest to measure. Where DOC complexing occurs it is clear that fsediment PCB concentration normalized to organic carbon is the most directly ^measurable index of chemical potential. n
itThe simple BAF approach thus has a strong theoretical basis. The
drawback is that the analysis is based on simplification of reality, which
1AJ.S. Environmental Protection Agency Office of Water. 1991. "Proposed Technical Basis for EstablishingSediment Quality Criteria for Nonionic Organic Chemicals Using Equilibrium Partitioning." August 1991, Officeof Science and Technology, Health and Ecological Criteria Division, Washington, DC.
~v.14Fugacity is a measure of the escaping tendency of a chemical from one phase to another.
^Mackay, D. 1979. Finding fugacity feasible. Environ. Sci. Technol. 13:1218.
5-14 TAMS /Gradient
312160
requires sediment and water column concentrations to be in equilibrium. This islikely not the case in the Hudson River, where the water column does not remainin one place long enough to allow diffusion limited equilibration between PCBsin the sediments and the water-column. The simple, single medium, BAR approachmust thus be modified to account for non-equilibrium conditions.
5.2.3 Correlation Analysis Approach
A correlation analysis approach will be used which will examine therelationship between PCB levels in biota and PCB concentrations in both water andsediment. This is essentially a BAF approach which has been modified to accountfor the fact that full equilibrium partitioning does not occur. This is done byextending the analysis to account for the most significant disequilibrium in thesystem.
In a flowing river, the usual case is that the upper sediment layerand the water column are not in equilibrium with one another. Further, theupper, bioactive sediment zone is typically not in equilibrium with deeper,buried sediments. However, the sediment sorbed PCB concentrations and pore waterPCB concentrations within the bioactive zone should be very close to equilibrium,while in the water column the dissolved and suspended sediment-bound PCBfractions should also be close to equilibrium (except during transient events)although their measurement may be hindered due to a DOC phase. The fact that thewater and sediment compartments are not in equilibrium with each other, but areapproximately internally equilibrated, suggests that the optimal predictors ofconcentrations in biota should be multivariate BAFs, relating body burden to bothsediment and water column chemical potential. Correlating to both removes thedifficulty of the water and sediment not being in equilibrium (which isequivalent to saying that the water concentration cannot be predicted solely fromthe local sediment concentration). It further accounts for bioaccumulationpathways from both water and sediment. Similar to the pure equilibrium case, adistinction may be observable between the water and sediment pathways, but theindividual phase pathways within water or sediment should be indistinguishable.
5-15 TAMS/Gradient
312161
in which, for species i:
Cf = PCB concentration in fish (wet weight)
fl = lipid fraction in fish
Bw « Partial BAF relating fish concentration to water columnconcentration
Csw = PCB concentrations on suspended solids
focw «= organic carbon fraction of suspended solids
Bs = Partial BAF relating fish concentration to upper zonesediment concentration
Cs, - PCB concentration in upper zone sediments (dry weightbasis)
foe. = organic carbon fraction of the sediments
Chiou, C.T. 1985. Partidon coefficients of organic compounds in lipid-water systems and correlations withfish bioconcentration. Environ. Sci. Technol 19: 57-62.
5-16 TAMS/Gradfenf
1The equilibrium partitioning/fugacity arguments set forth by Di Toroet si. also inform us that the best readily measurable index of chemical _potential should be the sediment sorbed fraction normalized to foe, which removes jthe problem of estimating the magnitude of the DOC fraction. This should applyto both sediments and water column. These should be compared to the lipid- 1normalized burden in the organism.16 The correlation analysis will thus be usedto predict fish PCB burdens from future environmental concentrations through ^species-specific relationships of the following form: **
m
312162
• x.̂.. Phase 2 data gathering is designed to allow the examination andtesting of the suitability of this proposed method for predicting future PCBburdens in fish from environmental PCB concentrations. If the method provesfeasible it will be used to assess the likely impact of the various remedialoptions under consideration, as well as the recovery time under No Action.
5.3 Component 3 - Erodibility Analysis
Sediments constitute the major store of PCBs in the Hudson. TheThompson Island Pool is of particular concern, as large quantities of PCBcontaminated sediments were deposited in this reach following the removal of theFort Edward Dam in 1973. PCBs are also stored in depositional areas throughoutthe Hudson below the Thompson Island Oam. However, much of^the contaminatedsediment is currently buried at depth, and not in ready contact with the watercolumn or biota. Stored PCBs in buried sediments affect water column PCBconcentrations only through slow diffusive flux.
_^ The mass balance approach to the analysis (Component 1) addresses{ current and future PCB dynamics in the Hudson given a quasi-steady state
situation for contaminated sediments. This refers to a situation in which asudden change in PCB flux due to extensive scour of currently buried contaminatedsediments does not occur. This appears to fit the observed data on PCB load,where we have noted that the load appears to have stabilized over the years.Furthermore, a significant gain in load, which could be attributed to scour ofcontaminated sediments, is not observed between the upstream and downstream endsof the Thompson Island Pool (see Figure 5.3).
The quasi-steady state approach assumes that introduction of PCBsinto the water column by flood scour is currently a process of relatively minorsignificance which occurs at an approximately constant annual rate. Althoughthis appears to represent the situation observed in recent years, it is notsufficient to assume, without further investigation, that no change in the systemwill occur in response to future major flood events. Therefore, a thirdcomponent must be added to the analysis. This is an assessment of the potential
^X—v..
5-17 TAMS /Gradient
312163
for flood scour of buried, contaminated sediments. This includes the possibilitythat a major flood might reintroduce quantities of now segregated PCBs into thewater column and surface sediment layers available to the water column and biota.
Hence, the objective of Component 3 is to evaluate the probabilityof flood erosion of contaminated hot spot sediments during realistic futureextreme flood events. One result of the analysis will include a map of erosionprobability which can be superimposed on the map of PCB sediment distribution.This will serve to identify the relative risk posed by different PCB hotspots,as well as yielding the overall likelihood of significant remobilization ofburied PCBs. Such a map will also be a guide to planning remediation ofsediments, if necessary. To accomplish this analysis laboratory experiments,field studies, mathematical modeling, and statistical analyses will be necessary.
•K
The map will incorporate statistical techniques to show upper and lower boundsin the critical regions of erosion. The work is divided into two studies,hydraulic and sediment transport/erodibility studies.
5.3.1 Hydraulic Studies
The first requirement is the determination of the maximum hydraulicenergy available for erosion. Phase 1 included analysis to determine the 50year, 100 year, 200 year and 500 year recurrence floods. These flows can berouted through the Study Area and the local water velocities and elevationsdetermined. Local water velocities will determine the shear and sedimenttransport capacity during high flows.
Phase 1 included preliminary efforts at modeling flows in theThompson Island Pool using one- and two-dimensional applications of a link-node
,
model, UASP4. For the purposes of assessing credibility we have determined thatone-dimensional flow routing will be sufficient, and is the appropriate level ofdetail in light of both available calibration data and uncertainties inherent inmodeling sediment properties.
5-18 TAMS /Gradient
312164
s~^- While it would be of technical interest to utilize a computer codewritten to solve a two or three dimensional representation of flow, this effortwould not necessarily result in any improvement in accuracy of the predictions.This is because model results are dependent on representation of the physicalprocess, numerical solution procedure, initial and boundary conditions, andcalibration of parameter values, all of which introduce errors. Therefore, themodel results are also subject to uncertainty, and this uncertainty will increaseif, for instance, the calibration data are inadequate to the discretizationdetail of the model. A detailed review of uncertainty in models is given byBeck."
A classic application of an appropriate type of model for a largeriver system, the Rhine-Meuse estuary, is described by Roelfzema et a/.18 Theseresearchers have used a one-dimensional model to represent areas where thewidth/depth ratio is less than 100. For an area whose width is extremely largethey used a two-dimensional depth averaged model. In regions where stratifiedsalinity distribution is observed, a two-dimensional laterally averaged model was
x—-. utilized. A three-dimensional model was employed to represent the sea-area atthe mouth of the estuary.
The width-depth ratio of the Hudson within the study area is lessthan 100. Therefore, a one-dimensional approach is appropriate to both hydraulicand sediment transport modeling.
5.3.2 Sediment Erodibility
Characterizing scourable areas in the river will depend on the typeof bed material. Certain reaches may be cohesive while, others may be non-cohesive. Therefore, demarcating the Study Area as to whether it containscohesive or, non-cohesive material is important. This will be accomplished
1 Beck, M.B. 1987. Water quality modeling: a review of the analysis of uncertainty. Water Resources Research23(8): 1393-1442.
18RoeIfzema, A., M. Karelese, AJ. Strujik and M. Adriaanse. 1984. "Water Quantity and Water QualityResearch for the Rhine-Meuse Estuary*. Publication No. 325. Delft Hydraulics Laboratory
5-19 TAMS/'Gradient
312165
primarily by the geophysical survey and confirmatory sampling. For the presentpurpose, sediments having more than 10% clay sized particles, (< 4 urn), by weightwill be considered cohesive.19
The critical factor considered in this study is bed erosion. Themechanisms causing bed erosion are different for cohesive and non-cohesive soils.The formulations used to account for erosion are based on the hypothesis that thehydraulic shear stress has to exceed a critical bed shear stress. t*c, forerosion/resuspension to take place. Some of the formulas available in theliterature are tabulated in Table 5.1 for cohesive material. These formulae arematerial and site specific. Therefore, for the cohesive bed material encounteredin the study area, t*c must be determined in the laboratory.
A laboratory set up described in the Sampling Plan (Appendix A) isto be employed to study erosion. This experiment can be used to measure depthsof erosion and critical shear stress at different threshold levels. This is dueto the fact that different threshold levels of erosion can be defined.20 Thecritical shear stress determined in the laboratory will be compared with theformulas available in the literature. The advantages in this technique are: theentire water column is represented and undisturbed sediment core is utilized.
It is intended to fit a statistical distribution for the critical bedshear stress and use this as a model input for the different simulations. Theconcept of a probability distribution for critical stress has been used byEinstein as quoted by Vanoni21 and Partheniades.22 It is felt that thedistribution will vary depending on the type of material leading to differentdistributions being used at different locations. The predefined quantiles and
20Lavalle, J.W. and H. O. Mofjeld. 1987. Do critical stresses for incipient motion and erosion really east?ASCE Journal of Hydraulic Engineering 113(JHY 3)(3): 370-385.
^Partheniades, E. 1965. Erosion and deposition of cohesive soils. ASCE Journal <of Hydraulic Engineering104(HY2): 279-283.
5-20 IMS/Gradient
312166
I:their upper and lower limits could also be used as model inputs in preparing theprobability maps.
No laboratory experiments will be conducted to determine criticalshear stress for cohesionless material. Formulas available in the literaturewill be used to determine values. As there are numerous formulas available todetermine critical shear stress for cohesionless sediments they have not beensummarized in a table. However, field studies will be conducted to determine thecomposition of cohesionless material on the bed.
To summarize, Component 3 encompasses:
(a) Mathematically modeling hydraulic flows,
(b) Conducting experiments to determine physical properties ofsediment,
(c) Conducting laboratory experiments to determine statisticaldistribution for the critical shear stress,
(d) Identifying areas of erosion/sedimentation,?•
(e) Employing a statistical distribution of critical shear stressto provide upper and lower probability limits for the hazardprediction.
5-21 TAMS/'Gradient
312167
PAGE INTENTIONALLY LEFT BLANK
Ii
f]
312168
Table 5.1Summary of Critical Stress Formulae for Cohesive Sediment
ReferenceAriathurai, R. and K. Arulanandan. 1978. Erosionrates of cohesive soils. ASCE Journal of HydraulicEngineering 104CHY2): 279-283.
Raudkivi, A.J. 1982. "Grundlagen des Sediment-transports*1 , pp.90-91.
Parchure, T.N. and A.J. Hehta. 1985. Erosion ofcohesive sediment deposits. ASCE Journal of Hy-draulic Engineering 11KHY10): 1308-1326.
Ourn, quoted by E. Parthem"odes and R.E. Paaswell.1970. Erodibility of channels with cohesive bound-ary. ASCE Journal of Hydraulic Engineering96<HY3>: 755-771.
Nether, B. 1989. "Untersuchungen zunResuspens ionsverha I ten von Astuarschwebstoff.GKSS 89/E/38. GKSS Research Centre, Germany.
Smerdon and Beasley, quoted by Partheniades andPaswell 1970. Erodibility of channels with cohe-sive boundary. ASCE Journal of Hydraulic Engineer-ing 96(HY3): 755-771.
Teisson, C. 1991. Cohesive suspended sedimenttransport: feasibility and limitations of numeri-cal modeling. Journal of Hydraulic Research 29(6):755-770.
PCB Mass Transport: Corrected Mean Method Estimates
5.000 -r
4.000
3.000 --
PCB Load(kg/yr)
2.000 --
1.000
0
Fort Edward
SchuylerwHIe
Waterford
Waterford: Bames (1987)
1977 1978 1979 1980 1981 1982 1983 1984Calendar Year
1985 1986 1987 1988 1989
to
6. BASELINE HUNAN HEALTH RISK ASSESSMENT
The Phase 1 Report provided a preliminary baseline human health riskassessment and indicated that there was an unacceptable human health riskassociated with eating fish from the Upper Hudson River. To perform a finalbaseline risk assessment in Phase 2, additional data will be utilized, e.g., 1990and 1991 fish data, sediment, water-column and air monitoring data collected inPhase 2, and relevant new information on PCB health risks, if any.
6.1 Study Area B
The preliminary human health risk assessment for the Upper Hudson waspresented in the Phase 1 Report. Where updated site-specific information can beobtained, it will be incorporated into the final risk assessment. Thisinformation falls into two categories: exposure assessment and toxicityinformation, as described below.
6.1.1 Exposure Assessment
6.1.1.1 Fish Consumption
The Phase 1 preliminary human health risk assessment adopted theaverage recreational fish consumption value of 30 g/day that is recommended bythe USEPA for the fish consumption pathway. The Phase 2 baseline assessment willevaluate whether there are adequate data to justify a different, site-specificor region-specific, e.g., northeast, value for fish consumption that would applyin the Hudson River area in the absence of a fishing ban. Additionally, thePhase 2 human health risk baseline assessment will provide a discussion of thespecific population that is targeted by the intake estimate, e.g., whether it isappropriate to target recreational or subsistence anglers, both in the absenceof a fishing ban.
6-1 TAMS/Gradient
312173
6.1.1.2 Exposure Point Concentrations in Fish
The Phase 1 preliminary human health risk assessment relied on fishdata collected through 1988. NYSDEC fish sampling data for 1990 will beavailable for Phase 2. These data, along with any data available for 1991 and1992, will be used to refine the estimates of current and projected, future PCBconcentrations in fish.
During Phase 1 exposure point concentrations for PCBs in fish fromthe study area for the Upper Hudson were calculated without differentiating amongspecies. During Phase 2, the possibility of refining the estimates of exposurepoint PCB concentration in fish to reflect inter-species variability will beevaluated. This evaluation will include the possibility of establishing anexposure point concentration specific to individual fish species caught by UpperHudson fishermen and the relative frequency with which these particular speciesare consumed.
Human uptake of PCBs from fish may also be affected by handling offish following capture from the river. Specifically, as discussed in the Phase1 Report, cooking practices may affect the final concentrations of PCBs in fishflesh prior to its consumption. The Phase 2 assessment will determine whetherthere are new and adequate data available to determine confidently an appropriateadjustment factor to account for the effects of cooking.
6.1.1.3 Uncertainty Analysis
In Phase 2, a quantitative uncertainty analysis using Monte Carlosimulation techniques will be conducted. This analysis will provide anindication of appropriate upper-bound exposures to PCBs from the consumption ofHudson River fish and take into account components of uncertainty such as fishspecies, fishing preference, location within the river, fish consumption, futurePCB levels in fish and other exposure factors.
6-2 TAMS/Gradient
312174
6.1.2 Toxicity Assessment
6.1.2.1 Carcinogenic Toxiclty
The Phase 1 preliminary human health risk assessment used aCarcinogenic Slope Factor (CSF) of 7.7 (mg/kg-d)'1 to estimate the cancer riskassociated with exposures to PCBs from the Hudson. This, value was applied tototal PCB exposure. Toxicity studies upon which this Slope Factor is based wererecently reevaluated by the Institute for Evaluating Health Risks (IEHR). Theresults of the IEHR Reassessment may affect the estimated CSF for PCBs. TheOffice of Research and Development (ORD) of USEPA is considering the newinformation provided by the IEHR Reassessment to determine its impact on the CSF.Should the ORD determine that an adjustment of the CSF is appropriate in lightof the new information, the new CSF will be incorporated into the Phase 2 humanhealth risk assessment. If USEPA establishes separate CSF values for distinctAroclor mixtures or to account for degree of chlorination, this approach will beadopted to determine cancer risks from PCB exposures.
6.1.2.2 Non-Cancer Toxicity
The Phase 1 preliminary human health risk assessment evaluatedpotential risks from non-cancer toxicities of PCBs by using an interim ReferenceDose (RfD) value that had been reviewed by USEPA, but was not promulgated. TheEnvironmental Criteria Assessment Office (ECAO) of USEPA is currently evaluatingavailable non-cancer toxicity data on PCBs to determine whether the data supportpromulgation of .an RfD. This evaluation should be completed prior to thecompletion of the Phase 2 human health risk assessment. If available, the newRfD or non-cancer toxicity endpoints will be incorporated into the assessment.Should the ECAO fail to establish an RfD for PCBs, then an evaluation of thepotential non-cancer toxicities associated with exposure to PCBs in the HudsonRiver will not be reported.
6-3 TAMS/Gradient
312175
6.2 Study Area C
A complete human health risk assessment for the Lower Hudson (StudyAreas C and D), incorporating identification of all PCB sources and exposurepathways, is complicated by the large geographic area and sources of PCBs otherthan the Upper Hudson (Study Area B) that contribute to PCB levels found insediment and fish. Efforts will be limited to Area C where the effects ofsources other than those from the Upper Hudson are less extensive than in Area0.
rI Efforts in Study Area C during Phase 2 will be directed to: characterizing better the relative magnitude of the Upper Hudson PCB sourcei compared to other sources in the Lower Hudson. Potential exposures and
concomitant risks, as a result of river-borne PCBs in this section of the riveri will be evaluated with a focus on fish and water consumption (Poughkeepsie water
supply).
6-4 TAMS/Gradient
312176
7. BASELINE ECOLOGICAL RISK ASSESSMENT
The Phase 2 baseline ecological risk assessment will adhere tocurrent USEPA Superfund guidance for ecological risk assessment1 and incorporatethe assessment process outlined in the recent ECO Update2 for ecologicalassessments within the Superfund program. Phase 2 efforts will build upon thePhase 1 interim assessment and quantify, where possible, ecological risks andimpacts associated with the presence of PCBs in the Hudson River.
An ecological assessment will be performed for the freshwater aquaticenvironment of the non-tidal and tidal portions of the Hudson River from BakersFalls (RM 195) to approximately RM 75, f.e., Study Area B and the majority ofStudy Area C. This ecological study area includes the spawning regions of mostanadromous fish species in the Hudson River as well as a number of other habitatsconsidered to be of special importance as defined by NOAA, DOI, NYSDEC, andUSFWS. The more saline zones of the Hudson River from River Mile 0 to thegeneral vicinity of the salt front at approximately RM 55 and the transitionalzone from RM 55 to RM 75 are not included. While PCBs occur in these zones, thepresence of additional sources complicates determining the relationship betweenenvironmental PCB levels and the Upper Hudson source areas considered forremediation.
The freshwater region of the Hudson River was selected for twoprimary reasons. First, the PCBs in this section of the Hudson can be linkeddirectly to Upper Hudson discharges and are likely to represent the greatestecological risk posed by PCBs within a significant portion of the Hudson River.Second, the freshwater region can be viewed as a more ecologically consistentportion of the Hudson River compared to the complex ecological mosaic indicativeof either the transition or more marine zones. Although the importance oftransition and marine zones is widely recognized, the ability to characterize
1 USEPA. 1989. "Risk Assessment Guidance for Superfund. Volume II: Environmental Evaluation Manual."Office of Emergency and Remedial Response, USEPA: Washington, DC. Interim final, March 1989.
2 USEPA. 1991. Ecological assessment of Superfund sites: an overview. ECO Update 1(2). Office of SolidWaste and Emergency Response, USEPA: Washington, DC
7-1 TAMS /Gradient
312177
ecological risks in the saline region of the river is beyond the scope of thisassessment. Furthermore, the ability to characterize ecological risk will bemore clearly ascertained without the added component of salinity, which causesincreased spatial heterogeneity within the Hudson River.
Phase 2 will carry forward and refine elements of the Phase 1 interimassessment. The principal tasks of the assessment are summarized below.
• Site Characterization and Identification of EcologicalReceptors. Receptors include benthic invertebrates, fishspecies, keystone species, and shoreline birds and mammalsthat may be exposed to PCBs associated with existing condi-tions. This effort was initiated in Phase 1 and will beexpanded downriver to RM 75.
• Exposure Assessment. Exposure pathways, the routes by whichecological receptors may be exposed to PCBs, will be examinedand exposure point concentrations will be quantified.
• Toxicity Assessment. Ecological assessment endpoints will bedefined and toxicity data describing the measured effects ofPCBs will be evaluated. The Phase 1 interim assessmentexamined toxicity endpoints such as reproduction, growth,survival, etc. and reviewed literature describing harm toselected species. Toxicity information gathered in Phase 1will be expanded and enhanced in conjunction with reconnais-sance surveys.
• Risk Characterization. This requires combining the aboveevaluations and quantifying, where possible, risks to selectedecological receptors or indicator species.
• Evaluation of Uncertainties. This effort involves assessingthe uncertainties of different types of test data and limita-tions of the various methods utilized to assess ecologicalrisk.
The ecological risk assessment will rely upon a weight of evidenceapproach, supported by literature reviews, reconnaissance surveys and anevaluation of chemical analytical data relative to environmental benchmarks. Asillustrated in Figure 7.1, the ecological risk assessment process is dynamic andincorporates a multidirectional flow of information among its components. Forexample, the problem formulation, exposure assessment and ecological effects
7-2 IMS/Gradient
312178
, f^ assessment all share common elements, such as receptors. The entire ecologicalassessment process set forth by the USEPA (Figure 7.1) recognizes the necessityof evaluating many lines of evidence, e.g. weight of evidence, in order tointerpret and characterize adequately ecological risk.
7.1 Ecological Study Area Description and Characterization
This subtaskwill expand upon the characterization performed in Phase1, described characteristics pertinent to ecological receptors and the presenceof PCBs in media to which these receptors may be exposed. Physical/chemicalconditions will be reviewed. The summary of aquatic and surrounding terrestrialhabitats will include those areas identified as Hudson River Reserves by NOAA orconsidered by NYSDEC, USFWS, DOI and NOAA to be of special interest. Asrecommended in USEPA guidance, habitats that "are unique or unusual or necessaryfor continued propagation of key species" will also be described.
The nature and composition of aquatic and terrestrial communitieswill be identified in greater detail than in the Phase 1 Report. In order toprovide qualitative field verification of the types of habitats and communitieswithin or near the ecological study area, a reconnaissance survey of selectedshoreline areas will be conducted. NYSDEC, NOAA, USFWS, and DOI representativeswill be consulted prior to the initiation of the survey. This effort is expectedto provide more site-specific observations regarding the condition of thehabitats and species. A more detailed description of the reconnaissance surveyis presented in the Phase 2 Sampling Plan (Appendix A).
7.2 Problem Formulation
During Phase 1, the basic framework for the ecological assessment wasformulated, I.e. identification of exposure pathways, ecological receptors,endpoints of concern, and reported ecological effects. This framework will beexpanded and refined in Phase 2.
7-3 IMS/Gradient
312179
The ecological receptors identified in Phase 1 will be reconsidered.A final species list, comprising various habitats and trophic groups representinga reasonable cross section of the major functional and structural components ofthe site, will be chosen and presented to NYSDEC, NOAA, USFWS, and DOI forreview.
This approach entails identification of a limited number of species,representing major trophic levels and species for which toxicity information isavailable or measurable. Information concerning feeding habits, life histories,habitat preferences, trophic status, migratory habits, reproductive patterns andother attributes influencing exposure or sensitivity to PCBs will be evaluated.Every effort will be made to include as many species as possible from the listswhich will be provided by the various state and federal agencies. Nevertheless,USEPA guidance indicates that the ecological risk assessment must focus on alimited number of receptors in order to develop a "reasonable and practicalevaluation."
In the Phase 1 Report, ecological effects of PCBs reported in thescientific literature were summarized and compared to PCB levels. A variety ofassessment endpoints, such as reduction in growth, impaired reproduction, andmortality were reported in these studies. Additional data to be reviewed are:USEPA's Ambient Water Quality Criteria (AWQC) documents and supporting studies;Aquatic Toxicity Information Retrieval (AQUIRE); fish or wildlife consumptionadvisories issued by NYSDOH; and published toxicity studies.
7.3 Exposure Assessment
The exposure assessment will characterize exposure point concentra-tions, which are needed to compare against toxicity assessment endpoints.Sediment, water column, fish and invertebrate PCB data in the TAMS/Gradientdatabase will be used to refine exposure point PCB concentrations. Exposurepoint concentrations will be based on both measured data and fate and transportmodels (see Section 5). For example, estimates of future PCB levels in fish will
7-4 TAMS/Gradient
312180
•.,-—-- be based on PC6 bioaccumulation from both water and sediments, accounting fornon-equilibrium between these media.
7.4 Ecological Effects Assessment
Toxicity data for selected, or similar indicator species will beexamined through literature reviews. Species similar to selected study areareceptors may be substituted in the event toxicity studies are unavailable forthe identified receptors. The toxicity assessment provides the link betweenconcentrations of PCBs within the ecological study area and observed ordemonstrated adverse effects in receptors. The reconnaissance surveys willenhance this effort by confirmatory field evidence obtained on ecological effects(e.g., absence of species normally occurring in the study area, reduction inspecies richness, etc.) Literature reviews will provide information on thespecific dose-response for the selected receptors. Important bibliographicsources to be consulted include the AQUIRE database as well as databasesavailable through Dialogue Information Services, e.g., Pollution Abstracts,
.—, Water Resources Abstracts, Environmental Bibliography.
7.5 Risk Characterization
This component will involve interpretation of the results of theexposure assessment and comparison to the ecological effects assessment. Avariety of techniques will be used to present both qualitative and quantitativerisk characterizations. As indicated previously, a weight of evidence approachwill be used to characterize risk. This approach will utilize the combinedinformation generated from literature reviews, reconnaissance surveys andevaluation of chemical analytical data relative to environmental benchmarks.
A Toxicity Quotient (TQ) or, if data are available, an Analysis ofExtrapolation Error (AEE), will be calculated for the indicator species. The TQmethod involves comparing an exposure point concentration to a benchmark, suchas a toxicity endpoint. Values of TQ exceeding one are considered to indicatethe potential for adverse effects. The method assumes that the toxicity
1"""̂ ***'S,_
7-5 TAMS/Gradient
312181
benchmark adequately reflects the assessment endpoint. This assumption is mostreliable when toxicity tests have been performed for site-specific species orwhen scientific literature values closely reflect site conditions and species.The AEE method calculates the probability that an exposure point concentrationwill exceed the toxicity endpoint rather than comparing them arithmetically asin the TQ.3
Uncertainty analyses of the exposure point concentrations, toxicityendpoints, and exposure pathways will be performed. Quantification ofuncertainty is directly incorporated into the AEE3, but is not directly addressedin the TQ. If sufficient data are available to conduct a Monte Carlo simulation,uncertainty can be quantified also for the TQ approach.
The risk characterization will conclude with a summary of the risksand uncertainties and an interpretation of the ecological significance of thefindings. This phase of the risk assessment will offer professional interpreta-tions and judgments concerning the magnitude of the overall ecological effectsfrom the contaminated media.
3 Barnthouse, L.W., G. W. Suter II, S. M. Bartell, J. J. Beauchamp, R. H. Gardner, E. Linder, R. V. O'Neiland A. E. Rosen. 1986. "User's Manual for Ecological Risk Assessment." Oak Ridge Nat. Lab., Oak Ridge, TN,Env. Sci. Div. Public No. 2679.
7-6 TAMS /Gradient
312182
JIII
iiii
Figure 7.1Components of Ecological Risk Assessment*
Site Description and CharacterizationBackground and overview of site
* Modified from Figure 1 in ECO Update (USEPA, 1991)
312183
,— 8. Feasibility Study Analyses
The Phase 1 Report presented general response actions and potentialclean-up technologies and process options for PCB-contaminated sediments in StudyArea B. Engineering analyses and treatability studies will be performed in Phase2 for utilization in the Phase 3 Feasibility Study.
8.1 Sediment Volumes and Areas
During Phase 2 the areas and volume of sediments within Study AreaB subject to possible remedial action will be identified. Geophysical survey andconfirmatory sampling data from Phase 2 will be used to identify likelydepositional areas within the various reaches of the river and will, in turn,enable computation of the contaminated sediment volume. Together with thehistorical and recent or planned PCB analyses of the sediments, identificationof approximate areas of sediment subject to possible treatment, i.e. sedimentwith PCBs exceeding preliminary remedial action criteria, will be made. The
^^ volume of sediment requiring treatment will also be analyzed in terms of PCBconcentrations and current and future availability to the water column and biota.A map of potential remediation areas and sediment volumes will be prepared to aidin the evaluation of remedial alternatives.
8.2 Technology and Process Option Screening
During Phase 1, a number of established and innovative technologieswithin several response action categories were identified. These and potentiallyother technologies will be examined for their implementability. Thosetechnologies that are infeasible to implement will be eliminated from furtherevaluation.
The criterion for elimination of a particular technology or processoption during Phase 2 will be technical feasibility. Technologies or processoptions will be determined to be technically infeasible based on study area-specific factors. Conditions, such as a sediment matrix being incompatible with
8-1 TAMS/Gradient
312184
a technology or process, restricted access of the process equipment to thepossible remediation areas, and other such factors will be grounds to evaluatetechnically infeasible processes. All technologies or processes that are removedfrom further consideration will be documented in the Phase 2 Report.
8.3 Identification and Evaluation of Technology Process Options
Those technologies and processes carried forward for more detailedconsideration will be evaluated based on three criteria:
This screening step will evaluate each process option within the same 'technology type to determine which are most effective. The process option *determined to be most effective will be carried forward in the screening *evaluation for further development. Typically, process effectiveness depends on ,such factors as: 1) ability to handle the range of sediment volumes that could •require remediation; 2) the ability to meet a range of remediation goals; 3)potential impacts to human health or the environment during construction and Iimplementation; and 4) whether the process or technology is proven and reliablefor site-specific contaminants and conditions.
Implementability is evaluated based on both the technical andadministrative ability to implement a technology process. Technologies that aretechnically infeasible would not be considered implementable, so this screeningstep typically focuses on administrative factors. Administrative considerationsinclude any permits, availability of treatment or storage and disposal serviceswithin the vicinity and the availability of technology vendors.
Relative capital and operation and maintenance (O&M) costs, ratherthan detailed estimates, are used for this evaluation. An evaluation is made ofhigh, moderate, and low cost process technologies at this stage.
8-2 TAMS/Gradieut
i
312185
8.4 TreatabHtty Study Literature Assessment
During Phase 1, a number of technologies were evaluated to assesstheir suitability for remediating the Upper Hudson's contaminated sediments.Technologies considered during Phase 1 included those associated with responseactions not requiring sediment removal as well as technologies that would becomponents of actions involving sediment removal and treatment. Part of theprogram to be accomplished during Phase 2 will be to evaluate experiences atother Superfund sites where contaminated sediments are either being remediatedor are about to undergo remediation. In addition, considerable developmentalactivity has been occurring within the private sector and by federal agencies onsystems and technologies that treat contaminated soils; these developments werereviewed during Phase 1 and that review will be updated during Phase 2. Finally,several comments were received on the Phase 1 Report related to treatmenttechnologies and these also will be further evaluated.
8.4.1 In Situ Remediation
Technologies in this category include engineered approaches tostabilize or cap sediments so that sediment-bound contaminants are not scouredand released to the water-column. The geophysical program described earlier inthis work plan will generate significant new data describing the distribution andphysical characteristics of contaminated sediments. That information willprovide the basis for further evaluation of in situ engineered solutions; nospecific treatability studies are envisioned with regard to in situ remedialresponse actions, such as capping and/or stabilization of sediments.
Alternatively, in situ treatment of contaminants may be accomplishedthrough bioremediation whereby natural biodegradation processes are enhanced bymanipulation of environmental conditions conducive to microbial activity.Bioremediation was discussed in the Phase 1 Report and it was reported that, asof that time, no full scale in situ programs had been conducted using thosetechniques. It is expected that the General Electric Hudson River Research Study(HRRS) will provide the most relevant data on the viability of In situ treatment.
8-3 TAMS/Gradient
312186
Consequently, its results will be reflected in the Phase 2 Report and the finalFeasibility Study. In addition, analysis of historic.and recent sediment coreswill be useful in assessing rates of natural biodegradation. No furthertreatability studies directed at bioremediation are planned during Phase 2.
8.4.2 Thermal/Chemical/Physical Sediment Treatment Systems
The Phase 1 Report identifies a number of technologies that maysuccessfully treat the river's contaminated sediments, if they are removed(dredged). Included in the technologies are solvent extraction, dechlorination,and incineration systems. Once a status update has been obtained for thesesystems as discussed above, a limited number will be selected for bench orlaboratory scale analysis to determine their general performance characteristicson actual river sediments. Using data from the geophysical program, representa-tive samples of river sediments will be collected and shipped to vendorfacilities for treatability testing; duplicate samples will be independentlyanalyzed to verify chemical and physical properties of the shipped materials.The treatability program is expected to provide information relevant to handlingand dewatering of sediments, extractability of the PCBs by various solvents andreacting agents, and the temperature at which PCBs will be released from thesediment matrix. Treatability Study Plans for each technology including QA/QCand deliverable requirements will be prepared prior to performance of thesestudies.
8.5 Sediment Disturbance Impact Assessment
Before any of the physical/chemical/thermal treatment technologiescan be applied, it will be necessary to remove or disturb the contaminatedsediments. Dredging or caisson installation may disrupt the river's ecosystemby both resuspension of bottom materials and disturbance or removal of aquatichabitat. Response actions involving dredging of sediments have been studied forthe Hudson River and widely applied at other Superfund sites. The ramificationsof the processes will be evaluated in Phase 2 and will continue to be evaluatedin Phase 3. Data for the assessment will be obtained from the geophysical
8-4 TAMS/Gradient
312187
program. In particular, the contaminant/sediment distribution maps generated bythat program are expected to provide a relatively complete characterization ofthe material that would have to be removed to achieve various remedialobjectives.
Among the outputs of the geophysical program will be maps of sedimentdistribution patterns illustrating various classes of bottom materials. Usingboth the maps and laboratory data, an engineering assessment will be performedof sediment disturbance impacts. Factors that will be considered includepresence of obstructions such as boulders and cobbles, the continuity ofcontaminated sediment formations composed of removable materials, the extent towhich contaminants adhere to homogeneous formations of suspendable sandy/siltymaterials, and the problem of access for equipment. Estimates of sedimentresuspension particularly during dredging will be made using published data forvarious dredging systems, assuming they would operate on the same type ofmaterials that would be removed from the Hudson as part of a remedial action.
8-5 TAMS/Gradient
312188
PAGE INTENTIONALLY LEFT BLANK
8-6 TAMS/Gradient
312189
APPENDIX A
PHASE 2 SAMPLING PLAN
312190
PAGE INTENTIONALLY LEFT BLANK
312191
tAPPENDIX A
PHASE 2 SAMPLING PLAN
A.I Introduction
In accordance with the Scope of Work for the Reassessment, a Phase2 investigation will be performed to characterize and analyze further siteconditions. The Phase 2 program is based on the review and synthesis of theinformation collected and reported in the Phase 1 Report entitled "InterimCharacterization and Evaluation" (August 1991) and on the input of the HudsonRiver Oversight Committee and the participants in the Community Interaction Plan.The various data needs and the major data collection tasks have been discussedin the Phase 2 Work Plan to which this sampling plan is attached.
The Phase 2 sampling effort consists of two parts, Phase 2A, whichbegan in December 1991 and Phase 2B, which will begin upon approval of the Phase2 Work Plan. For each phase, a Sampling and Analysis Plan/Quality AssuranceProject Plan is required and is reviewed by USEPA-^egion II. The Phase 2ASAP/QAPP has already been approved by USEPA; the Phase 2B SAP/QAPP, describingin detail the protocols for the sampling program presented here, will besubmitted upon approval of this document.
The description of the Phase 2A sampling tasks was the subject of thePhase 2A Sampling Plan (September 1991). Because the scope of some tasks hasbeen subsequently adjusted and refined, these changes are described here. ThisSampling Plan also describes the Phase 2B sampling tasks. A summary of the workto be performed for all tasks in Phases 2A and 2B is presented in Tables A. 1.1and A. 1.2.
A-l TAMS /Gradient
312192
A.2 Phase 2A Sampling '
A.2.1 Establishment of Control Points for Precision Navigation (
The success of the Phase 2 program is dependent upon precisenavigation in the Hudson River. The ability to compare results among the varioussampling tasks is contingent upon knowing precisely all sampling locations in theHudson. For this reason, a system of shoreline points will be established toenable precision navigation, nominally accurate to one meter. To the extent thatshoreline control points still exist from previous investigations, these will beutilized. It is anticipated that for the geophysical survey of Upper Hudson,between the Bakers Falls Pool and the Lock 4 Dam about 20 shoreline points willneed to be established, either from existing points from prior investigations,or from appropriate surveying techniques, with about one control point every one ]and one-half miles.
1
For the high resolution coring locations that do not fall within the •>geophysical survey area, additional shoreline control points will need to be - „established. Because of the distance between the individual coring locations, ]one control point will be established for each coring location. For the LowerHudson, 12 control points will be required. For the Upper Hudson, four to five 'additional control points will be required.
All shoreline points will be referenced to the N.Y.S. Plane J
Coordinate System, North American Datum (NAD27), the historic reference system jfor most previous surveys. Vertical data will be referenced to the NationalGeodetic Vertical Datum of 1929 (NGVD 1929). This task, begun in December 1991,will continue in spring 1992.
A.2.2 Geophysical Surveys from the Bakers Falls Pool to the Lock 4 Dam
This task, using geophysical measurement techniques, will involve thestudy of river bottom sediment textures, bathymetry, topography and sedimentthickness in the most PCB-laden region of the Hudson. These data will be used
A-2 IPMS/GrckSent
312193
• /«—K to construct a computer-generated map of the river bottom conditions, effectivelyproviding an aerial photograph type perspective of the river bottom conditions.The information will be calibrated and confirmed by sample collection describedin a following section. The many important potential uses of this informationare to: provide a basis for the selection of additional coring locations inPhase 2B, identify areas of river sediment susceptible to scour, and estimatevolumes of mobile sediments, among others.
The geophysical surveys proposed here include side-scan sonar,bathymetry and single frequency sub-bottom profiling. Plate A.I is a map of theUpper Hudson, showing the areas to be surveyed as a part of this effort. Aboutthree quarters of the survey will cover areas believed to contain PCB hot spotsor remnant deposits. The remaining survey effort, more exploratory in nature,will examine areas that would appear to represent depositional conditions similarto those found at the hot spots, but not delineated as hot spot areas. Thiseffort began in December 1991 and will continue this spring. Following are briefdescriptions of the individual sub-tasks to be completed as a part of the
: s*-^. geophysical survey effort.
A.2.2.1 Bakers Falls Pool to River Mile 182
1. A side scan sonar survey of all accessible areas in thisregion of the river will be conducted using 100 and 500 kHzsonar. Data on the river bottom will be collected at rela-tively high resolution, covering a swath roughly 75 m across.The swath width may be adjusted in the field to allow forvariations in the width of the river at the discretion of thefield scientists. The survey lines will generally runparallel to the direction of river flow. Each survey linewill be roughly one to two miles long, depending on naviga-tional constraints. Each of these lines will be separated byabout 40 m, yielding bottom coverage for the river of about150 percent. This method will ensure that the edges of eachswath overlap and that the bottom of the river will be
v—vA-3 T'AMSy'Gradient
312194
completely surveyed. Figure A.2.1 is a schematic showing theapproximate layout of the survey grid. The survey of theThompson Island Pool will cover the entire navigable areabetween the former dam site at Fort Edward and the ThompsonIsland Dam. This survey will cover 20 of the 40 previouslydefined hot spots. The survey of the Bakers Falls Pool willcover the area behind the Bakers Falls Dam to roughly onequarter-mile upstream. The survey between the Thompson IslandDam and River Mile 182 will cover all accessible areas in thisregion and an additional 15 of the 40 previously defined hotspots. The survey coverage of the river bottom in the lastregion may be somewhat limited because of the unknown andpotentially shallow water depths in some areas of this region.In addition to the areas described above, the survey will alsocover the river area between Bakers Falls and the former damsite at Fort Edward. This last survey area represents anaddition to the areas originally listed in the Phase 2ASampling Plan.
Navigation will be nominally accurate to 1 m andreferenced to the N.Y.S. Plane Coordinate System, NorthAmerican Datum (NAD27).
Vertical data will be referenced to the NationalGeodetic Vertical Datum of 1929 (NGVD 1929).
Data from the bathymetry and sub-bottom profilingequipment will be collected concurrently with the side-scan sonar data, except where limited water depthsrequire the use of a smaller boat. In these cases, datawill be collected on separate survey runs.
2. A bathymetric survey will be conducted for the areas definedfor the side-scan sonar survey. The survey will consist ofsurvey lines about 150 m apart perpendicular to the directionof flow. These data will be used in conjunction with thebathymetry data obtained during the side scan sonar survey,
A-4 TAMS/Gradient
312195
effectively generating a wire net of coverage of the riverbottom.
Navigational and vertical data will be of the samequality as that for the side-scan sonar survey.
3. A single frequency sub-bottom profile survey will be conductedfor all surveyed areas.
Navigational and vertical data will be of the samequality as that for the side-scan sonar survey.Data will be collected concurrently with the bathymetryand side-scan sonar surveys except as noted above.
A.2.2.2 Upper Hudson River from River Mile 182 to the Lock 4 Dam
1. This area was originally proposed in the Phase 2A SamplingPlan. However, the addition of the area between the BakerFalls dam and the former dam site at Fort Edward precludes thecoverage of this area. This change in the geophysical surveyplan will yield essentially continuous coverage from theBakers Falls pool to RM 182.
A.2.3 Confirmatory Sampling for Calibration of Geophysical Surveys
To ensure proper interpretation of the geophysical data to becollected, confirmatory sediment samples will be collected following thecompletion of the geophysical surveys. Sediments from an anticipated 200locations will be collected by hand coring or by grab sampling at the geophysicalsurvey areas. The confirmatory sampling locations will be selected, based on thegeophysical results, and placed using the same navigational controls andprecision as that for the geophysical surveys so that the two sets of data canbe directly correlated and mapped. All samples will be visually examined andclassified. Based on the field classifications, a large fraction of the sediment
A-5 TAMS/Gradienf
312196
samples will be analyzed for grain size distribution and total organic carboncontent. Additional activities are noted below.
• Sediment samples will be visually examined for sedimenttexture and stratification for calibration of both the side-scan sonar and the sub-bottom profiling survey data.
• Cores will be photographed to record visible sedimentologicalstructures.
• Some cores will be X-rayed to detect in situ density varia-tions before extrusion of the core.
• Core samples will be extruded in the field for visual andmanual examination.
• Surficial sediments (0 to 2 inches) will be analyzed for grainsize distribution and for total carbon/total nitrogen contentand total inorganic carbon content. (Total organic carboncontent is obtained as the difference between the total carbonand total inorganic carbon analyses.)
A.2.4 rSigh Resolution Coring
This task will involve the collection of sediment cores fromlocations in Study Areas A, B, C and D (see Section 2 for definitions). Thesecores will be analyzed for radionuclides on a two to four cm layer basis in orderto establish the year of deposition of a given sediment layer. These same layerswill be analyzed for PCB concentration on a congener-specific basis as well asother parameters. A total of 23 core locations have been chosen.
The Phase 2A effort will begin with core collection from Study AreasC and D. This effort, as outlined below, contains the same number of corelocations as given in the Phase 2A Sampling Plan, although one location has beendropped from Area C and one has been added to Area B.
1. Cores will be collected from eleven locations in Study AreasC and D. Their locations are shown in Figure A.2.2.
A-6 IMUS/Givdient
312197
Cores will be collected from the following, previouslysampled approximate locations: RM -1.7, -1.65, 3, 44,53.8, 60, 88.6, 91.8, 143.4 and Newtown Creek.
Cores will be collected from approximate RM location 115to expand the core database. The proposed location atRM 130 has been dropped.
2. Cores will be collected from twelve locations in Study AreasA and B. Their locations are shown in Figure A. 2. 3.
Cores will be collected from the following, previouslysampled approximate locations: RM 168, 189, 190, 191,and 203.
Cores will be collected from the following new locationsto expand the core database: RM 158, 166, 195, and 197.The core location at RM 158 represents an addition tothe Phase 2A effort. The core at RM 158 will be used inconjunction with the extensive fish flesh PCB datacollected from that general location by the NYSDEC.Cores will be collected from the Hoosic and MohawkRivers (two cores) near their confluence with the UpperHudson to evaluate the relative historical contributionof PCBs from each river.
3. All cores will be collected using a hand coring techniquewhenever possible.
Cores will be transported in a vertical position ascollected to a field laboratory location or to theLamont-Doherty Geological Observatory for subsequentsample preparation.Cores will be sectioned into approximately 2 cm layersfor the uppermost eight centimeters. The remainder ofthe core will be sectioned into 4 cm layers. Thesesections will be subsampled by removing representativeportions of each section for the various analysiswhenever possible. When a core section cannot besubsampled in this fashion, the core section will behomogenized while wet and subsequently subsampled.Portions will be reserved for PCB, total organic
A-7 TAMS/Gradient
312198
nitrogen, and grain size distribution analyses. Theremaining portion of each layer will be dried under aPCB-free atmosphere and analyzed for radionuclide (Cs-137, Be-7 and Co-60), total carbon/total nitrogen, andtotal inorganic carbon concentrations. Subsequently,this portion of the sample (typically about half of agiven layer) will be archived in a sealed aluminum can.
To the extent that a core does not yield an interpret-able radionuclide chronology, one additional core may becollected from the original location to replace thefirst core. If the second attempt does not yield aninterpretable core chronology, the location will beabandoned.
A.2.5 Water Column Transect Monitoring from Glens Falls to Waterford
Water column sampling tasks are designed to determine currentwaterborne PCB levels and congener mixtures in both dissolved and suspendedmatter fractions in the river. Data obtained from this effort will be used toinvestigate the approximate location of the current PCB sources in Study Area Band the effect, if any, of recent remedial efforts on the water column levels.The effort is also designed to examine the correlation of PCB loads with waterflow. Finally, the results will be used to examine the partitioning of PCBcongeners between the,dissolved and suspended matter phases. This task isexpected to extend over several months, with sampling events separated by fourto six weeks. The task efforts are described below.
1. Water monitoring stations will be sampled on at least sevenseparate occasions at 9 locations from Glens Falls to Water-ford plus a location on the Mohawk River. The locations areshown in Figure A.2.4.
• Seven locations (constituting one transect in thedirection of flow) will be sampled along the main riveraxis in order to delimit the area of the Upper Hudsonwhere the current base load originates, as follows:Glens Falls, Bakers Falls, upper remnant deposit pool,Rogers Island at Fort Edward, Thompson Island Dam,Schuylerville, and Waterford. Based on an evaluation of
A-8 TAMS/Gradient
312199
recent data, the stations at Stillwater and the lowerremnant deposit pool have been dropped from the Phase 2Aprogram. Additional samples will be obtained from theHoosic and Mohawk Rivers just upstream of their conflu-ences with the Upper Hudson and on the Champ] ain Canaljust above Lock 7. These stations are additions to thePhase 2A Sampling Plan.A sample will be collected during each transect samplinground from an off-site location to serve as a samplingblank.At each station, data will be collected on water columnconductivity, temperature, dissolved oxygen, and pH.
Water will be collected at each station for PC6 analysis(in a 20-liter aliquot), dissolved organic carbonanalysis, total suspended matter analysis, total organiccarbon analysis on suspended matter, and chlorophyll -aanalysis. A small subset of samples will be analyzedfor PCBs using one liter samples. The total organiccarbon analysis on suspended matter represents anaddition to the Phase 2A Sampling Plan.
Each 20-liter sample collected for PCB analysis at eachstation will be separated by filtration into a dissolvedfraction and a particulate fraction. The samples willbe filtered in the field as soon as possible aftercollection but no more than four hours after collection.Each fraction will be analyzed on a congener-specificbasis.Four separate sampling events along the transect willattempt to coincide with low flow (less than 8,000 cfsat Fort Edward) to typify current low flow PCB transportconditions.
Three separate sampling events along the transect willattempt to coincide with higher flow events to examinecurrent high flow PCB transport conditions. Whenpossible, these events will coincide with sustained highflow for at least one to two days prior to sampling.Samples will be collected from north to south (upstreamto downstream) while monitoring the flow at the USGShydrographic stations in the Upper Hudson so as togenerally follow the same parcel of water through theUpper Hudson River.
During one low flow and one high flow event, two 20-liter samples will be collected at each station along
A-9 IMS/Gradient
312200
the transects, one to be field-filtered, and one to belaboratory-filtered. The laboratory sample will be helda minimum of four days before filtering to ensure thatan effective equilibrium between dissolved and particu-late phases is reached.
At each station, samples will be collected at severalpoints across the river and mixed together to accountfor cross-section heterogeneity in the PCB levels.
A-10 TAMSI Gradient
312201
,*-., A.3 Phase 2B Sampling
A.3.1 Flow-Averaged Water Column Sampling
As discussed in the Phase 2 Work Plan, the purpose of this task isto define better the net PCB loads to the Upper Hudson that enter the river asit travels through the remnant deposit area above Fort Edward and to the ThompsonIsland Dam. This task will involve regular collection of water column samplesat four locations in the Upper Hudson, specifically Glens Falls, Fenimore Bridgeat Bakers Falls, Route 197 Bridge at Fort Edward and the Thompson Island Dam, ata frequency of one every other day (see Figure A.2.4), The river sections understudy represent regions of known or suspected historic PCB input to the river.Mean differences in PCB levels between sampling stations represent net changesin PCB load resulting from a PCB source in the intervening river section. Actualloadings will be calculated using USGS flow data and the measured PCB values.
The water column samples will be collected so as to generate a flow-averaged sample. Prior to the collection of any samples in this task, a scaleof sample volume to river discharge will be established. This scale will be usedto determine the volume of sample to be collected at each station on any samplingday. Prior to the collection of a day's samples, the USGS monitoring stationswill be queried electronically to obtain the day's flow conditions. Based onthese flow conditions, an appropriate volume of sample will be obtained from eachstation. At the end of each sampling period the individual samples will becombined, producing a single flow-averaged sample for each station. In thismanner, the sample will have sufficient volume to permit the measurement of PCBcongeners at the required detection limits.
This technique avoids the inherent day to day variability in watercolumn levels, which has been noted in the historical data, by creating a flow-averaged sample for each location. It also avoids the large analytical costsinvolved in establishing a sufficiently large database of daily or weekly samplesto permit a statistically valid analysis of the mean PCB loads.
A-11 TAMSI'Gradient
312202
The above technique has one disadvantage. It requires that samplesbe held beyond the USEPA allowed holding times for PCB analyses. For thisreason, the data quality objective for these samples will be less than the DataQuality Level (DQL) level 5 applied to most other Reassessment analyses.
The sample analysis will include the determination of the following:
• Dissolved phase PCBs on a congener specific basis;• Suspended matter PCBs on a congener specific basis;
• Total suspended solids; and
» Dissolved organic carbon.
Dissolved oxygen, pH, temperature and conductivity will be measuredat each location at the time of sample collection. Samples will be collected forthree one month intervals to generate twelve sample analyses for each of theparameters listed above, excluding duplicates and quality control samples.
A.3.2 Analysis of Archived Water Column Samples on a Congener-SpecificBasis
During the period 1977 to 1986, Hudson River water column sampleswere collected by the scientists of the Lamont-Doherty Geological Observatory.These samples were extracted and analyzed for PCBs near the time of collection,using packed column gas chromatography. The extracts of these samples have beenstored by the Observatory and can be reanalyzed on a congener-specific basis.The task will involve the reanalysis of about 100 water column sample extracts,representing both dissolved phase and suspended matter PCB fractions. Theintegrity of the archived extracts will be confirmed by comparing the originalanalytical results, which were obtained by a packed column gas chromatographtechnique, with a comparable analysis in Phase 2. The scientists at theObservatory have reproduced PCB analyses of previously analyzed, archivedsamples, demonstrating the viability of this procedure.
A-12 TAMSI Gradient
312203
I•,—, A.3.3 Low Resolution Coring of Upper Hudson Sediments
As described in Phase 2 Work Plan, the specific implementation ofthis task is contingent upon the results of the geophysical investigation inPhase 2A. A detailed description of the number of samples and the general lowresolution coring locations will be submitted to USEPA when the geophysicalresults become available, in early summer 1992.
As part of the low resolution coring efforts, cores are anticipatedto be collected from the following areas: the Bakers Falls Pool, the riversection between Bakers Falls and the former dam site at Fort Edward (particularlyat Remnant Deposit 1), the Thompson Island Pool, and the river reach below theThompson Island Dam (see Figure A.3.1). The low resolution coring effort isexpected to concentrate on the first three areas.
The main intent of the low resolution core collection is estimationof total PCB storage in the sediments, a distinctly different objective from the
-^ high resolution core collection in Phase 2A, which is designed to collectinformation on current and historic water column transport as recorded in thesediments. High resolution core locations are separated by distances of miles,whereas the low resolution core locations will be comparatively close togetherand clustered. In addition, for a high resolution core to be useful, it must beobtained from a zone of high deposition and produce an interpretable radionuclidechronology with depth. A low resolution core is not subject to these stringentcriteria.
The collection of a low resolution core follows the same techniquesused for high resolution core collection. Once collected, the low resolutioncore is subdivided in a different manner from the high resolution core. Insteadof the relatively thin slices obtained from high resolution cores (2-4 cm thick),low resolution cores are subdivided into thick sections, approximately 13 cm (5inches) thick. Low resolution cores are typically expected to obtain 40 to 50cm (15 to 20 inches) of sediment, yielding three to four samples per core. Theminimum recovery for a low resolution core is 20 cm (8 inches).
vj,O**ftfc,̂
A-13 IMS/Gradient
312204
Each core section will be analyzed for the following parameters:
• PCB concentration on a congener specific basis;• Radionuclides Beryllium-7 (Be-7) and Cesium-137 (Cs-137);
• Total organic carbon;
• Total organic nitrogen;
• Grain size distribution; and
• Reduction/oxidation potential (redox).
The redox potential will be a field measurement obtained during coreextrusion. The data on total organic carbon and total organic nitrogen levelswill be obtained by either direct measurement or by analysis of total carbon*total nitrogen, total inorganic carbon and total organic nitrogen, similar to thehigh resolution core sections.
A.3.4 Sediment Critical Shear Stress Analysis
Sediments of the Thompson Island Pool and the Remnant Deposit areawill be collected for critical shear stress analysis as part of the scourabilityassessment. The number of samples required for laboratory analysis will bedetermined based on an assessment of the sediment classes mapped by thegeophysical survey and the confirmatory sampling. Large diameter cylindrical (4to 6 in) or box coring techniques will be used to collect sediment samples,because these techniques preserve the sediment structure, particularly thesurface sediment conditions. An additional sample will be collected with eachcore sample for grain size analysis.
The method for shear stress measurement is based on the work ofSchunemann and Khul (1991).* It involves the use of a stirring mechanism and a
^Shunemann M. and H. Khul, A device of erosion-measurements on naturally formed, muddy sediments:the EROMES System, GKSS 91/E/19, GKSS Research Centre, Germany, 1991.
A-14 TAMS /Gradient
312205
turbidity meter to determine sediment response to shear stress. Figure A.3-2shows a schematic of the measurement system.
A.3.5 Assessment of In Situ Degradation
The goal of this task is to determine an effective rate of in situdegradation for PCBs in various regions of the Hudson. In the Phase 2A samplingwork, 25 high resolution cores will be collected from Study Areas A, B, C and D.Many of these coring locations have been studied and cored historically by thescientists of the Lamont-Doherty Geological Observatory (see Figures A.3.3 andA.3.4). The sediments from the historic cores and, in most cases, the sampleextracts from these cores, still exist and can be re-analyzed on a congener-specific basis for direct comparison with the Phase 2A sediment core results.
This task will involve the reanalysis of sediment core layer extractswhose time of deposition is fairly well known. Historic core extracts will onlybe re-analyzed to correspond with the successful Phase 2A high resolutionsediment cores, i.e., a Phase 2A sediment core w'll have to yield an interpret-able radionuclide deposition history and then have unqualified PCB analyticalresults before the corresponding historic core extracts are reanalyzed. In mostinstances, only four to five historic sediment extracts will be run for eachcoring location. For the Upper Hudson, the sediment layers corresponding to thefollowing events will be reanalyzed, assuming they can be identified in eachsediment core pair:
• 1954 appearance of Cesium-137;• 1963 Cesium-137 maximum;
• Mid 1970's PCB maximum; and
• Time of the historic core collection.
For the Lower Hudson, these same sediment layers will be analyzed plus the layercorresponding to:
A-15 TAMS /Gradient
312206
• 1971 Cesium-137, Cobalt-60 maximum
The integrity of the stored sediment extracts will be confirmed bycomparison of the reanalysis results with the packed column results originallyobtained. The two sets of results should agree for total PCB concentration andthe concentration of the individual homolog groups.
This task will involve up to 15 pairs of historic and Phase 2A highresolution cores. It is likely that not all historic core locations will besuccessfully re-cored in Phase 2A, so that the actual number of core pairs willbe lower. Based on five cores from the Upper Hudson and ten cores from the LowerHudson, up t0 70 sediment extracts will be re-analyzed. No other analytical workis required for this task. Like the reanalysis of water column samples, the dataquality level for these results will be less than level 5.
A.3.6 Reconnaissance Survey
The purpose of this task is to provide qualitative field verificationof the types of habitats and wildlife on and near the ecological study area(Study Area B and most of C). Field biologists will conduct a field assessmentof the various terrestrial wetland and aquatic habitat types. Prior to theinitiation of the survey, state and federal agencies will be consulted in orderto develop a list of flora and fauna which may be expected to occur in the areassurveyed.
The surveys require dawn and dusk walkovers of selected shorelineareas. In addition, surveys in Area C will also include tidal elements.Positioning will be by line of sight and will therefore be approximate. A fieldmap will be used to guide the survey and for recording observations. Thewalkover path will be planned and modified as appropriate in the field. The pathwill be dictated by the types of environments encountered and their extent asbased upon visual observations. The exact course of the walkover will bedetermined by the biologist in the field. The course of the walkover will bebased on such observations as nesting sites, physical signs of wildlife, audible
A-16 TAMS/Gradfe/if
312207
signs of birds, changes 1n vegetation patterns, obvious changes in hydrologicconditions, changes in slope, and physical accessibility.
A qualitative assessment of the freshwater aquatic environments willalso be made during the reconnaissance survey. Seines or dip nets will be usednearshore in several of the major surface water bodies to sample fish and largerinvertebrates. Kick net and/or ponar grab samples will be obtained and sievedon-site to determine the species richness of dominant benthic invertebrates.
The reconnaissance survey will be qualitative rather than quantita-tive, since the objective is to provide an inventory of shoreline terrestrialaquatic biota and site specific observations concerning the diversity, I.e.number and type of species, rather than data for assessment of populationstructure or community analyses. The data products from the reconnaissancesurvey will include tables and maps, which will allow a qualitative biologicalcharacterization of the ecological study area.
A-17 TAMS/Gradient
312208
PAGE INTENTIONALLY LEFT BLANK
312209
TABLE A.1.1SUMMARY OF PHASE 2A ANALYTICAL PROGRAM
PEDIMENT PROGRAM
TASKConfirmatory Sampling
Sediment Cores and Grab Samples
High ResolutionSediment Coring1
SEDIMENT TOTAL
TASK
Confirmatory SamplingSediment Cores and Grab Samples
High ResolutionSediment Coring'
SEDIMENT TOTAL•"V
WATER COLUMN PROGRAM2
TASKWater Column Monitoring
- Field Filtered Samples— Laboratory Filtered Samples
WATER COLUMN TOTAL
TASKWater Column Monitoring
- Field Filtered Samples- Laboratory Filtered Samples
NUMBER OFLOCATIONS
200
23'
223
TOTALINORGANIC
CARBONANALYSIS6
-
230-280
230-280
NUMBEROF
TRANSECTS
72'
7
DISSOLVEDORGANICCARBON
ANALYSIS9
7722
NUMBER OFSAMPLES PER
LOCATION1-24
10-12
-
GRAIN SIZEDISTRIBUTION
200-400"
255-305"
455-705
NUMBER OFSAMPLES PERTRANSECTS
11*ll--
TOTALSUSPENDED
MATTERANALYSIS
77
PCB CONGENERANALYSIS
-
230-280
230-280
RADIONUCLIDEANALYSIS5
-
230-280
30-280
DISSOLVEDPHASE
PCB CONGENERANALYSIS
7722
99"
TOTAL WATERCOLUMN PCB
ANALYSIS
10
TOTALCARBON AND
NITROGENANALYSIS
20CM004
230-280
430-680
TOTALORGANIC
NITROGENANALYSIS
-^
115-140
115-140
SUSPENDEDMATTER
PCB CONGENERANALYSIS
7722
99"
CHLOROPHYLL-AANALYSIS
77
TOTALCARBON
ANALYSIS ONSUSPENDED
MATTER
77
- ^J^ATER COLUMN TOTAL 99 77 10" 77 77
A-18 IMS/Gradient
312210
TABLE A.1.1 (Continued)SUMMARY OF PHASE 2A ANALYTICAL PROGRAM
Notes
1. Sediment samples to be analyzed for redox potential in the field.
2. All water column stations to include field measurements of conductivity,temperature, pH and dissolved oxygen.
3. Eleven locations to be placed in the Lower Hudson, twelve in the UpperHudson.
4. Grab samples will generate 1 sample per location. Core samples willgenerate up to 2 samples per core, one core per location. It isanticipated that 50% of the locations will yield sediment cores and 50%will yield grab samples.
5. Samples to be analyzed by Lamont-Doherty Geological Observatory forradienuclides, including Cesium-137(Cs-137), Beryllium-7 (Be-7), andCobalt-60 (Co-60).
6. Total organic carbon data to be obtained by a difference method,subtracting a total inorganic carbon measurement from a total carboniraasurement.
7. These represent duplicates of the samples collected for one low flowtransect and one high flow transect.
8. This total includes seven samples from the Upper Hudson, one each from theHoosic River, Mohawk River and Champ!ain Canal, and one background sampleper transect.
9. These data will be obtained from two separate measurements of dissolvedorganic carbon, one based on a persulfate digestion and one based on acomplete combustion of the sample.
10. 200 to 400 samples will be analyzed for grain size distribution by a laserparticle analyzer technique. A subset of these samples (about 50) will berun for grain size distribution by the standard ASTM method.
11. Samples derived from 20 liter aliquots.
12. Samples derived from one liter aliquots.
13. 230 to 280 (one for each core slice) samples will be run using a laserparticle analyzer based technique for a small sample volume. 25 samples(roughly one for each core) will be run using a laser particle analyzerbased technique for a large sample volume.
A-19 TAMS /Gradient
312211
jTABLE A.1.2
SUMMARY OF PHASE 2B ANALYTICAL PROGRAM
HATER COLUMN SAMPLING
TASK
Flow-Averaged WaterSamplingAnalysis of Water SampleArchives