30
Jaguar Land Rover Automotive plc Interim Report For the three and nine month period ended 31 December 2020 Company registered number: 06477691
Jaguar Land Rover Automotive plc Interim Report
For the three and nine month period ended
31 December 2020
Company registered number: 06477691
Contents
Management’s discussion and analysis of financial condition and results of operations
Key metrics/highlights for Q3 FY21 results ...............................................................................
3
Market environment ..................................................................................................................... 3
Total automotive industry car volumes ..................................................................................... 3
Jaguar Land Rover Q3 FY21 sales volumes year-on-year performance ................................ 3
Q3 FY21 revenue and profits ...................................................................................................... 4
Cash flow, liquidity and capital resources ................................................................................ 5
Debt ............................................................................................................................................... 5
Risks and mitigating factors ....................................................................................................... 6
Acquisitions and disposals ........................................................................................................ 6
Off-balance sheet financial arrangements ................................................................................ 6
Post balance sheet items ............................................................................................................. 6
Related party transactions .......................................................................................................... 6
Personnel ...................................................................................................................................... 6
Board of directors ........................................................................................................................ 6
Condensed consolidated financial statements
Income statement ........................................................................................................................ 7
Statement of comprehensive income and expense .................................................................. 8
Balance sheet ............................................................................................................................... 9
Statement of changes in equity .................................................................................................. 10
Cash flow statement .................................................................................................................... 11
Notes ............................................................................................................................................. 12
Group, Company, Jaguar Land Rover, JLR plc and JLR refers to Jaguar Land Rover Automotive plc and its subsidiaries. Note 3 on page 13 defines a series of alternative performance measures below.
Adjusted EBITDA margin measured as adjusted EBITDA as a percentage of revenue.
Adjusted EBIT margin measured as adjusted EBIT as a percentage of revenue.
PBT Profit/(loss) before tax.
PAT Profit/(loss) after tax.
Net debt/cash defined by the Company as cash and cash equivalents plus short-term deposits and other investments less total balance sheet borrowings.
Q3 FY21 3 months ended 31 December 2020
Q3 FY20 3 months ended 31 December 2019
Q2 FY21 3 months ended 30 September 2020
Q2 FY20 3 months ended 30 September 2019
YTD FY21 9 months ended 31 December 2020
YTD FY20 9 months ended 31 December 2019
China JV Chery Jaguar Land Rover Automotive Co., Ltd.
3
Management’s discussion and analysis of financial condition and results of operations Jaguar Land Rover Automotive plc generated strong profits and free cash flow in the third quarter of Fiscal 2020/21 as sales continued to recover quarter-on-quarter. Sales volumes and revenue were down year-on-year as a result of the ongoing impact of Covid-19. Profitability was significantly improved, primarily reflecting favourable sales mix, costs and certain reserve reversals including emissions and residual values in the US.
Key metrics for Q3 FY21 results, compared to Q2 FY21 and Q3 FY20, are as follows:
• Retail sales 128,469 vehicles, up 13.1% quarter-on-quarter but 9.0% lower than pre-Covid levels a year ago (although
China sales were up 19.1% year-on-year)
• Wholesales (excl. China JV) of 102,580 vehicles, up 39.7% quarter-on-quarter but 21.1% lower than pre-Covid levels a
year ago
• Revenue of £6.0 billion, up 37.5% quarter-on-quarter, while down 6.5% year-on-year
• PBT of £439 million, substantially higher than the PBT of £65 million in Q2 FY21 and £318 million in Q3 last year
• Profit after tax (PAT) of £351 million (incl. £88 million tax charge), up from the £117 million in Q2 FY21 and similar to the
£372 million (incl. £54 million tax credit) in Q3 FY20
• Adjusted EBITDA margin 15.8%, compared to 11.1% in the prior quarter and 10.2% in Q3 last year
• Adjusted EBIT margin 6.7%, up significantly compared to the 0.3% margin in Q2 FY21 and 2.7% in Q3 FY20
• Positive free cash flow of £562 million was a Q3 record, following on from the positive free cash flow of £463 million in the
prior quarter and significantly better than the break-even cash flow in Q3 FY20
• Cash and short-term investments increased to £4.5 billion as a result of the positive free cash flow and $1.35 billion of 5 and 7 year debt issued in Q3. Total liquidity was £6.4 billion including a £1.9 billion undrawn credit facility
Market environment • New waves of Covid-19 have driven the reintroduction of more stringent restrictions, notably in the UK and in Europe.
However, vaccination programmes are now being rolled out in many countries over the coming months following the respective approval of various vaccines
• The UK and EU struck a post-Brexit trade agreement in late December which will avoid tariffs on the sale of automotive parts and finished vehicles between the EU and UK, subject to meeting rules of origin requirements. New documentation and customs processes have created short-term administrative frictions in the supply chain, which we are monitoring closely together with other Covid related supplier risks, which has the potential to impact production.
• Financial markets have continued to rally, most recently on news of Covid-19 vaccines approved for use in many countries,
the Brexit trade deal and a new US president.
• In Q3 FY21 passenger car industry volumes continued to recover quarter-on-quarter in China and the US but declined in
the UK and Europe as a result of stricter social distancing measures being re-introduced. With the exception of China, car
industry sales volumes remain below pre-Covid levels of a year ago. The demand and sales of electrified vehicles (full
battery electric (“BEV”), plug-in hybrids (“PHEV’”) and mild-hybrids (“MHEV”) continues to grow.
Total automotive industry car volumes (units)
The total industry car volume data above has been compiled using relevant data available at the time of publishing this Interim Report, compiled from national automotive associations such as the Society of Motor Manufacturers and Traders in the UK and the ACEA in Europe, according to their segment definitions, which may differ from those used by JLR.
Jaguar Land Rover Q3 FY21 sales volumes performance Total retail sales (including the China JV) were 128,469 units, up 13.1% quarter-on-quarter as the recovery across most regions continued including in North America (up 31.7%), Overseas markets (up 26.6%), Europe (up 20.5%) and China (20.2%) with sales in the UK down 23.0% reflecting market seasonality. Demand for electrified vehicles continues to gather pace and 53% of our retail in the third quarter were electrified (6.1% BEV, 5.5% PHEV, 41% MHEV). Retail sales in Q3 FY21 declined 9.0% year-on-year due to the ongoing impact of Covid-19 with sales down across all regions except China (up 19.1%). Sales of the Land Rover Defender continued to ramp up, increasing to 16,286 vehicles in the third quarter, up 66.0% compared to the prior quarter. Retail sales of the all-electric Jaguar I-PACE rose to 7,807 vehicles in Q3 FY21, up 69.3% year-on-year.
RegionQ3
FY21
Q2
FY21
Qtr on
Qtr
Q3
FY20
Year on
year
China 6,782,000 5,508,000 23.1% 6,198,000 9.4%
Europe (excl. UK) 3,003,805 2,876,028 4.4% 3,238,722 (7.3%)
UK 387,408 590,154 (34.4%) 448,869 (13.7%)
US 4,193,326 3,898,750 7.6% 4,299,864 (2.5%)
4
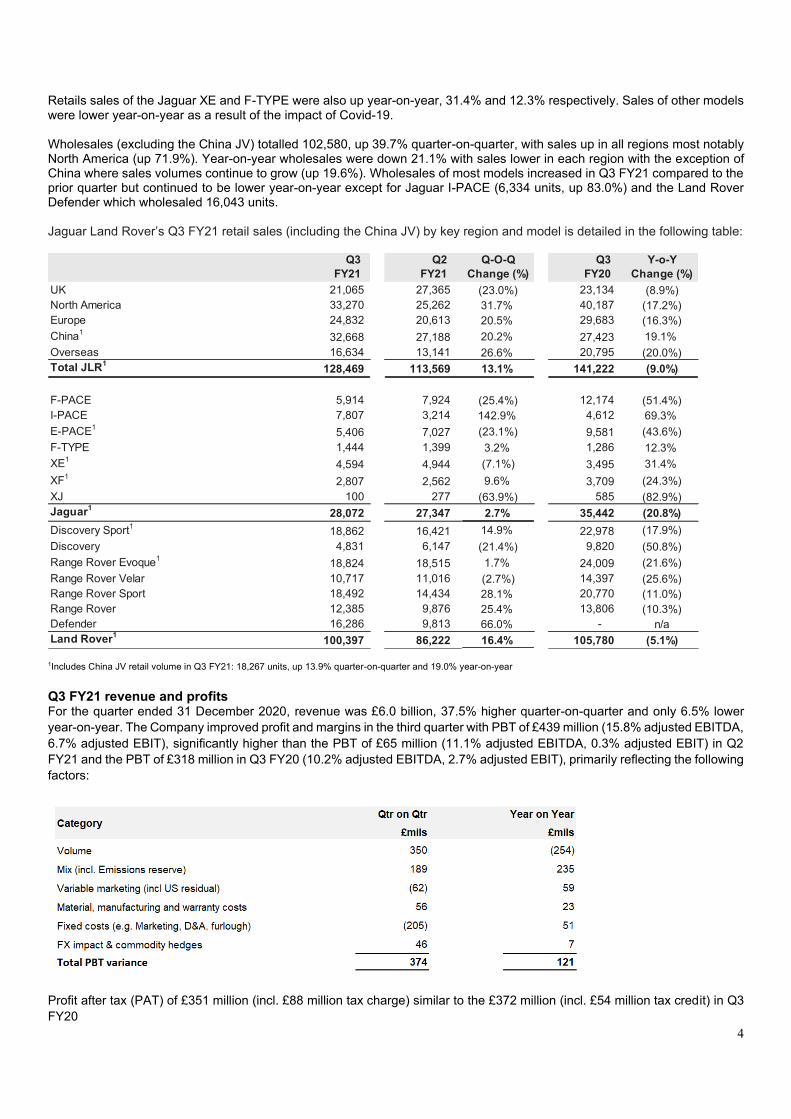
Retails sales of the Jaguar XE and F-TYPE were also up year-on-year, 31.4% and 12.3% respectively. Sales of other models were lower year-on-year as a result of the impact of Covid-19. Wholesales (excluding the China JV) totalled 102,580, up 39.7% quarter-on-quarter, with sales up in all regions most notably North America (up 71.9%). Year-on-year wholesales were down 21.1% with sales lower in each region with the exception of China where sales volumes continue to grow (up 19.6%). Wholesales of most models increased in Q3 FY21 compared to the prior quarter but continued to be lower year-on-year except for Jaguar I-PACE (6,334 units, up 83.0%) and the Land Rover Defender which wholesaled 16,043 units. Jaguar Land Rover’s Q3 FY21 retail sales (including the China JV) by key region and model is detailed in the following table:
1Includes China JV retail volume in Q3 FY21: 18,267 units, up 13.9% quarter-on-quarter and 19.0% year-on-year
Q3 FY21 revenue and profits For the quarter ended 31 December 2020, revenue was £6.0 billion, 37.5% higher quarter-on-quarter and only 6.5% lower
year-on-year. The Company improved profit and margins in the third quarter with PBT of £439 million (15.8% adjusted EBITDA,
6.7% adjusted EBIT), significantly higher than the PBT of £65 million (11.1% adjusted EBITDA, 0.3% adjusted EBIT) in Q2
FY21 and the PBT of £318 million in Q3 FY20 (10.2% adjusted EBITDA, 2.7% adjusted EBIT), primarily reflecting the following
factors:
Profit after tax (PAT) of £351 million (incl. £88 million tax charge) similar to the £372 million (incl. £54 million tax credit) in Q3
FY20
Q3
FY21
Q2
FY21
Q-O-Q
Change (%)
Q3
FY20
Y-o-Y
Change (%)
UK 21,065 27,365 (23.0%) 23,134 (8.9%)
North America 33,270 25,262 31.7% 40,187 (17.2%)
Europe 24,832 20,613 20.5% 29,683 (16.3%)
China1
32,668 27,188 20.2% 27,423 19.1%
Overseas 16,634 13,141 26.6% 20,795 (20.0%)
Total JLR1
128,469 113,569 13.1% 141,222 (9.0%)
F-PACE 5,914 7,924 (25.4%) 12,174 (51.4%)
I-PACE 7,807 3,214 142.9% 4,612 69.3%
E-PACE1
5,406 7,027 (23.1%) 9,581 (43.6%)
F-TYPE 1,444 1,399 3.2% 1,286 12.3%
XE1
4,594 4,944 (7.1%) 3,495 31.4%
XF1
2,807 2,562 9.6% 3,709 (24.3%)
XJ 100 277 (63.9%) 585 (82.9%)
Jaguar1
28,072 27,347 2.7% 35,442 (20.8%)
Discovery Sport1
18,862 16,421 14.9% 22,978 (17.9%)
Discovery 4,831 6,147 (21.4%) 9,820 (50.8%)
Range Rover Evoque1
18,824 18,515 1.7% 24,009 (21.6%)
Range Rover Velar 10,717 11,016 (2.7%) 14,397 (25.6%)
Range Rover Sport 18,492 14,434 28.1% 20,770 (11.0%)
Range Rover 12,385 9,876 25.4% 13,806 (10.3%)
Defender 16,286 9,813 66.0% - n/a
Land Rover1
100,397 86,222 16.4% 105,780 (5.1%)
5
YTD FY21 revenue and profits
Revenue was £13.2 billion in YTD FY21 compared to £17.6 billion for the same period last year, generating PBT of £91 million
compared to the PBT of £79 million in YTD FY20. The Adjusted EBITDA margin in YTD FY21 was 11.6% compared to 9.8%
in YTD FY20 and the Adjusted EBIT margin in YTD FY21 was 0.2% compared to 1.2% in YTD FY20. The loss after tax in
YTD FY21 was £180 million (including a £271 million tax charge) compared to PAT of £70 million in YTD FY20 (including a
£9 million tax charge).
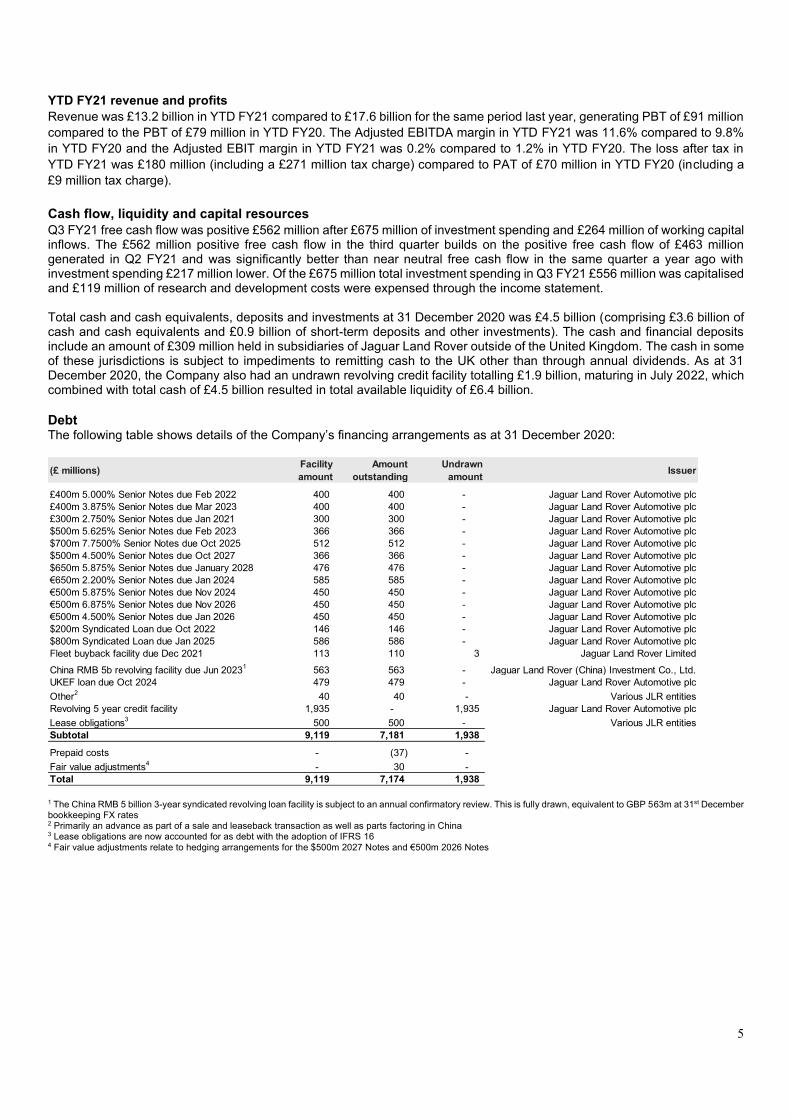
Cash flow, liquidity and capital resources
Q3 FY21 free cash flow was positive £562 million after £675 million of investment spending and £264 million of working capital inflows. The £562 million positive free cash flow in the third quarter builds on the positive free cash flow of £463 million generated in Q2 FY21 and was significantly better than near neutral free cash flow in the same quarter a year ago with investment spending £217 million lower. Of the £675 million total investment spending in Q3 FY21 £556 million was capitalised and £119 million of research and development costs were expensed through the income statement. Total cash and cash equivalents, deposits and investments at 31 December 2020 was £4.5 billion (comprising £3.6 billion of cash and cash equivalents and £0.9 billion of short-term deposits and other investments). The cash and financial deposits include an amount of £309 million held in subsidiaries of Jaguar Land Rover outside of the United Kingdom. The cash in some of these jurisdictions is subject to impediments to remitting cash to the UK other than through annual dividends. As at 31 December 2020, the Company also had an undrawn revolving credit facility totalling £1.9 billion, maturing in July 2022, which combined with total cash of £4.5 billion resulted in total available liquidity of £6.4 billion.
Debt The following table shows details of the Company’s financing arrangements as at 31 December 2020:
1 The China RMB 5 billion 3-year syndicated revolving loan facility is subject to an annual confirmatory review. This is fully drawn, equivalent to GBP 563m at 31st December bookkeeping FX rates 2 Primarily an advance as part of a sale and leaseback transaction as well as parts factoring in China 3 Lease obligations are now accounted for as debt with the adoption of IFRS 16 4 Fair value adjustments relate to hedging arrangements for the $500m 2027 Notes and €500m 2026 Notes
(£ millions)Facility
amount
Amount
outstanding
Undrawn
amountIssuer
£400m 5.000% Senior Notes due Feb 2022 400 400 - Jaguar Land Rover Automotive plc
£400m 3.875% Senior Notes due Mar 2023 400 400 - Jaguar Land Rover Automotive plc
£300m 2.750% Senior Notes due Jan 2021 300 300 - Jaguar Land Rover Automotive plc
$500m 5.625% Senior Notes due Feb 2023 366 366 - Jaguar Land Rover Automotive plc
$700m 7.7500% Senior Notes due Oct 2025 512 512 - Jaguar Land Rover Automotive plc
$500m 4.500% Senior Notes due Oct 2027 366 366 - Jaguar Land Rover Automotive plc
$650m 5.875% Senior Notes due January 2028 476 476 - Jaguar Land Rover Automotive plc
€650m 2.200% Senior Notes due Jan 2024 585 585 - Jaguar Land Rover Automotive plc
€500m 5.875% Senior Notes due Nov 2024 450 450 - Jaguar Land Rover Automotive plc
€500m 6.875% Senior Notes due Nov 2026 450 450 - Jaguar Land Rover Automotive plc
€500m 4.500% Senior Notes due Jan 2026 450 450 - Jaguar Land Rover Automotive plc
$200m Syndicated Loan due Oct 2022 146 146 - Jaguar Land Rover Automotive plc
$800m Syndicated Loan due Jan 2025 586 586 - Jaguar Land Rover Automotive plc
Fleet buyback facility due Dec 2021 113 110 3 Jaguar Land Rover Limited
China RMB 5b revolving facility due Jun 20231
563 563 - Jaguar Land Rover (China) Investment Co., Ltd.
UKEF loan due Oct 2024 479 479 - Jaguar Land Rover Automotive plc
Other2
40 40 - Various JLR entities
Revolving 5 year credit facility 1,935 - 1,935 Jaguar Land Rover Automotive plc
Lease obligations3
500 500 - Various JLR entities
Subtotal 9,119 7,181 1,938
Prepaid costs - (37) -
Fair value adjustments4
- 30 -
Total 9,119 7,174 1,938
6
Risks and mitigating factors There are a number of potential risks which could have a material impact on the Group’s performance and could cause actual results to differ materially from expected and/or historical results, including those discussed on pages 19-22 of the Annual Report 2019-20 of the Group (available at https://www.jaguarlandrover.com/annual-report-2020) along with mitigating factors. The principal risks discussed in the Group’s Annual Report 2019-20 are competitive business efficiency, global economic and geopolitical environment (including Covid-19), brand positioning, distribution channels/retailer performance, IT systems and security, environmental regulations and compliance, supply chain disruptions, human capital, rapid technology change and unethical and prohibited business practices.
Acquisitions and disposals There were no material acquisitions or disposals in Q3 FY21.
Off-balance sheet financial arrangements At 31 December 2020, Jaguar Land Rover Limited (a subsidiary of the Company) had sold £188 million equivalent of receivables under a $700 million invoice discounting facility signed in March 2019.
Post balance sheet items There were no material post balance sheet items in Q3 FY21.
Related party transactions Related party transactions for Q3 FY21 are disclosed in note 26 to the condensed consolidated financial statements disclosed on page 29 of this Interim Report. There have been no material changes to the related party transactions described in the latest Annual Report.
Personnel At 31 December 2020, Jaguar Land Rover employed 36,285 people worldwide, including agency personnel, compared to 38,778 at 31 December 2019.
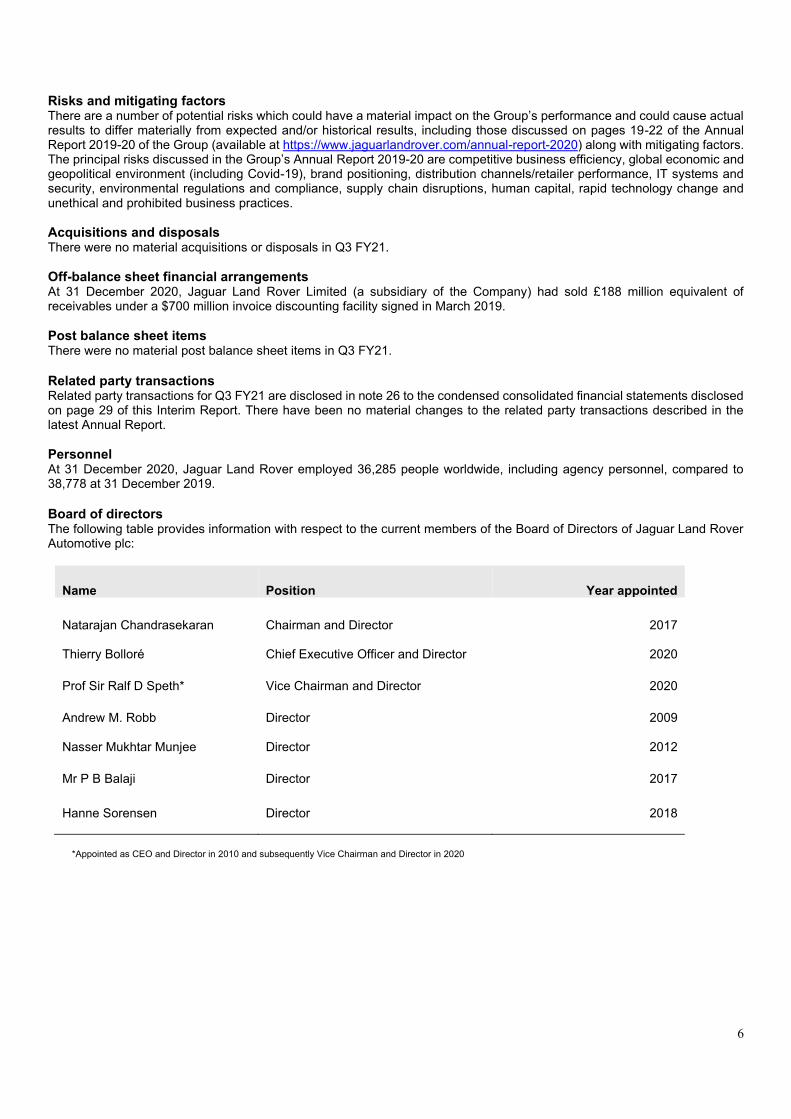
Board of directors The following table provides information with respect to the current members of the Board of Directors of Jaguar Land Rover Automotive plc:
Name Position Year appointed
Natarajan Chandrasekaran Thierry Bolloré
Chairman and Director Chief Executive Officer and Director
2017
2020
Prof Sir Ralf D Speth* Vice Chairman and Director 2020
Andrew M. Robb
Director
2009
Nasser Mukhtar Munjee
Director
2012
Mr P B Balaji Director 2017
Hanne Sorensen Director 2018
*Appointed as CEO and Director in 2010 and subsequently Vice Chairman and Director in 2020
7
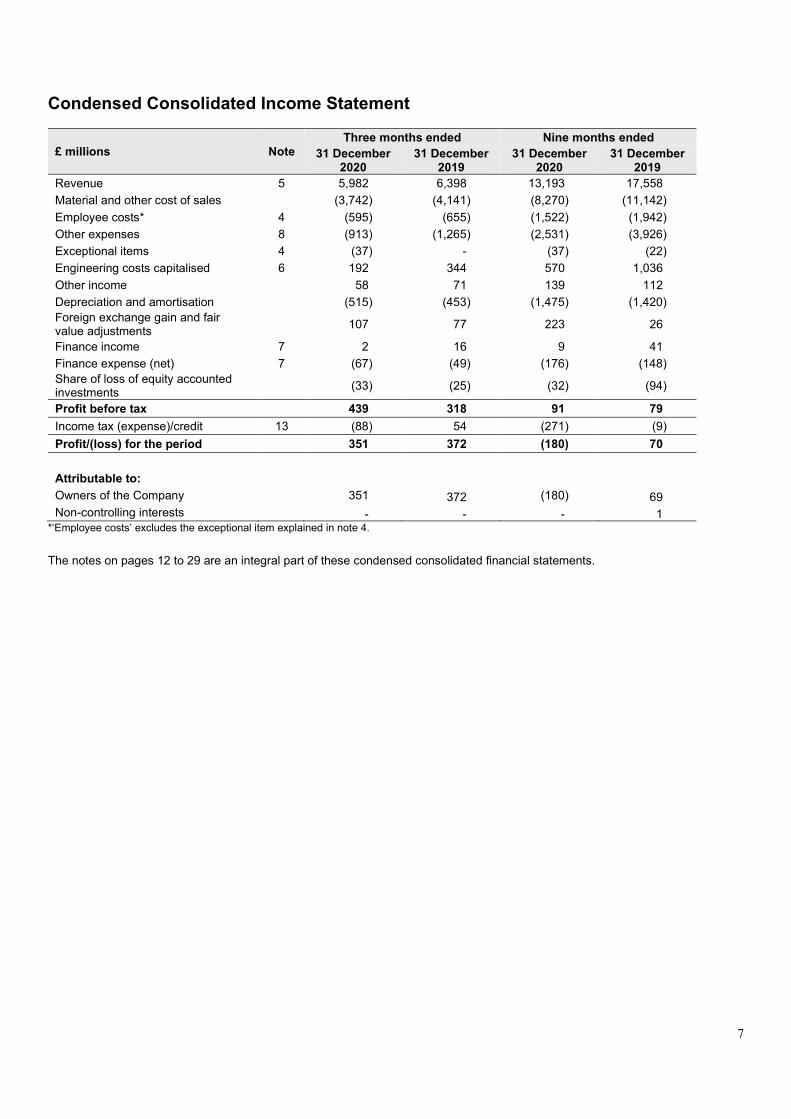
Condensed Consolidated Income Statement
£ millions Note
Three months ended Nine months ended
31 December 2020
31 December 2019
31 December 2020
31 December 2019
Revenue 5 5,982 6,398 13,193 17,558
Material and other cost of sales (3,742) (4,141) (8,270) (11,142)
Employee costs* 4 (595) (655) (1,522) (1,942)
Other expenses 8 (913) (1,265) (2,531) (3,926)
Exceptional items 4 (37) - (37) (22)
Engineering costs capitalised 6 192 344 570 1,036
Other income 58 71 139 112
Depreciation and amortisation (515) (453) (1,475) (1,420)
Foreign exchange gain and fair value adjustments
107 77 223 26
Finance income 7 2 16 9 41
Finance expense (net) 7 (67) (49) (176) (148)
Share of loss of equity accounted investments
(33) (25) (32) (94)
Profit before tax 439 318 91 79
Income tax (expense)/credit 13 (88) 54 (271) (9)
Profit/(loss) for the period 351 372 (180) 70
Attributable to:
Owners of the Company 351 372 (180) 69
Non-controlling interests - - - 1 *‘Employee costs’ excludes the exceptional item explained in note 4. The notes on pages 12 to 29 are an integral part of these condensed consolidated financial statements.
8
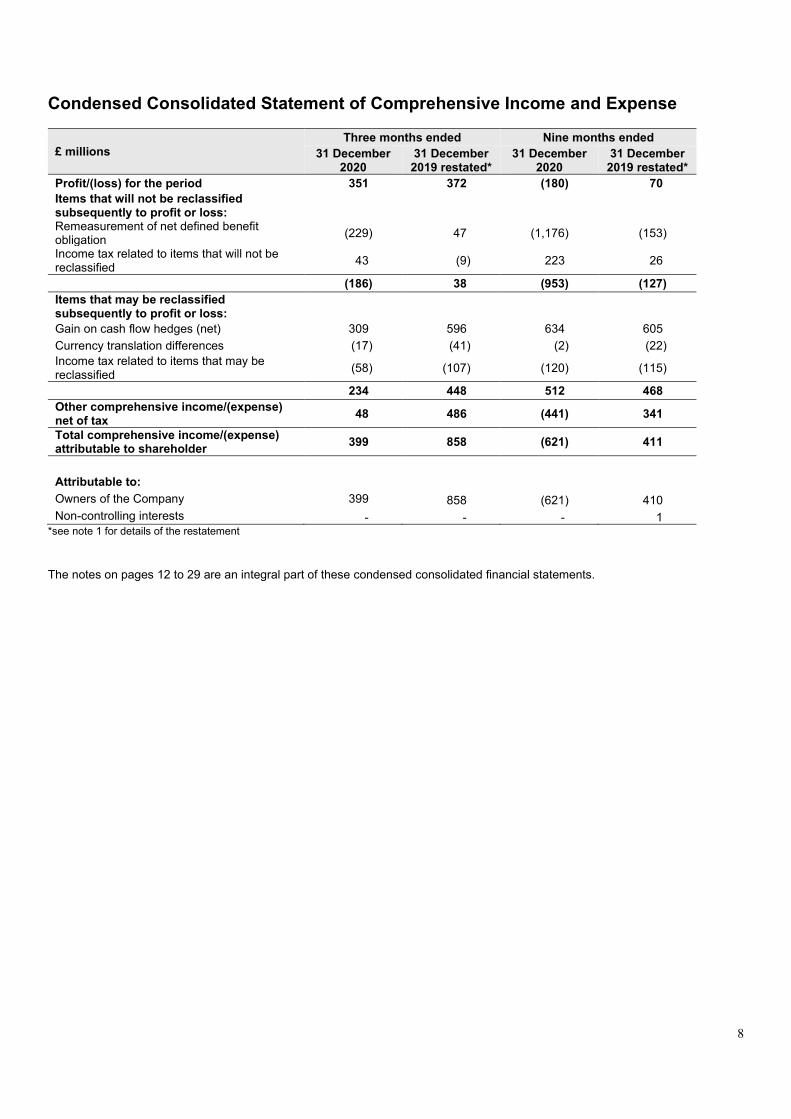
Condensed Consolidated Statement of Comprehensive Income and Expense
£ millions
Three months ended Nine months ended
31 December 2020
31 December 2019 restated*
31 December 2020
31 December 2019 restated*
Profit/(loss) for the period 351 372 (180) 70
Items that will not be reclassified subsequently to profit or loss:
Remeasurement of net defined benefit obligation
(229) 47 (1,176) (153)
Income tax related to items that will not be reclassified
43 (9) 223 26
(186) 38 (953) (127)
Items that may be reclassified subsequently to profit or loss:
Gain on cash flow hedges (net) 309 596 634 605
Currency translation differences (17) (41) (2) (22)
Income tax related to items that may be reclassified
(58) (107) (120) (115)
234 448 512 468
Other comprehensive income/(expense) net of tax
48 486 (441) 341
Total comprehensive income/(expense) attributable to shareholder
399 858 (621) 411
Attributable to:
Owners of the Company 399 858 (621) 410
Non-controlling interests - - - 1 *see note 1 for details of the restatement
The notes on pages 12 to 29 are an integral part of these condensed consolidated financial statements.
9
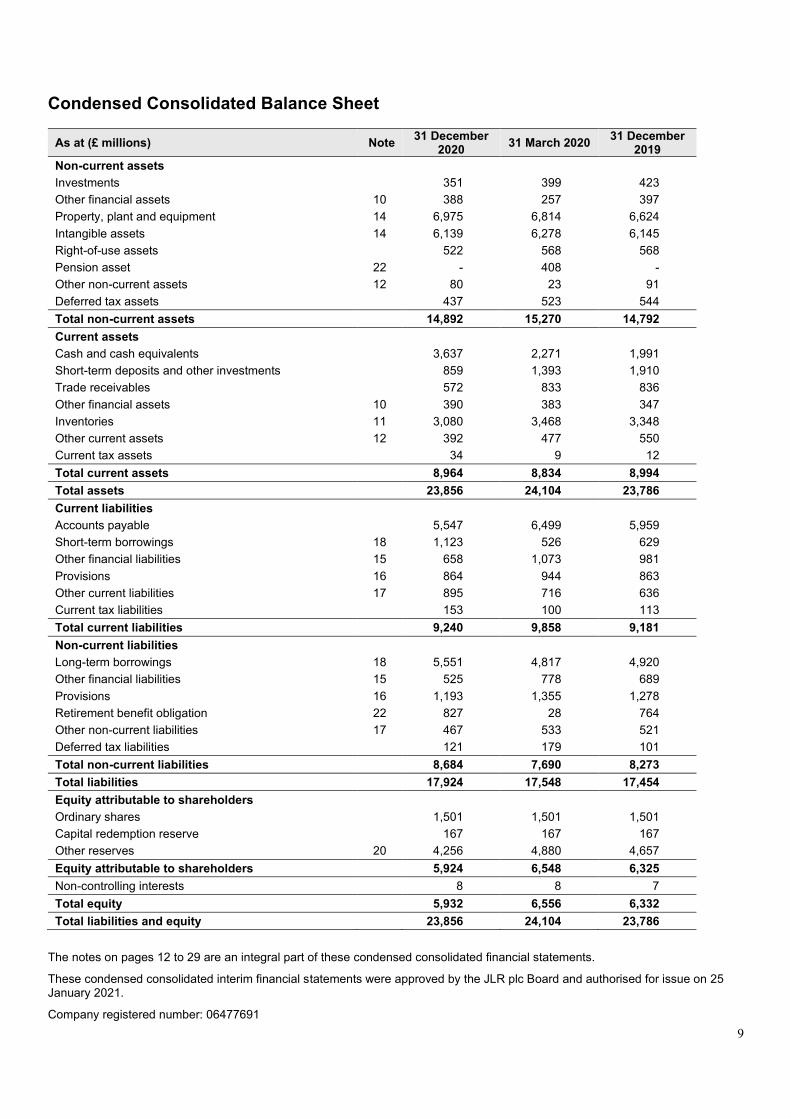
Condensed Consolidated Balance Sheet
As at (£ millions) Note 31 December
2020 31 March 2020
31 December 2019
Non-current assets
Investments 351 399 423
Other financial assets 10 388 257 397
Property, plant and equipment 14 6,975 6,814 6,624
Intangible assets 14 6,139 6,278 6,145
Right-of-use assets 522 568 568
Pension asset 22 - 408 -
Other non-current assets 12 80 23 91
Deferred tax assets 437 523 544
Total non-current assets 14,892 15,270 14,792
Current assets
Cash and cash equivalents 3,637 2,271 1,991
Short-term deposits and other investments 859 1,393 1,910
Trade receivables 572 833 836
Other financial assets 10 390 383 347
Inventories 11 3,080 3,468 3,348
Other current assets 12 392 477 550
Current tax assets 34 9 12
Total current assets 8,964 8,834 8,994
Total assets 23,856 24,104 23,786
Current liabilities
Accounts payable 5,547 6,499 5,959
Short-term borrowings 18 1,123 526 629
Other financial liabilities 15 658 1,073 981
Provisions 16 864 944 863
Other current liabilities 17 895 716 636
Current tax liabilities 153 100 113
Total current liabilities 9,240 9,858 9,181
Non-current liabilities
Long-term borrowings 18 5,551 4,817 4,920
Other financial liabilities 15 525 778 689
Provisions 16 1,193 1,355 1,278
Retirement benefit obligation 22 827 28 764
Other non-current liabilities 17 467 533 521
Deferred tax liabilities 121 179 101
Total non-current liabilities 8,684 7,690 8,273
Total liabilities 17,924 17,548 17,454
Equity attributable to shareholders
Ordinary shares 1,501 1,501 1,501
Capital redemption reserve 167 167 167
Other reserves 20 4,256 4,880 4,657
Equity attributable to shareholders 5,924 6,548 6,325
Non-controlling interests 8 8 7
Total equity 5,932 6,556 6,332
Total liabilities and equity 23,856 24,104 23,786
The notes on pages 12 to 29 are an integral part of these condensed consolidated financial statements.
These condensed consolidated interim financial statements were approved by the JLR plc Board and authorised for issue on 25 January 2021.
Company registered number: 06477691
10
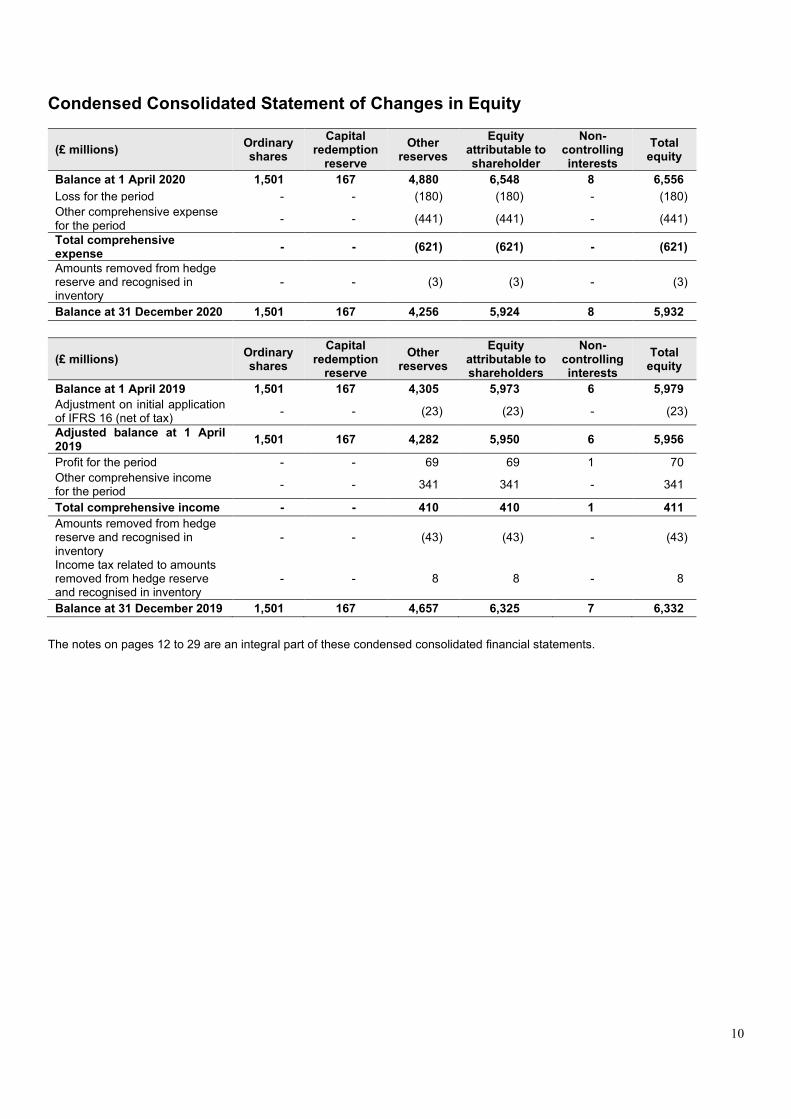
Condensed Consolidated Statement of Changes in Equity
(£ millions) Ordinary shares
Capital redemption
reserve
Other reserves
Equity attributable to shareholder
Non-controlling interests
Total equity
Balance at 1 April 2020 1,501 167 4,880 6,548 8 6,556
Loss for the period - - (180) (180) - (180)
Other comprehensive expense for the period
- - (441) (441) - (441)
Total comprehensive expense
- - (621) (621) - (621)
Amounts removed from hedge reserve and recognised in inventory
- - (3) (3) - (3)
Balance at 31 December 2020 1,501 167 4,256 5,924 8 5,932
(£ millions) Ordinary shares
Capital redemption
reserve
Other reserves
Equity attributable to shareholders
Non-controlling interests
Total equity
Balance at 1 April 2019 1,501 167 4,305 5,973 6 5,979
Adjustment on initial application of IFRS 16 (net of tax)
- - (23) (23) - (23)
Adjusted balance at 1 April 2019
1,501 167 4,282 5,950 6 5,956
Profit for the period - - 69 69 1 70
Other comprehensive income for the period
- - 341 341 - 341
Total comprehensive income - - 410 410 1 411
Amounts removed from hedge reserve and recognised in inventory
- - (43) (43) - (43)
Income tax related to amounts removed from hedge reserve and recognised in inventory
- - 8 8 - 8
Balance at 31 December 2019 1,501 167 4,657 6,325 7 6,332
The notes on pages 12 to 29 are an integral part of these condensed consolidated financial statements.
11
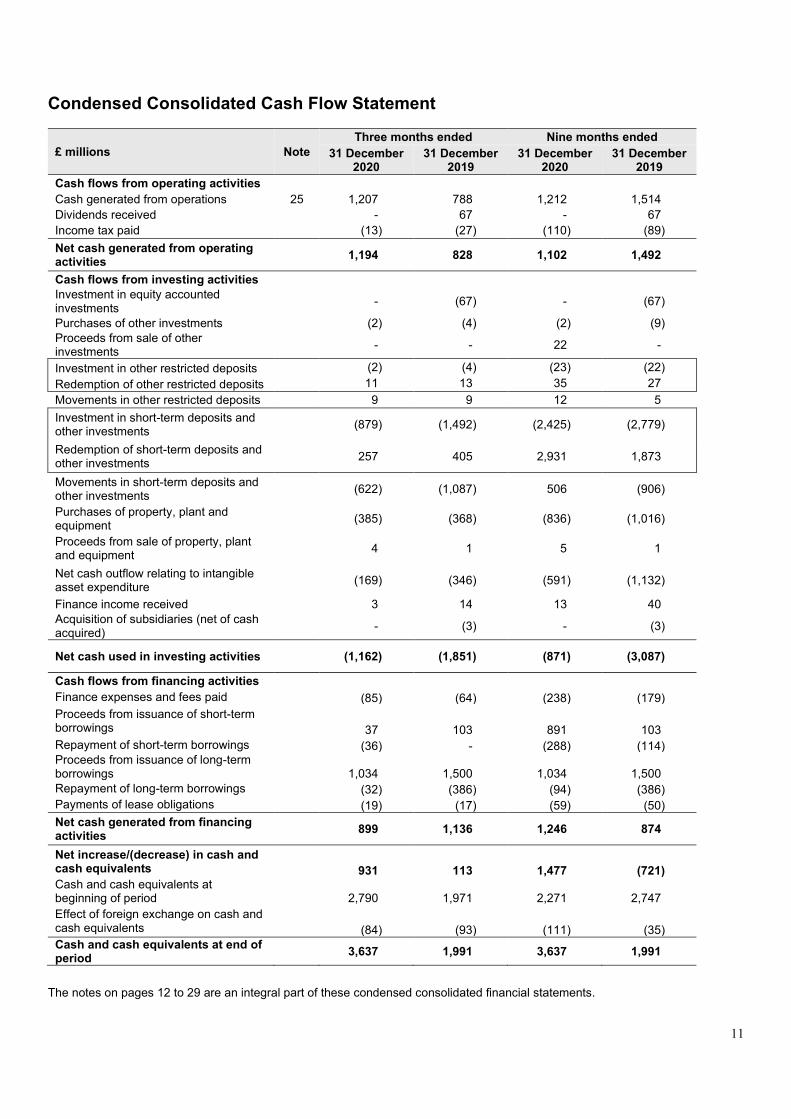
Condensed Consolidated Cash Flow Statement
£ millions Note
Three months ended Nine months ended
31 December 2020
31 December 2019
31 December 2020
31 December 2019
Cash flows from operating activities
Cash generated from operations 25 1,207 788 1,212 1,514
Dividends received - 67 - 67
Income tax paid (13) (27) (110) (89)
Net cash generated from operating activities
1,194 828 1,102 1,492
Cash flows from investing activities
Investment in equity accounted investments
- (67) - (67)
Purchases of other investments (2) (4) (2) (9)
Proceeds from sale of other investments
- - 22 -
Investment in other restricted deposits (2) (4) (23) (22)
Redemption of other restricted deposits 11 13 35 27
Movements in other restricted deposits 9 9 12 5
Investment in short-term deposits and other investments
(879) (1,492) (2,425) (2,779)
Redemption of short-term deposits and other investments
257 405 2,931 1,873
Movements in short-term deposits and other investments
(622) (1,087) 506 (906)
Purchases of property, plant and equipment
(385) (368) (836) (1,016)
Proceeds from sale of property, plant and equipment
4 1 5 1
Net cash outflow relating to intangible asset expenditure
(169) (346) (591) (1,132)
Finance income received 3 14 13 40
Acquisition of subsidiaries (net of cash acquired)
- (3) - (3)
Net cash used in investing activities (1,162) (1,851) (871) (3,087)
Cash flows from financing activities
Finance expenses and fees paid (85) (64) (238) (179)
Proceeds from issuance of short-term borrowings
37 103 891 103
Repayment of short-term borrowings (36) - (288) (114) Proceeds from issuance of long-term borrowings
1,034 1,500 1,034 1,500
Repayment of long-term borrowings (32) (386) (94) (386)
Payments of lease obligations (19) (17) (59) (50)
Net cash generated from financing activities
899 1,136 1,246 874
Net increase/(decrease) in cash and cash equivalents
931 113 1,477 (721)
Cash and cash equivalents at beginning of period
2,790 1,971 2,271 2,747
Effect of foreign exchange on cash and cash equivalents
(84) (93) (111) (35)
Cash and cash equivalents at end of period
3,637 1,991 3,637 1,991
The notes on pages 12 to 29 are an integral part of these condensed consolidated financial statements.
12
Notes (forming part of the condensed consolidated interim financial statements)
1 Accounting policies
Basis of preparation
The financial information in these interim financial statements is unaudited and does not constitute statutory accounts as defined in Section 435 of the Companies Act 2006. The condensed consolidated interim financial statements of Jaguar Land Rover Automotive plc have been prepared in accordance with International Accounting Standard 34, ‘Interim Financial Reporting’ under International Financial Reporting Standards (‘IFRS’) as adopted for use in the UK. The balance sheet and accompanying notes as at 31 December 2019 have been disclosed solely for the information of the users. The condensed consolidated interim financial statements have been prepared on a historical cost basis except for certain financial instruments held at fair value as highlighted in note 19. The condensed consolidated interim financial statements should be read in conjunction with the annual consolidated financial statements for the year ended 31 March 2020, which were prepared in accordance with IFRS as adopted by the EU. The annual consolidated financial statements of the company for the year ended 31 March 2021 will be prepared in accordance with international accounting standards in conformity with the requirements of the Companies Act 2006. The condensed consolidated interim financial statements have been prepared on the going concern basis as set out within the directors’ report of the Group’s Annual Report for the year ended 31 March 2020. The accounting policies applied are consistent with those of the annual consolidated financial statements for the year ended 31 March 2020. The Group has been presenting gains and losses on effective cash flow hedges of inventory in the statement of other comprehensive income and expense as “not to be reclassified to income statement”. With wider industry practice emerging, clearer guidance now being available and with the present economic situation due to COVID-19, the Group has changed the presentation of these effective cash flow hedges of inventory to “may be reclassified to income statement”, from the year ended 31 March 2021 and accordingly reclassified the comparative amounts for the prior periods. The change in presentation is within the statement of other comprehensive income and expense and does not affect net income. Estimates and judgements
The preparation of interim financial statements requires management to make judgements, estimates and assumptions that affect
the application of accounting policies and the reported amounts of assets and liabilities, income and expense. Actual results may
differ from these estimates.
In preparing these condensed interim financial statements, the significant judgements made by management in applying the Group’s
accounting policies and the key sources of estimation uncertainty were the same as those applied to the consolidated financial
statements for the year ended 31 March 2020.
Going concern
The Condensed Interim Financial Statements have been prepared on a going concern basis as the Directors consider that adequate resources exist for the Group to continue operating for the foreseeable future. As set out below the going concern assessment has been performed for a period of 15 months up to March 2022. There is significant liquidity and financing headroom at 31 December 2020 and throughout the going concern forecast period. As at 31 December 2020 total available liquidity stood at £6 billion. As compared to the management estimates at 31 March 2020, the Group’s business performance is better for the nine months ended 31 December 2020, increasing the amount of headroom at 31 December 2020. Year to date wholesale volumes are slightly ahead of the 31 March 2020 base forecast, with a particularly strong recovery in China in the nine months ended 31 December 2020. The EBIT margin for the nine months ended 31 December 2020 was better than that forecast for the FY20 assessment. The going concern assessment has been made utilising the models and assumptions from the assessment performed for the preparation of the FY20 financial statements, with the period to 31 March 2021 being updated for actual observed performance and trends, while the six months period to 30 September 2021 has been kept consistent with the FY20 assessment and the forecast extended to 31 March 2022 using the same basis of preparation. Details of the scenarios and assumptions used in the FY20 assessment are set out in note 2 to the annual financial statements. The Group has modelled two scenarios in its assessment of going concern; a base case and a severe but plausible downside scenario. The base case takes into account the estimated impact of the COVID-19 global pandemic as well as other end market and operational factors throughout the going concern period and has been monitored against the actual results and cash generation in the period since 1 January 2021. The impact of COVID-19 remains uncertain; however, the directors have considered latest external market commentaries and industry forecasts in arriving at a severe but plausible downside scenario.
13
Notes (forming part of the condensed consolidated interim financial statements)
1 Accounting policies (continued)
This downside scenario assumes a 10% reduction in sale volumes in the three months to 31 March 2021, and a 15% reduction each
month for the 12 months to 31 March 2022. Both reductions are relative to the base case volumes. In addition, the downside scenario
includes other risk sensitivities considered in the ‘Severe scenario’ FY20 assessment, details of which are available in the FY20
Annual Report. This additional decline in cash flows over and above the base case has an impact on available UK liquidity (which
excludes cash in subsidiaries outside of the UK, adjusted for intra-month volatility and excludes new funding) of about 20% over the
going concern period when compared to the base scenario.
In the downside scenario there is sufficient liquidity in the forecast for the Group to operate and discharge its liabilities as they fall
due, taking into account only cash generated from operations and the funding facilities existing on the date of authorisation of these
interim financial statements, including the presently undrawn revolving credit facility. Consequently, the directors are confident that
the Group will have sufficient funds to continue to meet its liabilities as they fall due for at least 12 months from the date of approval
of the financial statements and therefore have prepared the interim financial statements on a going concern basis.
2 Government grants
Employee costs for the three and nine month periods ended 31 December 2020 are net of government grants received in relation to employees placed on furlough under the Coronavirus Job Retention Scheme of £5 million and £182 million respectively (three and nine months ended 31 December 2019: £nil). 3 Alternative Performance Measures
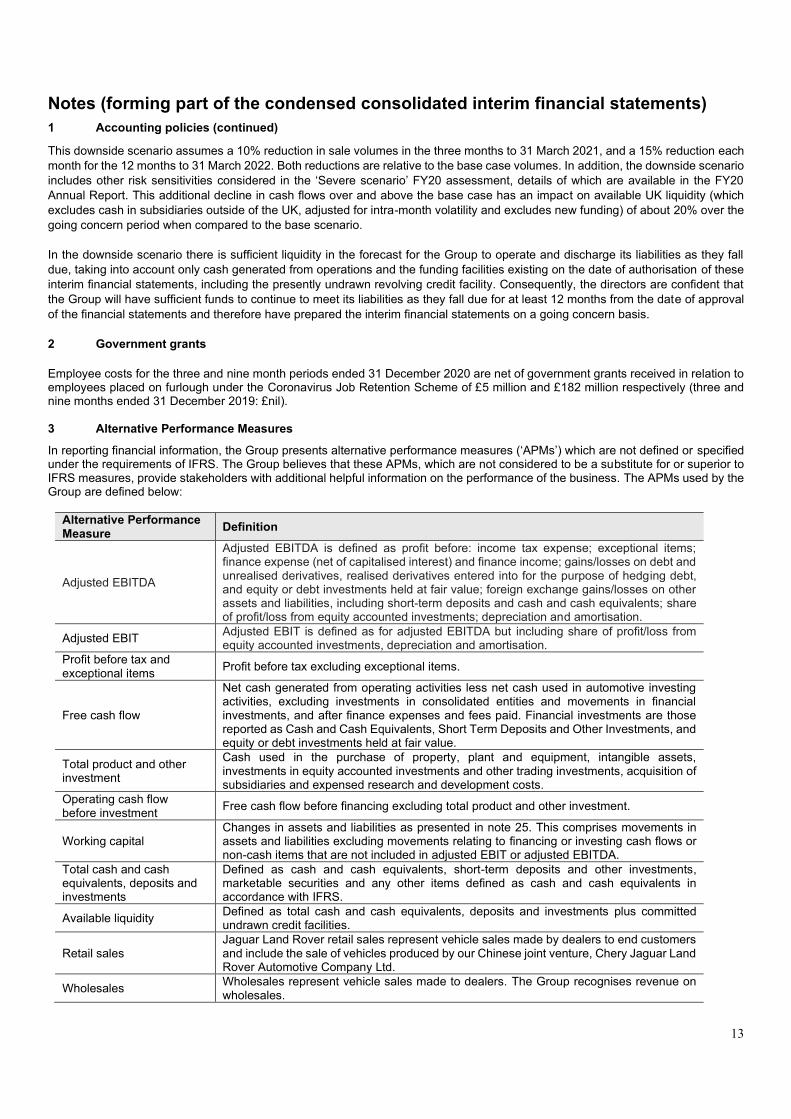
In reporting financial information, the Group presents alternative performance measures (‘APMs’) which are not defined or specified under the requirements of IFRS. The Group believes that these APMs, which are not considered to be a substitute for or superior to IFRS measures, provide stakeholders with additional helpful information on the performance of the business. The APMs used by the Group are defined below:
Alternative Performance Measure
Definition
Adjusted EBITDA
Adjusted EBITDA is defined as profit before: income tax expense; exceptional items; finance expense (net of capitalised interest) and finance income; gains/losses on debt and unrealised derivatives, realised derivatives entered into for the purpose of hedging debt, and equity or debt investments held at fair value; foreign exchange gains/losses on other assets and liabilities, including short-term deposits and cash and cash equivalents; share of profit/loss from equity accounted investments; depreciation and amortisation.
Adjusted EBIT Adjusted EBIT is defined as for adjusted EBITDA but including share of profit/loss from equity accounted investments, depreciation and amortisation.
Profit before tax and exceptional items
Profit before tax excluding exceptional items.
Free cash flow
Net cash generated from operating activities less net cash used in automotive investing activities, excluding investments in consolidated entities and movements in financial investments, and after finance expenses and fees paid. Financial investments are those reported as Cash and Cash Equivalents, Short Term Deposits and Other Investments, and equity or debt investments held at fair value.
Total product and other investment
Cash used in the purchase of property, plant and equipment, intangible assets, investments in equity accounted investments and other trading investments, acquisition of subsidiaries and expensed research and development costs.
Operating cash flow before investment
Free cash flow before financing excluding total product and other investment.
Working capital Changes in assets and liabilities as presented in note 25. This comprises movements in assets and liabilities excluding movements relating to financing or investing cash flows or non-cash items that are not included in adjusted EBIT or adjusted EBITDA.
Total cash and cash equivalents, deposits and investments
Defined as cash and cash equivalents, short-term deposits and other investments, marketable securities and any other items defined as cash and cash equivalents in accordance with IFRS.
Available liquidity Defined as total cash and cash equivalents, deposits and investments plus committed undrawn credit facilities.
Retail sales Jaguar Land Rover retail sales represent vehicle sales made by dealers to end customers and include the sale of vehicles produced by our Chinese joint venture, Chery Jaguar Land Rover Automotive Company Ltd.
Wholesales Wholesales represent vehicle sales made to dealers. The Group recognises revenue on wholesales.
14
Notes (forming part of the condensed consolidated interim financial statements)
3 Alternative Performance Measures (continued) The Group uses adjusted EBITDA as an APM to review and measure the underlying profitability of the Group on an ongoing basis for comparability as it recognises that increased capital expenditure year-on-year will lead to a corresponding increase in depreciation and amortisation expense recognised within the consolidated income statement. The Group uses adjusted EBIT as an APM to review and measure the underlying profitability of the Group on an ongoing basis as this excludes volatility on unrealised foreign exchange transactions. Due to the significant level of debt and currency derivatives, unrealised foreign exchange distorts the financial performance of the Group from one period to another. During the nine month period ended 31 December 2020, the definition of ‘Free cash flow’ was amended to exclude non-automotive investments and net investments in equity and debt investments held at fair value, which are deemed more financial investment in nature. The definition was also amended to exclude foreign exchange gains/losses on short-term deposits and cash and cash equivalents, therefore ensuring more consistent treatment since revaluation of other current assets and liabilities is already excluded. The Group considers these changes should provide greater clarity of Free Cash Flow more closely aligned to JLR’s competitors hence providing improved comparability for users of the APM. Free cash flow for the three and nine month periods ended 31 December 2019 prior to the change was £(144) million and £(927) million respectively. During the nine month period ended 31 December 2020, the definitions of adjusted EBIT and adjusted EBITDA were amended to exclude foreign exchange gains and losses on revaluation of other assets and liabilities, including short-term deposits and cash and cash equivalents. The Group considers the amended APM to better measure the underlying operational profitability of the Group, and is consistent with the treatment of the revaluation of other balance sheet items such as that of debt and unrealised hedges. It also recognises that the Group may use cash and/or derivatives to hedge debt and/or working capital balance sheet exposures and therefore it is logical to present gains or losses on revaluation of all such items consistently, excluded from EBITDA. This is also consistent with the Group’s definition of Free Cash Flow. Adjusted EBIT for the three and nine month periods ended 31 December 2019 prior to the change was £210 million and £227 million respectively. Adjusted EBITDA for the three and nine month periods ended 31 December 2019 prior to the change was £688 million and £1,741 million respectively. Free cash flow is considered by the Group to be a key measure in assessing and understanding the total operating performance of the Group and to identify underlying trends. Total product and other investment is considered by the Group to be a key measure in assessing cash invested in the development of future new models and infrastructure supporting the growth of the Group.
Operating cash flow before investment is used as a measure of the operating performance and cash available to the Group before the direct cash impact of investment decisions. Working capital is considered by the Group to be a key measure in assessing short-term assets and liabilities that are expected to be converted into cash within the next 12-month period. Total cash and cash equivalents, deposits and investments and available liquidity are measures used by the Group to assess liquidity and the availability of funds for future spend and investment. Reconciliations between these alternative performance measures and statutory reported measures are shown on the next pages.
15
Notes (forming part of the condensed consolidated interim financial statements)
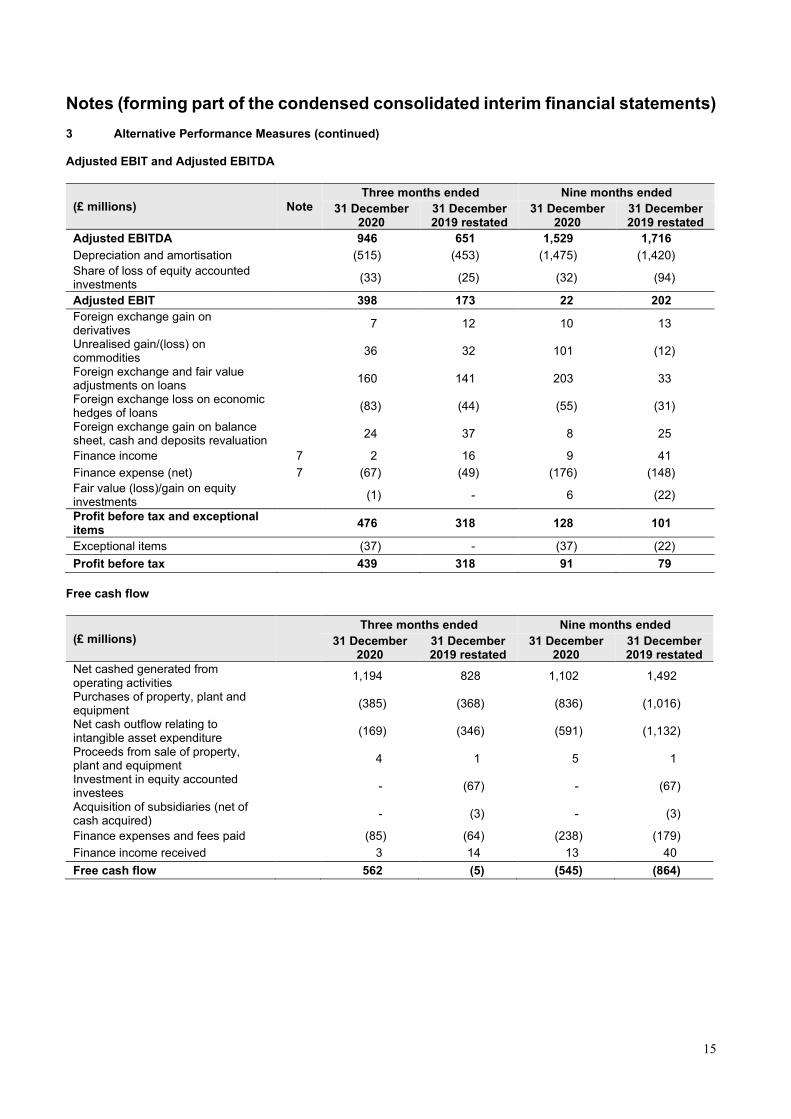
3 Alternative Performance Measures (continued) Adjusted EBIT and Adjusted EBITDA
(£ millions) Note
Three months ended Nine months ended
31 December 2020
31 December 2019 restated
31 December 2020
31 December 2019 restated
Adjusted EBITDA 946 651 1,529 1,716
Depreciation and amortisation (515) (453) (1,475) (1,420)
Share of loss of equity accounted investments
(33) (25) (32) (94)
Adjusted EBIT 398 173 22 202
Foreign exchange gain on derivatives
7 12 10 13
Unrealised gain/(loss) on commodities
36 32 101 (12)
Foreign exchange and fair value adjustments on loans
160 141 203 33
Foreign exchange loss on economic hedges of loans
(83) (44) (55) (31)
Foreign exchange gain on balance sheet, cash and deposits revaluation
24 37 8 25
Finance income 7 2 16 9 41
Finance expense (net) 7 (67) (49) (176) (148)
Fair value (loss)/gain on equity investments
(1) - 6 (22)
Profit before tax and exceptional items
476 318 128 101
Exceptional items (37) - (37) (22)
Profit before tax 439 318 91 79
Free cash flow
(£ millions)
Three months ended Nine months ended
31 December 2020
31 December 2019 restated
31 December 2020
31 December 2019 restated
Net cashed generated from operating activities
1,194 828 1,102 1,492
Purchases of property, plant and equipment
(385) (368) (836) (1,016)
Net cash outflow relating to intangible asset expenditure
(169) (346) (591) (1,132)
Proceeds from sale of property, plant and equipment
4 1 5 1
Investment in equity accounted investees
- (67) - (67)
Acquisition of subsidiaries (net of cash acquired)
- (3) - (3)
Finance expenses and fees paid (85) (64) (238) (179)
Finance income received 3 14 13 40
Free cash flow 562 (5) (545) (864)

16
Notes (forming part of the condensed consolidated interim financial statements)
3 Alternative Performance Measures (continued)
Total product and other investment
(£ millions) Note
Three months ended Nine months ended
31 December 2020
31 December 2019
31 December 2020
31 December 2019
Purchase of property, plant and equipment
385 368 836 1,016
Net cash outflow relating to intangible asset expenditure
169 346 591 1,132
Engineering costs expensed 6 119 104 325 301
Investment in equity accounted investees
- 67 - 67
Purchases of other investments 2 4 2 9
Acquisition of subsidiary - 3 - 3
Total product and other investment
675 892 1,754 2,528
In accordance with the definition of total product and other investment set out on page 13, “Engineering costs expensed” for the three and nine month periods ended 31 December 2020 include £4 million and £44 million respectively of employee costs in relation to employees placed on furlough under the Coronavirus Job Retention Scheme. “Engineering costs expensed” excludes the impacts of grants received.
Total cash and cash equivalents, deposits and investments
As at (£ millions) 31 December 2020 31 March 2020 31 December 2019
Cash and cash equivalents 3,637 2,271 1,991
Short-term deposits and other investments
859 1,393 1,910
Total cash and cash equivalents, deposits and investments
4,496 3,664 3,901
Available liquidity
As at (£ millions) 31 December 2020 31 March 2020 31 December 2019
Cash and cash equivalents 3,637 2,271 1,991
Short-term deposits and other investments
859 1,393 1,910
Committed undrawn credit facilities
1,938 1,935 1,935
Available liquidity 6,434 5,599 5,836
Retails and wholesales
Units
Three months ended Nine months ended
31 December
2020 31 December
2019 31 December
2020 31 December
2019
Retail sales 128,469 141,222 316,105 398,790
Wholesales* 102,580 129,947 224,943 355,261
*Wholesale volumes exclude sales from Chery Jaguar Land Rover – Q3 FY21: 17,078 units, Q3 FY20: 15,437 units, Q3 YTD FY21: 51,507 units, Q3 YTD FY20: 43,162 units
17
Notes (forming part of the condensed consolidated interim financial statements)
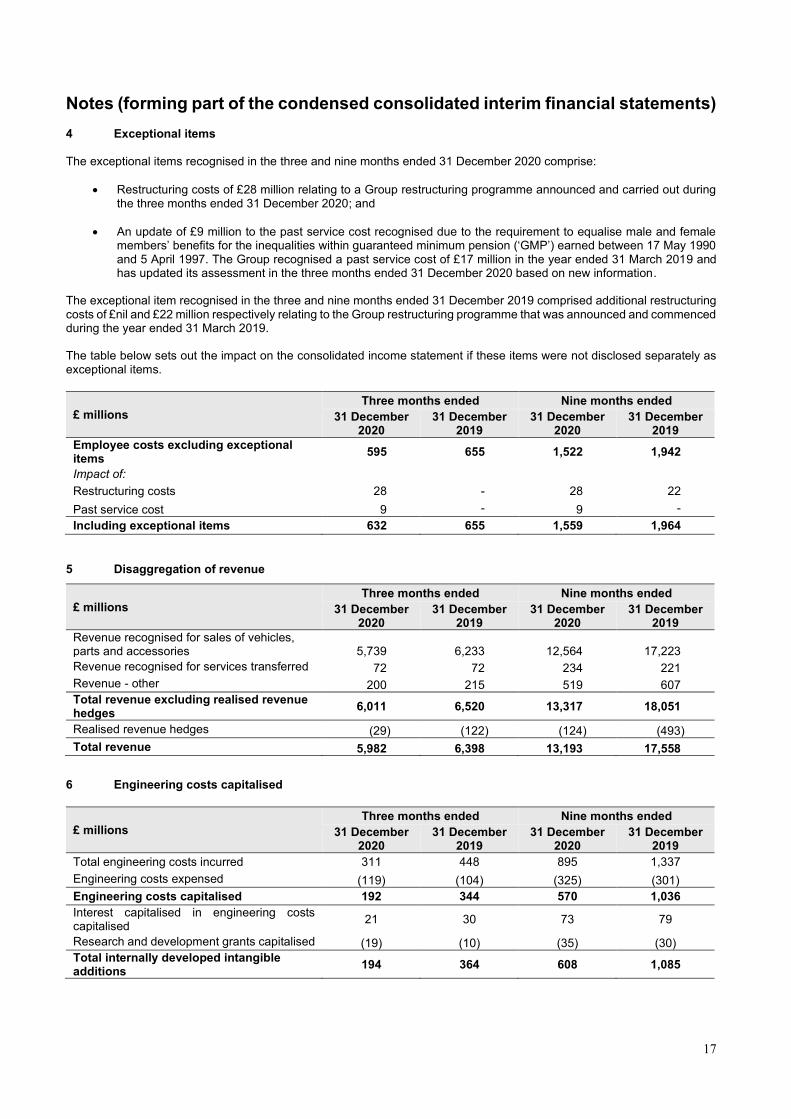
4 Exceptional items The exceptional items recognised in the three and nine months ended 31 December 2020 comprise:
• Restructuring costs of £28 million relating to a Group restructuring programme announced and carried out during the three months ended 31 December 2020; and
• An update of £9 million to the past service cost recognised due to the requirement to equalise male and female members’ benefits for the inequalities within guaranteed minimum pension (‘GMP’) earned between 17 May 1990 and 5 April 1997. The Group recognised a past service cost of £17 million in the year ended 31 March 2019 and has updated its assessment in the three months ended 31 December 2020 based on new information.
The exceptional item recognised in the three and nine months ended 31 December 2019 comprised additional restructuring costs of £nil and £22 million respectively relating to the Group restructuring programme that was announced and commenced during the year ended 31 March 2019. The table below sets out the impact on the consolidated income statement if these items were not disclosed separately as exceptional items.
£ millions
Three months ended Nine months ended
31 December 2020
31 December 2019
31 December 2020
31 December 2019
Employee costs excluding exceptional items
595 655 1,522 1,942
Impact of:
Restructuring costs 28 - 28 22
Past service cost 9 - 9 -
Including exceptional items 632 655 1,559 1,964
5 Disaggregation of revenue
£ millions
Three months ended Nine months ended
31 December 2020
31 December 2019
31 December 2020
31 December 2019
Revenue recognised for sales of vehicles, parts and accessories 5,739 6,233 12,564 17,223
Revenue recognised for services transferred 72 72 234 221
Revenue - other 200 215 519 607
Total revenue excluding realised revenue hedges
6,011 6,520 13,317 18,051
Realised revenue hedges (29) (122) (124) (493)
Total revenue 5,982 6,398 13,193 17,558
6 Engineering costs capitalised
£ millions
Three months ended Nine months ended
31 December 2020
31 December 2019
31 December 2020
31 December 2019
Total engineering costs incurred 311 448 895 1,337
Engineering costs expensed (119) (104) (325) (301)
Engineering costs capitalised 192 344 570 1,036
Interest capitalised in engineering costs capitalised
21 30 73 79
Research and development grants capitalised (19) (10) (35) (30)
Total internally developed intangible additions
194 364 608 1,085
18
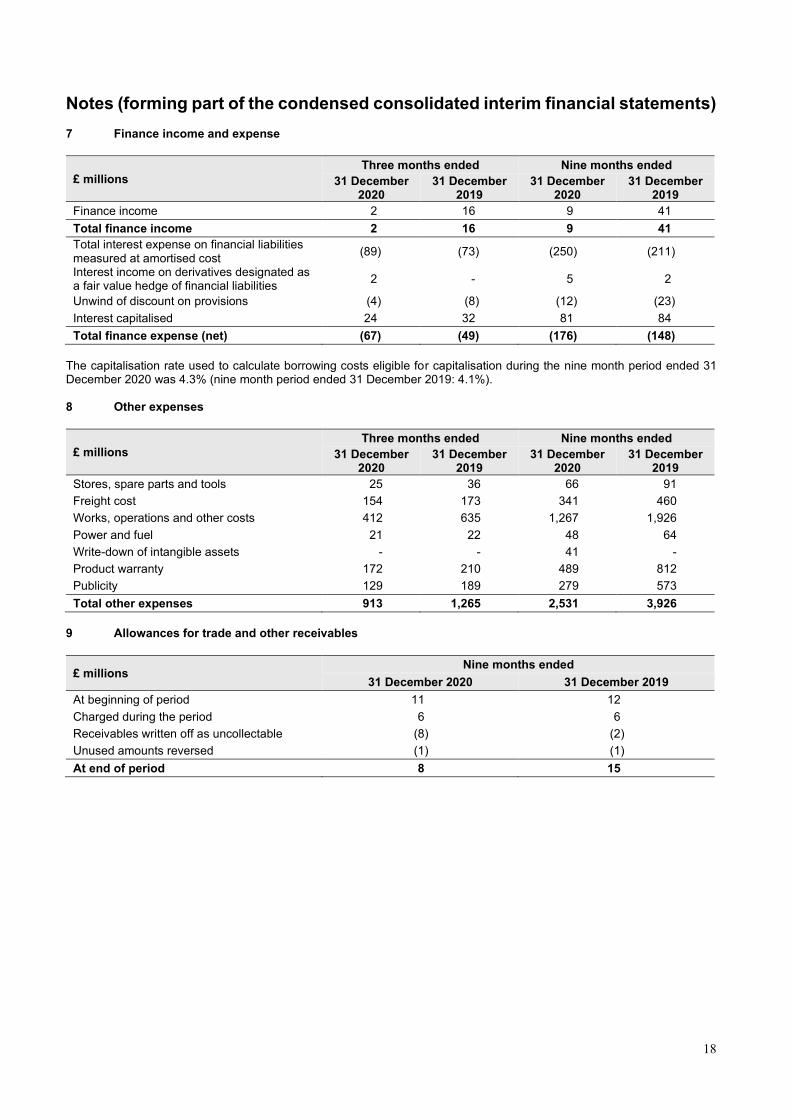
Notes (forming part of the condensed consolidated interim financial statements) 7 Finance income and expense
£ millions
Three months ended Nine months ended
31 December 2020
31 December 2019
31 December 2020
31 December 2019
Finance income 2 16 9 41
Total finance income 2 16 9 41
Total interest expense on financial liabilities measured at amortised cost
(89) (73) (250) (211)
Interest income on derivatives designated as a fair value hedge of financial liabilities
2 - 5 2
Unwind of discount on provisions (4) (8) (12) (23)
Interest capitalised 24 32 81 84
Total finance expense (net) (67) (49) (176) (148)
The capitalisation rate used to calculate borrowing costs eligible for capitalisation during the nine month period ended 31 December 2020 was 4.3% (nine month period ended 31 December 2019: 4.1%). 8 Other expenses
£ millions
Three months ended Nine months ended
31 December 2020
31 December 2019
31 December 2020
31 December 2019
Stores, spare parts and tools 25 36 66 91
Freight cost 154 173 341 460
Works, operations and other costs 412 635 1,267 1,926
Power and fuel 21 22 48 64
Write-down of intangible assets - - 41 -
Product warranty 172 210 489 812
Publicity 129 189 279 573
Total other expenses 913 1,265 2,531 3,926
9 Allowances for trade and other receivables
£ millions Nine months ended
31 December 2020 31 December 2019
At beginning of period 11 12
Charged during the period 6 6
Receivables written off as uncollectable (8) (2)
Unused amounts reversed (1) (1)
At end of period 8 15
19
Notes (forming part of the condensed consolidated interim financial statements)
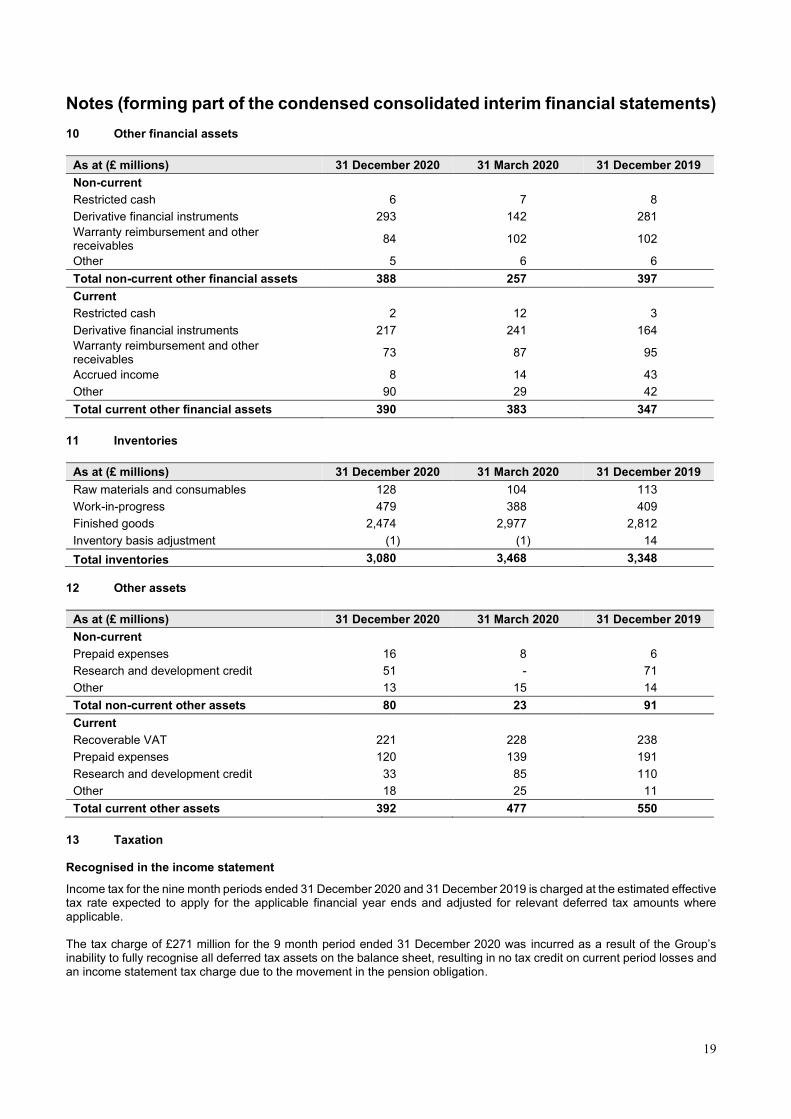
10 Other financial assets
As at (£ millions) 31 December 2020 31 March 2020 31 December 2019
Non-current
Restricted cash 6 7 8
Derivative financial instruments 293 142 281
Warranty reimbursement and other receivables
84 102 102
Other 5 6 6
Total non-current other financial assets 388 257 397
Current
Restricted cash 2 12 3
Derivative financial instruments 217 241 164
Warranty reimbursement and other receivables
73 87 95
Accrued income 8 14 43
Other 90 29 42
Total current other financial assets 390 383 347
11 Inventories
As at (£ millions) 31 December 2020 31 March 2020 31 December 2019
Raw materials and consumables 128 104 113
Work-in-progress 479 388 409
Finished goods 2,474 2,977 2,812
Inventory basis adjustment (1) (1) 14
Total inventories 3,080 3,468 3,348
12 Other assets
As at (£ millions) 31 December 2020 31 March 2020 31 December 2019
Non-current
Prepaid expenses 16 8 6
Research and development credit 51 - 71
Other 13 15 14
Total non-current other assets 80 23 91
Current
Recoverable VAT 221 228 238
Prepaid expenses 120 139 191
Research and development credit 33 85 110
Other 18 25 11
Total current other assets 392 477 550
13 Taxation Recognised in the income statement
Income tax for the nine month periods ended 31 December 2020 and 31 December 2019 is charged at the estimated effective tax rate expected to apply for the applicable financial year ends and adjusted for relevant deferred tax amounts where applicable. The tax charge of £271 million for the 9 month period ended 31 December 2020 was incurred as a result of the Group’s inability to fully recognise all deferred tax assets on the balance sheet, resulting in no tax credit on current period losses and an income statement tax charge due to the movement in the pension obligation.
20
Notes (forming part of the condensed consolidated interim financial statements)
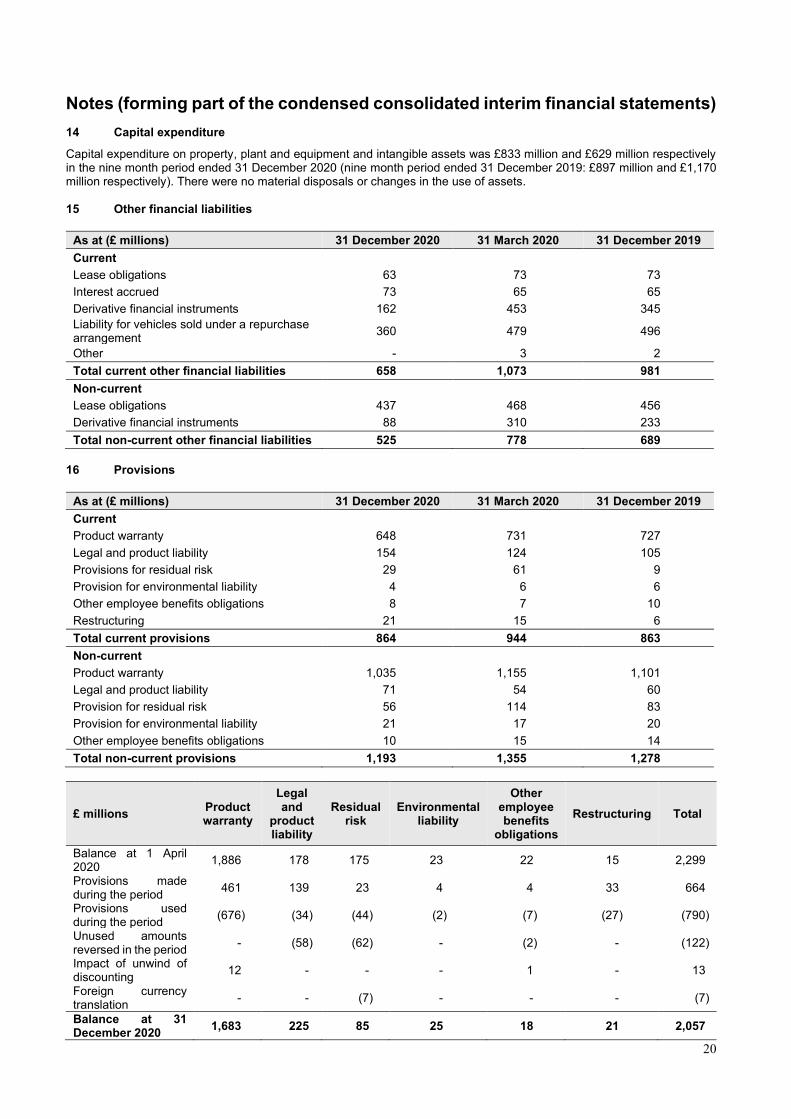
14 Capital expenditure
Capital expenditure on property, plant and equipment and intangible assets was £833 million and £629 million respectively in the nine month period ended 31 December 2020 (nine month period ended 31 December 2019: £897 million and £1,170 million respectively). There were no material disposals or changes in the use of assets. 15 Other financial liabilities
As at (£ millions) 31 December 2020 31 March 2020 31 December 2019
Current Lease obligations 63 73 73
Interest accrued 73 65 65
Derivative financial instruments 162 453 345
Liability for vehicles sold under a repurchase arrangement
360 479 496
Other - 3 2
Total current other financial liabilities 658 1,073 981
Non-current
Lease obligations 437 468 456
Derivative financial instruments 88 310 233
Total non-current other financial liabilities 525 778 689
16 Provisions
As at (£ millions) 31 December 2020 31 March 2020 31 December 2019
Current
Product warranty 648 731 727
Legal and product liability 154 124 105
Provisions for residual risk 29 61 9
Provision for environmental liability 4 6 6
Other employee benefits obligations 8 7 10
Restructuring 21 15 6
Total current provisions 864 944 863
Non-current
Product warranty 1,035 1,155 1,101
Legal and product liability 71 54 60
Provision for residual risk 56 114 83
Provision for environmental liability 21 17 20
Other employee benefits obligations 10 15 14
Total non-current provisions 1,193 1,355 1,278
£ millions Product warranty
Legal and
product liability
Residual risk
Environmental liability
Other employee benefits
obligations
Restructuring Total
Balance at 1 April 2020
1,886 178 175 23 22 15 2,299
Provisions made during the period
461 139 23 4 4 33 664
Provisions used during the period
(676) (34) (44) (2) (7) (27) (790)
Unused amounts reversed in the period
- (58) (62) - (2) - (122)
Impact of unwind of discounting
12 - - - 1 - 13
Foreign currency translation
- - (7) - - - (7)
Balance at 31 December 2020
1,683 225 85 25 18 21 2,057
21
Notes (forming part of the condensed consolidated interim financial statements) 16 Provisions (continued)
Product warranty provision
The Group offers warranty cover in respect of manufacturing defects, which become apparent one to five years after purchase, dependent on the market in which the purchase occurred and the vehicle purchased. The Group offers warranties of up to eight years on batteries in electric vehicles. The estimated liability for product warranty is recognised when products are sold or when new warranty programmes are initiated. These estimates are established using historical information on the nature, frequency and average cost of warranty claims and management estimates regarding possible future warranty claims, customer goodwill and recall complaints. The discount on the warranty provision is calculated using a risk-free discount rate as the risks specific to the liability, such as inflation, are included in the base calculation. The timing of outflows will vary as and when a warranty claim will arise, being typically up to eight years. Legal and product liability provision
A legal and product liability provision is maintained in respect of compliance with regulations and known litigations that impact the Group. The provision primarily relates to motor accident claims, consumer complaints, retailer terminations, employment cases, personal injury claims and compliance with emission and battery disposal regulations. The timing of outflows will vary as and when claims are received and settled, which is not known with certainty. Residual risk provision
In certain markets, the Group is responsible for the residual risk arising on vehicles sold by retailers on leasing arrangements. The provision is based on the latest available market expectations of future residual value trends. The timing of the outflows will be at the end of the lease arrangements, being typically up to three years. Environmental liability provision
This provision relates to various environmental remediation costs such as asbestos removal and land clean-up. The timing of when these costs will be incurred is not known with certainty. Other employee benefits obligations
This provision relates to the LTIP scheme for certain employees and other amounts payable to employees. Restructuring provision This provision relates to amounts payable to employees under Group restructuring programmes.
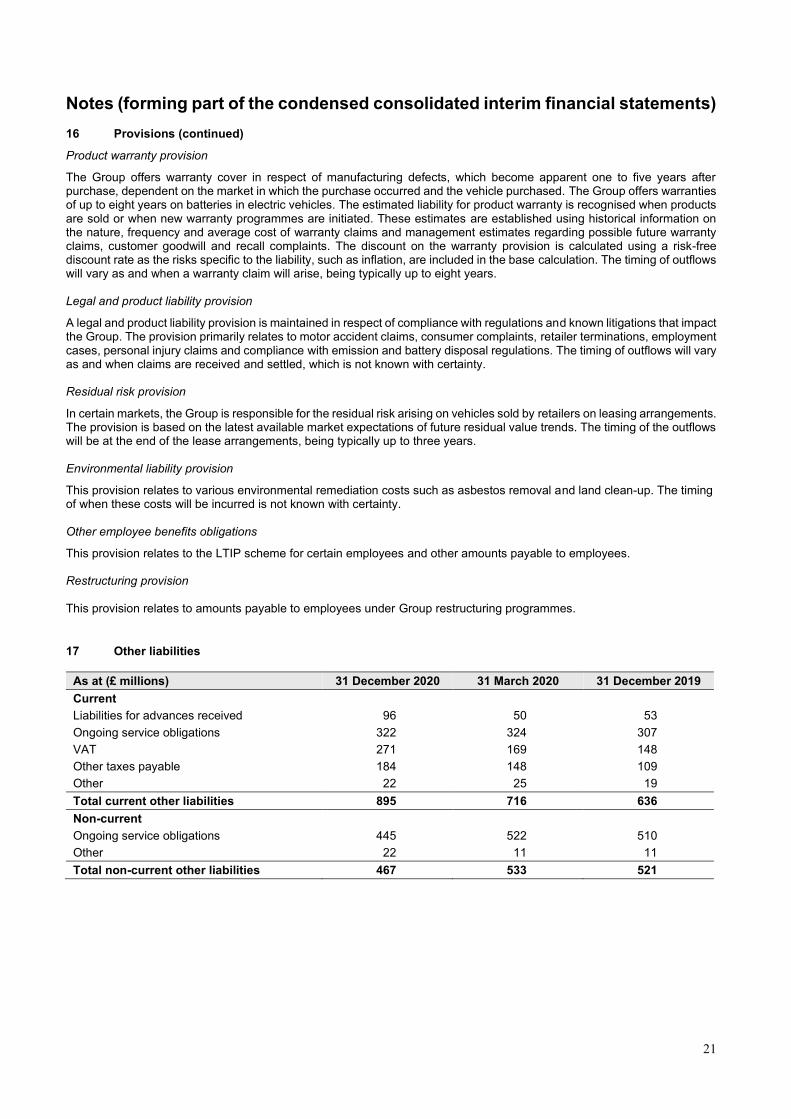
17 Other liabilities
As at (£ millions) 31 December 2020 31 March 2020 31 December 2019
Current Liabilities for advances received 96 50 53
Ongoing service obligations 322 324 307
VAT 271 169 148
Other taxes payable 184 148 109
Other 22 25 19
Total current other liabilities 895 716 636
Non-current
Ongoing service obligations 445 522 510
Other 22 11 11
Total non-current other liabilities 467 533 521
22
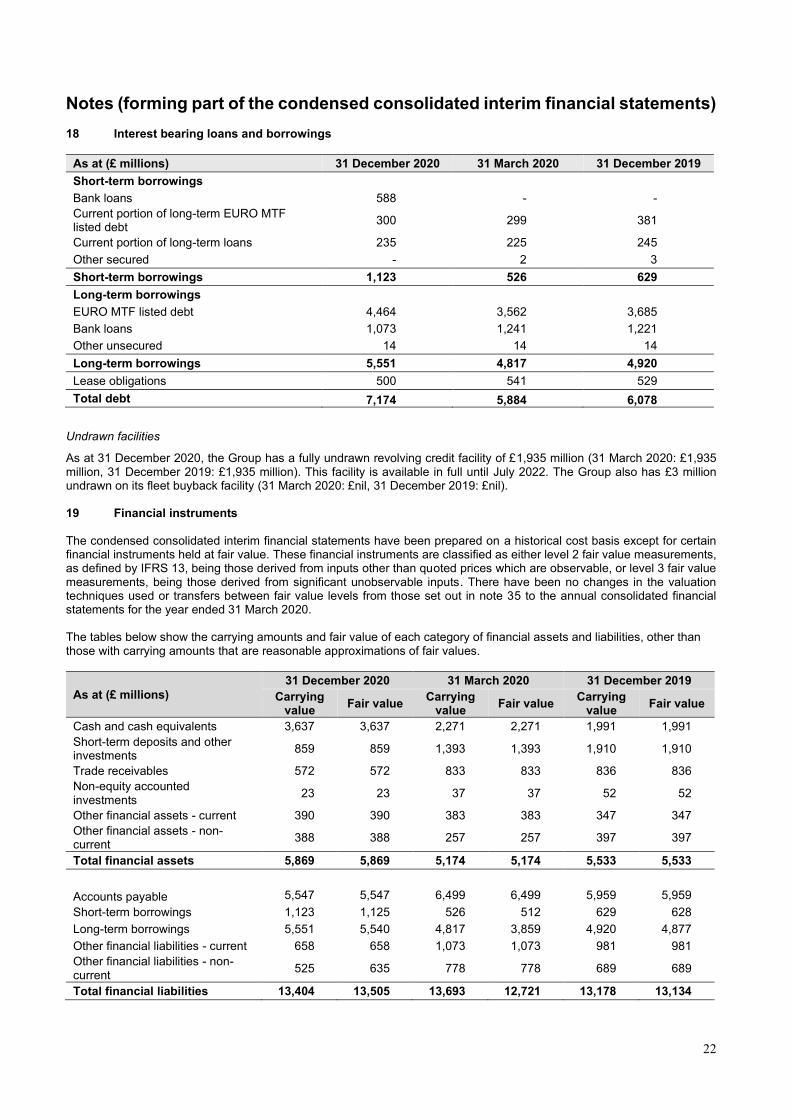
Notes (forming part of the condensed consolidated interim financial statements) 18 Interest bearing loans and borrowings
As at (£ millions) 31 December 2020 31 March 2020 31 December 2019
Short-term borrowings
Bank loans 588 - -
Current portion of long-term EURO MTF listed debt
300 299 381
Current portion of long-term loans 235 225 245
Other secured - 2 3
Short-term borrowings 1,123 526 629
Long-term borrowings
EURO MTF listed debt 4,464 3,562 3,685
Bank loans 1,073 1,241 1,221
Other unsecured 14 14 14
Long-term borrowings 5,551 4,817 4,920
Lease obligations 500 541 529
Total debt 7,174 5,884 6,078
Undrawn facilities
As at 31 December 2020, the Group has a fully undrawn revolving credit facility of £1,935 million (31 March 2020: £1,935 million, 31 December 2019: £1,935 million). This facility is available in full until July 2022. The Group also has £3 million undrawn on its fleet buyback facility (31 March 2020: £nil, 31 December 2019: £nil). 19 Financial instruments The condensed consolidated interim financial statements have been prepared on a historical cost basis except for certain financial instruments held at fair value. These financial instruments are classified as either level 2 fair value measurements, as defined by IFRS 13, being those derived from inputs other than quoted prices which are observable, or level 3 fair value measurements, being those derived from significant unobservable inputs. There have been no changes in the valuation techniques used or transfers between fair value levels from those set out in note 35 to the annual consolidated financial statements for the year ended 31 March 2020. The tables below show the carrying amounts and fair value of each category of financial assets and liabilities, other than those with carrying amounts that are reasonable approximations of fair values.
As at (£ millions)
31 December 2020 31 March 2020 31 December 2019
Carrying value
Fair value Carrying
value Fair value
Carrying value
Fair value
Cash and cash equivalents 3,637 3,637 2,271 2,271 1,991 1,991
Short-term deposits and other investments
859 859 1,393 1,393 1,910 1,910
Trade receivables 572 572 833 833 836 836
Non-equity accounted investments
23 23 37 37 52 52
Other financial assets - current 390 390 383 383 347 347
Other financial assets - non-current
388 388 257 257 397 397
Total financial assets 5,869 5,869 5,174 5,174 5,533 5,533
Accounts payable 5,547 5,547 6,499 6,499 5,959 5,959
Short-term borrowings 1,123 1,125 526 512 629 628
Long-term borrowings 5,551 5,540 4,817 3,859 4,920 4,877
Other financial liabilities - current 658 658 1,073 1,073 981 981
Other financial liabilities - non-current
525 635 778 778 689 689
Total financial liabilities 13,404 13,505 13,693 12,721 13,178 13,134
23
Notes (forming part of the condensed consolidated interim financial statements)
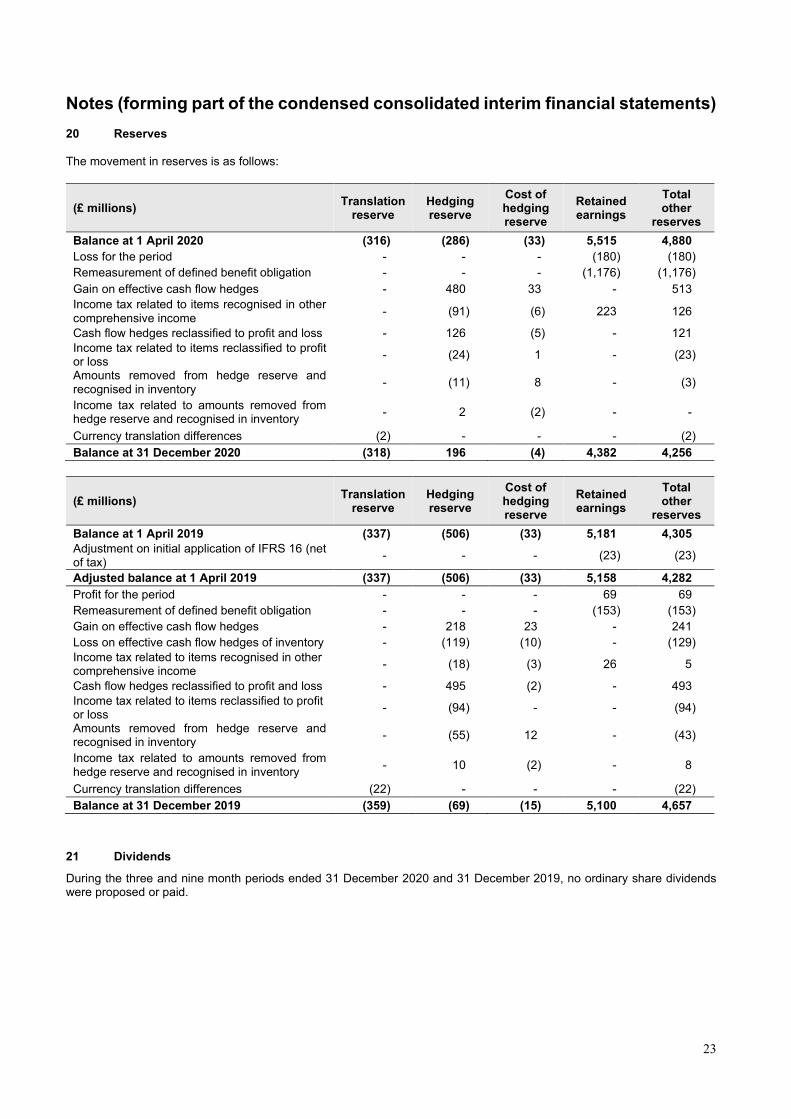
20 Reserves The movement in reserves is as follows:
(£ millions) Translation
reserve Hedging reserve
Cost of hedging reserve
Retained earnings
Total other
reserves
Balance at 1 April 2020 (316) (286) (33) 5,515 4,880
Loss for the period - - - (180) (180)
Remeasurement of defined benefit obligation - - - (1,176) (1,176)
Gain on effective cash flow hedges - 480 33 - 513
Income tax related to items recognised in other comprehensive income
- (91) (6) 223 126
Cash flow hedges reclassified to profit and loss - 126 (5) - 121
Income tax related to items reclassified to profit or loss
- (24) 1 - (23)
Amounts removed from hedge reserve and recognised in inventory
- (11) 8 - (3)
Income tax related to amounts removed from hedge reserve and recognised in inventory
- 2 (2) - -
Currency translation differences (2) - - - (2)
Balance at 31 December 2020 (318) 196 (4) 4,382 4,256
(£ millions) Translation
reserve Hedging reserve
Cost of hedging reserve
Retained earnings
Total other
reserves
Balance at 1 April 2019 (337) (506) (33) 5,181 4,305
Adjustment on initial application of IFRS 16 (net of tax)
- - - (23) (23)
Adjusted balance at 1 April 2019 (337) (506) (33) 5,158 4,282
Profit for the period - - - 69 69
Remeasurement of defined benefit obligation - - - (153) (153)
Gain on effective cash flow hedges - 218 23 - 241
Loss on effective cash flow hedges of inventory - (119) (10) - (129)
Income tax related to items recognised in other comprehensive income
- (18) (3) 26 5
Cash flow hedges reclassified to profit and loss - 495 (2) - 493
Income tax related to items reclassified to profit or loss
- (94) - - (94)
Amounts removed from hedge reserve and recognised in inventory
- (55) 12 - (43)
Income tax related to amounts removed from hedge reserve and recognised in inventory
- 10 (2) - 8
Currency translation differences (22) - - - (22)
Balance at 31 December 2019 (359) (69) (15) 5,100 4,657
21 Dividends
During the three and nine month periods ended 31 December 2020 and 31 December 2019, no ordinary share dividends were proposed or paid.
24
Notes (forming part of the condensed consolidated interim financial statements)
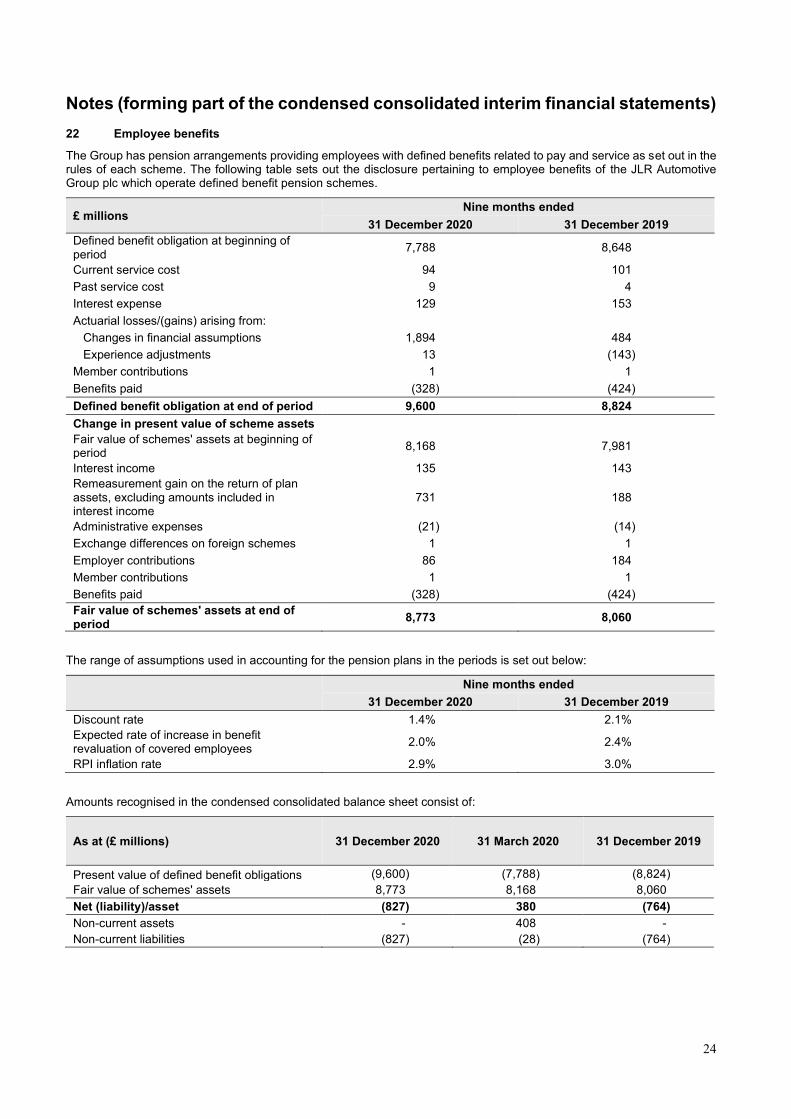
22 Employee benefits
The Group has pension arrangements providing employees with defined benefits related to pay and service as set out in the rules of each scheme. The following table sets out the disclosure pertaining to employee benefits of the JLR Automotive Group plc which operate defined benefit pension schemes.
£ millions Nine months ended
31 December 2020 31 December 2019
Defined benefit obligation at beginning of period
7,788 8,648
Current service cost 94 101
Past service cost 9 4
Interest expense 129 153
Actuarial losses/(gains) arising from:
Changes in financial assumptions 1,894 484
Experience adjustments 13 (143)
Member contributions 1 1
Benefits paid (328) (424)
Defined benefit obligation at end of period 9,600 8,824
Change in present value of scheme assets
Fair value of schemes' assets at beginning of period
8,168 7,981
Interest income 135 143
Remeasurement gain on the return of plan assets, excluding amounts included in interest income
731 188
Administrative expenses (21) (14)
Exchange differences on foreign schemes 1 1
Employer contributions 86 184
Member contributions 1 1
Benefits paid (328) (424)
Fair value of schemes' assets at end of period
8,773 8,060
The range of assumptions used in accounting for the pension plans in the periods is set out below:
Nine months ended
31 December 2020 31 December 2019
Discount rate 1.4% 2.1%
Expected rate of increase in benefit revaluation of covered employees
2.0% 2.4%
RPI inflation rate 2.9% 3.0%
Amounts recognised in the condensed consolidated balance sheet consist of:
As at (£ millions) 31 December 2020 31 March 2020 31 December 2019
Present value of defined benefit obligations (9,600) (7,788) (8,824)
Fair value of schemes' assets 8,773 8,168 8,060
Net (liability)/asset (827) 380 (764)
Non-current assets - 408 -
Non-current liabilities (827) (28) (764)
25
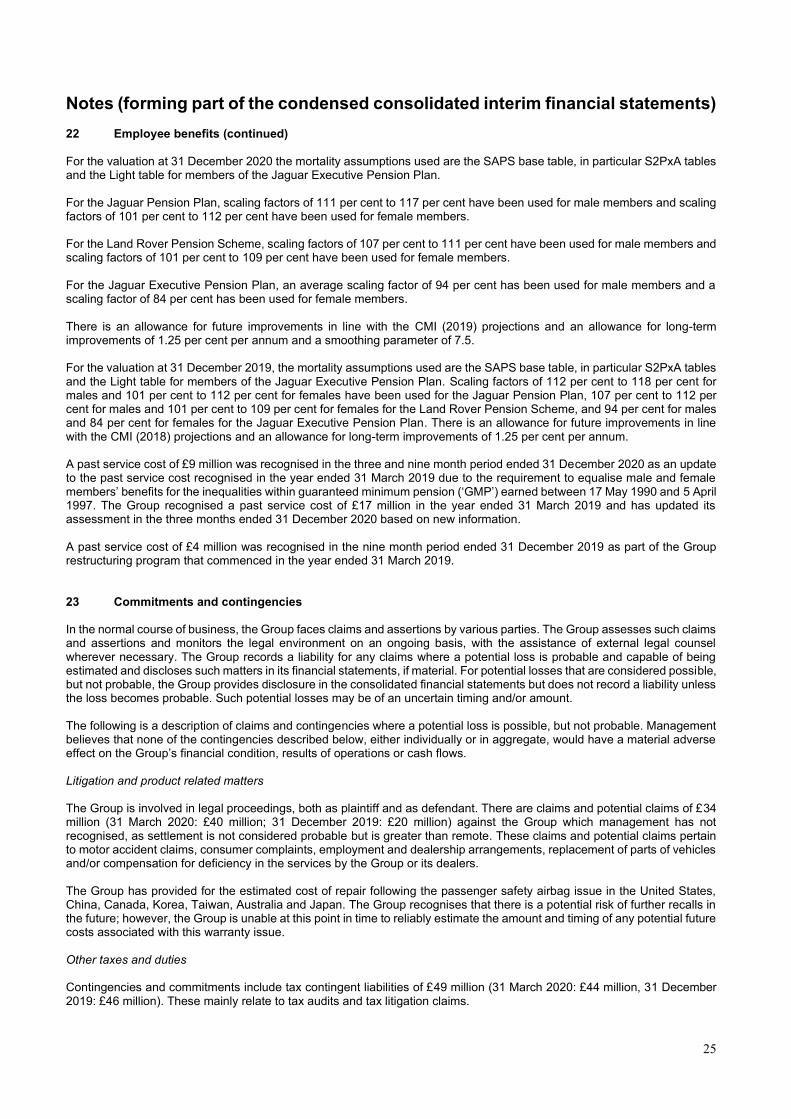
Notes (forming part of the condensed consolidated interim financial statements) 22 Employee benefits (continued) For the valuation at 31 December 2020 the mortality assumptions used are the SAPS base table, in particular S2PxA tables and the Light table for members of the Jaguar Executive Pension Plan. For the Jaguar Pension Plan, scaling factors of 111 per cent to 117 per cent have been used for male members and scaling factors of 101 per cent to 112 per cent have been used for female members. For the Land Rover Pension Scheme, scaling factors of 107 per cent to 111 per cent have been used for male members and scaling factors of 101 per cent to 109 per cent have been used for female members. For the Jaguar Executive Pension Plan, an average scaling factor of 94 per cent has been used for male members and a scaling factor of 84 per cent has been used for female members. There is an allowance for future improvements in line with the CMI (2019) projections and an allowance for long-term improvements of 1.25 per cent per annum and a smoothing parameter of 7.5. For the valuation at 31 December 2019, the mortality assumptions used are the SAPS base table, in particular S2PxA tables and the Light table for members of the Jaguar Executive Pension Plan. Scaling factors of 112 per cent to 118 per cent for males and 101 per cent to 112 per cent for females have been used for the Jaguar Pension Plan, 107 per cent to 112 per cent for males and 101 per cent to 109 per cent for females for the Land Rover Pension Scheme, and 94 per cent for males and 84 per cent for females for the Jaguar Executive Pension Plan. There is an allowance for future improvements in line with the CMI (2018) projections and an allowance for long-term improvements of 1.25 per cent per annum. A past service cost of £9 million was recognised in the three and nine month period ended 31 December 2020 as an update to the past service cost recognised in the year ended 31 March 2019 due to the requirement to equalise male and female members’ benefits for the inequalities within guaranteed minimum pension (‘GMP’) earned between 17 May 1990 and 5 April 1997. The Group recognised a past service cost of £17 million in the year ended 31 March 2019 and has updated its assessment in the three months ended 31 December 2020 based on new information. A past service cost of £4 million was recognised in the nine month period ended 31 December 2019 as part of the Group restructuring program that commenced in the year ended 31 March 2019. 23 Commitments and contingencies In the normal course of business, the Group faces claims and assertions by various parties. The Group assesses such claims and assertions and monitors the legal environment on an ongoing basis, with the assistance of external legal counsel wherever necessary. The Group records a liability for any claims where a potential loss is probable and capable of being estimated and discloses such matters in its financial statements, if material. For potential losses that are considered possible, but not probable, the Group provides disclosure in the consolidated financial statements but does not record a liability unless the loss becomes probable. Such potential losses may be of an uncertain timing and/or amount. The following is a description of claims and contingencies where a potential loss is possible, but not probable. Management believes that none of the contingencies described below, either individually or in aggregate, would have a material adverse effect on the Group’s financial condition, results of operations or cash flows. Litigation and product related matters The Group is involved in legal proceedings, both as plaintiff and as defendant. There are claims and potential claims of £34 million (31 March 2020: £40 million; 31 December 2019: £20 million) against the Group which management has not recognised, as settlement is not considered probable but is greater than remote. These claims and potential claims pertain to motor accident claims, consumer complaints, employment and dealership arrangements, replacement of parts of vehicles and/or compensation for deficiency in the services by the Group or its dealers. The Group has provided for the estimated cost of repair following the passenger safety airbag issue in the United States, China, Canada, Korea, Taiwan, Australia and Japan. The Group recognises that there is a potential risk of further recalls in the future; however, the Group is unable at this point in time to reliably estimate the amount and timing of any potential future costs associated with this warranty issue. Other taxes and duties Contingencies and commitments include tax contingent liabilities of £49 million (31 March 2020: £44 million, 31 December 2019: £46 million). These mainly relate to tax audits and tax litigation claims.
26
Notes (forming part of the condensed consolidated interim financial statements)
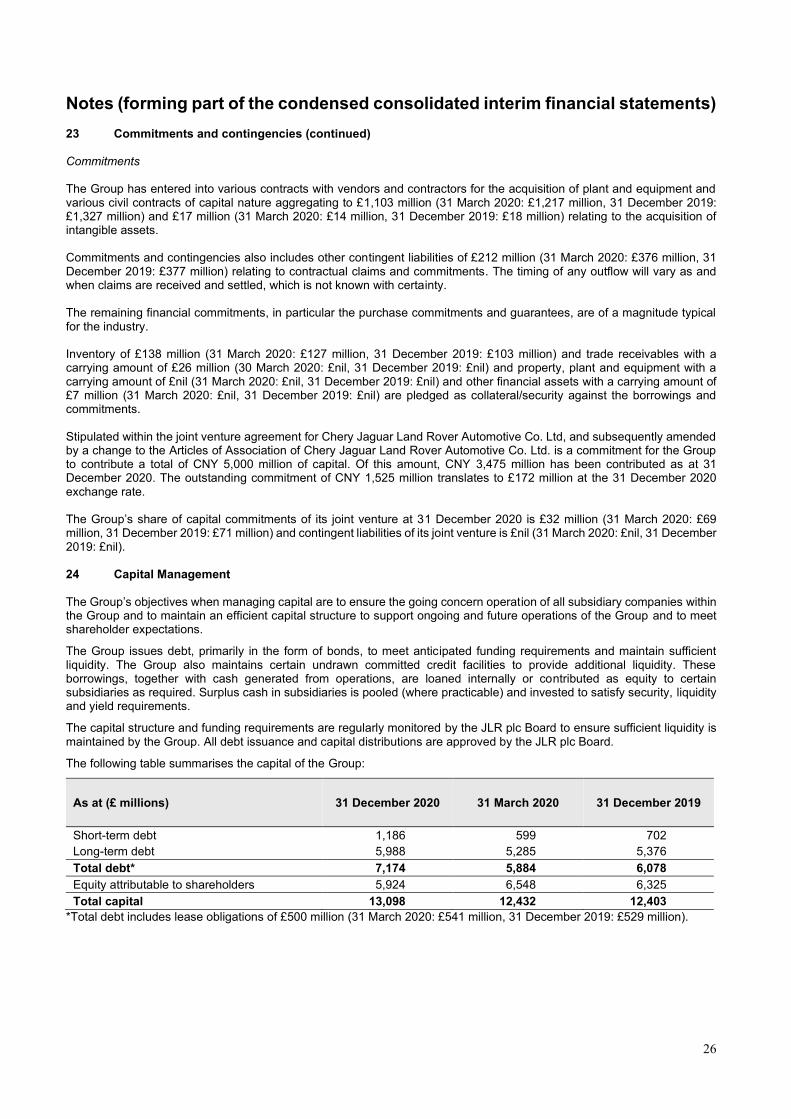
23 Commitments and contingencies (continued) Commitments The Group has entered into various contracts with vendors and contractors for the acquisition of plant and equipment and various civil contracts of capital nature aggregating to £1,103 million (31 March 2020: £1,217 million, 31 December 2019: £1,327 million) and £17 million (31 March 2020: £14 million, 31 December 2019: £18 million) relating to the acquisition of intangible assets. Commitments and contingencies also includes other contingent liabilities of £212 million (31 March 2020: £376 million, 31 December 2019: £377 million) relating to contractual claims and commitments. The timing of any outflow will vary as and when claims are received and settled, which is not known with certainty. The remaining financial commitments, in particular the purchase commitments and guarantees, are of a magnitude typical for the industry. Inventory of £138 million (31 March 2020: £127 million, 31 December 2019: £103 million) and trade receivables with a carrying amount of £26 million (30 March 2020: £nil, 31 December 2019: £nil) and property, plant and equipment with a carrying amount of £nil (31 March 2020: £nil, 31 December 2019: £nil) and other financial assets with a carrying amount of £7 million (31 March 2020: £nil, 31 December 2019: £nil) are pledged as collateral/security against the borrowings and commitments. Stipulated within the joint venture agreement for Chery Jaguar Land Rover Automotive Co. Ltd, and subsequently amended by a change to the Articles of Association of Chery Jaguar Land Rover Automotive Co. Ltd. is a commitment for the Group to contribute a total of CNY 5,000 million of capital. Of this amount, CNY 3,475 million has been contributed as at 31 December 2020. The outstanding commitment of CNY 1,525 million translates to £172 million at the 31 December 2020 exchange rate. The Group’s share of capital commitments of its joint venture at 31 December 2020 is £32 million (31 March 2020: £69 million, 31 December 2019: £71 million) and contingent liabilities of its joint venture is £nil (31 March 2020: £nil, 31 December 2019: £nil). 24 Capital Management The Group’s objectives when managing capital are to ensure the going concern operation of all subsidiary companies within the Group and to maintain an efficient capital structure to support ongoing and future operations of the Group and to meet shareholder expectations.
The Group issues debt, primarily in the form of bonds, to meet anticipated funding requirements and maintain sufficient liquidity. The Group also maintains certain undrawn committed credit facilities to provide additional liquidity. These borrowings, together with cash generated from operations, are loaned internally or contributed as equity to certain subsidiaries as required. Surplus cash in subsidiaries is pooled (where practicable) and invested to satisfy security, liquidity and yield requirements.
The capital structure and funding requirements are regularly monitored by the JLR plc Board to ensure sufficient liquidity is maintained by the Group. All debt issuance and capital distributions are approved by the JLR plc Board.
The following table summarises the capital of the Group:
As at (£ millions) 31 December 2020 31 March 2020 31 December 2019
Short-term debt 1,186 599 702
Long-term debt 5,988 5,285 5,376
Total debt* 7,174 5,884 6,078
Equity attributable to shareholders 5,924 6,548 6,325
Total capital 13,098 12,432 12,403
*Total debt includes lease obligations of £500 million (31 March 2020: £541 million, 31 December 2019: £529 million).
27
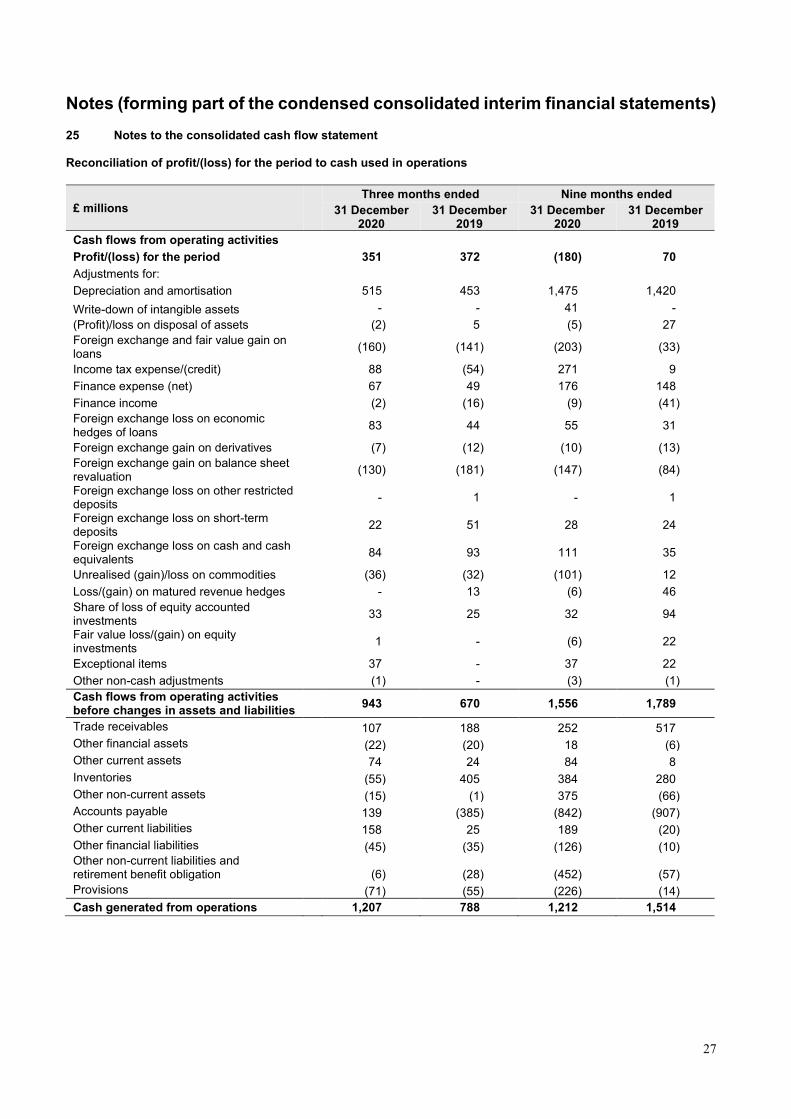
Notes (forming part of the condensed consolidated interim financial statements) 25 Notes to the consolidated cash flow statement Reconciliation of profit/(loss) for the period to cash used in operations
£ millions
Three months ended Nine months ended
31 December 2020
31 December 2019
31 December 2020
31 December 2019
Cash flows from operating activities
Profit/(loss) for the period 351 372 (180) 70
Adjustments for:
Depreciation and amortisation 515 453 1,475 1,420
Write-down of intangible assets - - 41 -
(Profit)/loss on disposal of assets (2) 5 (5) 27
Foreign exchange and fair value gain on loans
(160) (141) (203) (33)
Income tax expense/(credit) 88 (54) 271 9
Finance expense (net) 67 49 176 148
Finance income (2) (16) (9) (41)
Foreign exchange loss on economic hedges of loans
83 44 55 31
Foreign exchange gain on derivatives (7) (12) (10) (13)
Foreign exchange gain on balance sheet revaluation
(130) (181) (147) (84)
Foreign exchange loss on other restricted deposits
- 1 - 1
Foreign exchange loss on short-term deposits
22 51 28 24
Foreign exchange loss on cash and cash equivalents
84 93 111 35
Unrealised (gain)/loss on commodities (36) (32) (101) 12
Loss/(gain) on matured revenue hedges - 13 (6) 46
Share of loss of equity accounted investments
33 25 32 94
Fair value loss/(gain) on equity investments
1 - (6) 22
Exceptional items 37 - 37 22
Other non-cash adjustments (1) - (3) (1)
Cash flows from operating activities before changes in assets and liabilities
943 670 1,556 1,789
Trade receivables 107 188 252 517
Other financial assets (22) (20) 18 (6)
Other current assets 74 24 84 8
Inventories (55) 405 384 280
Other non-current assets (15) (1) 375 (66)
Accounts payable 139 (385) (842) (907)
Other current liabilities 158 25 189 (20)
Other financial liabilities (45) (35) (126) (10)
Other non-current liabilities and retirement benefit obligation
(6) (28) (452) (57)
Provisions (71) (55) (226) (14)
Cash generated from operations 1,207 788 1,212 1,514
28
Notes (forming part of the condensed consolidated interim financial statements)
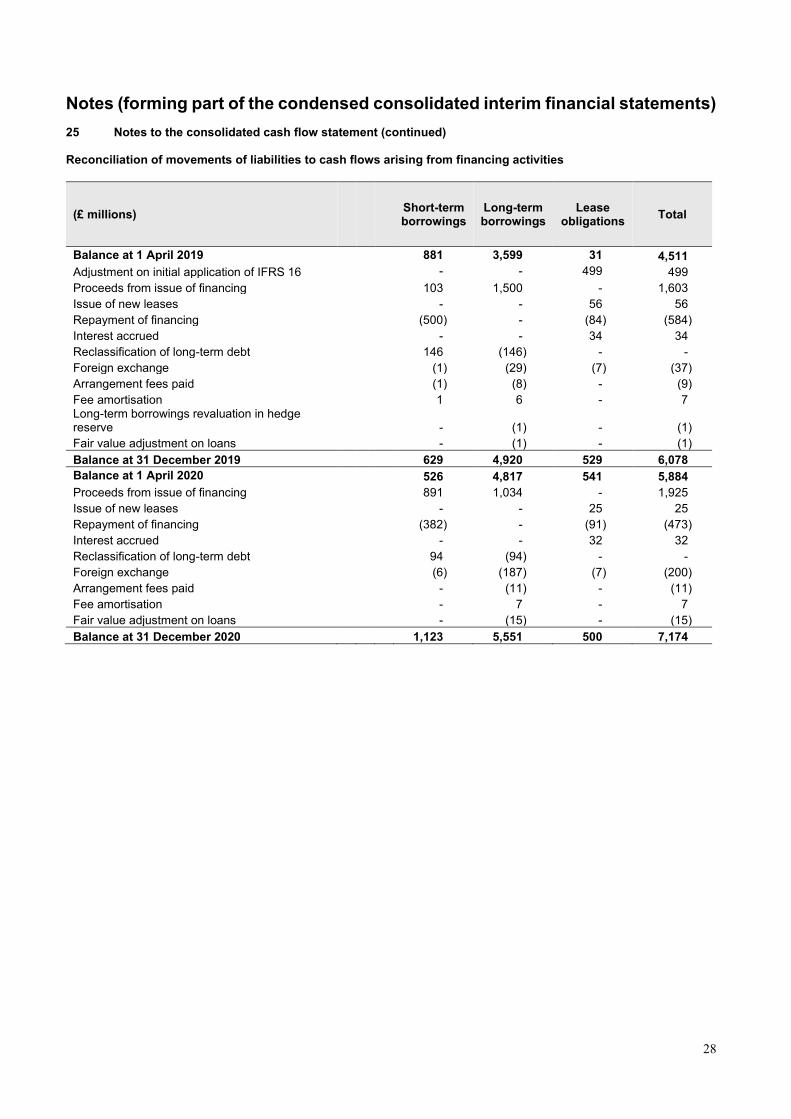
25 Notes to the consolidated cash flow statement (continued) Reconciliation of movements of liabilities to cash flows arising from financing activities
(£ millions) Short-term borrowings
Long-term borrowings
Lease obligations
Total
Balance at 1 April 2019 881 3,599 31 4,511
Adjustment on initial application of IFRS 16 - - 499 499
Proceeds from issue of financing 103 1,500 - 1,603
Issue of new leases - - 56 56
Repayment of financing (500) - (84) (584)
Interest accrued - - 34 34
Reclassification of long-term debt 146 (146) - -
Foreign exchange (1) (29) (7) (37)
Arrangement fees paid (1) (8) - (9)
Fee amortisation 1 6 - 7 Long-term borrowings revaluation in hedge reserve - (1) - (1)
Fair value adjustment on loans - (1) - (1)
Balance at 31 December 2019 629 4,920 529 6,078
Balance at 1 April 2020 526 4,817 541 5,884
Proceeds from issue of financing 891 1,034 - 1,925
Issue of new leases - - 25 25
Repayment of financing (382) - (91) (473)
Interest accrued - - 32 32
Reclassification of long-term debt 94 (94) - -
Foreign exchange (6) (187) (7) (200)
Arrangement fees paid - (11) - (11)
Fee amortisation - 7 - 7
Fair value adjustment on loans - (15) - (15)
Balance at 31 December 2020 1,123 5,551 500 7,174
29
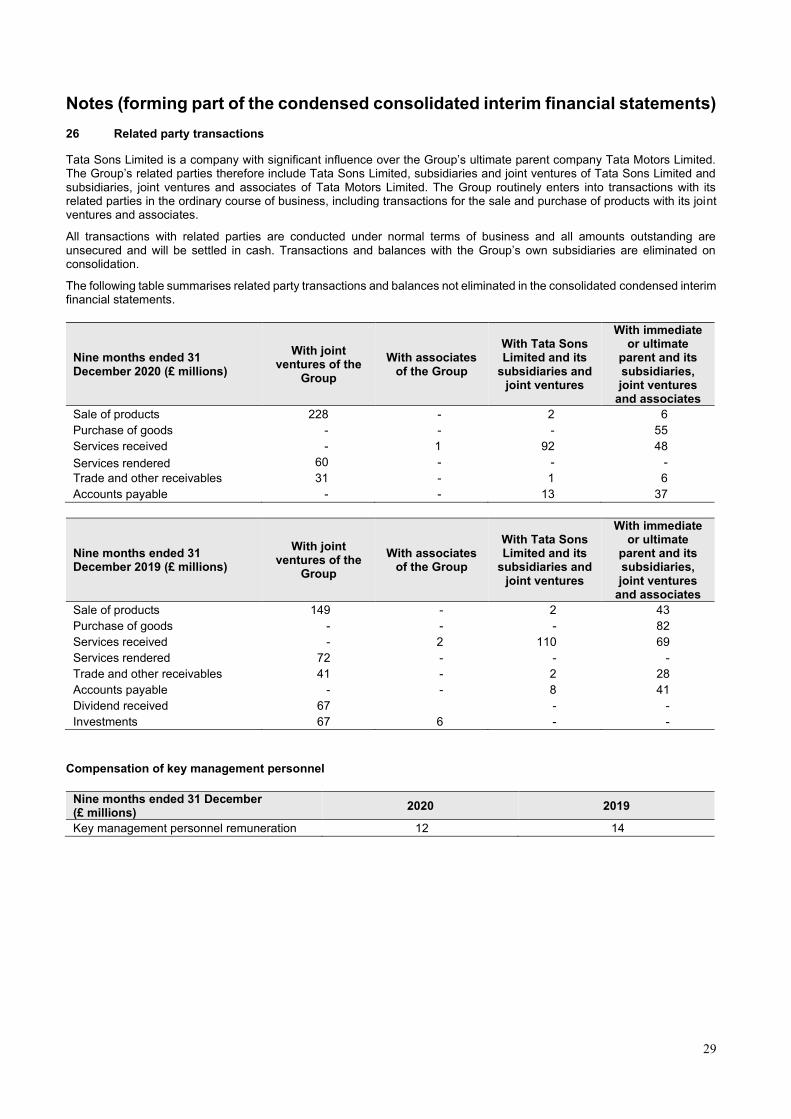
Notes (forming part of the condensed consolidated interim financial statements) 26 Related party transactions
Tata Sons Limited is a company with significant influence over the Group’s ultimate parent company Tata Motors Limited. The Group’s related parties therefore include Tata Sons Limited, subsidiaries and joint ventures of Tata Sons Limited and subsidiaries, joint ventures and associates of Tata Motors Limited. The Group routinely enters into transactions with its related parties in the ordinary course of business, including transactions for the sale and purchase of products with its joint ventures and associates.
All transactions with related parties are conducted under normal terms of business and all amounts outstanding are unsecured and will be settled in cash. Transactions and balances with the Group’s own subsidiaries are eliminated on consolidation.
The following table summarises related party transactions and balances not eliminated in the consolidated condensed interim financial statements.
Nine months ended 31 December 2020 (£ millions)
With joint ventures of the
Group
With associates of the Group
With Tata Sons Limited and its
subsidiaries and joint ventures
With immediate or ultimate
parent and its subsidiaries, joint ventures
and associates
Sale of products 228 - 2 6
Purchase of goods - - - 55
Services received - 1 92 48
Services rendered 60 - - -
Trade and other receivables 31 - 1 6
Accounts payable - - 13 37
Nine months ended 31 December 2019 (£ millions)
With joint ventures of the
Group
With associates of the Group
With Tata Sons Limited and its
subsidiaries and joint ventures
With immediate or ultimate
parent and its subsidiaries, joint ventures
and associates
Sale of products 149 - 2 43
Purchase of goods - - - 82
Services received - 2 110 69
Services rendered 72 - - -
Trade and other receivables 41 - 2 28
Accounts payable - - 8 41
Dividend received 67 - -
Investments 67 6 - -
Compensation of key management personnel
Nine months ended 31 December (£ millions)
2020 2019
Key management personnel remuneration 12 14


