20
October 2017 HOW THE CITY’S DANGEROUS LEVELS OF AIR POLLUTION ARE ABOUT TO GET EVEN WORSE JAKARTA’S SILENT KILLER

JAKARTA’S SILENT KILLER 1 October 2017
HOW THE CITY’SDANGEROUS LEVELSOF AIR POLLUTIONARE ABOUT TO GET
EVEN WORSE
JAKARTA’SSILENT KILLER
2 JAKARTA’S SILENT KILLER
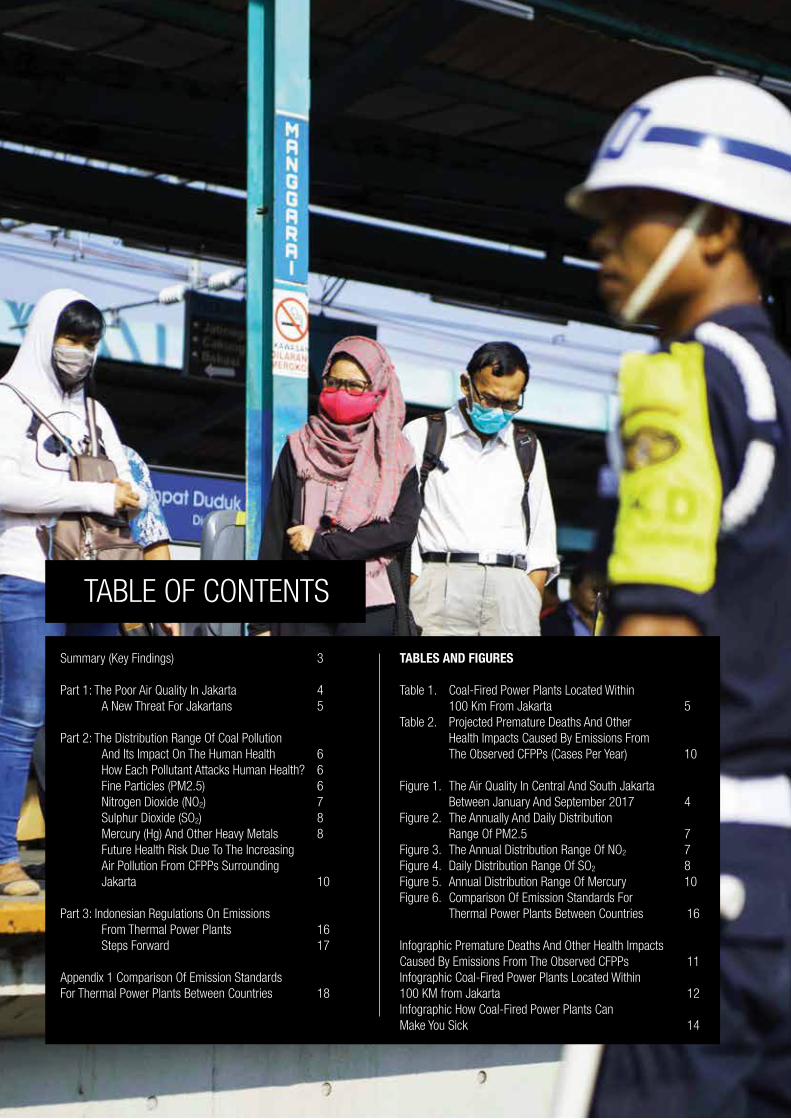
TABLE OF CONTENTS
Summary (Key Findings) 3
Part 1: The Poor Air Quality In Jakarta 4 A New Threat For Jakartans 5
Part 2: The Distribution Range Of Coal Pollution And Its Impact On The Human Health 6 How Each Pollutant Attacks Human Health? 6 Fine Particles (PM2.5) 6 Nitrogen Dioxide (NO2) 7 Sulphur Dioxide (SO2) 8 Mercury (Hg) And Other Heavy Metals 8 Future Health Risk Due To The Increasing Air Pollution From CFPPs Surrounding Jakarta 10
Part 3: Indonesian Regulations On Emissions From Thermal Power Plants 16 Steps Forward 17
Appendix 1 Comparison Of Emission Standards For Thermal Power Plants Between Countries 18
TABLES AND FIGURES
Table 1. Coal-Fired Power Plants Located Within 100 Km From Jakarta 5Table 2. Projected Premature Deaths And Other Health Impacts Caused By Emissions From The Observed CFPPs (Cases Per Year) 10 Figure 1. The Air Quality In Central And South Jakarta Between January And September 2017 4Figure 2. The Annually And Daily Distribution Range Of PM2.5 7Figure 3. The Annual Distribution Range Of NO2 7Figure 4. Daily Distribution Range Of SO2 8Figure 5. Annual Distribution Range Of Mercury 10Figure 6. Comparison Of Emission Standards For Thermal Power Plants Between Countries 16
Infographic Premature Deaths And Other Health Impacts Caused By Emissions From The Observed CFPPs 11Infographic Coal-Fired Power Plants Located Within 100 KM from Jakarta 12Infographic How Coal-Fired Power Plants Can Make You Sick 14
JAKARTA’S SILENT KILLER 3
Jakarta already suffers from dangerous levels of air pollution, from traffic, residential emissions and coal-fired power. It’s rare for the air quality to meet standards set by the World Health Organization (WHO); the pollution levels are frequently even worse than the much weaker standards set by the Indonesian government. And the situation is about to get much worse.
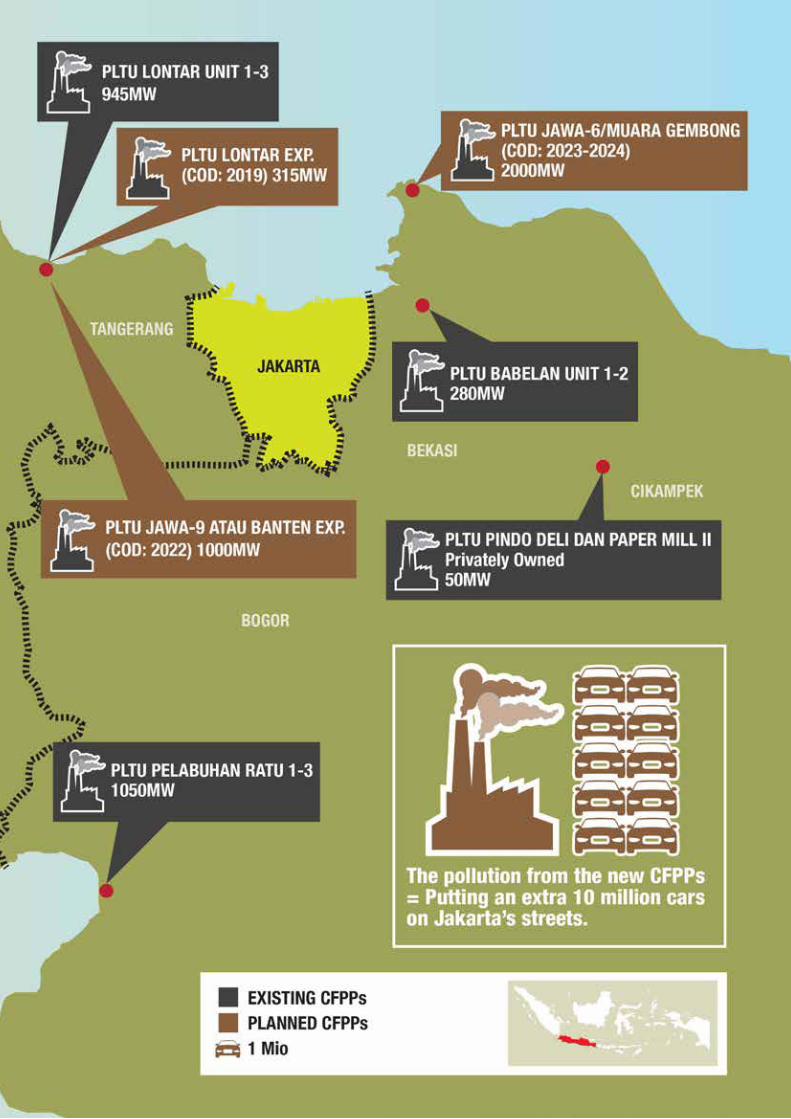
The Government is proposing another four coal-fired power plants in the region (seven units), to add to the existing eight plants (22 units). One existing plant would be expanded. If these disastrous plans go ahead, Greater Jakarta would be ringed by power stations, which will choke the city and its 30 million inhabitants. While China is closing coal-fired power plants in Beijing to curb dangerous levels of air pollution, Indonesia is doing the opposite. Greater Jakarta could see more new coal-fired power stations built within 100 kilometres than any other capital city. The pollution from these new power plants – NO2, particulate matter and SO2 - is equivalent to putting an extra 10 million cars 1 on Jakarta’s streets. Yet there has been no assessment of the impact on the air quality and health of the millions of people living in Greater Jakarta.
The emissions from the new and existing coal-fired power plants would put at risk the health of everyone in Greater Jakarta, including 7.8 million children, by exposing them to PM2.5 levels way above WHO guidelines. The health impacts of this pollution across the region would include a projected 10,600 premature deaths and 2,800 low birth weight births per year; nearly half of these would be within Greater Jakarta. The regulation and enforcement of emissions standards for key pollutants, such as PM2.5, SO2, NO2 and dust, is extremely weak in Indonesia. The new coal-fired power plants will be allowed to emit 20 times as much SO2 as new plants in China, and more than 7 times as much as new plants in India.
Coal power plants are a major source of mercury emissions. Mercury is especially toxic because
SUMMARY (KEY FINDINGS)
1 Calculated based on emission factors in Peraturan Menteri Negara Lingkungan Hidup Nomor 12 Tahun 2010 Tentang Pelaksanaan Pengendalian Pencemaran Udara di Daerah, and assuming 30 km driven per car per day, estimated from http://www.jterc.or.jp/english/kokusai/conferences/pdf/140220_seminar_2-2.pdf
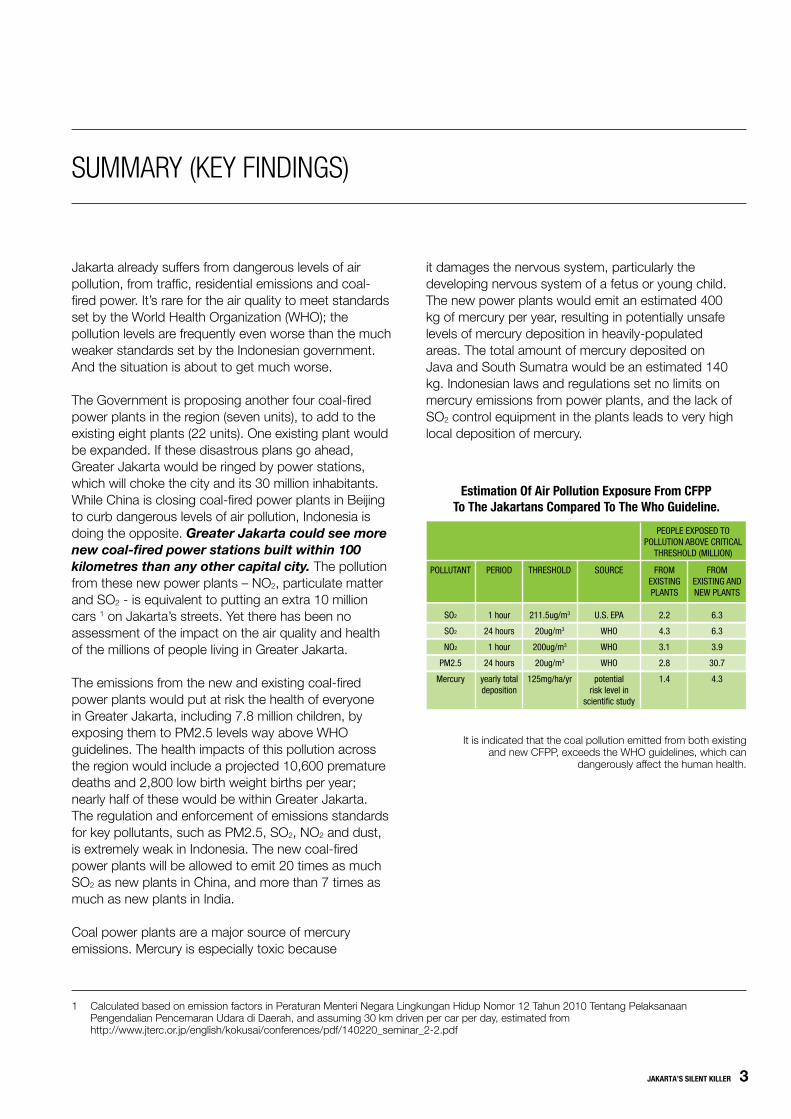
PEOPLE EXPOSED TOPOLLUTION ABOVE CRITICAL
THRESHOLD (MILLION)
FROMEXISTING PLANTS
2.2
4.3
3.1
2.8
1.4
FROMEXISTING ANDNEW PLANTS
6.3
6.3
3.9
30.7
4.3
POLLUTANT
SO2
SO2
NO2
PM2.5
Mercury
PERIOD
1 hour
24 hours
1 hour
24 hours
yearly total deposition
THRESHOLD
211.5ug/m3
20ug/m3
200ug/m3
20ug/m3
125mg/ha/yr
SOURCE
U.S. EPA
WHO
WHO
WHO
potentialrisk level in
scientific study
it damages the nervous system, particularly the developing nervous system of a fetus or young child. The new power plants would emit an estimated 400 kg of mercury per year, resulting in potentially unsafe levels of mercury deposition in heavily-populated areas. The total amount of mercury deposited on Java and South Sumatra would be an estimated 140 kg. Indonesian laws and regulations set no limits on mercury emissions from power plants, and the lack of SO2 control equipment in the plants leads to very high local deposition of mercury.
Estimation Of Air Pollution Exposure From CFPP To The Jakartans Compared To The Who Guideline.
It is indicated that the coal pollution emitted from both existing and new CFPP, exceeds the WHO guidelines, which can
dangerously affect the human health.
4 JAKARTA’S SILENT KILLER
JUNE
29
29
6
43
23
31
39
28
31
55
49
22
1
39
31
30
49
9
24
31
38
28
13
34
56
11
39
20
32
91
50
31
2
40
41
Jakarta already has notoriously bad air quality, caused mainly by transport and residential emissions. It’s rare for the skies to be clear as the city struggles even with current levels of air pollution. The people of the city have always blamed traffic for the polluted air they breathe.
But it is not just traffic which is damaging the health of Jakartans and their children. There are coal-fired power plants (CFPPs) in Java, and two thermal power plants (TPPs) inside this city, at TPP Muara Karang and TPP Tanjung Priok. The pollution from these plants is making the air in Greater Jakarta even more hazardous
PART 1:
THE POOR AIR QUALITY IN JAKARTA
to people’s health. A study conducted by Indonesia University found that approximately 60 percent of Jakarta’s residents suffer from breathing problems associated with poor air quality 2.
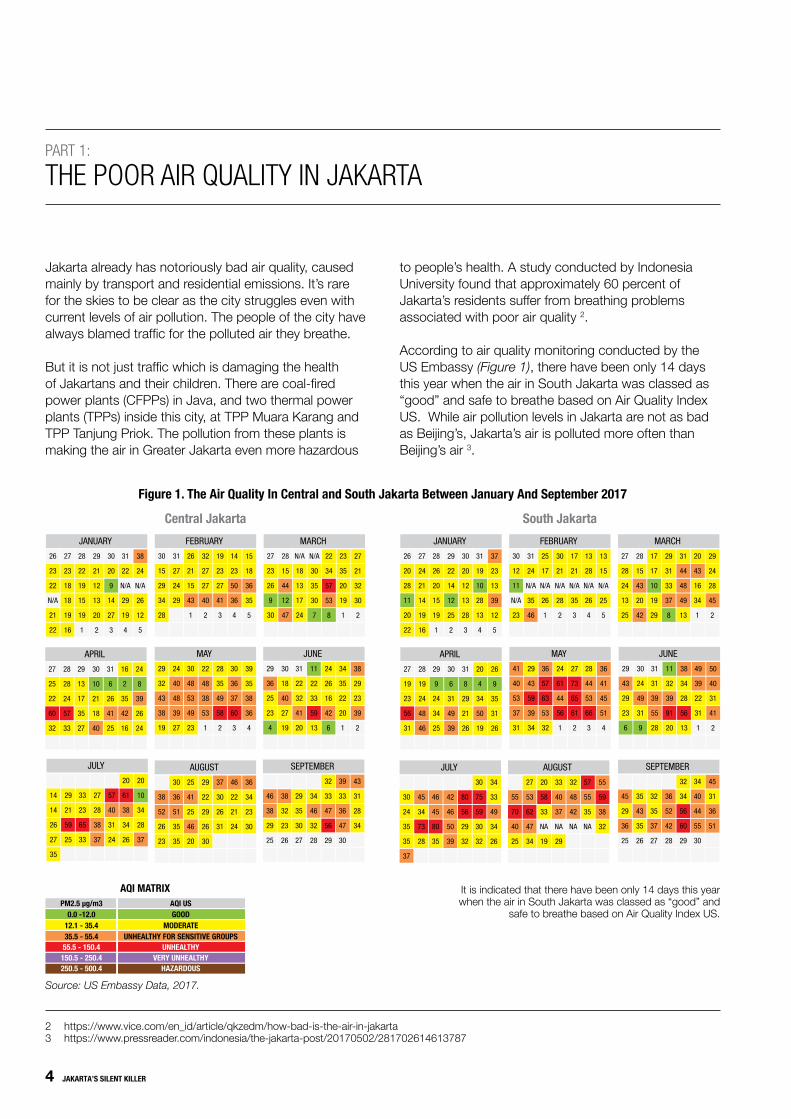
According to air quality monitoring conducted by the US Embassy (Figure 1), there have been only 14 days this year when the air in South Jakarta was classed as “good” and safe to breathe based on Air Quality Index US. While air pollution levels in Jakarta are not as bad as Beijing’s, Jakarta’s air is polluted more often than Beijing’s air 3.
Figure 1. The Air Quality In Central and South Jakarta Between January And September 2017
Central Jakarta South Jakarta
2 https://www.vice.com/en_id/article/qkzedm/how-bad-is-the-air-in-jakarta 3 https://www.pressreader.com/indonesia/the-jakarta-post/20170502/281702614613787
Source: US Embassy Data, 2017.
PM2.5 μg/m30.0 -12.0
12.1 - 35.435.5 - 55.455.5 - 150.4150.5 - 250.4250.5 - 500.4
AQI USGOOD
MODERATEUNHEALTHY FOR SENSITIVE GROUPS
UNHEALTHYVERY UNHEALTHY
HAZARDOUS
AQI MATRIX
JUNE
29
25
4
36
23
31
32
20
22
41
34
22
1
35
20
30
40
19
18
27
24
16
6
26
42
11
33
13
22
59
38
23
2
29
39
APRIL
27
22
32
25
60
29
17
27
13
35
16
35
16
2
42
28
24
33
28
57
31
26
25
6
41
30
21
40
10
18
24
39
24
8
26
JULY
14
27
14
26
35
23
33
33
65
20
38
26
61
34
21
25
29
59
40
24
57
31
28
37
27
38
20
34
37
10
28
AUGUST
52
23
38
26
25
25
20
41
46
46
21
22
24
30
51
35
36
35
37
26
30
31
29
29
30
22
26
36
23
34
30
JANUARY
26
22
21
23
N/A
22
28
19
19
22
15
1
31
N/A
19
22
29
4
27
18
19
23
18
16
30
9
27
20
14
3
29
12
20
21
13
2
38
N/A
12
24
26
5
MAY
29
43
19
32
38
30
53
23
48
49
30
37
3
36
60
24
48
27
40
39
28
49
2
35
58
22
38
1
48
53
39
38
4
35
36
SEPTEMBER
38
25
46
29
35
27
29
30
39
36
30
33
47
32
26
38
23
32
47
29
33
56
46
28
34
32
43
28
31
34
MARCH
27
26
30
23
9
N/A
13
24
18
17
23
20
1
35
19
28
44
47
15
12
22
57
8
34
53
N/A
35
7
30
30
27
32
2
21
30
FEBRUARY
30
29
28
15
34
26
15
1
21
43
14
50
4
23
36
31
24
27
29
19
27
3
23
41
32
27
2
27
40
15
36
5
18
35
JULY
24
35
30
35
37
45
35
46
80
30
59
32
75
30
34
28
45
73
56
32
80
29
46
39
42
50
34
49
26
33
34
APRIL
27
23
31
19
56
29
24
25
9
34
20
34
19
4
50
28
24
46
19
48
31
29
26
8
21
30
31
39
6
49
26
35
26
9
31
AUGUST
70
25
55
40
20
33
19
58
NA
57
35
55
NA
27
62
34
53
47
32
42
48
NA
33
37
29
40
NA
55
38
59
32
SEPTEMBER
29
25
45
36
35
27
32
37
34
44
30
40
55
43
26
35
35
32
56
29
34
60
52
28
36
42
45
36
31
51
JANUARY
26
28
20
20
11
22
28
20
19
26
15
1
31
10
13
19
28
4
27
21
19
24
14
16
30
12
28
20
13
3
29
14
25
22
12
2
37
13
12
23
39
5
MAY
41
53
31
40
37
36
63
32
57
53
28
53
3
44
66
29
59
34
43
39
27
65
2
73
61
24
44
1
61
56
36
45
4
41
51
MARCH
27
24
25
28
13
17
10
29
17
19
20
16
1
43
34
28
43
42
15
20
31
48
13
44
49
29
33
8
31
37
29
28
2
24
45
FEBRUARY
30
11
23
12
N/A
25
N/A
1
17
26
13
N/A
4
28
26
31
N/A
46
24
35
17
N/A
3
21
35
30
N/A
2
21
28
13
N/A
5
15
25
It is indicated that there have been only 14 days this yearwhen the air in South Jakarta was classed as “good” and
safe to breathe based on Air Quality Index US.

JAKARTA’S SILENT KILLER 5
A New Threat for JakartansBut there is now a new danger, which threatens to make the situation much worse. A wave of massive coal-fired power plants - a total of seven large units - is being planned within 100 km of Greater Jakarta. These CFPPs will have few of the basic emission controls routinely required in most other countries.
Greater Jakarta already sits in the shadow of eight CFPPs (22 units); four more (seven units) will become operational between 2019 and 2024, and one existing plants will be expanded in 2019 (Table 1). Each CFPP is expected to operate for at least 30 years, the minimum time period for a power supply contract. So the people of Greater Jakarta will be condemned to worsening air pollution for at least a generation. Children being born today will grow up breathing in the pollutants emitted by these CFPPs and their children will suffer too. Two of the thermal power plants (TPPs) are planned within Jakarta’s city limits, at TPP Tanjung Priok and TPP Muara Karang, adding to the air pollution.
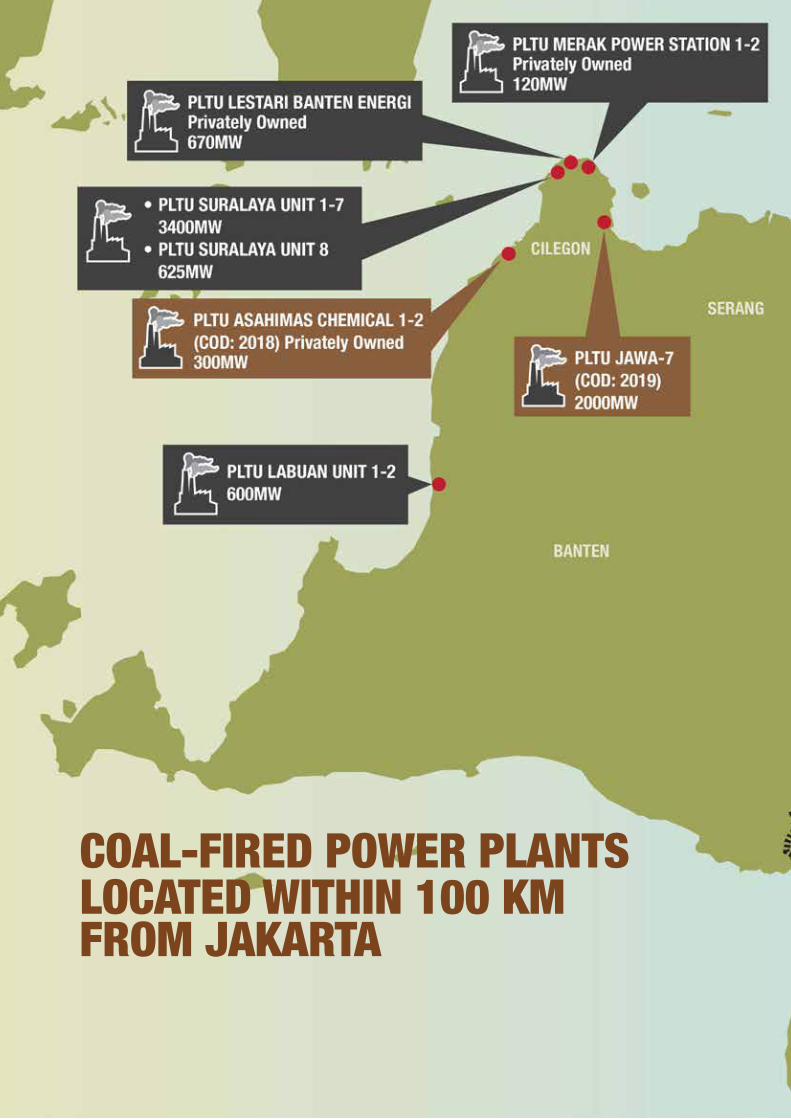
COAL-FIRED POWER PLANTS
Existing CFPPs
CFPP Suralaya Unit 1-7
CFPP Suralaya Unit 8
CFPP Labuan Unit 1-2
CFPP Lontar Unit 1-3
CFPP Babelan Unit 1-2
CFPP Pelabuhan Ratu 1-3
CFPP Lestari Banten Energi - Privately Owned
CFPP Merak Power Station 1-2 - Privately Owned
CFPP Pindo Deli and Paper Mill II - Privately Owned
Planned CFPPs
CFPP Jawa-7 (COD: 2019)
CFPP Lontar Exp. (COD: 2019)
CFPP Jawa-9 or Banten Exp. (COD: 2022)
CFPP Jawa-6 or Muara Gembong(COD: 2023-2024)
CFPP Asahimas Chemical 1-2 (COD: 2018)-Privately Owned
CAPACITY
3400MW
625MW
600MW
945MW
280MW
1050MW
670MW
120MW
50MW
2000MW
315MW
1000MW
2000MW
300MW
LOCATION
Banten
Banten
Banten
Banten
Cikarang, Bekasi
West Java
Banten
Banten
Bekasi
Banten
Banten
Banten
Bekasi
Cilegon, Banten
Table 1. Coal-Fired Power Plants located within 100 kmfrom Jakarta
Source: RUPTL 2017-2026; www.coalswarm.org
©gr
eenp
eace
/Jur
nasy
anto
Suk
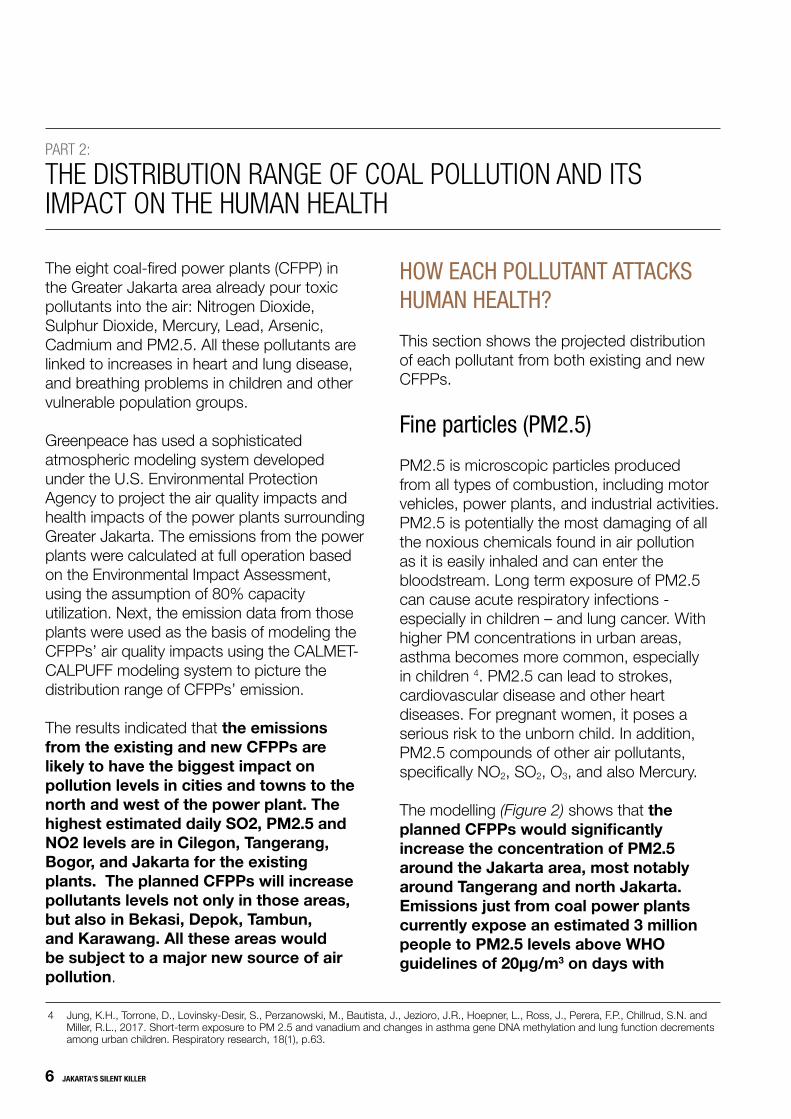
arno Air Pollution Sampling Student in Jakarta
The Active Personal Particulate Monitor, an equipment to monitor PM2.5 air pollution particles, installed at an elementary school classroom to monitor one student Miftah Rafly Hanafi daily routine at the school, in Jakarta. During the observation that is held by Greenpeace Indonesia which is recorded for six hours school activities the student inhales 40 Ug/m3 PM2.5 pollution particles, so for a month there will be predicted 25,920 Ug/m3 of PM2.5 in his body.
6 JAKARTA’S SILENT KILLER
4 Jung, K.H., Torrone, D., Lovinsky-Desir, S., Perzanowski, M., Bautista, J., Jezioro, J.R., Hoepner, L., Ross, J., Perera, F.P., Chillrud, S.N. and Miller, R.L., 2017. Short-term exposure to PM 2.5 and vanadium and changes in asthma gene DNA methylation and lung function decrements among urban children. Respiratory research, 18(1), p.63.
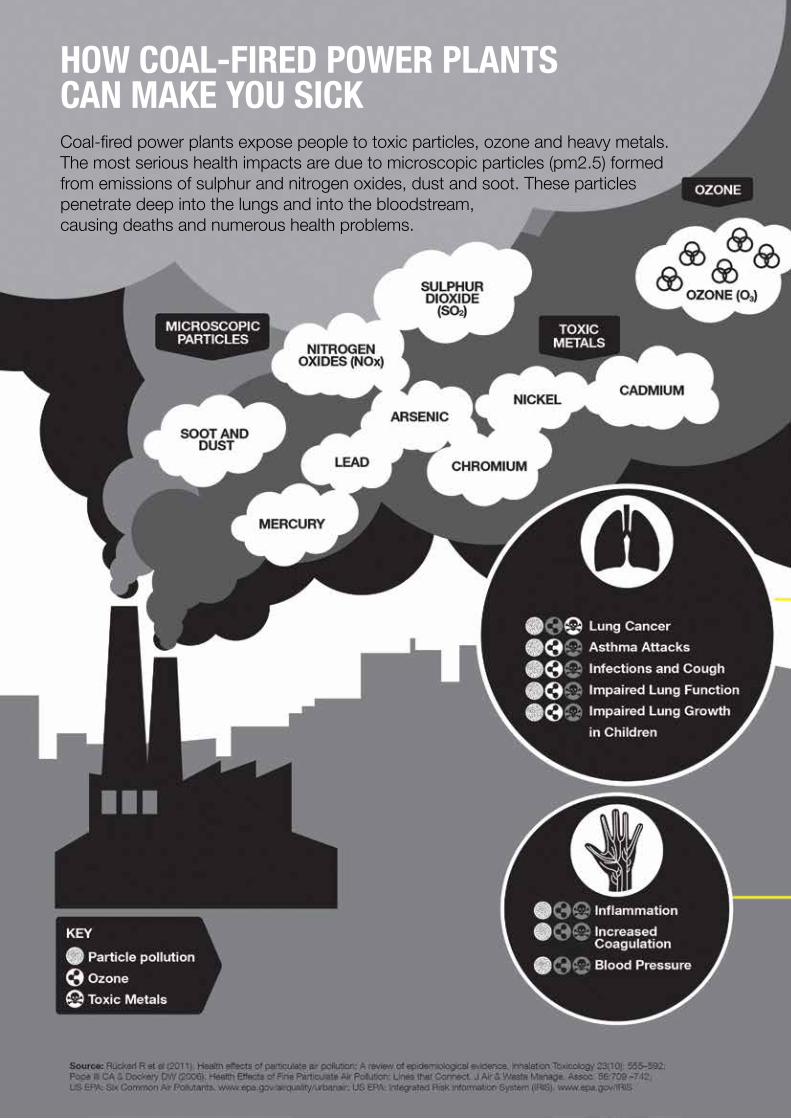
The eight coal-fired power plants (CFPP) in the Greater Jakarta area already pour toxic pollutants into the air: Nitrogen Dioxide, Sulphur Dioxide, Mercury, Lead, Arsenic, Cadmium and PM2.5. All these pollutants are linked to increases in heart and lung disease, and breathing problems in children and other vulnerable population groups.
Greenpeace has used a sophisticated atmospheric modeling system developed under the U.S. Environmental Protection Agency to project the air quality impacts and health impacts of the power plants surrounding Greater Jakarta. The emissions from the power plants were calculated at full operation based on the Environmental Impact Assessment, using the assumption of 80% capacity utilization. Next, the emission data from those plants were used as the basis of modeling the CFPPs’ air quality impacts using the CALMET-CALPUFF modeling system to picture the distribution range of CFPPs’ emission.
The results indicated that the emissions from the existing and new CFPPs are likely to have the biggest impact on pollution levels in cities and towns to the north and west of the power plant. The highest estimated daily SO2, PM2.5 and NO2 levels are in Cilegon, Tangerang, Bogor, and Jakarta for the existing plants. The planned CFPPs will increase pollutants levels not only in those areas, but also in Bekasi, Depok, Tambun, and Karawang. All these areas would be subject to a major new source of air pollution.
PART 2:
THE DISTRIBUTION RANGE OF COAL POLLUTION AND ITS IMPACT ON THE HUMAN HEALTH
HOW EACH POLLUTANT ATTACKS HUMAN HEALTH?
This section shows the projected distribution of each pollutant from both existing and new CFPPs.
Fine particles (PM2.5)
PM2.5 is microscopic particles produced from all types of combustion, including motor vehicles, power plants, and industrial activities. PM2.5 is potentially the most damaging of all the noxious chemicals found in air pollution as it is easily inhaled and can enter the bloodstream. Long term exposure of PM2.5 can cause acute respiratory infections - especially in children – and lung cancer. With higher PM concentrations in urban areas, asthma becomes more common, especially in children 4. PM2.5 can lead to strokes, cardiovascular disease and other heart diseases. For pregnant women, it poses a serious risk to the unborn child. In addition, PM2.5 compounds of other air pollutants, specifically NO2, SO2, O3, and also Mercury.
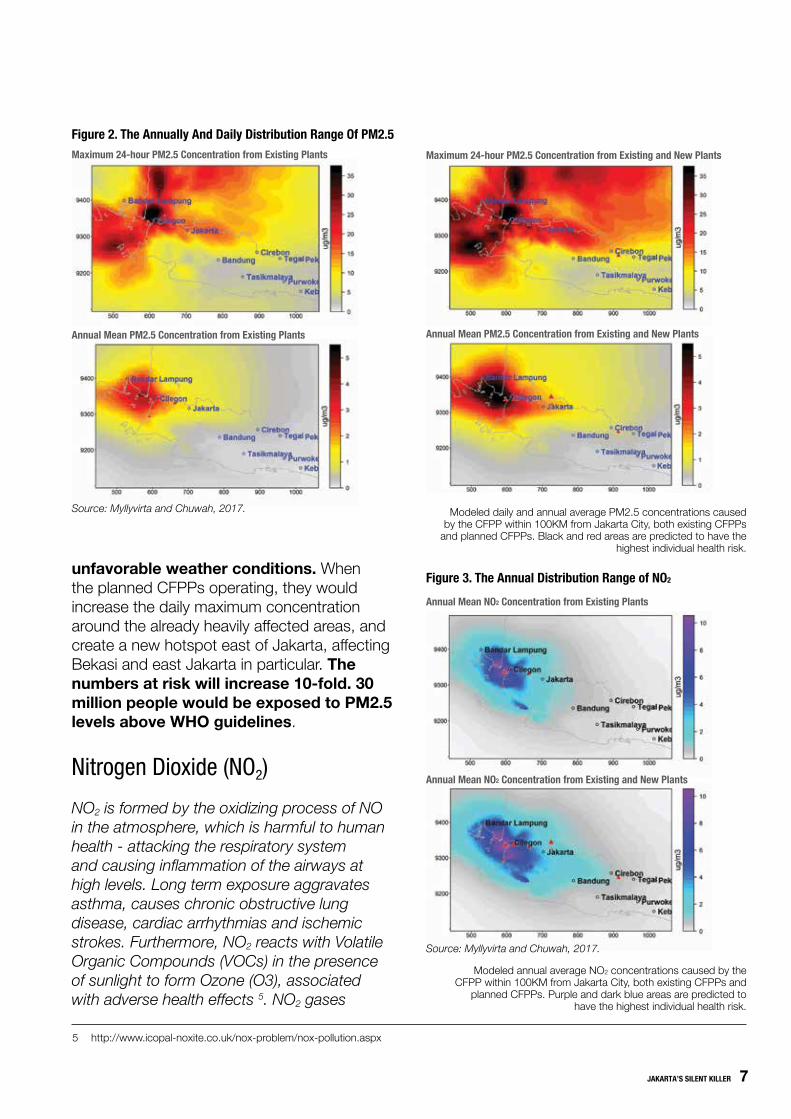
The modelling (Figure 2) shows that the planned CFPPs would significantly increase the concentration of PM2.5 around the Jakarta area, most notably around Tangerang and north Jakarta. Emissions just from coal power plants currently expose an estimated 3 million people to PM2.5 levels above WHO guidelines of 20μg/m3 on days with
JAKARTA’S SILENT KILLER 7
unfavorable weather conditions. When the planned CFPPs operating, they would increase the daily maximum concentration around the already heavily affected areas, and create a new hotspot east of Jakarta, affecting Bekasi and east Jakarta in particular. The numbers at risk will increase 10-fold. 30 million people would be exposed to PM2.5 levels above WHO guidelines.
Nitrogen Dioxide (NO2)
NO2 is formed by the oxidizing process of NO in the atmosphere, which is harmful to human health - attacking the respiratory system and causing inflammation of the airways at high levels. Long term exposure aggravates asthma, causes chronic obstructive lung disease, cardiac arrhythmias and ischemic strokes. Furthermore, NO2 reacts with Volatile Organic Compounds (VOCs) in the presence of sunlight to form Ozone (O3), associated with adverse health effects 5. NO2 gases
5 http://www.icopal-noxite.co.uk/nox-problem/nox-pollution.aspx
Figure 2. The Annually And Daily Distribution Range Of PM2.5Maximum 24-hour PM2.5 Concentration from Existing Plants Maximum 24-hour PM2.5 Concentration from Existing and New Plants
Annual Mean PM2.5 Concentration from Existing Plants
Annual Mean NO2 Concentration from Existing Plants
Annual Mean NO2 Concentration from Existing and New Plants
Annual Mean PM2.5 Concentration from Existing and New Plants
Figure 3. The Annual Distribution Range of NO2
Source: Myllyvirta and Chuwah, 2017.
Source: Myllyvirta and Chuwah, 2017.
Modeled annual average NO2 concentrations caused by the CFPP within 100KM from Jakarta City, both existing CFPPs and
planned CFPPs. Purple and dark blue areas are predicted to have the highest individual health risk.
Modeled daily and annual average PM2.5 concentrations caused by the CFPP within 100KM from Jakarta City, both existing CFPPs
and planned CFPPs. Black and red areas are predicted to have the highest individual health risk.
8 JAKARTA’S SILENT KILLER
react to form smog and acid rain as well as being central to the formation of fine particles (PM) and ground level ozone, both of which are associated with adverse health effects. High levels of NO2 can have a negative effect on vegetation, including leaf damage and reduced growth 6.
The modelling shown in Figure 3 indicates a significant additional distribution of NO2 from the existing and planned CFPPs in the North and West regions of Jakarta. Emissions from the existing and planned CFPPs would expose an estimated 4 million people to levels of NO2 which exceed WHO guidelines of 200μg/m3 for 1-hour mean.
Sulphur Dioxide (SO2)
Exposure to sulphur and exposure to acids derived from SO2 is dangerous for people’s health because these compounds can enter the circulatory system through the airways. SO2 can decrease respiratory and lung function, aggravate asthma and chronic bronchitis for at-risk groups, and cause eye irritation, heart disease, and ischemic stroke. Most importantly, SO2 forms PM2.5 particles in the atmosphere, contributing to deadly PM2.5 pollution. SO2 is also a leading cause of acid rain. The compounds remain in the atmosphere for 3-5 days, so can affect wide areas 7.
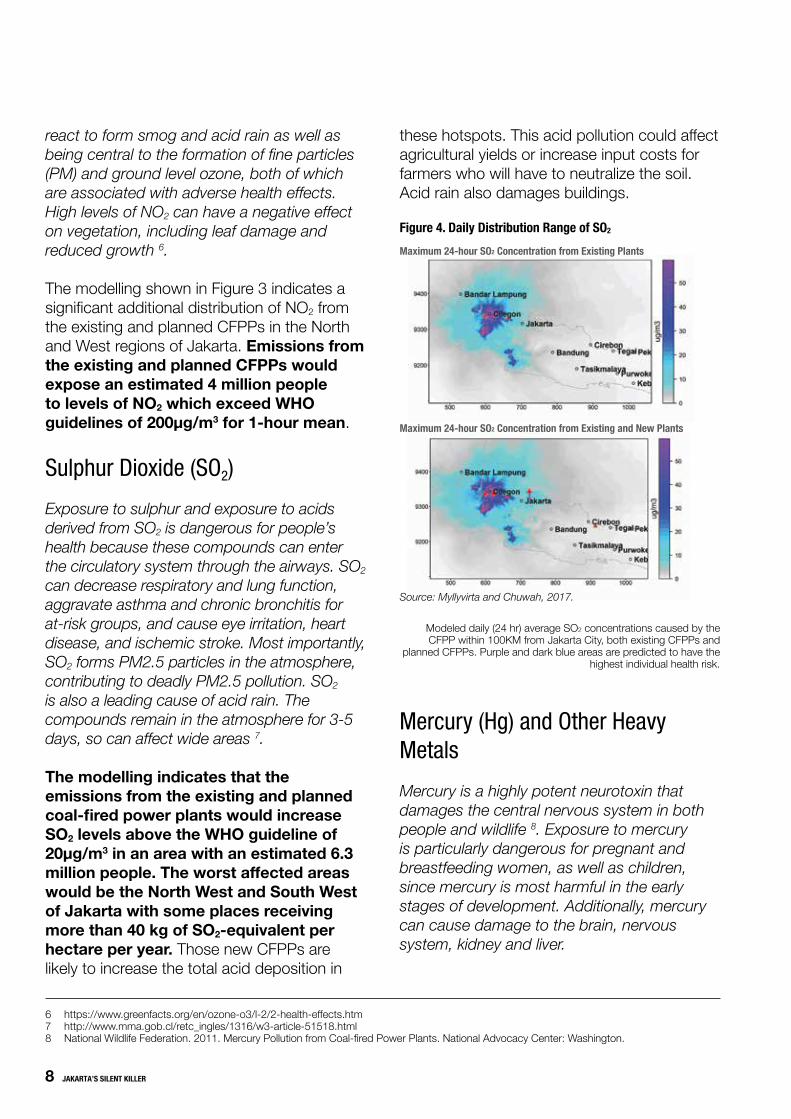
The modelling indicates that the emissions from the existing and planned coal-fired power plants would increase SO2 levels above the WHO guideline of 20μg/m3 in an area with an estimated 6.3 million people. The worst affected areas would be the North West and South West of Jakarta with some places receiving more than 40 kg of SO2-equivalent per hectare per year. Those new CFPPs are likely to increase the total acid deposition in
these hotspots. This acid pollution could affect agricultural yields or increase input costs for farmers who will have to neutralize the soil. Acid rain also damages buildings.
6 https://www.greenfacts.org/en/ozone-o3/l-2/2-health-effects.htm 7 http://www.mma.gob.cl/retc_ingles/1316/w3-article-51518.html 8 National Wildlife Federation. 2011. Mercury Pollution from Coal-fired Power Plants. National Advocacy Center: Washington.
Maximum 24-hour SO2 Concentration from Existing Plants
Maximum 24-hour SO2 Concentration from Existing and New Plants
Source: Myllyvirta and Chuwah, 2017.
Mercury (Hg) and Other Heavy Metals
Mercury is a highly potent neurotoxin that damages the central nervous system in both people and wildlife 8. Exposure to mercury is particularly dangerous for pregnant and breastfeeding women, as well as children, since mercury is most harmful in the early stages of development. Additionally, mercury can cause damage to the brain, nervous system, kidney and liver.
Figure 4. Daily Distribution Range of SO2
Modeled daily (24 hr) average SO2 concentrations caused by the CFPP within 100KM from Jakarta City, both existing CFPPs and
planned CFPPs. Purple and dark blue areas are predicted to have the highest individual health risk.

JAKARTA’S SILENT KILLER 9
exceeds the potentially unsafe rate, even before taking into consideration other sources of pollution. Currently, an estimated 1.4 million people live in areas where mercury deposition from the studied coal plants exceeds 125 mg per hectare per year. If the new CFPPs are built and start operating, the numbers at risk will treble to 4.3 million people.
It should be noted that the mercury emission and deposition estimates are highly uncertain as mercury emissions from coal are not regulated at all in Indonesia. As a result, specific data on mercury content in coal or mercury emissions for the studied power plants was not available, so actual emissions and deposition could be considerably higher or lower.
9 Swain EB et al, 1992. Increasing Rates of Atmospheric Mercury Deposition in Midcontinental North America. Science 257:784-787.10 https://www.ncbi.nlm.nih.gov/pmc/articles/PMC2944113/
The 22 existing coal-fired units within 100km of Jakarta emit an estimated 400 kg of mercury every year, an amount that would double if the new units go ahead. Based on the atmospheric modelling result, the total mercury deposition on land from the existing CFPPs exceeds 30 mg per hectare per year in southeast Jakarta. The planned CFPPs will increase projected mercury deposition by as much as 50 mg per hectare per year around the city. Mercury deposition rates as low as 125 mg per hectare per year can lead to the accumulation of unsafe levels of mercury in fish 9. Mercury can also accumulate in rice as a result of fallout on rice fields 10, leading to potentially unsafe levels of mercury exposure.
The predicted deposition from both existing and new CFPPs in the most affected regions
©gr
eenp
eace
/Eva
n Pr
adity
a
Jakartans wear masks to protect them from air pollution while charging their phone at public space in Jakarta.
10 JAKARTA’S SILENT KILLER
Future Health Risk Due to the Increasing Air Pollution from CFPPs Surrounding Jakarta
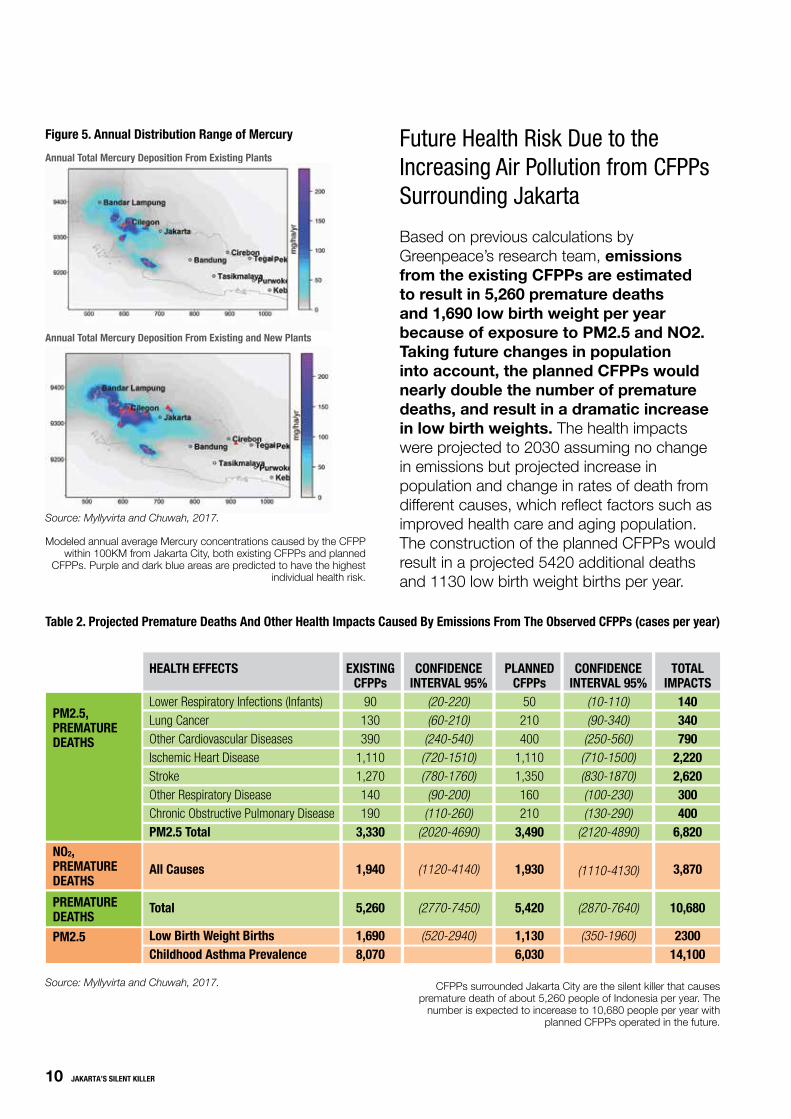
Based on previous calculations by Greenpeace’s research team, emissions from the existing CFPPs are estimated to result in 5,260 premature deaths and 1,690 low birth weight per year because of exposure to PM2.5 and NO2. Taking future changes in population into account, the planned CFPPs would nearly double the number of premature deaths, and result in a dramatic increase in low birth weights. The health impacts were projected to 2030 assuming no change in emissions but projected increase in population and change in rates of death from different causes, which reflect factors such as improved health care and aging population. The construction of the planned CFPPs would result in a projected 5420 additional deaths and 1130 low birth weight births per year.
Annual Total Mercury Deposition From Existing Plants
Annual Total Mercury Deposition From Existing and New Plants
Source: Myllyvirta and Chuwah, 2017.
EXISTINGCFPPs
90130390
1,1101,270140190
3,330
1,940
5,260
1,6908,070
CONFIDENCEINTERVAL 95%
(20-220)(60-210)(240-540)(720-1510)(780-1760)(90-200)(110-260)
(2020-4690)
(1120-4140)
(2770-7450)
(520-2940)
PLANNEDCFPPs
50210400
1,1101,350160210
3,490
1,930
5,420
1,1306,030
CONFIDENCEINTERVAL 95%
(10-110)(90-340)(250-560)(710-1500)(830-1870)(100-230)(130-290)
(2120-4890)
(1110-4130)
(2870-7640)
(350-1960)
TOTALIMPACTS
140340790
2,2202,620300400
6,820
3,870
10,680
230014,100
HEALTH EFFECTS
Lower Respiratory Infections (Infants)Lung CancerOther Cardiovascular DiseasesIschemic Heart DiseaseStrokeOther Respiratory DiseaseChronic Obstructive Pulmonary DiseasePM2.5 Total
All Causes
Total
Low Birth Weight BirthsChildhood Asthma Prevalence
PM2.5,PREMATUREDEATHS
NO2,PREMATUREDEATHS
PREMATUREDEATHSPM2.5
Source: Myllyvirta and Chuwah, 2017.
Table 2. Projected Premature Deaths And Other Health Impacts Caused By Emissions From The Observed CFPPs (cases per year)
Figure 5. Annual Distribution Range of Mercury
CFPPs surrounded Jakarta City are the silent killer that causes premature death of about 5,260 people of Indonesia per year. The
number is expected to incerease to 10,680 people per year with planned CFPPs operated in the future.
Modeled annual average Mercury concentrations caused by the CFPP within 100KM from Jakarta City, both existing CFPPs and planned
CFPPs. Purple and dark blue areas are predicted to have the highest individual health risk.

JAKARTA’S SILENT KILLER 11
PREMATURE DEATHS AND OTHER HEALTH IMPACTS CAUSED BY EMISSIONS FROM THE
OBSERVED CFPPS
12 JAKARTA’S SILENT KILLER
LOCATED WITHIN 100 KMCOAL-FIRED POWER PLANTS
FROM JAKARTA
JAKARTA’S SILENT KILLER 13
14 JAKARTA’S SILENT KILLER
HOW COAL-FIRED POWER PLANTSCAN MAKE YOU SICKCoal-fired power plants expose people to toxic particles, ozone and heavy metals.The most serious health impacts are due to microscopic particles (pm2.5) formed from emissions of sulphur and nitrogen oxides, dust and soot. These particlespenetrate deep into the lungs and into the bloodstream,causing deaths and numerous health problems.

JAKARTA’S SILENT KILLER 15
16 JAKARTA’S SILENT KILLER
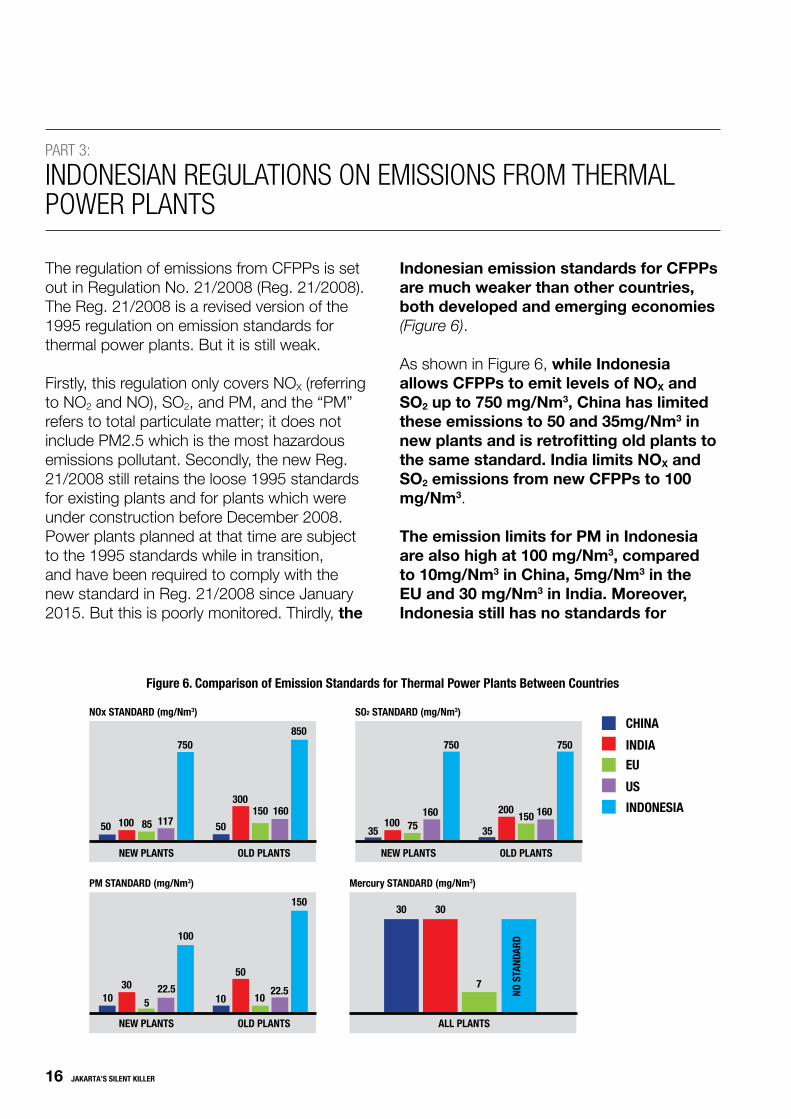
The regulation of emissions from CFPPs is set out in Regulation No. 21/2008 (Reg. 21/2008). The Reg. 21/2008 is a revised version of the 1995 regulation on emission standards for thermal power plants. But it is still weak.
Firstly, this regulation only covers NOX (referring to NO2 and NO), SO2, and PM, and the “PM” refers to total particulate matter; it does not include PM2.5 which is the most hazardous emissions pollutant. Secondly, the new Reg. 21/2008 still retains the loose 1995 standards for existing plants and for plants which were under construction before December 2008. Power plants planned at that time are subject to the 1995 standards while in transition, and have been required to comply with the new standard in Reg. 21/2008 since January 2015. But this is poorly monitored. Thirdly, the
Indonesian emission standards for CFPPs are much weaker than other countries, both developed and emerging economies (Figure 6).
As shown in Figure 6, while Indonesia allows CFPPs to emit levels of NOX and SO2 up to 750 mg/Nm3, China has limited these emissions to 50 and 35mg/Nm3 in new plants and is retrofitting old plants to the same standard. India limits NOX and SO2 emissions from new CFPPs to 100 mg/Nm3.
The emission limits for PM in Indonesia are also high at 100 mg/Nm3, compared to 10mg/Nm3 in China, 5mg/Nm3 in the EU and 30 mg/Nm3 in India. Moreover, Indonesia still has no standards for
PART 3:
INDONESIAN REGULATIONS ON EMISSIONS FROM THERMAL POWER PLANTS
Figure 6. Comparison of Emission Standards for Thermal Power Plants Between Countries
CHINA
EU
US
INDIA
INDONESIA
NEW PLANTS
NOx STANDARD (mg/Nm3)
50 100 50
300150 160
85
750850
117
OLD PLANTS
SO2 STANDARD (mg/Nm3)
35100 150
75 35
200
750 750
160 160
NEW PLANTS OLD PLANTS
Mercury STANDARD (mg/Nm3)
ALL PLANTS
30 30
7
NO S
TAND
ARD
PM STANDARD (mg/Nm3)
NEW PLANTS OLD PLANTS
10 1030 22.5 22.5
5
50
10
100
150
JAKARTA’S SILENT KILLER 17
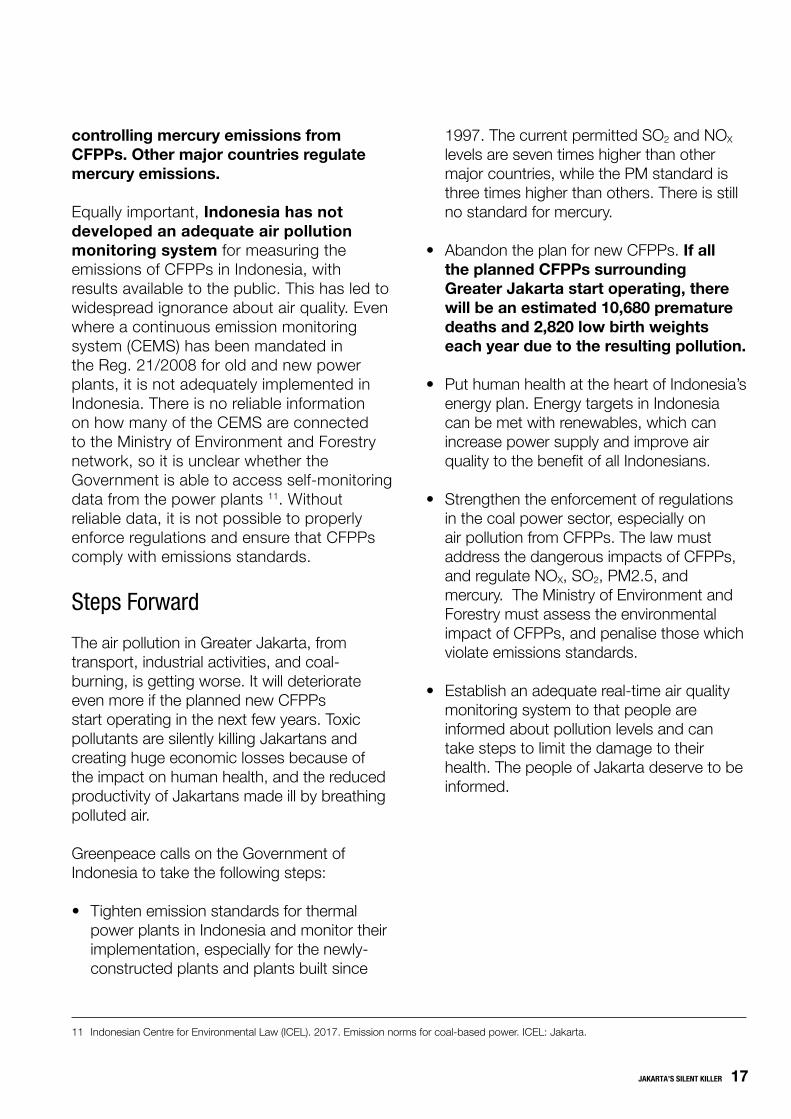
controlling mercury emissions from CFPPs. Other major countries regulate mercury emissions.
Equally important, Indonesia has not developed an adequate air pollution monitoring system for measuring the emissions of CFPPs in Indonesia, with results available to the public. This has led to widespread ignorance about air quality. Even where a continuous emission monitoring system (CEMS) has been mandated in the Reg. 21/2008 for old and new power plants, it is not adequately implemented in Indonesia. There is no reliable information on how many of the CEMS are connected to the Ministry of Environment and Forestry network, so it is unclear whether the Government is able to access self-monitoring data from the power plants 11. Without reliable data, it is not possible to properly enforce regulations and ensure that CFPPs comply with emissions standards.
Steps Forward
The air pollution in Greater Jakarta, from transport, industrial activities, and coal-burning, is getting worse. It will deteriorate even more if the planned new CFPPs start operating in the next few years. Toxic pollutants are silently killing Jakartans and creating huge economic losses because of the impact on human health, and the reduced productivity of Jakartans made ill by breathing polluted air.
Greenpeace calls on the Government of Indonesia to take the following steps:
• Tighten emission standards for thermalpower plants in Indonesia and monitor their implementation, especially for the newly-constructed plants and plants built since
1997. The current permitted SO2 and NOX levels are seven times higher than other major countries, while the PM standard is three times higher than others. There is still no standard for mercury.
• Abandon the plan for new CFPPs. If all the planned CFPPs surrounding Greater Jakarta start operating, there will be an estimated 10,680 premature deaths and 2,820 low birth weights each year due to the resulting pollution.
• Put human health at the heart of Indonesia’s energy plan. Energy targets in Indonesia can be met with renewables, which can increase power supply and improve air quality to the benefit of all Indonesians.
• Strengthen the enforcement of regulations in the coal power sector, especially on air pollution from CFPPs. The law must address the dangerous impacts of CFPPs, and regulate NOX, SO2, PM2.5, and mercury. The Ministry of Environment and Forestry must assess the environmental impact of CFPPs, and penalise those which violate emissions standards.
• Establish an adequate real-time air quality monitoring system to that people are informed about pollution levels and can take steps to limit the damage to their health. The people of Jakarta deserve to be informed.
11 Indonesian Centre for Environmental Law (ICEL). 2017. Emission norms for coal-based power. ICEL: Jakarta.
18 JAKARTA’S SILENT KILLER
12 http://eur-lex.europa.eu/legal-content/EN/TXT/?uri=CELEX:32010L0075 13 Commission Implementing Decision (EU) 2017/1442 of 31 July 2017 establishing best available techniques (BAT) conclusions, under Directive 2010/75/EU of the European Parliament and of the Council, for large combustion plants. http://eur-lex.europa.eu/legal-content/EN/TXT/?uri=CELEX:32017D1442 14 Full implementation of the main objectives of ultra-low emissions and energy-saving transformation of coal-fired power plants. Environmental regulation 2015 No 164. [document in Chinese] http://www.mep.gov.cn/gkml/hbb/bwj/201512/t20151215_319170.htm
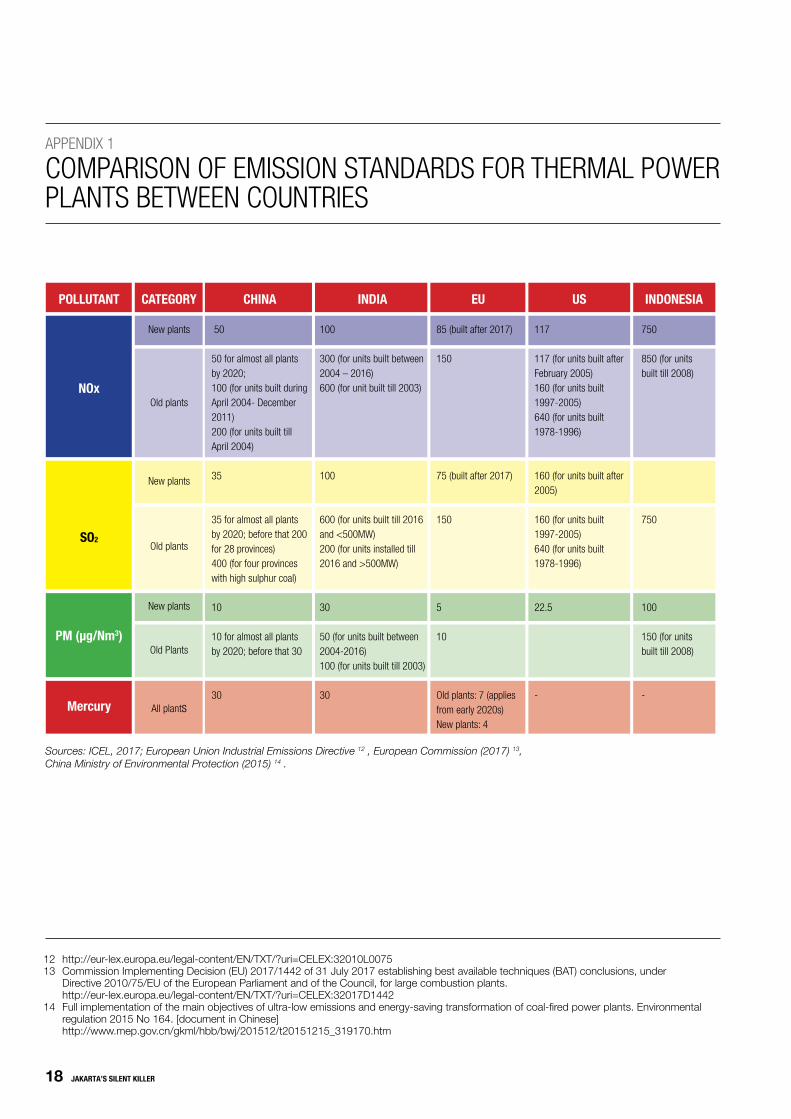
APPENDIX 1
COMPARISON OF EMISSION STANDARDS FOR THERMAL POWER PLANTS BETWEEN COUNTRIES
POLLUTANT
NOx
SO2
PM (μg/Nm3)
Mercury
CATEGORY
New plants
Old plants
New plants
Old plants
New plants
Old Plants
All plants
CHINA
50 50 for almost all plants by 2020; 100 (for units built during April 2004- December 2011)200 (for units built till April 2004)
35
35 for almost all plants by 2020; before that 200 for 28 provinces)400 (for four provinces with high sulphur coal)
10
10 for almost all plants by 2020; before that 30
30
INDIA
100
300 (for units built between 2004 – 2016)600 (for unit built till 2003)
100
600 (for units built till 2016 and <500MW)200 (for units installed till 2016 and >500MW)
30
50 (for units built between 2004-2016)100 (for units built till 2003)
30
EU
85 (built after 2017)
150
75 (built after 2017)
150
5
10
Old plants: 7 (applies from early 2020s)New plants: 4
US
117
117 (for units built after February 2005)160 (for units built 1997-2005)640 (for units built 1978-1996)
160 (for units built after 2005)
160 (for units built 1997-2005)640 (for units built 1978-1996)
22.5
-
INDONESIA
750
850 (for units built till 2008)
750
100
150 (for units built till 2008)
-
Sources: ICEL, 2017; European Union Industrial Emissions Directive 12 , European Commission (2017) 13, China Ministry of Environmental Protection (2015) 14 .

JAKARTA’S SILENT KILLER 19 19 Silent Killer for Jakartans Silent Killer for Jakartans 19
Jakartans breathe directly from the plant in the futureIf the Jakarta’s air quality is likely to get worse soon,
then the Jakartans should find the other sources of clean air. Maybe they can carry the bag of plants and breathe
directly using oxygen produced by plants.
©gr
eenp
eace
/Eva
n Pr
adity
a

20 JAKARTA’S SILENT KILLER
Cover Photo:
The Jakarta’s sky engulfed in a grayish-white haze due to air pollution.
© greenpeace
Acknowledgment:
Lauri Myllyvirta, coal and air pollution specialist, Greenpeace
Clifford Chuwah, PhD, Greenpeace Research Laboratories, Exeter University, UK
Image:
Evan Praditya, Jurnasyanto Sukarno
Contact:
Greenpeace Southeast Asia
Greenpeace is a global organisation that uses non-violent direct action to tackle
the most crucial threats to our planet’s biodiversity and environment. Greenpeace
is a non-profit organisation, present in 40 countries across Europe, the Americas,
Africa, Asia and the Pacific.
Greenpeace Southeast Asia - INDONESIA
Mega plaza Lt. 5, HR. Rasuna Said Kav. C3,
Jakarta 12920
greenpeace.org/seasia/id


