35
PLANT PHYSIOLOGY LABORATORY MANUAL SPRING 2018 FOURTEENTH EDITION ALL MATERIALS ARE EXCLUSIVE PROPERTY OF THE AUTHOR See Proprietary Statement on the Following Page James E. Bidlack

PLANT PHYSIOLOGY LABORATORY MANUAL
SPRING 2018
FOURTEENTH EDITION ALL MATERIALS ARE EXCLUSIVE PROPERTY OF THE AUTHOR
See Proprietary Statement on the Following Page
James E. Bidlack

PROPRIETARY STATEMENT
All materials included in this manual are property of Dr. James E. Bidlack, and
are intended for publication. The text in this edition is printed for use by
students in the UCO Plant Physiology (BIO 3024/3024L) Class ONLY. Infor-
mation found in the Plant Physiology Laboratory Manual by Dr. Bidlack cannot
be quoted, reprinted, paraphrased, or reproduced without the written consent
of the author.

1
PREFACE
This laboratory manual is designed to accompany a one-semester college course
in plant physiology. Its purpose is to guide students through the step-by-step
procedures used to study plant function. In the twelve sections of this manual,
students will be introduced to general laboratory techniques as well as complex
laboratories requiring multiple preparations and analyses.
In the first five labs, students will learn how to use a pipetman, pH meter,
analytical balance, centrifuge, and spectrophotometer. At the same time, these first
labs provide instruction in acid/base chemistry, protein analysis, photosynthesis, and
cellular respiration. The sixth lab, entitled "Malate Dehydrogenase in Soybean," is a
multi-step investigation that requires scientific reasoning to investigate a state-of-
the-art experiment in plant physiology. The "Plasmolysis" and "Water Potential"
labs provide students with basic knowledge of water relations in plants. In the
following labs, students will investigate plant nutrition, growth regulation, and
tissue culture to obtain a better understanding of plant growth and development.
The author gratefully acknowledges the assistance of many plant physiology
students who provided input for writing this laboratory manual. Among those
involved, Carrie Baker, David Brixey, Aaron Elmer, Charlie Freshour, Paul Olson,
Vanessa Nezam, Corey Riley, Casey Meek, Amy Sabolich, and Linda Sherron
provided the greatest amount of input.

2
LABORATORY REPORTS PLANT PHYSIOLOGY LAB
1. Lab reports are required and must be handed in BEFORE LAB on the day the report
is due.
2. Reports will be graded on the basis of completeness, clarity, and creativity.
3. Points as listed on the tentative laboratory syllabus will be used for the value of each
report. The total value for all 15 lab reports is 300 points. That is 300 out of the total
800 points allocated for the course, or 37.5% of the final grade.
4. Format for your lab reports will be as follows:
Article Summary (if needed): Write a one-page synopsis of the article and issues
discussed during class. Staple this summary to the front of your report.
Title: Try to convey the objective of the experiments in a brief title.
Introduction: Briefly explain the purpose of the experiments and give the reader an
idea of practical applications. This should be about 1 to 4 sentences in length.
Procedure: Provide a summary of methodology. Make it short and simple. Briefly
explain how equipment and specimens were used. This section should be less than one
paragraph in length.
Results and Discussion: This section should be written to enable the reader to
conceptualize observations, tables, graphs, and other figures presented in the report.
All results should be neatly presented in an easy-to-read, straight-forward, and
entertaining manner. Highlight the major points of each experiment and provide
your interpretation of results. This is the most important part of your laboratory
report.
Conclusions: Briefly (less that 5 sentences) summarize key concepts and explain why
they are important in studying plant physiological processes. Tell what you learned
from your investigations.
5. Ease of reading, neatness, and entertainment value all contribute towards excellent
lab report grades. Make an attempt to make the report enjoyable to read and make a
special effort to explain what you learned in the conclusions.

3
TABLE OF CONTENTS
LAB TOPIC PAGE
1. PIPETTING, pH, AND BUFFERS ................................ 4 2. SPECTROPHOTOMETRY ......................................... 5 3. CENTRIFUGATION AND PROTEIN DETERMINATION .................. 7 4. PHOTOSYNTHESIS: HILL REACTION ............................ 9 5. TETRAZOLIUM TEST FOR DEHYDROGENASE ACTIVITY .............. 12 6. MALATE DEHYDROGENASE IN SOYBEAN .......................... 13 PART ONE: PLANTING ................................. 15 PART TWO: ORGANELLE ISOLATIONS ..................... 15 PART THREE: PROTEIN AND MDH DETERMINATIONS ......... 17 PART FOUR: SDS POLYACRYLAMIDE ELECTROPHORESIS ...... 18 STOCK SOLUTIONS ..................................... 21 7. PLASMOLYSIS .............................................. 22 8. WATER POTENTIAL .......................................... 23 9. MINERALS AND NUTRIENT DEFICIENCY IN PLANTS ............... 25 10. PLANT GROWTH REGULATORS .................................. 28 11. TISSUE CULTURE ........................................... 29 12. APPENDIX ................................................. 30

4
PIPETTING, pH, AND BUFFERS
OBJECTIVE: To learn the basic skills of pipetting and to
investigate pH and buffering capacity. INTRODUCTION: The degree to which a solution provides resistance to change is the solution's buffering capacity. In this experiment, four solutions will be titrated with NaOH to determine buffering capacity. A pH meter will be used to measure the pH of different solutions throughout the process and phenolphthalein will be used as an indicator. MATERIALS: Titration apparatus pH meter 1 5000 μL pipetman Four 100 mL beakers 200 ml of 0.25 M NaOH 20 ml of 0.25 N HCl 20 ml of 0.25 M TES 20 ml of deionized water 20 ml of Sprite soft drink Phenolphthalein PROCEDURE: 1. Make 100 mL of 0.25 M TES buffer using the molecular weight
marked on the side of the reagent. 2. Use a 5000 μL pipetman to measure the appropriate volume for
each of the following solutions: 20 mL of 0.25 M HCl, 20 mL of 0.25 M TES buffer, 20 mL of deionized water, and 20 mL of Sprite soft drink.
3. To each of the four beakers, add 3 drops of phenolphthalein indicator.
4. Fill the buret in the titration apparatus with 0.25 M NaOH. 5. Place the beaker containing the appropriate sample solution
under the buret and insert the pH probe. 6. Add NaOH, one mL at a time, to the sample solution and record
both the total amount of NaOH added and the resulting pH. Stop when the pH reaches a value of 10 or higher.
7. When the color of the solution begins to turn pink for a long period of time, add NaOH at increments of 0.1 mL.
8. Repeat steps 4 through 7 for each of the four solutions making sure to rinse the pH electrode between each sample.
LAB REPORT: Make four tables, one for each solution, showing mL of NaOH added and the resulting pH of each solution. From the tables, make graphs with amount of NaOH added on the x-axis and pH on the y-axis.

5
SPECTROPHOTOMETRY
OBJECTIVE: To learn how to use a spectrophotometer and to
investigate the absorption spectrum of chlorophyll.
INTRODUCTION: In this experiment an absorption spectrum of chlorophyll will be determined using a Spectronic 20 and a Varian Cary WinUV Spectrophotometer. Absorbance will be measured at different wavelengths to graph the absorption spectrum for acetone-soluble plant pigments. A comparison will be made between the results obtained from the two machines. MATERIALS: Spectronic 20 Spectrophotometer Varian Cary WinUV Spectrophotometer Waring blender and tissue homogenizer Balance Funnel, beakers, and cuvettes 500 mL Erlenmeyer flask and 100 mL graduated cylinder Filter paper 250 mL acetone 5.0 g leaf tissue PROCEDURE: 1. Obtain chlorophyll extract a. Combine 5.0 g of leaf tissue with 250 mL of acetone and
mix in a blender for approximately one minute. b. Filter the resulting extract twice, changing the filter
paper each time. 2. Measure chlorophyll extract a. Spectronic 20 Spectrophotometer. Standardize the
machine before each measurement with the solvent (acetone). The machine should show full absorbance (0% transmittance) without sample and no absorbance (100% transmittance) with the acetone "blank" inserted into the machine. Measurements should be taken at 380 nm through 700 nm at 20 nm increments. Once the machine is standardized with the blank at each wavelength, measure the absorbance of the chlorophyll extract and record both the wavelength and the absorbance.
b. Varian Cary WinUV Spectrophotometer. Enter the blank to standardize the spectrophotometer and then measure the sample as demonstrated by the instructor (see next page).
LAB REPORT: Make two graphs, one for each machine, with the wavelength on the x-axis and absorbance on the y-axis.

6
SPECTROPHOTOMETRY (continued) OPERATION OF THE VARIAN CARY WinUV SPECTROPHOTOMETER: This is a new machine – instructions will be provided in class.

7
CENTRIFUGATION AND PROTEIN DETERMINATION OBJECTIVE: To learn how to use a centrifuge for making crude
extracts and to determine protein concentration using a spectrophotometer.
INTRODUCTION: Protein concentration is one of the most fundamental measurements made in physiology laboratories. In this exercise, students will use bovine serum albumin (BSA) to make a standard curve of absorbance vs protein concentration. Preparations of potato, made from grinding and centrifugation steps, will then be used to determine the concentration of protein in red and white potatoes. MATERIALS: Varian Cary WinUV Spectrophotometer Tissue homogenizer Centrifuge Analytical balance 1 5000 μL pipetman 12 100 mL beakers 2 30 mL centrifuge tubes 9 sample vials for protein determination Filter paper Bio-Rad protein dye reagent 500 mL 100 mM TES buffer (pH = 7.0) Bovine Serum Albumin (BSA) red and white potatoes (1 set for each group) PROCEDURE: 1. Enzyme extraction from potato (each group will extract
protein from one white and one red potato) a. Weigh 5.000 g of potato and put small pieces into a
beaker with 50.0 mL of TES buffer at pH = 7.0. b. Homogenize for 30 seconds and filter the mixture into a
100 mL beaker. Store on ice until centrifugation. c. Centrifuge the potato mixture at 1200 g for 10 min. d. Discard the pellet and transfer the supernatant into a
beaker for protein determination. e. Filter the samples (if necessary) and store on ice. 2. Protein standards a. Weigh 100.0 mg of BSA and place in a volumetric flask
with 100.0 mL of TES buffer at pH = 7.0. b. Gently swirl the mixture to dissolve all BSA. c. The resulting solution should have a protein
concentration of 1.000 mg/mL. d. Make dilutions to prepare standards with the following
concentrations: 0.500 mg/mL, 0.100 mg/mL, 0.050 mg/mL, 0.010 mg/mL, 0.005 mg/mL. Include a blank with only TES buffer as a reference for the spectrophotometer.

8
CENTRIFUGATION AND PROTEIN DETERMINATION (continued) 3. Determination of protein concentration a. Prepare dye reagent by diluting 1 part of the Bio-Rad
concentrate with 4 parts of deionized water and filter. b. Prepare samples for standard protein determination by
adding 0.100 mL of each of standards into marked vials. You should have a total of 7 marked vials with protein concentrations ranging from 0.000 mg/mL to 1.000 mg/mL.
c. Prepare samples for potato protein determination by adding 0.100 mL of each potato extract into marked vials.
d. Add 5.000 mL of prepared dye reagent to each of the vials containing standard protein and potato extract.
e. Incubate vials at room temperature for no less than 10 minutes and no more than 1 hour.
f. Determine absorbance of the sample at 595 nm as demonstrated by the instructor.
g. Record the absorbance for each of the samples. LAB REPORT: 1. Plot absorbance vs protein concentration to show the curve
for protein standards. A straight line should be obtained. The equation of the line should approximate the equation, y = mx, since the y-intercept is zero.
2. Determine the slope of the line using the formula, m = ∑xy/∑x2.
3. Use the slope of the line to determine protein concentration in your potato extract (i.e., x = y/m).
4. Obtain protein values for red and white potatoes from the rest of the class.
5. Determine average protein concentration (μ) of red and white potatoes using the formula, μ = ∑ x1 + x2 + x3 + .../n.
6. Find standard error for each of the average protein values using the formula, SE = √s2/n, where s2 = ∑(xi - μ)
2/n-1. 7. Determine if the protein concentration of red and white
potatoes is significantly different.

9
PHOTOSYNTHESIS: HILL REACTION OBJECTIVE: To introduce the student to the mechanisms
involved in converting solar energy into chemical energy and the fundamentals of the Hill Reaction.
INTRODUCTION: Plant tissues contain a combination of various chemicals and pigments. These pigments are necessary for the plant to continue life. One such pigment is chlorophyll, which is the essential photoreceptor that initiates the light reactions of photosynthesis. Chlorophyll enables the conversion of light energy to electron excitation energy, which is transported through various systems to enable phosphorylation of ADP to ATP and reduction of NADP to NADPH. The Hill Reaction explains the mechanism by which light splits a water molecule (by photolysis) releasing oxygen, protons, and, most importantly, electrons. Robin Hill and his associates made this discovery in the 1930's and it has since been used to further understand the mechanism of photosynthesis. In the laboratory, chloroplasts are capable of releasing oxygen in the presence of light. When oxygen is released, compounds present in the leaf, such as ferredoxin, NADP, and 3-PGA, accept electrons. If 2,6-dichlorophenol-indophenol (DCPIP) is used, however, it can replace electron acceptors and serve as an indication of oxygen release by chloroplasts. DCPIP is blue when oxidized and becomes colorless when reduced: light DCPIP + H2O ===================> DCPIP-H2O + 1/2 O2 (blue) (colorless) chlorophyll MATERIALS: Varian Cary WinUV Spectrophotometer Tissue homogenizer and vortex Centrifuge Analytical balance Microscope 1 1000 μL pipetman High intensity light source Knife, scissors, or razor blade Aluminum foil Cheese cloth 4 150 mL beakers 2 30 mL centrifuge tubes 6 10 mL test tubes 250 mL 0.50 M sucrose or other grinding solution 250 mL 0.10 M phosphate buffer (pH = 6.5) 50 mL 0.20 mM DCPIP solution 8 grams of spinach leaves, preferably chilled

10
PHOTOSYNTHESIS: HILL REACTION (continued) PROCEDURE: 1. Chloroplast isolation a. Chill spinach leaves on ice or in a refrigerator 30
minutes before using. b. Obtain 8.00 grams of leaf tissue and cut into small
pieces approximately 1 cm square. Keep the leaf pieces cold to ensure optimum enzyme activity of all samples.
c. Place shredded leaf in a 150 mL beaker with 40 mL of cold 0.50 M sucrose or other grinding solution.
d. Homogenize for 15 seconds at top speed, wait about 10 seconds and homogenize again for 10 seconds.
e. Squeeze the resulting homogenate through four layers of prechilled cheesecloth into a prechilled 150 mL beaker.
f. Quickly pour this green filtrate into a 30 mL centrifuge tube and place on ice.
g. Centrifuge the filtrate at 200 g for 3 minutes to pellet nuclei, cell wall debris, and other materials not needed in the sample.
h. Decant the supernatant into another 30 mL centrifuge tube and spin at 1000 g for 7 minutes to pellet the chloroplasts.
i. Discard the supernatant and resuspend the chloroplasts in 10 mL of cold 0.50 M sucrose or other grinding solution.
j. After resuspension, centrifuge again at 200 g for 3 minutes to pellet additional contaminants.
k. Resuspend supernatant and spin at 1000 g for 7 minutes to pellet relatively pure chloroplasts.
l. Resuspend the pellet in 10 mL of cold 0.10 M phosphate buffer at pH 6.5. Keep on ice.
m. If time permits, examine the chloroplast suspension microscopically and record your observations.
2. Determine chlorophyll concentration a. Measure the absorbance of the chloroplast isolation at
652 nm and multiply by 0.58 to obtain the concentration of chlorophyll in mg/mL. This number may be necessary for relative comparison of the rate of reaction for each sample.
3. Treatments for detecting Hill Reaction a. Prepare solutions in test tubes as shown in Table 1. b. Place test tubes the appropriate distance from the
light source. c. After allotted time, measure the absorbance at 600 nm
or determine the relative intensity of color as demonstrated by the instructor.
d. Record the absorbance or relative color every 10 minutes for a period of 40 minutes.

11
PHOTOSYNTHESIS: HILL REACTION (continued) Table 1. Description of treatments for studying the Hill
Reaction
Tube Treatment Chloroplast Suspension
Phosphate Buffer
H2O DCPIP
1 DCPIP control none 1.0 mL 4.0 mL 0.5 mL
2 Darkness (wrap in foil)
2.0 mL 1.0 mL 2.0 mL 0.5 mL
3 Light treatment 1 (12 inches from light)
2.0 mL 1.0 mL 2.0 mL 0.5 mL
4 Light treatment 2 (24 inches from light)
2.0 mL 1.0 mL 2.0 mL 0.5 mL
5 Light treatment 3 (36 inches from light)
2.0 mL 1.0 mL 2.0 mL 0.5 mL
6 Light treatment 4 (48 inches from light)
2.0 mL 1.0 mL 2.0 mL 0.5 mL
LAB REPORT: Construct a table showing the absorbance or relative color of the treatments over a period of 40 minutes. Using the table, make graphs showing time on the x-axis and absorbance on the y-axis for each of the six treatments.
12
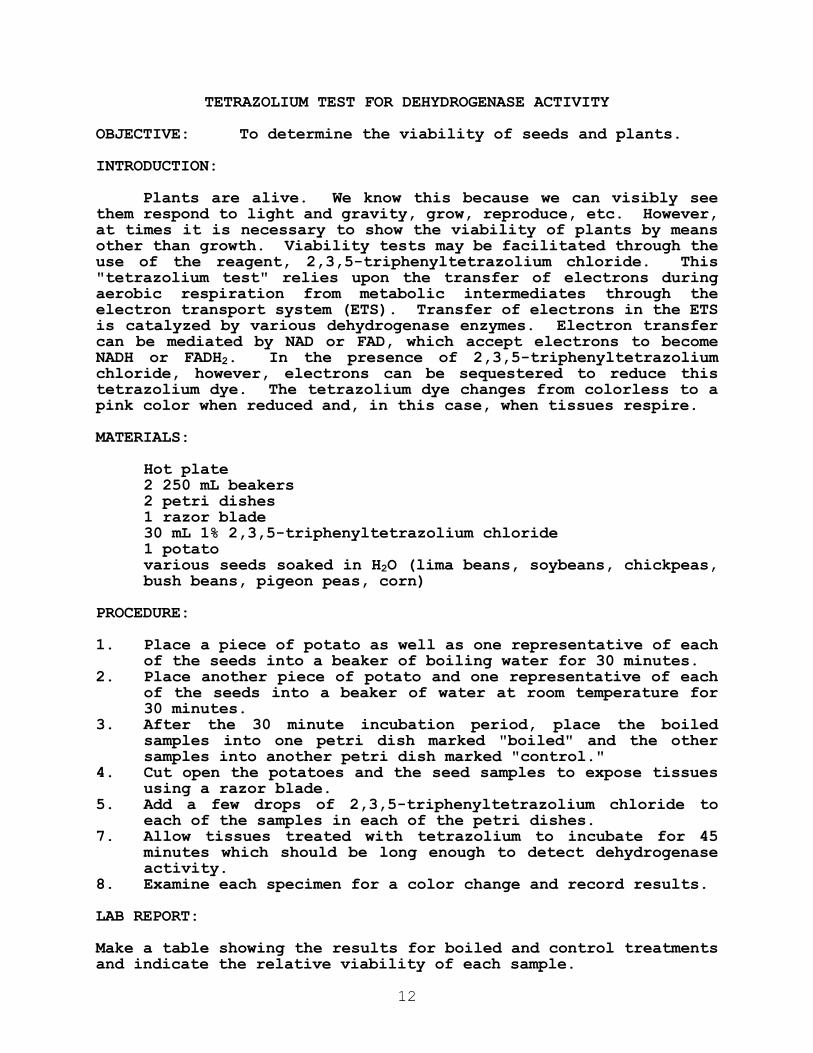
TETRAZOLIUM TEST FOR DEHYDROGENASE ACTIVITY OBJECTIVE: To determine the viability of seeds and plants. INTRODUCTION: Plants are alive. We know this because we can visibly see them respond to light and gravity, grow, reproduce, etc. However, at times it is necessary to show the viability of plants by means other than growth. Viability tests may be facilitated through the use of the reagent, 2,3,5-triphenyltetrazolium chloride. This "tetrazolium test" relies upon the transfer of electrons during aerobic respiration from metabolic intermediates through the electron transport system (ETS). Transfer of electrons in the ETS is catalyzed by various dehydrogenase enzymes. Electron transfer can be mediated by NAD or FAD, which accept electrons to become NADH or FADH2. In the presence of 2,3,5-triphenyltetrazolium chloride, however, electrons can be sequestered to reduce this tetrazolium dye. The tetrazolium dye changes from colorless to a pink color when reduced and, in this case, when tissues respire. MATERIALS: Hot plate 2 250 mL beakers 2 petri dishes 1 razor blade 30 mL 1% 2,3,5-triphenyltetrazolium chloride 1 potato various seeds soaked in H2O (lima beans, soybeans, chickpeas,
bush beans, pigeon peas, corn) PROCEDURE: 1. Place a piece of potato as well as one representative of each
of the seeds into a beaker of boiling water for 30 minutes. 2. Place another piece of potato and one representative of each
of the seeds into a beaker of water at room temperature for 30 minutes.
3. After the 30 minute incubation period, place the boiled samples into one petri dish marked "boiled" and the other samples into another petri dish marked "control."
4. Cut open the potatoes and the seed samples to expose tissues using a razor blade.
5. Add a few drops of 2,3,5-triphenyltetrazolium chloride to each of the samples in each of the petri dishes.
7. Allow tissues treated with tetrazolium to incubate for 45 minutes which should be long enough to detect dehydrogenase activity.
8. Examine each specimen for a color change and record results. LAB REPORT: Make a table showing the results for boiled and control treatments and indicate the relative viability of each sample.

13
MALATE DEHYDROGENASE IN SOYBEAN INTRODUCTION: Recent experiments have enabled alteration of isozyme banding patterns for malate dehydrogenase (MDH) in soybean. These variants demonstrate banding patterns lacking mitochondrial MDH (mMDH) in the cultivar lines w4-m (from Asgrow mutable), y20-k2 (from Harosoy), and Jilin 3 (from Jilin 3). What is surprising about these results is that, although the isozymic mutations appear to be mitochondrial, phenotypic variants demonstrate low levels of chlorophyll. From these results it is apparent that some mutable mechanism is responsible for regulating mMDH expression and chlorophyll synthesis in chloroplasts of the variant lines, w4-m, y20-k2, and Jilin 3. Whether or not this mechanism is physiological, genetic, or a combination thereof has yet to be determined. Malate dehydrogenase demonstrates variability in isozyme pattern, genetic inheritance, and physiological function. Although some MDH enzymes exist in the cytosol and chloroplast of plants, new research focuses on mMDH enzymes because variants found in soybeans lack bands for the mitochondrial form of the enzyme. In mitochondria, the metabolic function of MDH is conversion of MDH to oxaloacetate (OAA) coupled to NADH production. Physiological explanation for mMDH-imposed chlorophyll deficiencies has potential, although genetic differences probably exist for specific MDH alleles and may exist for loci encoding chlorophyll synthesis. Two scenarios have been developed to speculate possible mechanisms relating the MDH mutation to chlorophyll deficiency. The first scenario associates decreased MDH activity and deficient malate and glutamate transport with degenerated chlorophyll synthesis. A second scenario hypothesizes a transposable element which may alter genetic structure of associated genes for mMDH and chlorophyll synthesis. The first scenario involves interrelationships between MDH, malate, glutamate, and chlorophyll in the mitochondrion, glyoxysome, cytosol, and chloroplast (Figure 1). In this mechanism, retarded mitochondrial and glyoxysomal MDH activity results in a lack of OAA and succinate by means of the TCA cycle and glyoxylate pathways. Subsequently, lack of OAA and succinate causes a deficiency of α-ketoglutarate via the TCA cycle and shuttle mechanisms. Deficient α-ketoglutarate causes a lack of glutamate and hence, lack of glutamate results in retarded chlorophyll synthesis. In addition to causing lack of the glutamate template for chlorophyll synthesis, retarded mMDH activity may also curtail cytosolic and chloroplast reducing equivalents (in the form of malate) needed for the synthesis of chlorophyll.

14
MALATE DEHYDROGENASE IN SOYBEAN (continued)
Figure 1. Hypothetical mechanism demonstrating interrelationships among subcelluar intermediates involved in synthesis of chlorophyll in mutant soybean lines. Solid lines represent known metabolic pathways and the two dashed lines suggest possible transport of glutamate from peroxisomes or mitochondria to chloroplasts for eventual conversion to chlorophyll.
(Adapted from: Elmer, A.M., and J.E. Bidlack. 2010. Enzymes related to chlorophyll biosynthesis in soybean [Glycine max (L.) Merr.] lines. Proc. Okla. Acad. Sci. 90:11-18.)

15
MALATE DEHYDROGENASE IN SOYBEAN (continued) In the second scenario, a transposable element alters MDH activity and chlorophyll synthesis through insertion or modified deletion after transposition. Retarded chlorophyll synthesis may be coincident with transposon-induced deactivation of the mMDH gene. Recurring transposition leads to chromosomal deletion, inversion, duplication, and recombination which can curtail mMDH expression as well as expression of other genes. It is evident from this hypothesis that a transposon inhibiting mMDH expression could lead to yellow plants if the transposase coincidently affects chlorophyll synthesis. While both scenarios provide explanation of chlorophyll differences in MDH soybeans, other speculatory mechanisms may integrate their reasoning into one hypothesis. Before such a hypothesis is devised, it will be necessary to obtain more information on the enzyme characteristics, chlorophyll quality and content, heritability, and genetic sequences of normal and mutant soybean plants. PART ONE: PLANTING MATERIALS: 2 pots with soil 4 normal Jilin soybean seeds 4 mutant Jllin soybean seeds PROCEDURE: 1. Plant 4 normal Jilin seeds in a pot labeled "Jilin Normal." 2. Plant 4 mutant Jilin seeds in a pot labeled "Jilin Mutant." 3. Place the pots in a designated area in the lab. LAB REPORT: The results from all four sections of this experiment should be combined into one report as described at the end of part four. For this first section, you should check the height and other characteristics of the plants every week for two or three weeks. Be sure to make observations of the color of the plants and the condition of the leaves. PART TWO: ORGANELLE ISOLATIONS MATERIALS: Tissue Homogenizer Centrifuge Also see the section marked "STOCK SOLUTIONS" in this
experiment

16
MALATE DEHYDROGENASE IN SOYBEAN (continued) PART TWO: ORGANELLE ISOLATIONS* (continued) PROCEDURE (KEEP ALL SAMPLES AND BUFFERS ON ICE THROUGHOUT THE EXPERIMENT): 1. Make 1.0 L of grinding and 2.0 L of washing (buffer) solution
as indicated in STOCK SOLUTIONS. 2. Make sucrose gradients using buffer as indicated in STOCK
SOLUTIONS for: a. 0.40 M sucrose pH = 7.2. b. 0.25 M sucrose pH = 7.2. 3. For each plant sample (normal and mutant), remove 10.00 g of
soybean tissue, place in a beaker, add 20.0 mL grinding buffer, and grind with tissue homogenizer for 20 s.
4. Strain suspension through four layers of cheesecloth into a centrifuge tube and spin at 200 g for 5 minutes.
5. Discard pellet, save 2.0 mL of supernatant (CONTAINING TOTAL EXTRACT) and place in a storage container labeled as #1. There should be a container #1 for the mutant Jilin and a container #1 for the normal Jilin tissues. Hereafter, you should assume there will be two storage containers each time you are instructed to save a fraction. Centrifuge the remaining supernatant at 5000 g for 10 minutes.
6. Save 2.0 mL of supernatant from step 5 (CONTAINING CRUDE MITOCHONDRIA) and label as #2. Put the remaining supernatant into a temporary storage container on ice and resuspend the pellet in 10.0 mL of "stock washing and buffer" solution.
7. Centrifuge the resuspended pellet at 1,250 g for 10 minutes to obtain chloroplasts.
8. Save 2.0 mL of supernatant from step 7 and label as #3 (CONTAINING CRUDE MICROBODIES). Discard the remaining supernatant, resuspend pellet (CONTAINING CHLOROPLASTS) in 2.0 mL of stock washing and buffer solution, and put into a labeled vial marked as #4.
9. Put the supernatant from the temporary storage container in step 6 into a centrifuge tube and spin at 16,700 g for 10 minutes to collect crude mitochondria.
10. Save 2.0 mL of supernatant from step 9 (CONTAINING RESIDUAL SUPERNATANT) and label as #5. Discard the remaining supernatant and gently resuspend the pellet containing mitochondria with 2.0 mL 0.25 M sucrose solution using a Pasteur pipette. This resuspension (CONTAINING WASHED MITOCHONDRIA) should be labeled as #6.
11. Be sure that you have obtained samples #1 through #6 for both normal and mutant plants. Place each set in a plastic bag, and store in the freezer until enzyme assay and protein determinations.
*These steps may be modified during lab.

17
MALATE DEHYDROGENASE IN SOYBEAN (continued) PART THREE: PROTEIN AND MDH DETERMINATIONS MATERIALS: Varian Cary WinUV Spectrophotometer 5000 μL and 1000 μL pipetmen 7 vials for standard protein determination 18 vials for blank and sample protein determination 18 vials for blank and sample enzyme assays Bio-Rad protein dye reagent Also see the section marked "STOCK SOLUTIONS" PROCEDURE (KEEP ALL SAMPLES AND BUFFERS ON ICE THROUGHOUT THE EXPERIMENT): 1. Protein determination a. Prepare protein dye reagent and protein standards as
outlined in the "CENTRIFUGATION AND PROTEIN DETERMINATION" experiment.
b. Obtain organelle isolations prepared from normal and mutant Jilin soybean extracts. Defrost these samples, but keep on ice.
c. Determine protein concentration of these samples according to the "CENTRIFUGATION AND PROTEIN DETERMINATION" experiment. You will need to use 0.10 mL of each sample for this determination.
2. MDH determination a. Transfer 0.50 mL of each sample to a vial labeled with
the appropriate name of the plant (normal or mutant) and centrifugation fraction number (#1 through #6). Include two blanks containing only 0.25 M sucrose solution. You should have a total of 14 vials. Place these vials in the refrigerator until they are used for enzyme assays.
b. Make the MDH substrate as outlined in the "STOCK SOLUTIONS" section of experiment and warm to 30 ºC.
c. Choose the MDH file from the spectrophotometer computer and check to make sure that the deuterium lamp is on and the machine is reading at 340 nm.
d. Reference the spectrophotometer with 0.25 M sucrose solution to obtain an absorbance of zero at 340 nm.
e. Add 4.5 mL of MDH substrate to each vial containing an extract, swirl, transfer to spectrophotometer, and observe linear absorbance increase for 5 to 10 minutes.
f. Calculate activity (μmol/mg/min) with ε = 6223 M-1 cm-1 for NADH production coupled to MDH.
Example of calculation for enzyme activity: If an extract containing 0.1725 mg/mL of protein causes a change in absorbance of 0.125 units
over a period of 5 minutes, what is the activity in μmol/mg/min (assume assay was performed with 0.5 mL extract plus 4.5 mL of substrate)?
hint: use A = εbc
0.125 = (6223)(1)(c) (2.00 E-5)[(0.5 + 4.5) E-3](1/0.5)(1/0.1725) = 1.1644 E-6 mol/mg protein
thus, c = 2.00 E-5 (1.1644 E-6 mol/mg protein)(1/5 minutes)(1 E6 μmol/mol) = 0.2329 μmol/mg/min

18
MALATE DEHYDROGENASE IN SOYBEAN (continued) PART FOUR: SDS POLYACRYLAMIDE ELECTROPHORESIS (SDS-PAGE) MATERIALS: SDS polyacrylamide gel electrophoresis apparatus Power supply for electrophoresis Pre-made polyacrylamide gels Prepared reagents including sample loading dye, protein
ladder, Coomasie Blue Staining Solution, Destaining Solution, and other reagents as needed
Pre-made reagents as follows:
Laemmli Running Buffer: Use 10x stock solution of Tris/Glycine/SDS to prepare 1.0 L of solution. About 1.0 L will be needed for samples as well as the gel tank, so use 100 mL of the Trix/Glycine/SDS stock to mix with 900 mL of deionized water. 5.0 mM Dithiothreitol Solution: Dissolve 0.771 g of dithiothreitol in 100 mL of deionized water to obtain a 5.0 mM solution.
PROCEDURE (KEEP ALL SAMPLES AND BUFFERS ON ICE PRIOR TO SAMPLE PREPARATION):
1. Mix the following (in labeled microcentrifuge tubes) on the same day that electrophoresis is performed:
500 μL of each sample to be used for SDS-PAGE
500 μL of Laemmli Running Buffer 100 μL of Dithothreitol Solution
2. Securely fasten lids of tubes, mix samples thoroughly, and place in a 70 ºC water bath for 10 minutes to denature proteins. Then remove and store on ice.
3. Transfer 20 μL of mixture from each microcentrifuge tube to a new,labeled microcentrifuge tube and add 5 μL of loading dye. 4. Obtain a pre-made SDS-PAGE gel (from Bio-Rad) and carefully
remove it from the package with gloves (polyacrylamide is a neurotoxin). Remove the comb from the gel and then cut and remove the plastic casing on the bottom part of the gel.
5. Mount the gel into the electrophoresis chamber so that the
wells face the inner chamber. Gels can be loaded on either side. A filler slab of plastic can be used if there is no gel on the opposite side of the chamber.
6. Fill the electrophoresis chamber with Laemmli Running Buffer
so that there is enough solution to cover the top of the gel

19
but do not overfill the tank. MALATE DEHYDROGENASE IN SOYBEAN (continued)
7. Leave gel well #1 empty and fill gel well #2 with 20 μL of molecular weight standard.
8. For the remaining wells, use 20 μL of each sample from step #3 to load the rest of the SDS-PAGE gel for protein separation.
9. Make sure the power supply is turned off and the voltage is
turned all the way down and then place the cover on the electrophoresis chamber.
10. Plug the leads into the power supply and dial the voltage to
200 V (or “high” depending on the model used). Ensure that the gel is running by looking for tiny bubbles rising from the bottom of the inner chamber. As time progresses, the dye front should be moving slowly down the gel.
11. Allow the gel to “run” for about 1 hour or until the tracking
dye front is seen about ¾ the way down the gel. 12. Turn off the power supply, disconnect the leads, and prepare
for removing and staining the gel. 13. Fill the staining tray with Coomassie Blue staining solution. 14. Using gloves, carefully remove the gel from the
electrophoresis chamber. Invert the plate, with the gel attached, into the staining solution and allow the gel to float into the solution.
15. Cover the staining tray with plastic wrap and let the gel
stain overnight. 16. After staining, pour out the Coomassie Blue solution (it can
be re-used) and add destaining solution. The destaining solution may need to be used several times to make the blue bands visible on the gel.
17. Observe the gel, noting number and location of bands relative
to the molecular weight standard bands. Take a picture of the gel for your lab report.

20
MALATE DEHYDROGENASE IN SOYBEAN (continued) LAB REPORT: 1. Data gathering: Library research is needed. There must be
at least five articles cited in the paper. Carefully read and understand the data gathered during the course of the experiment.
2. The paper should include the following parts: a. Abstract. A summary of the paper. b. Introduction. It should include information about
previous experiments that have been done on the same topic.
c. Materials and Methods. Materials are described first and methods are explained thereafter step by step. Refer to lab notes and handouts for assistance.
d. Results and Discussion. Explain the tables, graphs, and figures. Results usually include a statement such as "this test gave these results." Discussion follows to explain the how data relate to the literature and other findings in your investigation.
e. Conclusions. Provide generalized statements about the important findings from experiments and an overall statement of new knowledge revealed by significant data.

21
MALATE DEHYDROGENASE IN SOYBEAN (continued) STOCK SOLUTIONS I. Grinding Solution (pH = 7.6 ) Quantity/2 L 1. 0.4 M sucrose (MW 342.31) 273.84 g 2. 50 mM TES (MW 229.2) 22.92 g 3. 5 mM EDTA (MW 372.2) 3.72 g 4. 2% PVP (MW 157.63) 40.00 g 5. 4 mM Cysteine (MW 157.63) 1.26 g II. Stock Washing and Buffer Solution (pH = 7.2) Quantity/3 L 1. 10 mM TES (MW 229.2) 6.88 g NOTE THAT THIS BUFFER (STOCK WASHING AND BUFFER SOLTUION) SHOULD BE USED TO MAKE SUCROSE GRADIENTS AS FOLLOWS: Sucrose Gradients (pH = 7.2 in buffer) Quant/500 mL of II buffer A. 0.40 M Sucrose (MW 342.31) 68.46 g B. 0.25 M Sucrose (MW 342.31) 42.79 g III. Substrate for Malate Dehydrogenase (pH = 7.2 in II buffer) Quant/1.0 L IIB buffer 1. 2 mM NAD (MW 663.4) 1.3268 g 2. 5.0 μM Antimycin A* (MW 548.62) 0.0027 g 3. 0.96 mM Deoxycholic Acid (MW 414.6) 0.4000 g 4. 20 mM Malate (MW 134.1) 2.6820 g *Ask your instructor to help you with handling of Antimycin A – it is a terminal electron acceptor and can cause serious sickness (or death) if handled inappropriately. To assay, add 4.5 mL of substrate to 0.50 mL of extract and observe increase in absorbance at 340 nm. Calculate activity coupled to NADH production with an extinction coefficient of 6223 M-1 cm-1 by Beers Law.

22
PLASMOLYSIS OBJECTIVE: To observe plasmolysis and deplasmolysis in the
epidermal layer of red onion cells and relate this process to plasmolysis occurring in other plant cells.
INTRODUCTION: Plasmolysis can be observed in red onion cells when concentrated sucrose solution is added to the surrounding environment because the water potential of concentrated sucrose is lower than that of onion cells. Deplasmolysis, which is the reversal of this process, can be initiated by adding a solution of pure water to the outside of the onion cells. During deplasmolysis, the protoplast within the cell swells to its original size. MATERIALS: Microscope Razor blade Microscope slide and cover slip 2 Pasteur pipettes 20 mL 2.5 M sucrose solution or 1.0 M NaCl solution 20 mL deionized H2O 1 red onion PROCEDURE: 1. Tear off a few of the outer scales from a red onion exposing
the inner purplish bulb. 2. From this bulb, cut out a small section (4-5 mm) of tissue
with a razor blade and make an incision through this tissue to obtain a thin slice of the epidermis.
3. Mount this epidermal tissue onto a microscope slide with 2 or 3 drops of water and place a coverslip on the sample.
4. Observe these cells under low power and note the coloration and size of the vacuole.
5. Add 2 or 3 drops of 2.5 M sucrose to the tissue sample at one side of the coverslip.
6. Quickly observe the shrinkage of the protoplast within the cells.
7. Deplasmolyse the cells by adding water back to the tissue sample in the same manner the sucrose solution was added.
8. Observe protoplast expansion. LAB REPORT: Make drawings of the onion cells before and after plasmolysis as well as after deplasmolysis.

23
WATER POTENTIAL OBJECTIVE: To understand differences in water potential as
measured by the Chardakov Method. INTRODUCTION: Plants obtain water and nutrients from the soil through the xylem which carries these materials to leaves, stems, and other areal plant organs. Water movement from the roots to areal organs occurs because it moves from high water potential in the roots to relatively low water potential in the shoots. Understanding water potential provides a basis for predicting the movement of water in plants. The Chardakov Method potential is a fundamental technique for obtaining comparable measurements of water potential in plant tissues. MATERIALS: Cork borer, 4 or 5 mm diameter Razor blade Thermometer Forceps 1 25 mL graduated cylinder 7 100 mL beakers 7 disposable pipets 21 30 mL test tubes 1 L 1.00 molal sucrose solution Methylene blue dye reagent 1 large potato PROCEDURE: 1. Label 7 30-mL test tubes with the following molalities: 0.10
molal, 0.15 molal, 0.20 molal, 0.25 molal, 0.30 molal, 0.35 molal, and 1.00 molal. Make 2 more test tube sets with the same labels.
2. Using the stock solution of 1.0 molal sucrose solution, make 50 mL of the necessary molal solutions for two of the sets of test tubes. Store these solutions in labeled 100 mL beakers.
3. With a 4 to 5 mm diameter cork borer, cut 21 sections of 40 mm or longer pieces from the inside of a large potato.
4. Place 3 sections into each of the first set of 7 test tubes already labeled as indicated in step 1.
5. Add 20 mL of the appropriate sucrose solution to each of the 7 tubes in step 4.
6. Allow the sucrose solutions to equilibrate with the potato samples for approximately 30 minutes.
7. While the potato samples are equilibrating, add 20 mL of the appropriate sucrose solutions to the second set of 7 test tubes already labeled as indicated in step 1.
8. Add a small amount of methylene blue dye reagent to each of the tubes from step 7 and mix to obtain blue sucrose solutions.

24
WATER POTENTIAL (continued) 9. After the 30 minute incubation period, pour off the solution
from the potato sections into the third set of 7 test tubes already labeled as indicated in step 1.
10. Record the temperatures of the solutions in step 9. 11. Using a disposable Pasteur pipet, transfer a drop of the
methylene blue solution from step 8 into the corresponding equilibrated potato solution from step 9 potato sections. The drop should be slowly released about halfway into the test tube.
12. Note whether the blue dye drop rises, falls, or remains in the center of the solution.
a. If the water potential of the dye solution is higher than that of the equilibrated potato solution (equilibrated solution is more dense), the dye drop will diffuse up the test tube.
b. If the water potential of the dye solution is lower than that of the equilibrated potato solution (dye solution is more dense), the dye will diffuse down the test tube.
c. If the water potential of the dye solution and equilibrated potato solution is the same, the dye will diffuse evenly in the test tube.
13. From your observations, estimate the molality of the equilibrated potato solution.
LAB REPORT: Make drawings to show the direction of the drop for each of the 7 tubes. Calculate the water potential of the potato using the equation, Ψs = -CiRT, where Ψs the osmotic potential in MPa, Ci is the molality, R is the constant, 0.00831 kg*MPa/mol*K, and T is the absolute temperature in degrees Kelvin. You will also need to assume that Ψ = Ψs in potato tissues to determine water potential.

25
MINERALS AND NUTRIENT DEFICIENCY IN PLANTS
OBJECTIVE: To gain a better understanding of plant nutrition. INTRODUCTION: A mineral can be defined as essential if normal growth and reproduction cannot be carried out in its absence. If a plant lacks a nutrient there will be specific signs to aid in assessing which nutrient is deficient. MATERIALS: 16 nutrient solution containers 2 germination flats containing potting soil 30 bean and 30 corn seeds Nutrient deficiency solutions as outlined in Tables 1 and 2 PROCEDURE: 1. Plant approximately 30 bean and 30 corn seeds in flats
containing sterilized potting soil. 2. Prepare 16 1.0 L containers that will used for each nutrient
solution treatment. 3. After one week, transfer two or three seedlings to the
appropriate nutrient solutions as indicated in Tables 1 and 2.
Table 1. Stock solutions for mineral deficiency experiment.
Stock Solution Compound Concentration Grams per Liter
A Ca(NO3)2*4H20 1.0 M 236.1 B KNO3 1.0 M 101.1 C MgSO4*7H20 1.0 M 246.4 D KH2PO4 1.0 M 136.1 E Ca(H2PO4)2*H2O 0.01 M 2.52 F K2SO4 0.5 M 87.2 G CaSO4*2H2O 0.01 M 1.72 H Mg(NO3)2*6H2O 1.0 M 256.4 I Minor elements. This solution contains 1.81 grams
MnCl2*4H2O, 2.86 grams H3BO3, 0.22 grams ZnSO4*7H2O,
0.08 grams CuSO4 and 0.09 grams H2MoO4. J Iron-ethylenediaminetetraacetate (Na2FeEDTA) will
be prepared according to direction of the instructor. Each milliliter of the stock solution should contain 5 mg of iron.

26
MINERALS AND NUTRIENT DEFICIENCY IN PLANTS (continued)
PROCEDURE (continued): 4. Observe and record data for each of the treatment for a
period of 3 to 4 weeks. 5. Use the deficiency symptoms listed in Table 3 to determine
which nutrients are missing. Table 2. Milliliters of stock solution added to 1 liter of water
to prepare treatment solutions.
Treatment A B C D E F G H I J
Complete 10 10 4 2 0 0 0 0 2 2 -K 15 0 4 0 100 0 0 0 2 2 -P 15 0 4 0 0 40 0 0 2 2 -Ca 0 30 4 2 0 0 0 0 2 2 -N 0 0 1 0 100 40 400 0 2 2 -Mg 10 10 0 2 0 20 0 0 2 2 -S 10 10 0 2 0 0 0 1 2 2 -Fe 10 10 4 2 0 0 0 0 2 0
TABLE 3. Selected nutrients and their deficiency symptoms.
Nutrient Deficiency Symptoms
1. Calcium Deformation of the younger leaves,
disintegration of terminal growing areas. Symptoms appear immediately and there is little growth.
2. Iron Young leaves rapidly turn light green or
almost white, older leaves are green. Yellowing or chlorosis of the younger leaves is most obvious in the interveinal areas and appears in a very short time.
27
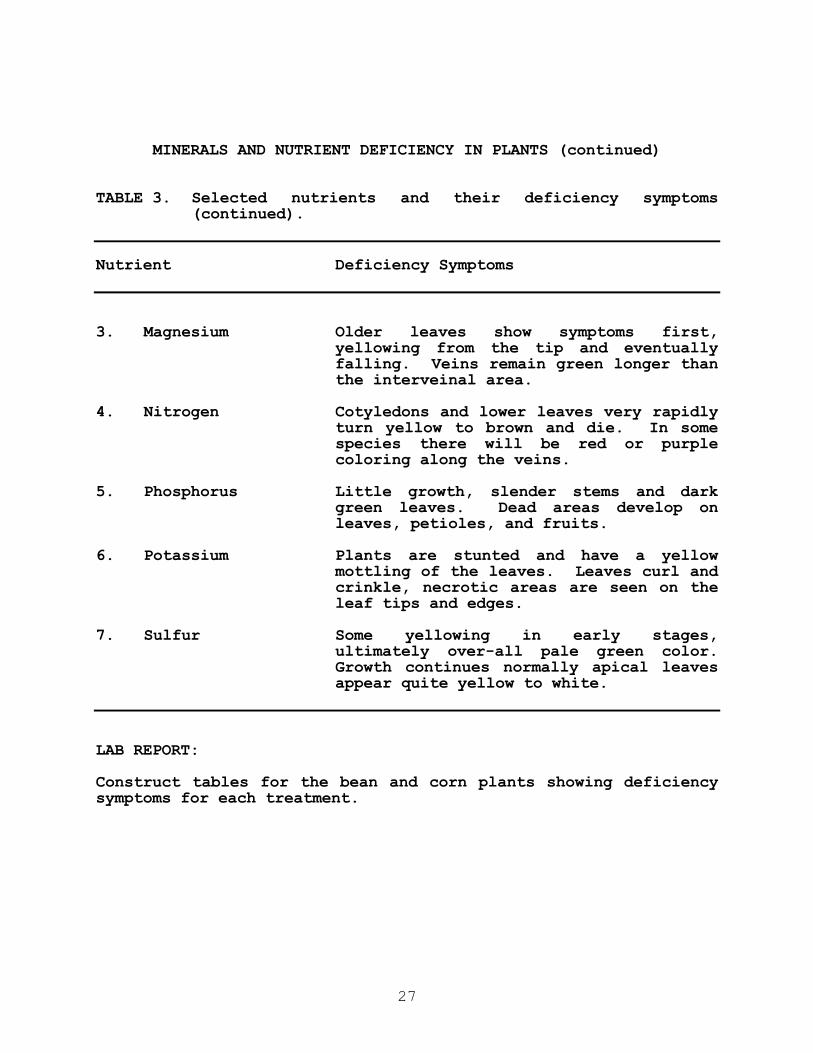
MINERALS AND NUTRIENT DEFICIENCY IN PLANTS (continued) TABLE 3. Selected nutrients and their deficiency symptoms
(continued).
Nutrient Deficiency Symptoms
3. Magnesium Older leaves show symptoms first,
yellowing from the tip and eventually falling. Veins remain green longer than the interveinal area.
4. Nitrogen Cotyledons and lower leaves very rapidly
turn yellow to brown and die. In some species there will be red or purple coloring along the veins.
5. Phosphorus Little growth, slender stems and dark
green leaves. Dead areas develop on leaves, petioles, and fruits.
6. Potassium Plants are stunted and have a yellow
mottling of the leaves. Leaves curl and crinkle, necrotic areas are seen on the leaf tips and edges.
7. Sulfur Some yellowing in early stages,
ultimately over-all pale green color. Growth continues normally apical leaves appear quite yellow to white.
LAB REPORT: Construct tables for the bean and corn plants showing deficiency symptoms for each treatment.

28
PLANT GROWTH REGULATORS OBJECTIVE: To understand the effects of growth hormones on
plant development. INTRODUCTION: The growth hormones to be studied in this lab are indoleacetic acid (IAA), an auxin; gibberellic acid (GA3), a gibberellin; and kinetin (Kinetin), a cytokinin. Auxins stimulate apical meristematic growth, gibberllins stimulate internode elongation, and cytokinins stimulate cell division. MATERIAL: Plant sprayer Ruler 50 mL of deionized water 50 mL of 0.10 mM indole acetic acid 50 mL of 0.10 mM gibberellic acid 50 mL of 0.10 mM kinetin 4 pots, each containing 3 14-day-old legume seedlings 4 pots, each containing 25 or more 14-day-old grass seedlings PROCEDURE: 1. Obtain 4 pots of legume seedlings and 4 pots of grass
seedlings and label each group of 4 pots as CONTROL, IAA, GA3, and Kinetin.
2. Measure and record the height of each plant, measuring from the top of the pot to shoot apex.
3. Spray the appropriate legume and grass plants with 20 mL (20 "squirts") of deionized water.
4. Spray the next appropriate legume and grass plants with 20 mL of IAA. Rinse the plant sprayer after use with 20 mL of deionized water.
5. Repeat step 4 for the GA3 and Kinetin treatments. 6. Place all plants randomly under a light source and in such a
way that no contact occurs between plants. 7. After one week, observe the differences between treatments,
taking special note of the differences in plant height. 8. If time permits, repeat step 7 after two weeks of growth. LAB REPORT: Construct a table for legumes and a table for grasses showing height, color, turgidity, and thickness of each plant at 0, 7, and 14 days after applying plant growth regulators.

29
TISSUE CULTURE OBJECTIVE: To learn the proper techniques for tissue culture. INTRODUCTION: Tissue culture provides a way for researchers to make many clones of one individual plant. The best tissue for sampling is meristematic. After the appropriate tissue has been placed aseptically onto a nutrient medium containing hormones, a callus will develop. This callus continues to grow in response to a high IAA : kinetin ratio in the nutrient medium. After several weeks, the callus can be transferred to a medium containing a high kinetin : IAA ratio to stimulate shoot development. MATERIALS: Sterile tissue culture environment 50 mL 95% ethanol Bunsen burner Forceps, razor, and parafilm 3 petri dishes with carrot callus initiation medium 3 petri dishes with carrot shoot development medium 3 fresh carrots PROCEDURE: 1. Obtain 3 fresh carrot samples and sterilize the outside of
each carrot with 95% ethanol. 2. Obtain 3 petri dishes with carrot callus initiation medium.
Do not open the petri dishes. 3. Label the three petri dishes on the back with your name,
date, and the name of the cultured organism. 4. Wash your hands with soap and water and sterilize your work
area with 95% ethanol. 5. Using forceps, dip a single edged razor into the ethanol, and
immediately ignite in Bunsen burner flame. Allow to cool. 6. Using the sterile razor, cut off the tip and the sides one
carrot, exposing the pith (the center). Allow only the razor to touch the pith.
7. Take 5 sub-samples of the carrot (about the size of a pin head) and carefully place them on the agar side of the petri dish with sterilized forceps.
8. Seal the dish lid with a thin piece of parafilm. 9. Repeat steps 5 through 8 for the other two carrot samples. 10. Store the cultures upside down to prevent contamination by
condensation. 11. Observe for callus formation over the next few weeks and
report your results to the instructor. 12. If callus forms, transfer a piece of the callus to carrot
shoot development medium. LAB REPORT:

30
Make observations of callus growth and/or contamination.
APPENDIX: DNA Isolation from an Onion
METHOD FOR DNA ISOLATION FROM A WHITE ONION
OBJECTIVE: To use a Quiagen DNeasy Kit to extract DNA from onion. Then use a
qualitative electrophoresis method to identify the presence of DNA as well as a
quantitative spectrophotometer method to determine the percent yield of DNA
obtained.
EQUIPMENT:
Microcentrifuge Water bath Vortex Dewar
Microcentrifuge tubes (green & orange) Collection Tubes (clear) Filter Columns
QIAshredder Mini Spin Column
Mortar and Pestle Micropipettes and tips Ice bath
Thermometer
REAGENT/CHEMICALS:
Buffer AP1 Buffer AE H2O
Buffer AP2 Buffer AW with Ethanol Onion
Buffer AP3 RNase A N2(l)
*Note: the following procedure was taken from DNeasy Plant Mini and Dneasy Plant Maxi Handbook (Quiagen Inc.) and modified to fit this lab manual. ***Latex gloves are recommended when dealing with DNA samples.
1. Grind 0.5 g of onion frozen with liquid nitrogen to a powder using a chilled mortar and pestle. Then transfer the sample to a 2 mL centrifuge tube (green).
2. Mix 400 μL of Buffer AP1 and 4 μL of RNase A, then vortex vigorously.
3. Incubate the mixture for 10 minutes at 65 °C (approx. 149 °F) and mix it 2-3 times during incubation by inverting tube.
4. Add 130 μL of Buffer AP2 to the lysate, mix and incubate for 5 minutes on ice.
5. Place your sample in the microcentrifuge (NOTE: be sure to balance it!!!) and spin down the plant material/chunks until they form as much of a pellet as possible.
6. Remove the liquid portion (the lysate) and apply the it to the QIAshredder Mini Spin Column (lilac) placed in a 2 mL collection tube and centrifuge for 2.5 minutes at 10000 rpm.
7. Transfer flow-through fraction from step 6 to a new microcentrifuge tube (pink). Some cellular material may have been transferred through and may have formed another smaller pellet in the collection tube, be sure not to disturb the cell-
debris pellet. 8. Add 750 μL of Buffer AP3/E to the cleared lysate and mix by
pipetting. 9. Apply 650 μL of the mixture from step 8, including a precipitate,
which may have formed, to the DNeasy Mini Spin Column sitting in a 2 mL collection tube. Centrifuge for 1 minute at 8000 rpm then discard the flow-through.
10. Repeat step 9 with the remaining sample. Discard flow-through and collection tube.
11. Place DNeasy Mini Spin Column in a new 2 mL collection tube, add 500 μL Buffer AW to the DNeasy Mini Spin Column and centrifuge for 1 minute at 8000 rpm. Discard flow-through and reuse the

31
collection tube in step 12.
APPENDIX: DNA Isolation from an Onion (continued) 12. Add 500 μL Buffer AW to the DNeasy Mini Spin Column and
centrifuge for 2.5 minutes at 10000 rpm to dry the membrane. 13. Transfer the DNeasy Mini Spin Column to a 2 mL microcentrifuge
tube (orange) with the lid removed, and pipette 100 μL of preheated (65°C) Buffer AE directly onto the DNeasy membrane. Incubate for 5 minutes at room temperature 15-25°C and then centrifuge for 1 minute at 8000 rpm to elute.
14. Repeat step 13 once.
QUALITATIVE AND QUANTITATIVE DNA ANALYSIS METHODS
ELECTROPHORESIS EQUIPMENT:
Weighing paper Spatula Hot plate P20 Micropipette and tips Microcentrifuge Tubes
100 mL graduated cylinder Analytical Balance Heat-Resistant Gloves Erlenmeyer Flask
Electrophoresis Chamber Power Supply Gel Mold and Dams Magnetic Stir Bar
REAGENT/CHEMICALS:
Agarose Gel Powder Loading Dye
1X TAE Buffer DNA Ladder
Ethidium Bromide Solution (10
mg/mL)*
*CAUTION: Ethidium Bromide is a strong mutagen.
1. Weigh 1.5 grams of agarose powder per 100 mL of 1X TAE Buffer for
a 1.5% Agarose gel. In this case we will make a 100 mL solution. 2. Measure 100 mL of 1X TAE buffer into a graduated cylinder and
pour it into a flask with a magnetic stir bar. 3. Heat the buffer and add the agarose powder slowly. Let it
continue to stir until the solution becomes clear. DO NOT LET IT BOIL.
4. Assemble the gel mold and carefully pour the solution into the center, allowing even distribution. Fill the gel mold half way up and set aside until it is firm, it will appear cloudy.
5. Place the gel into the electrophoresis chamber and cover completely with 1X TAE buffer.
6. In a new centrifuge tube (blue) place 15 μL DNA and 5 μL loading dye and centrifuge for 30 seconds at 5000 rpm.
7. In another tube (yellow) repeat step 6 with 15 μL DNA ladder and 5 μL loading dye.
8. Diagram what sample and how much will be placed in each lane of your gel, avoiding the use of the two outer lanes.
9. Pipette the 20 μL samples into the wells, be careful to not overfill them or blow air with the pipette.
10. Place the lid on the chamber and connect the wire from the side closest to the wells of the gel to the negative current and the other end to the positive. The DNA will migrate to the positive end.
11. On a setting of high, turn the electrophoresis chamber on and allow the loading dye, or dye front, to migrate approximately two-thirds of the way down the gel.
12. Carefully remove the gel and identify the DNA bands with the use of a UV light-box. BE SURE TO WEAR EYE-PROTECTION.

32
APPENDIX: DNA Isolation from an Onion (continued)
SPECTROPHOTOMETER
EQUIPMENT/REAGENTS:
Quartz cuvettes Tap water
Spectrophotometer Micropipette and tips
1. Locate Spectrophotometer and become acquainted with software; recall that a spectrophotometer compares a blank cuvette to a sample cuvette; thus evaluating one variable, i.e., the purity of collected DNA.
2. Run “DNA” with acquisitions of 220 nm – 330 nm and then run “DNA scan.” Print results. Blank: fill quartz cuvette with deionized water, and scan cuvette once in spectrophotometer. Sample: fill second quartz cuvette with DNA (50 μL) and deionized water (1000
μL), and scan cuvette. 3. Perform the calculations using acquired data.
CALCULATIONS
Measured Peaks Absorbance: A260 and A280 Note Absorbance Ratio: A260/A280 0.0 < 1.8 = Protein contamination 1.8 to 1.9 = DNA 1.9 to 2.0 = RNA contamination Calculations for the DNA Yield: (1) μg DNA per mL:
Use absorbance at A260 Dilution factor: final volume/volume of extract added Conversion factor: 50 μg/mL (Absorbance)(Dilution factor)(Conversion factor) = µg/mL DNA (2) μg DNA: (μg/mL DNA)(Total volume from steps 13 and 14 = 0.2 mL) = µg DNA (3) μg DNA per g tissue: (mass of original onion tissue, 0.5 g) (µg DNA/0.5 g) = μg DNA/g tissue

33


