83
James Nowotarski 6 November 2008 SE 325/425 Principles and Practices of Software Engineering Autumn 2008
| Date post: | 21-Dec-2015 |
| Category: |
Documents |
| View: | 215 times |
| Download: | 0 times |

James Nowotarski
6 November 2008
SE 325/425Principles and
Practices of Software Engineering
Autumn 2008
2
Topic Duration
Recap last class 30 minutes
Software process improvement 45 minutes
*** Break
Current events 15 minutes
Software metrics 60 minutes
Today’s Agenda

3
Categories of software risk
Project Technical Business Legal

4
“It is futile to try to eliminate risk”
-- Peter Drucker, management guru
Risk management

5
Risk management process
Identify Analyze Plan
Cost of protection Cost of exposure
$$ $$
Control

6
Risk management process: artifacts
Identify Analyze Plan Control
• List of risks • Probability• Impact• Cutoff• Risk exposure
• Mitigation plan• Monitoring plan• Contingency plan

7
“Worrying about what might go wrong may not be as glamorous a job as speculating about the future, but it is a more essential job right now.”
Carr, N. (2003, May). IT doesn’t matter. Harvard Business Review. Retrieved September 8, 2008 from EBSCO Host – Business Source Premier database.
Carr advised focusing on low-cost, low-risk

88
Software Engineering Body of Knowledge
Software requirementsSoftware designSoftware constructionSoftware testingSoftware maintenanceSoftware configuration managementSoftware engineering managementSoftware engineering processSoftware engineering tools and methodsSoftware quality
Source: Guide to the Software Engineering Body of Knowledge. (2004). IEEE. www.swebok.org
What is SE?
tonight

9
Tom West: A Good Man in a Storm

10
Layered behavioral model

High-Performance Teams

12
Characteristics of High-Performing Teams

Copyright Copyright © © 2006 The McGraw-Hill Companies. All rights reserved. 2006 The McGraw-Hill Companies. All rights reserved.
Splitting/MultitaskingSplitting/MultitaskingSplitting/MultitaskingSplitting/Multitasking
FIGURE 8.10FIGURE 8.11

Copyright Copyright © © 2006 The McGraw-Hill Companies. All rights reserved. 2006 The McGraw-Hill Companies. All rights reserved.
Splitting/MultitaskingSplitting/MultitaskingSplitting/MultitaskingSplitting/Multitasking
• Splitting/Multitasking
–A scheduling technique use to get a better project schedule and/or increase resource utilization.
•Involves interrupting work on an activity to employ the resource on another activity, then returning the resource to finish the interrupted work.
•Is feasible when startup and shutdown costs are low.
•Is considered the major reason why projects fail to meet schedule.

15
If you do only one thing to improve . . . If you only do one thing to improve,
decrease the amount of task switching Fragmentation due mostly to managerial
sloppiness Doesn’t have to occur, won’t if you take
pains to stop it You’ll thus reduce frustration and waste
and make it possible for your teams to take off
-- Tom Demarco, Project Management guru, 1995
Copyright Copyright © © 2006 The McGraw-Hill Companies. All rights reserved. 2006 The McGraw-Hill Companies. All rights reserved.
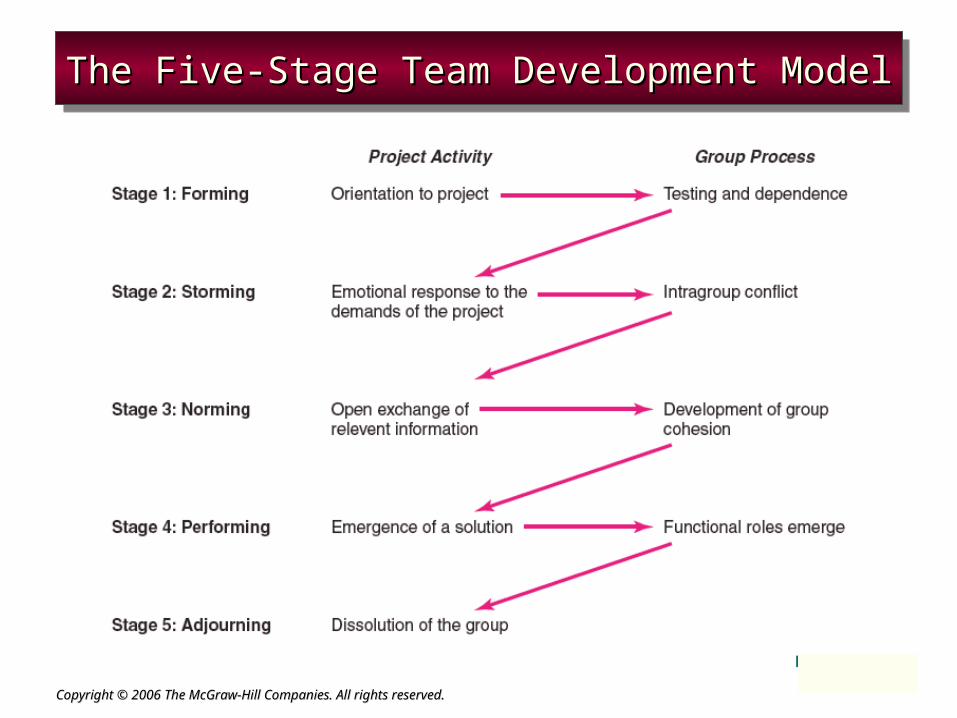
The Five-Stage Team Development ModelThe Five-Stage Team Development ModelThe Five-Stage Team Development ModelThe Five-Stage Team Development Model
FIGURE 11.1

Copyright Copyright © © 2006 The McGraw-Hill Companies. All rights reserved. 2006 The McGraw-Hill Companies. All rights reserved.
The Punctuated Equilibrium Model The Punctuated Equilibrium Model of Group Developmentof Group Development
The Punctuated Equilibrium Model The Punctuated Equilibrium Model of Group Developmentof Group Development
FIGURE 11.2

18
Topic Duration
Recap last class 30 minutes
Software process improvement 45 minutes
*** Break
Current events 15 minutes
Software metrics 60 minutes
Today’s Agenda

19
Where to find software process improvement ideas

20
Software process assessment and improvement
Software Process
Software Process Assessment
is examined by identifies capabilitiesand risk of
identifiesmodifications to
Software Process Improvement
Capability Determination
leads to leads to
motivates

21
Software Process Improvement Models
ISO 15504 ISO 9000-3 TickIT Capability Maturity Model Integration (CMMI)
IT specific models
A number of models enable software development organizations to compare their practices to a set of “best practices”
Total Quality Management (TQM) Six Sigma
General models
22
Capability Maturity Model Integration (CMMI)
“the de facto process improvement framework for software developers”
- Gartner Group

23
What is CMMI
CMMI = Capability Maturity Model Integration Developed in1991 by Software Engineering
Institute (SEI) to assess the software engineering capability of government contractors
A framework for software process improvement (SPI) that has gained wide acceptance in the industry
A roadmap of effective practices that build on one another in a logical progression coherent ordered set of incremental improvements

24
What is SEI
SEI = Software Engineering Institute Federally funded research & development
center Sponsored by Department of Defense Affiliated with Carnegie Mellon University in
Pittsburgh Established in 1984 Research and publications oriented Mission is to improve the state of the
practice of software engineering

25
Brief History - CMMI
1989 - Publication of Managing the Software Process by Watts Humphrey
1991 - Capability Maturity Model for Software (CMM) v1.0 released by Software Engineering Institute (SEI)
1993 - CMM v1.1 released1994 - Systems engineering (SE) CMM
released2001 - CMM Integration (CMMI)-SE/SW
v1.0 released2002 - CMMI-SE/SW/IPPD/SS v1.1
released2006 - CMMI-Dev v1.2 released (August)

26
A proliferation of models Different capability maturity models
Software CMM (SW)Systems Engineering CMM (SE)Integrated Product and Process Development
CMM (IPPD)Supplier Sourcing (SS)Software Acquisition (ACQ)Services (SVC)Team Software ProcessPersonal Software ProcessPeople CMM (P-CMM)

27
Why CMMI?
Practical Structured Proven reputation Quantitative benefits (median):
cost 34%productivity: 61%time to market: 50%post-release defects: 48%customer satisfaction: 14%return on investment: 4:1
Benefits

28
CMMI Maturity Levels
Managed(2)
Managed(2)
Defined(3)
Defined(3)
QuantitativelyManaged
(4)
QuantitativelyManaged
(4)
Optimized(5)
Optimized(5)
Initial(1)
Initial(1) Process poorly controlled and unpredictable
Process characterized for projects and is often reactive
Process characterized for the organization and is proactive
Process measured and controlled
Process improvement (“nirvana”)

29
Process areas (PAs)
Maturity levels
Process areas
Contain
30
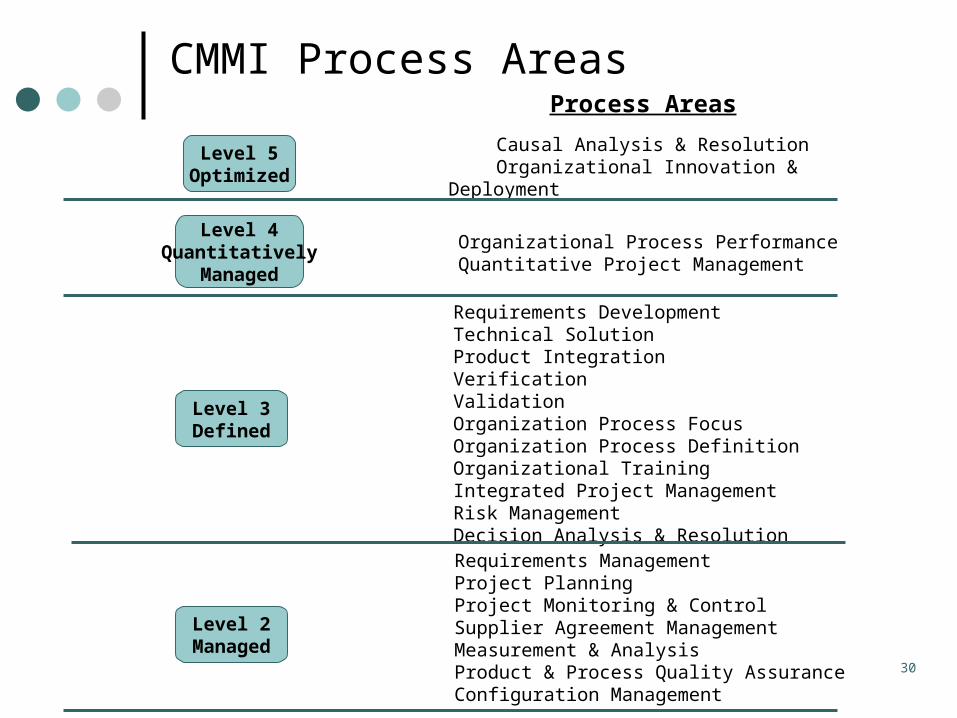
CMMI Process Areas
Level 3Defined
Requirements DevelopmentTechnical SolutionProduct IntegrationVerification ValidationOrganization Process Focus
Organization Process Definition Organizational Training Integrated Project Management
Risk Management Decision Analysis & Resolution
Level 2Managed
Requirements Management Project Planning Project Monitoring & Control Supplier Agreement Management
Measurement & Analysis Product & Process Quality Assurance Configuration Management
Level 5Optimized
Causal Analysis & Resolution Organizational Innovation & Deployment
Level 4Quantitatively
Managed
Organizational Process Performance Quantitative Project Management
Process Areas

31
Process areas (PAs)
Maturity levels
Process areas
Contain
Specific practices
Contain
Specific goals
Achieve
Process area categories
Contain
32
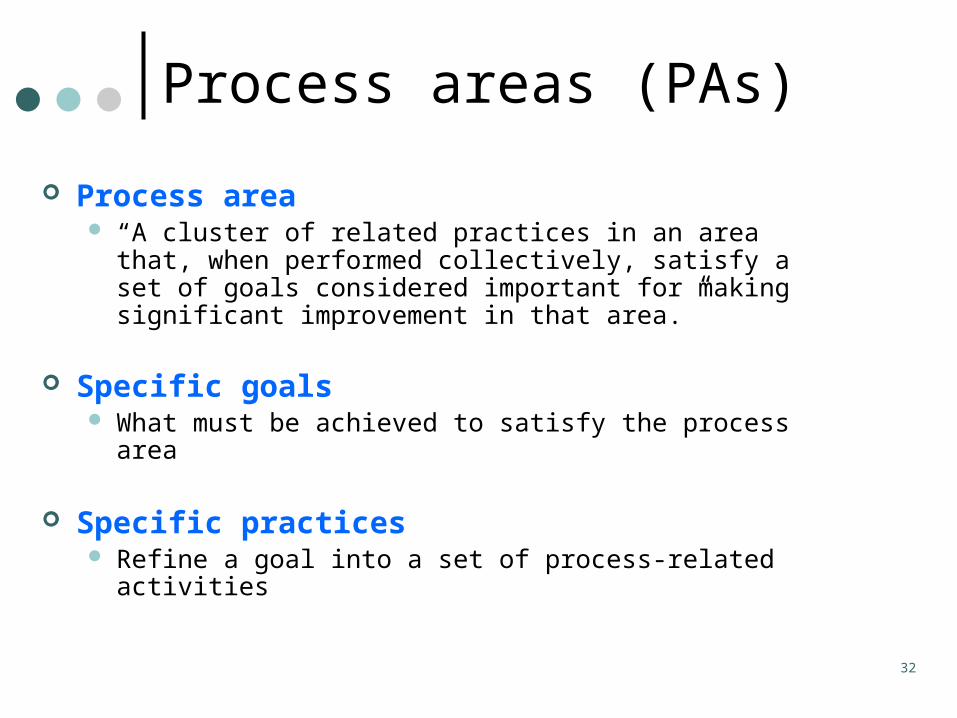
Process areas (PAs)
Process area “A cluster of related practices in an area that, when
performed collectively, satisfy a set of goals considered important for making significant improvement in that area.”
Specific goals What must be achieved to satisfy the process area
Specific practices Refine a goal into a set of process-related activities

33
Process areas (PAs)
Level 2 - Managed
Project planning
Process area
Determine estimates of effort and cost
Specific practice
Establish estimates
Specific goal
Maturity level
Project management
Process area category

34
Level 1: Initial
Instability Dependence on “heroes” Inability to meet targets Key process areas:
none

35
Class Activity
Summarize and explain to the rest of the class: The 22 key process areas
36
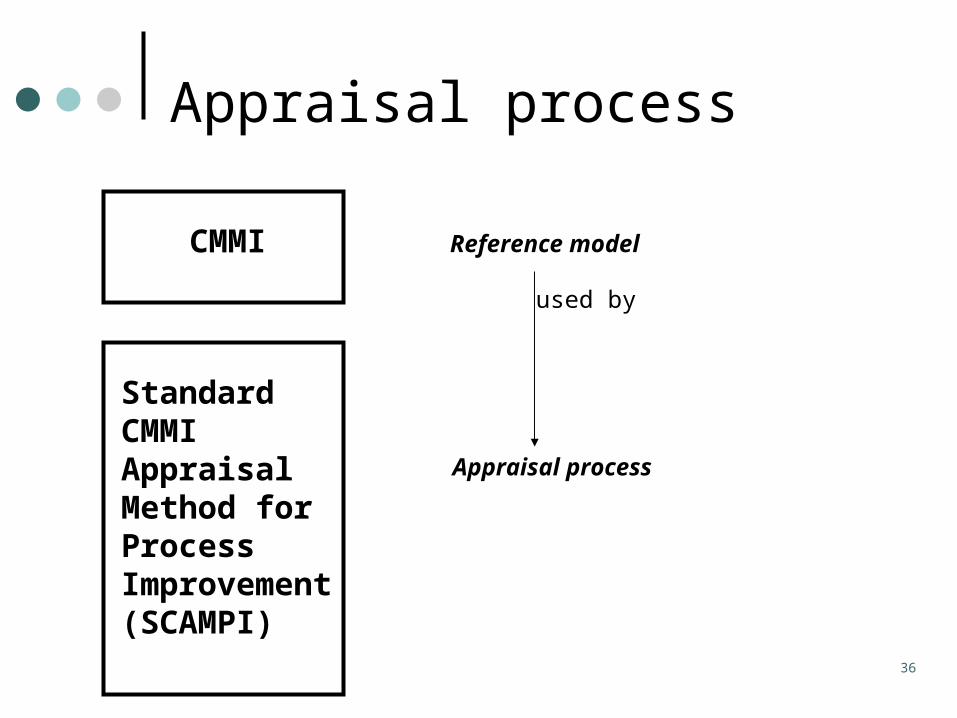
Appraisal process
CMMI Reference model
Standard CMMI Appraisal Method for Process Improvement (SCAMPI)
Appraisal process
used by

37
CMMI Appraisal Method
TeamSelection
1
MaturityQuestionnaire
2
ResponseAnalysis
3
On-site visit
Interviews &documentreviews
4
Findingsbased on the CMMI
5
PAProfile
6

38
Appraisal Process For internal purposes:
Performed in open, collaborative environment Focuses on improving the organization’s
software process For external credential:
Performed in a more audit-oriented environment
Focuses on identifying risks associated with a contractor
Team’s recommendation will help select contractors or set fees

39
CMMI Issues in the Real-World
“Level envy” Areas not addressed:
Business strategy and linkage to ITOperations, help desk, supportManagement of the IT human resourceApplication portfolioTools
Many question whether it is worth the effort to pursue levels 4 and 5

40
Process Maturity Profile
10%
20%
30%
40%
50%
60%
70%
80%
90%
100%
0%
Initial
19.3%
Repeatable
43.2%
Defined
23.4%
Managed
7.3%
Optimized
6.8%
% o
f O
rga
niz
ati
on
s
1998 thru August 2002
Based on assessments from 1998-2002 of 1124 organizations
41
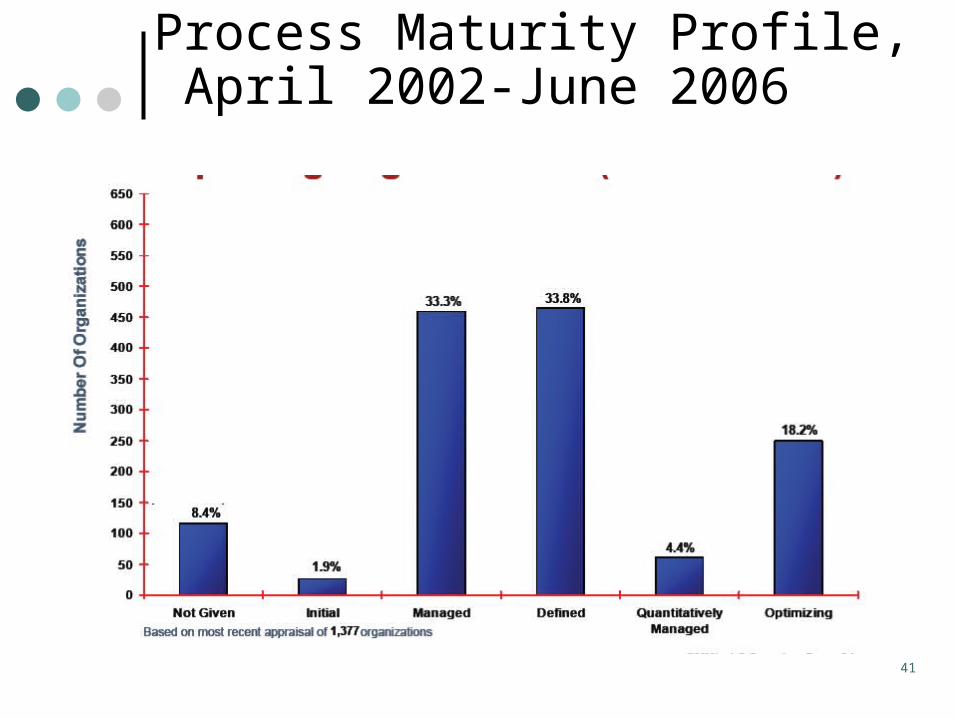
Process Maturity Profile, April 2002-June 2006

42
Time to Move Up
# of monthsto move tonext level
0
75
50
25
1 to 2
23 22
2 to 3
28
3 to 4
17
4 to 5
Largest observed value thatis not an outlier
75th percentile
Median (50th percentile)25th percentileSmallest observed value thatis not an outlier
Recommended time between appraisals (18-30 mos)

43
CMMI Market Pressure
Marketing tool to win clients, who are based predominantly in US and Europe Clients using Indian service providers should have certain key processes in place:
service level agreements identifying business requirements scoping requirements managing changes
Many, if not most, of the publicly-acknowledged Level 5 CMM-certified organizations are in India

44
CMMI-based Software Process Improvement (SPI)
Time and cost often exceed expectations 18-24 months to advance 1 level Can cost $2K per software engineer per year 1-2% full-time resources (e.g., 5-10 in a 500-person organization) 2-4% of rest of organization’s time
Key success factors Senior management is engaged Participation and buy-in at all levels, including middle
management and technical staff Clearly stated, well understood SPI goals Clear assignment of responsibility Software Engineering Process Group (SEPG) staffed by highly
respected people

45
For more information
http://www.sei.cmu.edu/cmmi/cmmi.html
46
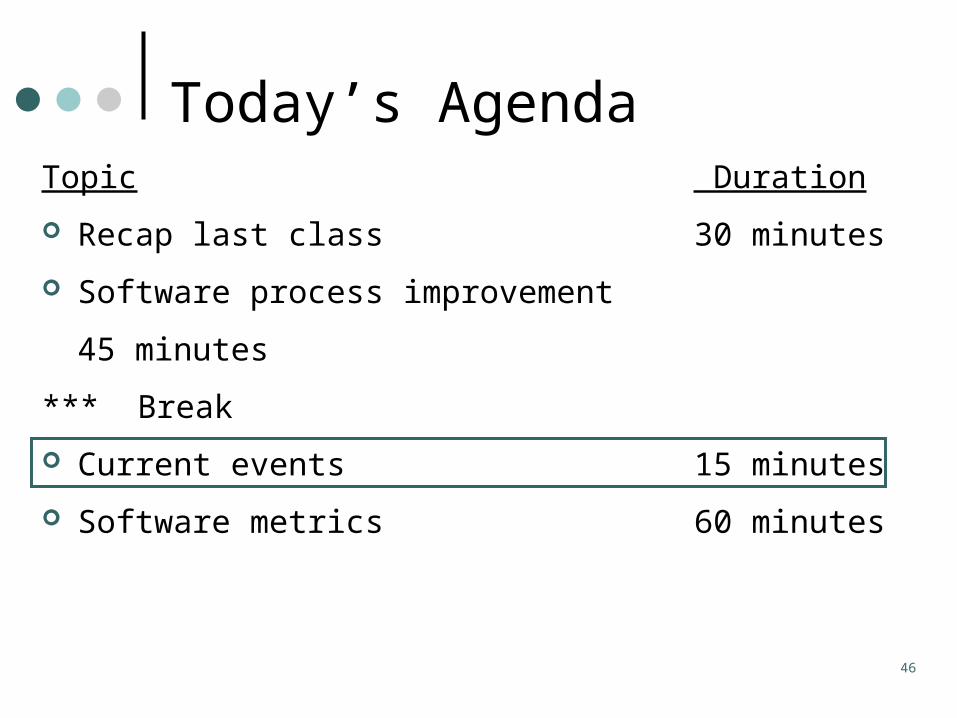
Topic Duration
Recap last class 30 minutes
Software process improvement 45 minutes
*** Break
Current events 15 minutes
Software metrics 60 minutes
Today’s Agenda

47
Why Measure?
“You can’t control what you can’t measure” (Tom Demarco)
“Show me how you will measure me, and I will show you how I will perform” (Eli Goldratt)
“Anything that can’t be measured doesn’t exist” (Locke, Berkeley, Hume)
48
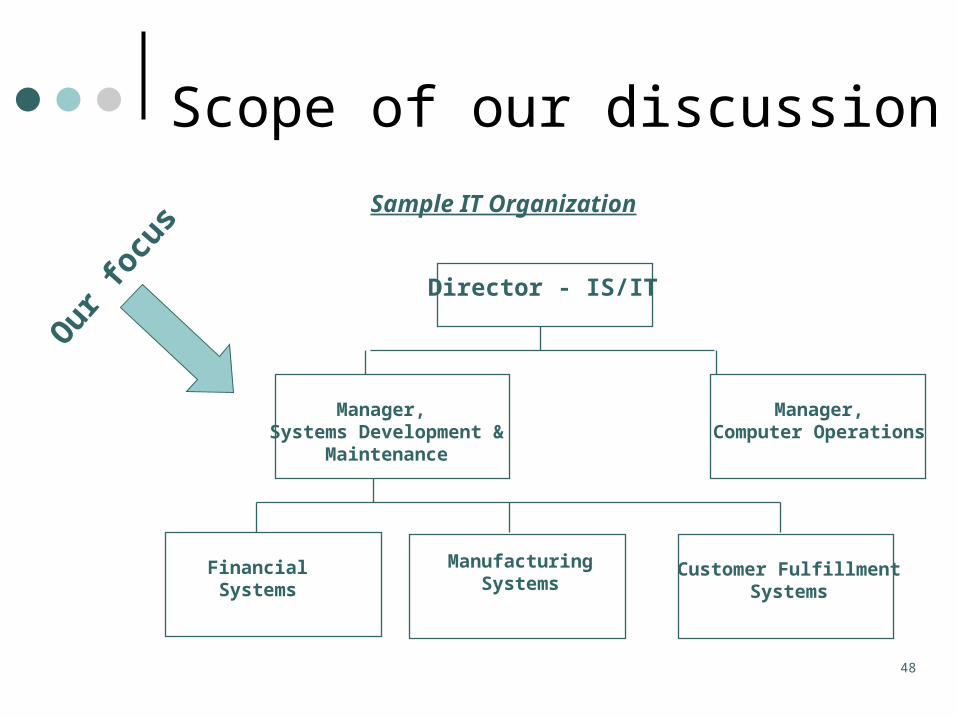
Scope of our discussion
Director - IS/IT
Manager, Systems Development &
Maintenance
Manager,Computer Operations
FinancialSystems
ManufacturingSystems
Customer FulfillmentSystems
Our
focu
s
Sample IT Organization

49
Examples of systems development metrics
Category Metric Units of measureSpeed of delivery
Delivery rate
Elapsed months/Function point
Schedule reliability
Duration variance %
Schedule variance %
Software quality
Fault density
Faults/Function point
Productivity Productivity rate
Functions points/Staff month

50
Example: Speed of delivery
0
10
20
30
40
50
60
70
0 2000 4000 6000 8000 10000 12000
Developed Function Points
Ela
pse
d M
onth
s
= Is a single project release (Average elapsed months =14.8, n=33).
Industry Average line is determined from Software Productivity Research

51
Example: Schedule reliability
0%
10%
20%
30%
40%
50%
60%
2000 4000 6000 8000 10000 12000
Developed Function Points
Sch
edu
le V
aria
nce
abo
ve c
omm
itmen
t
= Is a single project release (n=33).
Industry Average line is determined from Software Productivity Research

52
Example: Software quality
0
1000
2000
3000
4000
5000
6000
7000
0 2000 4000 6000 8000 10000 12000
Developed Function Points
Fau
lts (
3 m
onth
s)
Faults reported over the first three months in operations (n=27) An estimated industry average for faults found in the first three months of operations. The assumption is that half the total faults are found in the first three months in operation. This average is one half of the industry average of the total faults from C. Jones, Applied Software Measurement, 1996, p.232.

53
Example: Productivity
0
2
4
6
8
10
12
0 2000 4000 6000 8000 10000 12000
Developed Function Points
Fun
ctio
n P
oint
s pe
r S
taff
Mon
th
Is a single project release (n=33) Industry Average line is determined from SoftwareProductivity Research.
54
Objectives of Software Measurement

55
Objectives of Software Measurement Help a systems development unit understand their
performance
Evaluate performance relative to goals
Allow for comparisons to, e.g.,: Other organizations Alternative development approaches (custom,
packaged, outsourced, etc.) and technologies Other standards/targets
Improve estimating ability
Promote desired behaviors, e.g., reuse

56
Hawthorne Effect
Famous study conducted in the Hawthorne plant of General Electric Corporation
Plant managers implemented changes in working conditions and recorded data on the plant’s production output
They found that production increased no matter what changes in working conditions they implemented!
What does this example reveal about how people act when they know that an experiment is being conducted?
57
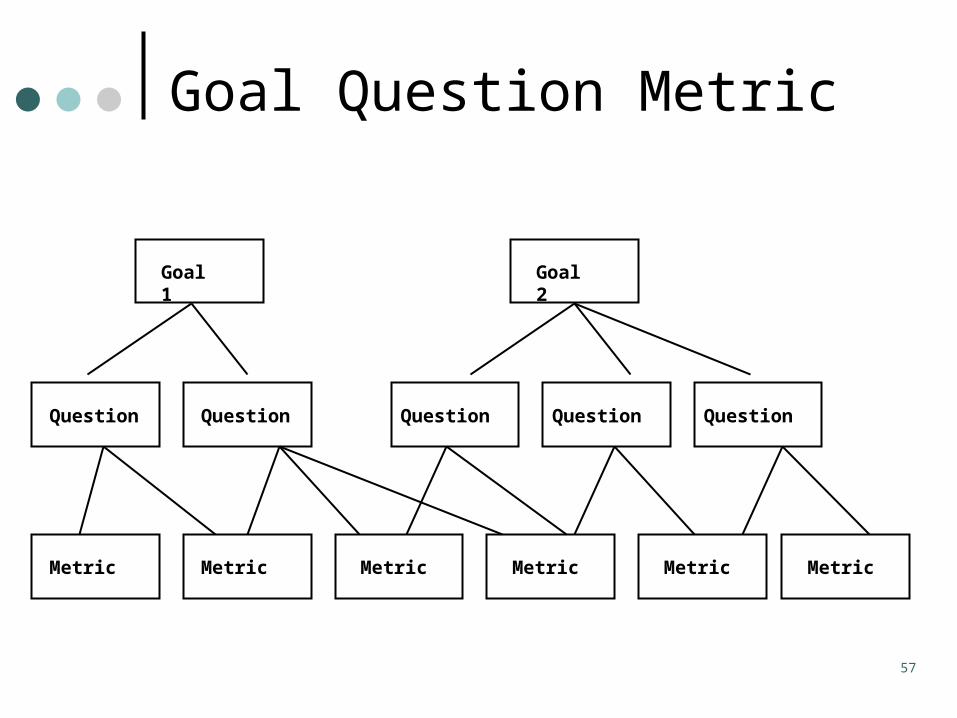
Goal Question Metric
Goal 1 Goal 2
Question QuestionQuestion Question Question
Metric MetricMetric Metric Metric Metric

58
Goal Question Metric
Technique for identifying suitable measurements to collect Assumption: It is only worthwhile measuring
things to satisfy goals Goals are desired end states Questions identify the information needs
associated with goals, help determine whether or not goals are being met
Metrics are specific items that can be measured to answer the questions

59
GQM Example
Improve timeliness of change request processing fromthe project manager’s viewpoint Goal
What is the current changerequest processing speed?
Is the performance of the processimproving?
Question
MetricAverage cycle time
Standarddeviation
Subjectiverating fromproject manager
(Current average/Baseline average)x 100
% cases outsideupper limit

60
Case Study Exercise
1. Get team assignment (5 teams)
2. Read the case study
3. Fill in the worksheet Identify 1 goal Identify 2-3 questions pertinent to this goal. Identify at least 1 metric (indicator) per
question Brief the class

61
Readings Current event reports (overflow)
For November 13

Extra Slides

63
Characteristics of High-Performing Teams Shared purpose and goals Clear roles and organization Well-defined processes High team development and capability Open communication Civilized disagreement Atmosphere of creativity/innovation High performance standards Accountability and rewards
64
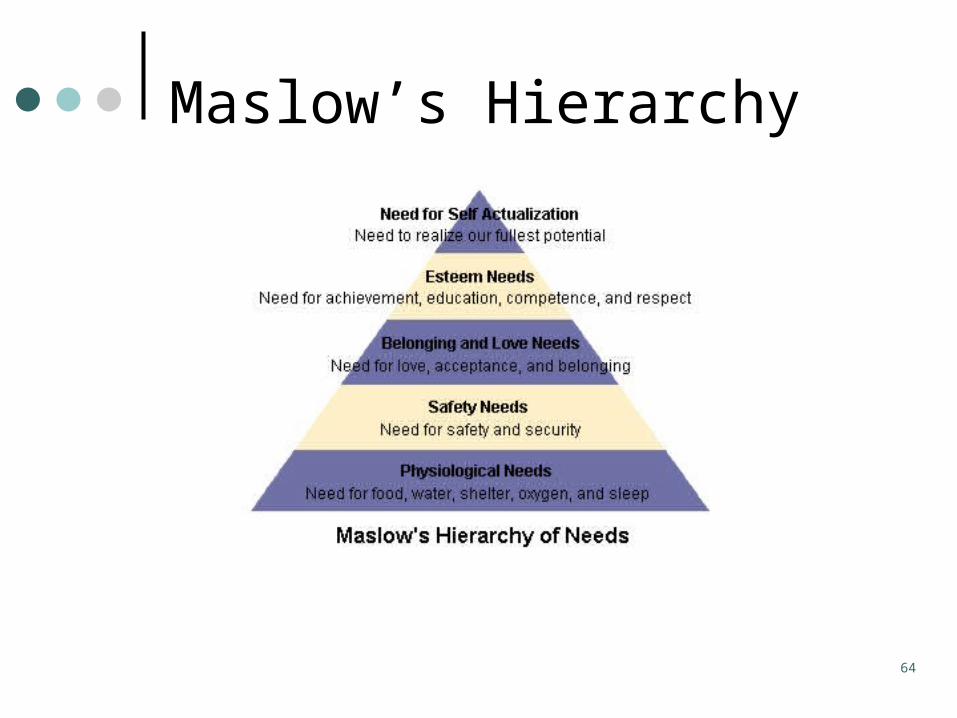
Maslow’s Hierarchy

65
Expectancy TheoryM = V * E * I
V
I
E

Managing Diversity

67
Functional Cultural Generational Gender Organizational
Managing Diversity

Global delivery
Planning; high level
tasksExecution
Common processestechnology and tools

Copyright Copyright © © 2006 The McGraw-Hill Companies. All rights reserved. 2006 The McGraw-Hill Companies. All rights reserved.
Hofstede Cultural Dimensions FrameworkHofstede Cultural Dimensions FrameworkHofstede Cultural Dimensions FrameworkHofstede Cultural Dimensions Framework
• Individualism versus collectivism– Identifies whether a culture holds individuals or the group
responsible for each member’s welfare.
• Power distance– Describes degree to which a culture accepts status and power
differences among its members.
• Uncertainty avoidance– Identifies a culture’s willingness to accept uncertainty and
ambiguity about the future.
• Masculinity-femininity– Describes the degree to which the culture emphasizes
competitive and achievement-oriented behavior or displays concerns for relationships.

Copyright Copyright © © 2006 The McGraw-Hill Companies. All rights reserved. 2006 The McGraw-Hill Companies. All rights reserved.
Sample Country Clusters on Hofstede’s Dimensions Sample Country Clusters on Hofstede’s Dimensions of Individualism-Collectivism and Power Distanceof Individualism-Collectivism and Power Distance
Sample Country Clusters on Hofstede’s Dimensions Sample Country Clusters on Hofstede’s Dimensions of Individualism-Collectivism and Power Distanceof Individualism-Collectivism and Power Distance
FIGURE 15.5

71
Why do some virtual teams thrive while others stumble?
1. Tools for social networking and collaboration
2. Include some people who already know each other
3. “Boundary spanners” Grow them Staff them (~15% of team)
4. Encourage frequent communication, but don’t force social events
Differentiators

72
Why do some virtual teams thrive while others stumble?
5. Assign tasks to team members in different locations that allow them to move ahead at their own pace
6. Work that is interesting, compelling, meaningful
One of biggest reasons virtual teams fail
7. Solicit volunteers as much as possible
Differentiators (cont.)

73
Sources of improvement ideas
Post-mortems Metrics Benchmarking with other organizations Published best practices Standards Process frameworks
also known as “meta-models” or “software process improvement models”

74
GQM Example (High Level)
Improve systems delivery performanceGoal
What is the qualityof our deliverables? How predictable is
our process?How quickly do we deliver?
How efficient are we?
Question
MetricFault density Delivery rate Productivity rate Duration variance
percentage

75
Measurement and Continuous Improvement
Continuous Improvement Measurement
76
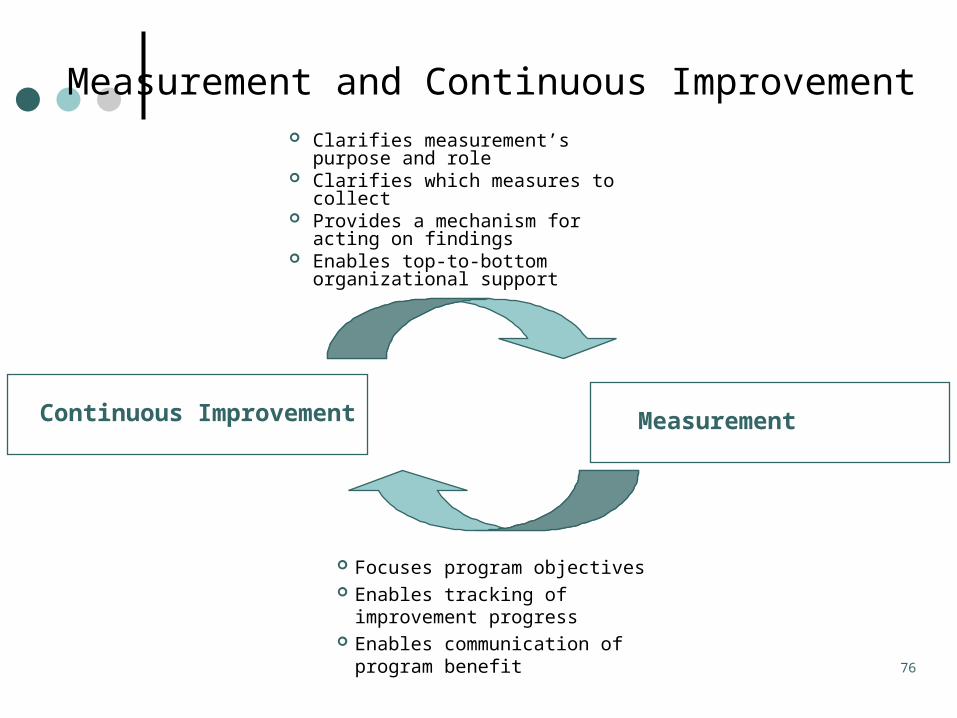
Measurement and Continuous Improvement
Continuous Improvement Measurement
Focuses program objectives Enables tracking of improvement
progress Enables communication of program
benefit
Clarifies measurement’s purpose and role
Clarifies which measures to collect Provides a mechanism for acting on
findings Enables top-to-bottom organizational
support

77
Continuous Process Improvement
Approach to Quality and Measurement
Plan
Do
Check
Act
1. Identify performance standards and goals
2. Measure project performance
3. Compare metrics against goals
4. Eliminate causes of deficient performance- fix defects- fix root causes
78
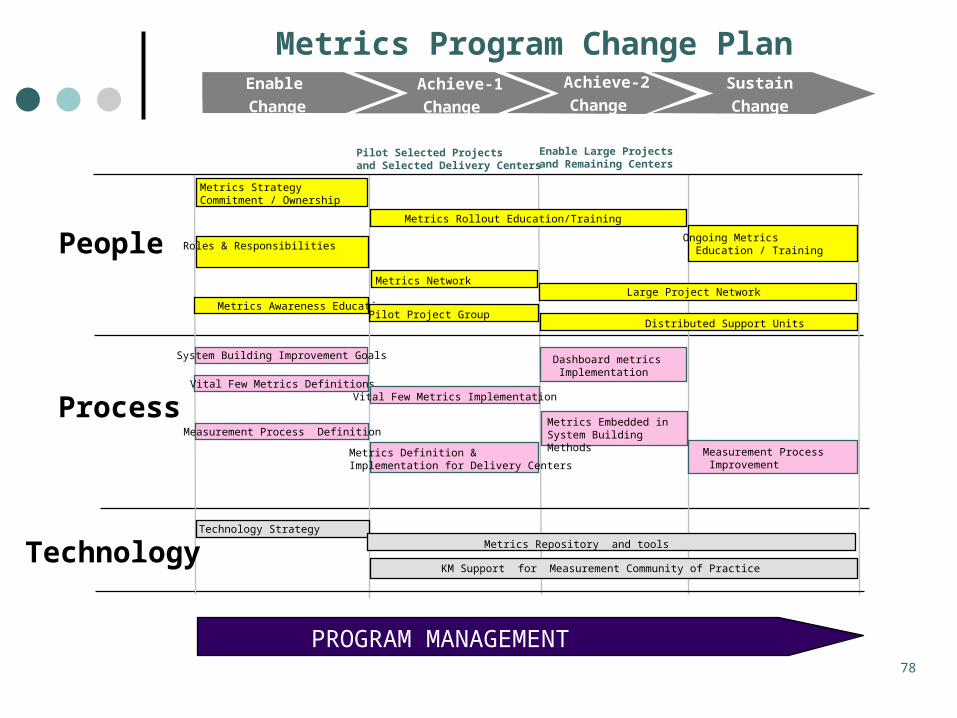
Metrics Program Change Plan
QUALITY MANAGEMENT
Enable
Change
Technology
Process
People
Metrics Awareness Education
Metrics Network
Vital Few Metrics Definitions Vital Few Metrics Implementation
Technology Strategy
KM Support for Measurement Community of Practice
Measurement Process Improvement
Large Project Network
Metrics Strategy Commitment / Ownership
Distributed Support Units
Metrics Repository and tools
Measurement Process Definition
Roles & Responsibilities
PROGRAM MANAGEMENT
Achieve-1
Change
Sustain
Change
Achieve-2
Change
Metrics Rollout Education/Training
Pilot Project Group
Ongoing Metrics Education / Training
System Building Improvement Goals
Metrics Definition & Implementation for Delivery Centers
Metrics Embedded in System Building Methods
Dashboard metrics Implementation
Pilot Selected Projectsand Selected Delivery Centers
Enable Large Projectsand Remaining Centers

79
Measurement Program Mortality
Most programs fail, usually within 2 years
Number of companies
400
350
300
250
200
150
100
50
0
1980 1981 1982 1983 1984 1985 1986 1987 1988 1989 1990 1991
Year
Cumulative startsCumulative successes
80
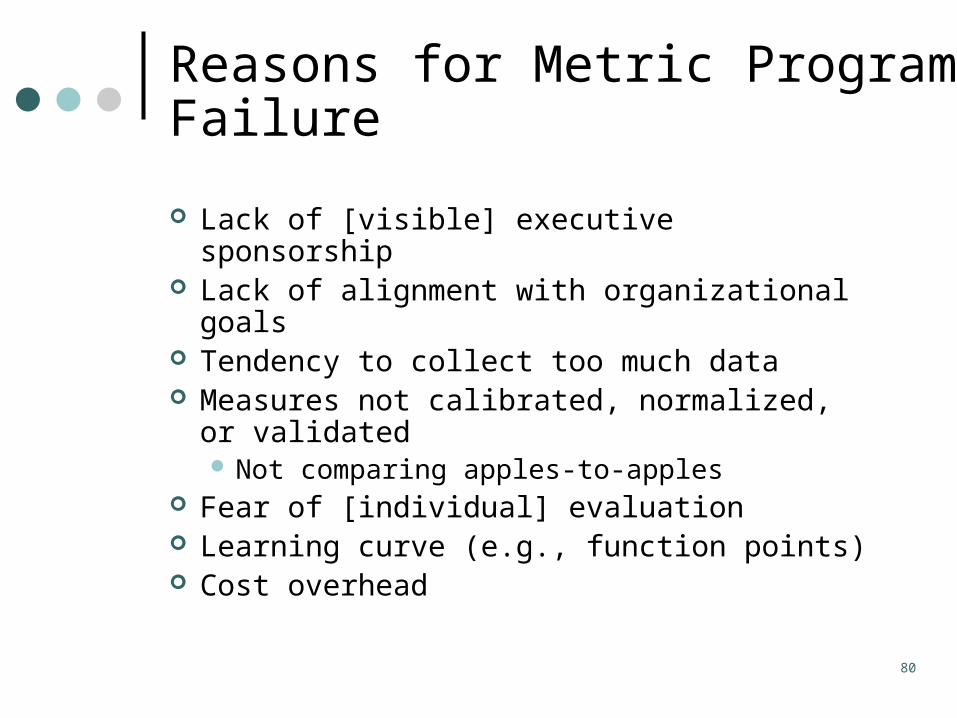
Reasons for Metric Program Failure
Lack of [visible] executive sponsorship Lack of alignment with organizational goals Tendency to collect too much data Measures not calibrated, normalized, or
validated Not comparing apples-to-apples
Fear of [individual] evaluation Learning curve (e.g., function points) Cost overhead
81
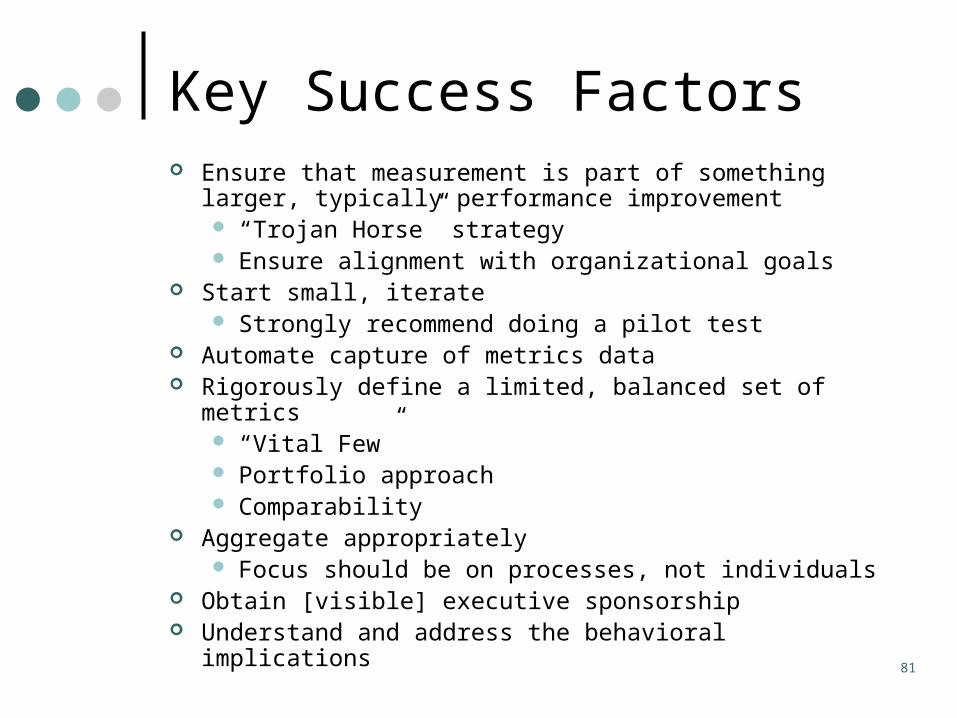
Key Success Factors Ensure that measurement is part of something larger,
typically performance improvement “Trojan Horse” strategy Ensure alignment with organizational goals
Start small, iterate Strongly recommend doing a pilot test
Automate capture of metrics data Rigorously define a limited, balanced set of metrics
“Vital Few” Portfolio approach Comparability
Aggregate appropriately Focus should be on processes, not individuals
Obtain [visible] executive sponsorship Understand and address the behavioral implications

82
Other Quotes
“Count what is countable, measure what is measurable, and what is not measurable,
make measurable”
Galileo

83
Other Quotes
“In God we trust – All others must bring data”
W. Edwards Deming


