83
Functional Respiratory Imaging (FRI) to assess the bio- equivalence of inhaled medication Jan De Backer, MSc, PhD, MBA CEO BABE 2014

Functional Respiratory Imaging
(FRI) to assess the bio-
equivalence of inhaled medication
Jan De Backer, MSc, PhD, MBA
CEO
BABE 2014
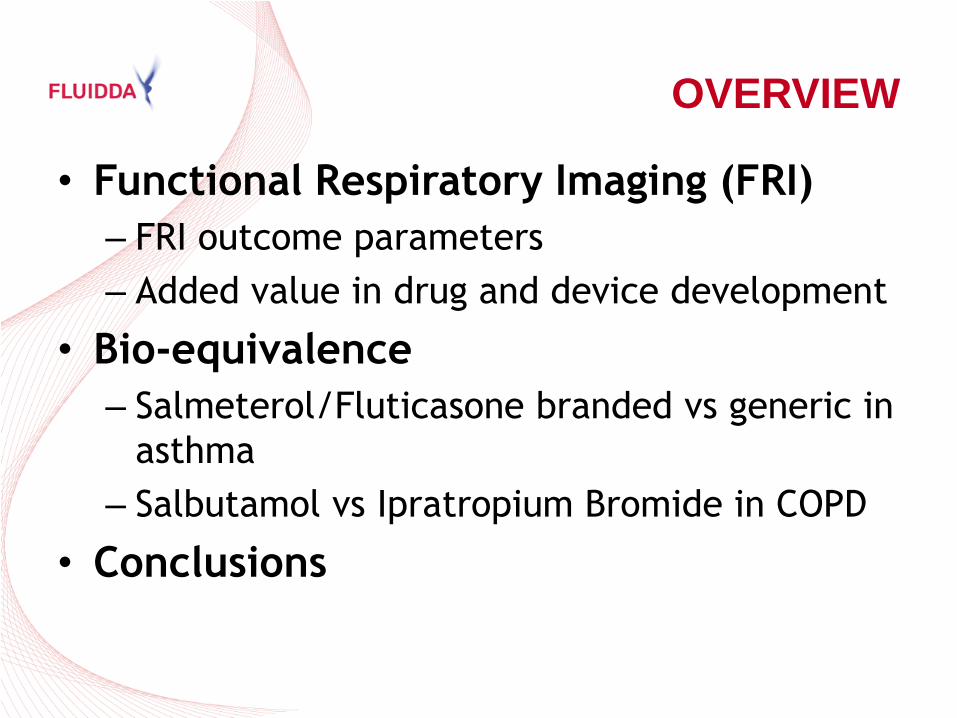
• Functional Respiratory Imaging (FRI)
– FRI outcome parameters
– Added value in drug and device development
• Bio-equivalence
– Salmeterol/Fluticasone branded vs generic in
asthma
– Salbutamol vs Ipratropium Bromide in COPD
• Conclusions
OVERVIEW
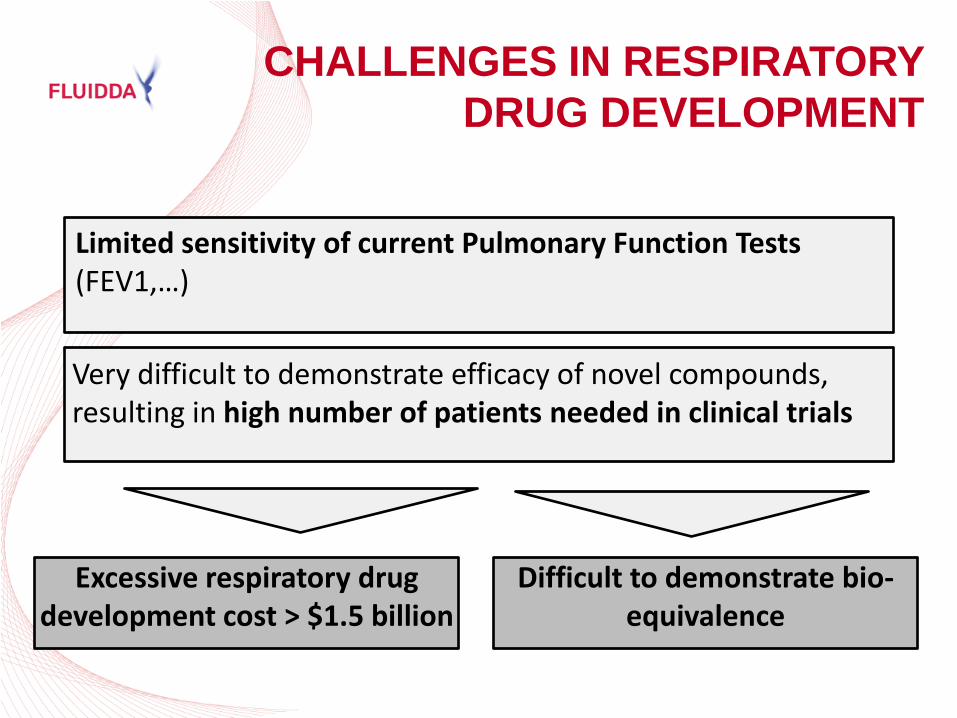
CHALLENGES IN RESPIRATORY
DRUG DEVELOPMENT
Limited sensitivity of current Pulmonary Function Tests (FEV1,…)
Very difficult to demonstrate efficacy of novel compounds, resulting in high number of patients needed in clinical trials
Excessive respiratory drug development cost > $1.5 billion
Difficult to demonstrate bio-equivalence

AIM
• Explain Functional Respiratory Imaging
(FRI)
• Demonstrate enhanced sensitivity wrt PFT
• Reduction in # patients required for
clinical trials to understand mode of action
• Use clinical trials as a design tool in phase
I and II
• To assess bioequivalence
• To de-risk phase III

• FRI is an imaging biomarkers for respiratory diseases
– What are imaging biomarkers?
According to Wikipedia:
“A biomarker, or biological marker, generally refers to a
measured characteristic which may be used as an
indicator of some biological state or condition.”
IMAGING BIOMARKERS

IMAGING BIOMARKERS
Event Biomarker Intervention

IMAGING BIOMARKERS
Event Biomarker Intervention

IMAGING BIOMARKERS
Event Biomarker Intervention
FUNCTIONAL RESPIRATORY IMAGING

scan
segment
simulate flow
FUNCTIONAL RESPIRATORY
IMAGING (FRI)

FUNCTIONAL RESPIRATORY
IMAGING (FRI)
• High-resolution CT images are converted
into patient-specific 3D computer models

FUNCTIONAL RESPIRATORY
IMAGING (FRI)
• Computational Fluid Dynamics
• Solving Navier-Stokes equations
numerically
• Computational grid
• Boundary conditions


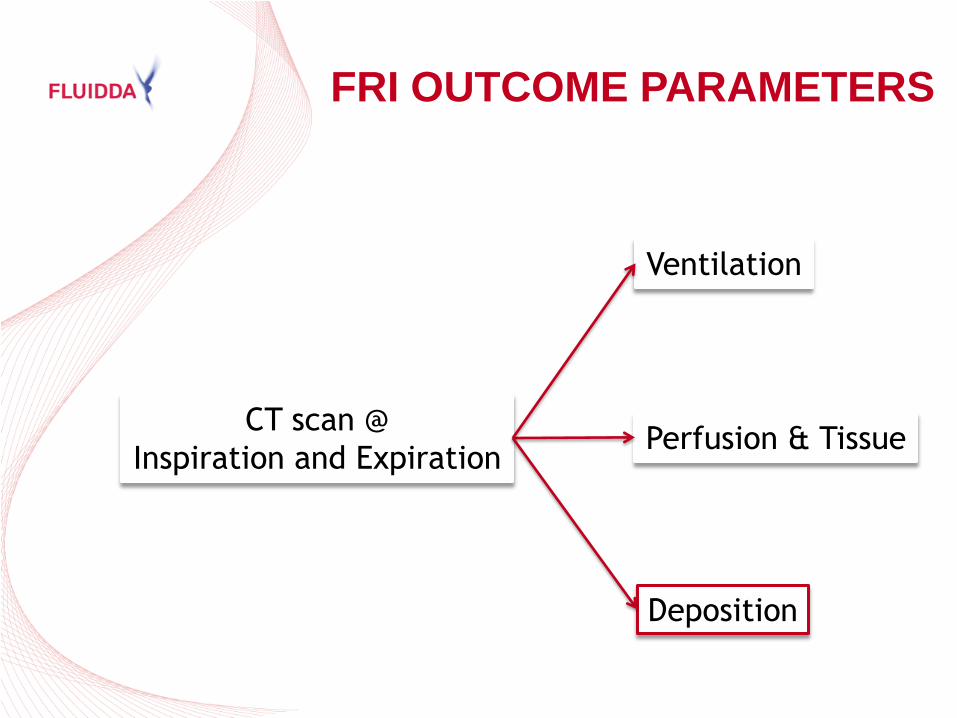
CT scan @
Inspiration and Expiration
Ventilation
Perfusion & Tissue
Deposition
FRI OUTCOME PARAMETERS

CT scan @
Inspiration and Expiration
Ventilation
Perfusion & Tissue
Deposition
FRI OUTCOME PARAMETERS

Patents EU 09161455.2 US 61/182.493 US 7.540.843 PCT/EP2005/010730
FRI: VENTILATION
Lobar Volumes Lobe volumes could be expressed as %p to assess hyper- or
hypo inflation

Fraction of volume with HU <-850 on
FRC scan
FRI: VENTILATION
Air Trapping

Patents EU 09161455.2 US 61/182.493 US 7.540.843 PCT/EP2005/010730
FRI: VENTILATION
Airway Volumes

FRI: VENTILATION
Airway Volumes
Patents EU 09161455.2 US 61/182.493 US 7.540.843 PCT/EP2005/010730

FRI: VENTILATION
Airway Resistance
Patents EU 09161455.2 US 61/182.493 US 7.540.843 PCT/EP2005/010730

FRI: VENTILATION
Image-based airway volume (iVaw) change
Patents EU 09161455.2 US 61/182.493 US 7.540.843 PCT/EP2005/010730

Patents EU 09161455.2 US 61/182.493 US 7.540.843 PCT/EP2005/010730
FRI: VENTILATION
CFD-based airway resistance (iRaw) change

CT scan @
Inspiration and Expiration
Ventilation
Perfusion & Tissue
Deposition
FRI OUTCOME PARAMETERS

FRI: PERFUSION
Emphysema
Patents EU 09161455.2 US 61/182.493 US 7.540.843 PCT/EP2005/010730

FRI: PERFUSION
Emphysema
Patents EU 09161455.2 US 61/182.493 US 7.540.843 PCT/EP2005/010730

FRI: PERFUSION
Blood Vessels
Patents EU 09161455.2 US 61/182.493 US 7.540.843 PCT/EP2005/010730

FRI: PERFUSION
Blood Vessels
Patents EU 09161455.2 US 61/182.493 US 7.540.843 PCT/EP2005/010730

FRI: TISSUE
Airway Wall Thickness
Patents EU 09161455.2 US 61/182.493 US 7.540.843 PCT/EP2005/010730
CT scan @
Inspiration and Expiration
Ventilation
Perfusion & Tissue
Deposition
FRI OUTCOME PARAMETERS

FRI: DEPOSITION Aerosol Simulation
DEVICE A DEVICE B

FRI: DEPOSITION Aerosol Simulation
Device A Device B
De Backer et al. Radiology 257 (2010) 854–862
De Backer et al. Med Eng & Phys 30 (2008) 872-879
Vinchurkar et al. Inhalation Toxicology (2012) 24(2): 81-8

FRI: DEPOSITION Aerosol Simulation
Symbicort
mouth
ua
trachea
lung
Foster
mouth
ua
trachea
lung
Device A Device B
• Lung deposition increases by 9%

FRI: DEPOSITION Aerosol Simulation
De Backer et al. Radiology. 2010 Dec;257(3):854-62.

FRI: DEPOSITION Aerosol Simulation
Regional concentration relative to a
minimal inhibitory
concentration threshold for
inhaled antibiotics

FRI: DEPOSITION Aerosol Simulation

FROM MODE OF ACTION TO
CLINICAL BENEFIT
GEOMETRY
PULMONARY FUNCTION
PATIENT’S QUALITY OF LIFE

Drug @ site of action
Effect on geometry
Effect on pulmonary function
Effect on quality of life
Low # confounding factors
High # confounding factors
FROM MODE OF ACTION TO
CLINICAL BENEFIT
Small sample size
Large sample size

Drug @ site of action
Effect on geometry
Effect on pulmonary function
Effect on quality of life
CORRELATION BETWEEN
GEOMETRY AND QOL

CORRELATION BETWEEN
GEOMETRY AND QOL
Wim Vos, Jan De Backer, Gianluigi Poli, Annick De Volder, Liesbeth Ghys, Cedric Van Holsbeke,
Samir Vinchurkar, Lieve De Backer, Wilfried De Backer
Use of novel functional imaging methods for the assessment of long-term changes
in small airways of patients treated with extrafine beclomethasone / formoterol
Respiration 2013

Drug @ site of action
Effect on geometry
Effect on pulmonary function
Effect on quality of life
CORRELATION BETWEEN
GEOMETRY AND PFT

CORRELATION BETWEEN
GEOMETRY AND PFT

CORRELATION BETWEEN
GEOMETRY AND PFT

SAMPLE SIZE CALCULATION
Asthma Study
Wim Vos, Jan De Backer, Gianluigi Poli, Annick De Volder, Liesbeth Ghys, Cedric Van Holsbeke,
Samir Vinchurkar, Lieve De Backer, Wilfried De Backer
Use of novel functional imaging methods for the assessment of long-term changes
in small airways of patients treated with extrafine beclomethasone / formoterol
Respiration 2013

SAMPLE SIZE CALCULATION
COPD Study
Lieve De Backer, Wim Vos, Jan De Backer, Cedric Van Holsbeke, Samir Vinchurkar,
Wilfried De Backer
Double blind, placebo controlled crossover study in COPD patients to assess the
acute effect of budesonide/formoterol using multi-slice CT and lung function tests
Eur Respir J 2012; 40: 298–305

• Functional Respiratory Imaging (FRI)
– FRI outcome parameters
– Added value in drug and device development
• Bio-equivalence
– Salmeterol/Fluticasone branded vs generic in
asthma
– Salbutamol vs Ipratropium Bromide in COPD
• Conclusions
OVERVIEW

FEV1
FRI-based airway volume
(iVaw)
FRI-based airway resistance
(iRaw)
FRI-based aerosol deposition
Pharmacokinetics
Low ability to differentiate products
High ability to differentiate products
FRI TO BRIDGE BETWEEN PK AND
PD

• double blind, double dummy, randomized, two-way cross-over study
• compare the effects of
– TEST = Seretide® Evohaler (supplied by Allen & Hanburys, UK)
– REFERENCE = generic salmeterol/fluticasone HFA pMDI (manufactured by Cipla Ltd, India)
• functional respiratory imaging parameters
• in 16 asthmatic patients
PROJECT OUTLINE

• Primary: To evaluate the effect of both study drugs under
investigation on FRI parameters and to evaluate the particle deposition in the lungs using CFD.
• Secondary: To assess the effect of salmeterol and fluticasone
combination therapy on lung function (spirometry and body plethysmography), on exercise capacity (6MWT) and on dyspnea (Borg CR10 Scale and VAS dyspnea). Furthermore the safety of the 2 study drugs under investigation will be evaluated through monitoring of AEs throughout the study.
ENDPOINTS

Visit 2
(pre)
Visit 2
(2h after pre)
Pre-bronchodilation
- Imaging
- PFT
- Exercise tolerance
Administration of
TEST/REFERENCE
with measurement of
inhalation profile
Post-bronchodilation
- Imaging
- PFT
- Exercise tolerance
Visit 3
(pre)
Pre-bronchodilation
- Imaging
- PFT
- Exercise tolerance
Administration of
TEST/REFERENCE
with measurement of
inhalation profile
Post-bronchodilation
- Imaging
- PFT
- Exercise tolerance
Visit 3
(2h after pre)
CLINICAL STUDY DESIGN

• CT scans: – Pre-dose: FRC and TLC – Post-dose: TLC
• Inhalation profile: – Calibration of respiration belts with pneumotach – Measurements during actual inhalation of study drug
• Pulmonary function tests: – Spirometry – Body plethysmography – Exercise tolerance – Dyspnea
DATA COLLECTION

INHALERS

• Pre-dose/post-dose LA airway models
– Airway volumes (iVaw)
– Airway surface area (iSaw)
– Airway resistance (iRaw)
• Pre-dose internal airflow distribution
– For CFD boundary conditions
• Pre-dose coupled UA/LA/inhaler models for particle deposition simulations
– Regional deposition of inhaled compounds
FRI OUTCOME

• Pre-dose/post-dose LA airway models
– Baseline stability, drug effect, effect comparison
V2_pre V2_post V3_pre V3_post
FRI OUTCOME

• Pre-dose internal airflow distribution
– For CFD boundary conditions
FRI OUTCOME

• Pre-dose coupled UA/LA/inhaler models for particle deposition simulations
– Regional deposition of inhaled compounds
15.2%
FRI OUTCOME

• Pre-dose coupled UA/LA/inhaler models for particle deposition simulations
• ACI data was used for particle diameter distribution of TEST and REFERENCE
FRI OUTCOME

• Pre-dose coupled UA/LA/inhaler models for particle deposition simulations
– Regional deposition of inhaled compounds
FRI OUTCOME

• To assess whether products are different
– Wilcoxon matched pairs to assess drug effect
– Mann Whitney U test to compare drug effects
– p<0.05 for significance
• To assess whether products are equivalent
– Two one-sided tests
– 90% confidence interval of Test/Reference ratio
– Between 80%-125% bounds
STATISTICS

• Inclusion
• Diagnosed asthma
• Treated according to GINA guidelines
• Non or ex-smokers (stopped <1y and <10y total packyears)
• Exclusion
• Exacerbation during last 8 weeks
• COPD
• Upper or lower airway infection
• Received oral corticosteroids in the last 4 weeks
IN- AND EXCLUSION CRITERIA


9F/7M Mean SD Min Max
Age [y] 58.88 8.70 44 73
Height [cm] 169.69 9.46 158 192
Weight [kg] 81.16 16.25 55 102.5
BP Sys [mmHg] 121.44 7.70 107 130
BP Dia [mmHg] 79.94 9.65 60 92
HR [bpm] 70.25 12.73 56 102
FVC [L] 4.23 1.25 2.46 6.74
FVC [%p] 120.53 13.20 90.4 141.9
FEV1 [L] 2.97 0.91 1.77 5.27
FEV1 [%p] 104.50 18.87 65.7 133.9
FEV1/FVC [%] 70.95 9.61 41.7 80.6
PEF [L/s] 8.21 2.71 5.59 15.75
MEF50 [L/s] 2.70 1.37 0.9 6.24
FEF75 [L/s] 0.73 0.38 0.23 1.69
FEF25 [L/s] 5.54 2.33 1.95 11.45
RV [L] 2.50 0.75 1.51 4.14
RV [%p] 116.19 23.77 90 170
TLC [L] 6.84 1.88 4.48 10.65
TLC [%p] 114.44 13.79 91 142
FRC [L] 3.45 0.95 2.06 5.36
FRC [%p] 109.88 18.39 77 149
Raw [kPas/L] 0.328 0.130 0.119 0.640
sRaw [kPas] 1.236 0.533 0.560 2.109
6MWT [m] 605.06 75.15 473 735
6MWT [%p] 92.75 11.96 75 118
PATIENTS

RESULTS

• FRI-based airway Volume (iVaw)
RESULTS

• FRI-based airway resistance (iRaw)
RESULTS

• Inhalation maneuver
RESULTS

• Drug deposition
RESULTS

• FRI-based aerosol deposition
test reference
RESULTS

• FRI parameters: drug effect
IMAGING TESTS Pre Test Post Test
p-value Pre Reference Post Reference
p-value Mean SD Mean SD Mean SD Mean SD
iVaw [cm3]
Total 51.93 23.59 55.66 25.85 0.00048 52.59 24.10 55.82 25.16 0.00058
Central 40.36 18.26 41.74 19.26 0.00176 40.72 18.92 41.75 19.26 0.01048
Distal 11.58 6.23 13.91 7.61 0.00048 11.87 6.04 14.07 6.67 0.00048
iSaw [cm2]
Total 290.24 93.13 312.57 103.03 0.00048 295.50 89.34 315.75 94.06 0.00048
Central 128.03 32.93 131.26 33.92 0.00058 129.95 34.29 132.87 34.53 0.00085
Distal 162.22 65.29 181.32 74.42 0.00048 165.55 60.75 182.87 64.96 0.00048
iRaw
[kPas/L]
Total 0.040 0.024 0.028 0.016 0.00147 0.039 0.023 0.025 0.013 0.00048
Central 0.014 0.009 0.012 0.007 0.01215 0.013 0.010 0.011 0.007 0.00209
Distal 0.026 0.017 0.017 0.011 0.00123 0.026 0.017 0.014 0.007 0.00048
RESULTS

• FRI parameters: drug comparison
IMAGING TESTS Pre Test Pre Reference
p-value Change Test Change Reference
p-value Mean SD Mean SD Mean SD Mean SD
iVaw [cm3]
Total 52.59 24.10 51.93 23.59 0.14060 3.72 3.36 3.23 1.82 0.39360
Central 40.72 18.92 40.36 18.26 0.28910 1.39 1.61 1.03 1.17 0.26630
Distal 11.87 6.04 11.58 6.23 0.18730 2.34 2.12 2.20 1.37 0.69820
iSaw [cm2]
Total 295.50 89.34 290.24 93.13 0.17060 22.33 17.37 20.25 12.02 0.66030
Central 129.95 34.29 128.03 32.93 0.28910 3.23 2.68 2.92 3.12 0.33880
Distal 165.55 60.75 162.22 65.29 0.17060 19.10 15.73 17.32 12.00 0.58720
iRaw
[kPas/L]
Total 0.039 0.023 0.040 0.024 0.45340 -0.012 0.013 -0.014 0.013 0.45340
Central 0.013 0.010 0.014 0.009 0.36550 -0.002 0.003 -0.002 0.003 0.89710
Distal 0.026 0.017 0.026 0.017 0.77610 -0.010 0.011 -0.012 0.011 0.48510
RESULTS

• Clinical parameters: drug effect CLINICAL TESTS
Pre Test Post Test p-value
Pre Reference Post Reference p-value
Mean SD Mean SD Mean SD Mean SD
FVC [L] 4.20 1.27 4.21 1.28 0.82020 4.21 1.40 4.31 1.46 0.15550
FVC [%p] 120.03 15.48 120.30 14.83 0.77610 119.49 16.88 121.87 15.77 0.28910
FEV1 [L] 2.91 0.96 3.04 0.96 0.00058 2.92 1.03 3.09 1.03 0.00058
FEV1 [%p] 102.32 21.10 106.78 19.98 0.00058 102.01 21.74 108.01 20.16 0.00058
FEV1/FVC [%] 69.71 10.09 72.76 10.25 0.00123 69.69 9.62 72.79 10.41 0.00048
PEF [L/s] 7.90 2.76 8.15 2.68 0.01212 7.94 2.93 8.26 2.75 0.02137
MEF50 [L/s] 2.55 1.27 2.96 1.32 0.00085 2.62 1.24 2.97 1.31 0.00103
FEF75 [L/s] 0.68 0.30 0.82 0.42 0.00102 0.69 0.34 0.88 0.48 0.00287
FEF25 [L/s] 5.22 2.10 5.94 2.03 0.00058 5.26 2.15 6.01 2.42 0.00348
RV [L] 2.58 0.84 2.44 0.74 0.02613 2.59 0.86 2.48 0.70 0.17870
RV [%p] 120.25 28.94 113.88 26.25 0.01832 120.06 28.61 115.63 23.04 0.21440
TLC [L] 6.83 1.85 6.73 1.82 0.01507 6.86 1.93 6.85 1.94 1.00000
TLC [%p] 114.19 13.74 112.69 13.63 0.02273 114.75 14.19 114.56 14.41 0.81300
FRC [L] 3.61 1.13 3.40 1.03 0.00270 3.57 1.09 3.38 0.96 0.00209
FRC [%p] 114.94 24.79 108.25 22.85 0.00234 113.69 23.10 107.69 20.29 0.00264
R [kPas/l] 0.36 0.15 0.28 0.12 0.00270 0.39 0.19 0.25 0.09 0.00048
sR [kPas] 1.43 0.89 1.08 0.66 0.00103 1.54 1.01 0.94 0.46 0.00048
6MWT [m] 636.67 61.09 631.93 62.96 0.21080 626.73 57.29 631.20 62.45 0.20850
6MWT [%p] 98.00 11.67 97.20 12.26 0.23480 96.40 10.13 96.93 10.15 0.46400
SaO2 [%] 97.21 1.25 96.86 1.41 0.32750 96.64 1.95 96.86 1.41 1.00000
SaO2_low [%] 94.43 3.69 93.79 4.64 0.21220 93.50 5.26 93.29 5.38 0.71980
Borg_Dyspnea [0-10]
pre 6MWT 0.63 0.97 0.28 0.34 0.12500 0.80 0.94 0.41 0.47 0.02225
Borg_Dyspnea [0-10]
post 6MWT 2.34 2.28 1.53 1.63 0.03333 2.40 2.20 1.89 2.07 0.38710
RESULTS

• Clinical parameters: drug comparison CLINICAL TESTS
Pre Test Pre Reference p-value
Change Test Change Reference p-value
Mean SD Mean SD Mean SD Mean SD
FVC [L] 4.21 1.40 4.20 1.27 0.90950 0.02 0.18 0.10 0.26 0.16390
FVC [%p] 119.49 16.88 120.03 15.48 0.93820 0.28 5.13 2.38 6.53 0.14050
FEV1 [L] 2.92 1.03 2.91 0.96 1.00000 0.13 0.13 0.18 0.13 0.23290
FEV1 [%p] 102.01 21.74 102.32 21.10 0.79590 4.46 4.01 5.99 4.04 0.29340
FEV1/FVC [%] 69.69 9.62 69.71 10.09 0.97730 3.05 2.43 3.10 1.77 1.00000
PEF [L/s] 7.94 2.93 7.90 2.76 0.73680 0.26 0.39 0.32 0.51 0.58720
MEF50 [L/s] 2.62 1.24 2.55 1.27 0.55090 0.41 0.24 0.35 0.33 0.28910
FEF75 [L/s] 0.69 0.34 0.68 0.30 0.60900 0.15 0.16 0.19 0.21 0.24430
FEF25 [L/s] 5.26 2.15 5.22 2.10 0.55200 0.72 0.47 0.74 0.87 0.85640
RV [L] 2.59 0.86 2.58 0.84 0.95880 -0.14 0.20 -0.11 0.27 0.50140
RV [%p] 120.06 28.61 120.25 28.94 1.00000 -6.38 8.52 -4.44 11.77 0.46850
TLC [L] 6.86 1.93 6.83 1.85 0.45330 -0.10 0.13 -0.01 0.17 0.13940
TLC [%p] 114.75 14.19 114.19 13.74 0.54790 -1.50 2.19 -0.19 3.04 0.23210
FRC [L] 3.57 1.09 3.61 1.13 0.53200 -0.21 0.21 -0.20 0.22 0.81590
FRC [%p] 113.69 23.10 114.94 24.79 0.38150 -6.69 6.26 -6.00 6.30 0.73600
R [kPas/l] 0.39 0.19 0.36 0.15 0.23410 -0.07 0.08 -0.14 0.11 0.06636
sR [kPas] 1.54 1.01 1.43 0.89 0.35190 -0.35 0.40 -0.59 0.59 0.08323
6MWT [m] 626.73 57.29 636.67 61.09 0.18410 -4.73 17.02 4.47 11.13 0.05693
6MWT [%p] 96.40 10.13 98.00 11.67 0.16830 -0.80 2.46 0.53 1.92 0.15010
SaO2 [%] 96.64 1.95 97.21 1.25 0.14630 -0.36 1.28 0.21 1.81 0.35070
SaO2_low [%] 93.50 5.26 94.43 3.69 0.23460 -0.64 1.78 -0.21 1.81 0.32370
Borg_Dyspnea [0-10]
pre 6MWT 0.80 0.94 0.63 0.97 0.73490 -0.34 0.78 -0.37 0.50 0.67400
Borg_Dyspnea [0-10]
post 6MWT 2.40 2.20 2.34 2.28 0.96870 -0.81 1.26 -0.51 1.45 0.34930
RESULTS

• Seretide FS and Cipla FS are not significantly different
• Are they equivalent?
– Transform parameters to normal distributions (when needed)
– Determine 90% CI
– Assess whether 90% CI lies within 80%-125% bounds
• Case 1: Atrovent vs Ventolin
• Case 2: Seretide FS vs Cipla FS
RESULTS

• Assess acute effect of Salbutamol (Ventolin) in comparison with Ipratropium Bomide (Atrovent)
• Prospective cross over study
• 6 COPD patients
• 400 microgram Ipratropium Bromide / 80 microgram Salbutamol
• Are these products equivalent according to different parameters?
De Backer LA, Vos WG, De Backer JW, Devolder A, Verhulst SL, Claes R, Salgado R, Germonpré
PR, De Backer WA
The effect of salbutamol in comparison with ipratropium bromide on central
and peripheral airways in COPD
Int J Chron Obstruct Pulmon Dis. 2011;6:637-46.
ATROVENT vs VENTOLIN

ATROVENT vs VENTOLIN


ATROVENT vs VENTOLIN


CORRELATION BETWEEN
GEOMETRY AND QOL COPD and Asthma Population (pooled data)
Data on file 5
16

CORRELATION BETWEEN
GEOMETRY AND QOL COPD and Asthma Population (pooled data)
Data on file 5
-19


FEV1
FRI-based airway volume
(iVaw)
FRI-based airway resistance
(iRaw)
FRI-based aerosol deposition
Pharmacokinetics
Low ability to differentiate products
High ability to differentiate products
FRI TO BRIDGE BETWEEN PK AND
PD

• FRI is more sensitive compared to standard PFT
• FRI can yield regional information in small scale clinical trials
• FRI has the potential to bridge between PK and PD
CONCLUSIONS


