January 1998 PUBLISHED IN IRISH BANKING REVIEW SUMMER 1998, pp 22-38 INVISIBLE ENTREPÔT ACTIVITY IN IRISH MANUFACTURING Charles Conroy, Patrick Honohan and Bertrand Maître Economic and Social Research Institute Abstract The Irish manufacturing sector contains 'invisible entrepôts' where intangible factors arrive and leave much as cargoes do in the world's great transhipment ports. Production and export data are partly contaminated by this activity, creating difficulties of interpretation. We quantify the issues in terms of four specific sectors especially characterized by this feature. ________________________________________________________ Economic and Social Research Institute, 4 Burlington Road, Dublin 4. Phone: 353-1-6671525; Fax: 353-1-6686231; e-mail [email protected]
Transcript
January 1998
PUBLISHED IN IRISH BANKING REVIEW SUMMER 1998, pp 22-38 INVISIBLE ENTREPÔT ACTIVITY IN IRISH MANUFACTURING Charles Conroy, Patrick Honohan and Bertrand Maître Economic and Social Research Institute Abstract
The Irish manufacturing sector contains 'invisible entrepôts' where intangible factors arrive and leave much as cargoes do in the world's great transhipment ports. Production and export data are partly contaminated by this activity, creating difficulties of interpretation. We quantify the issues in terms of four specific sectors especially characterized by this feature.
________________________________________________________ Economic and Social Research Institute, 4 Burlington Road, Dublin 4. Phone: 353-1-6671525; Fax: 353-1-6686231; e-mail [email protected]
1
INVISIBLE ENTREPÔT ACTIVITY IN IRISH MANUFACTURING Charles Conroy, Patrick Honohan and Bertrand Maître 1 Introduction
Ireland's recent economic success, with an average GDP growth rate of over 8½ per cent per
annum in the period 1993-97, has turned the spotlight on the economy's underlying structure.
While the credit for the boom should probably go to other aspects, such as improved institutions
resulting from the fiscal adjustment of the 1980s,1 the rapid growth and unusual structure of the
manufacturing sector have attracted much comment.
First among these features is the scale of foreign involvement. Foreign-owned multinational
corporations (MNCs) own a higher share of manufacturing capacity in Ireland than in any other
EU country. Almost three-quarters of measured output and almost a half of employment in the
sector are accounted for by foreign multinationals. Furthermore, employment in manufacturing
has been growing in Ireland, in contrast to developments in most other EU countries. But it is
the high profitability of multinationals based in Ireland, and the low labour share in the net
output of these sectors, that is most striking. Not only has Ireland been reported as the most
profitable destination in the world for US multinationals, but their total profits reached 14 per
cent of GDP in 1996, and is still growing - contributing significantly to the sizable gap between
GDP and GNP, and between the growth rates of these aggregates.
Ireland's tax and incentive regime is a flexible and generous one, attracting MNCs in a wide
variety of sectors and with different degrees of capital and skill intensity. But it is the low 10
per cent rate of corporation tax which has provided the greatest opportunities for many of the
companies involved in inward FDI. By employing this low tax rate in conjunction with tax
treaties and global averaging rules of their home tax administrations (especially the US) MNCs
can locate high-profit segments of their business in Ireland to very great tax advantage. Of
course this tax incentive would be of little value if the underlying business environment was not
1See Bradley, Fitz Gerald, Honohan and Kearney (1997) for a discussion of the various hypotheses that have been recently advanced for the turnaround in Ireland's economic performance since the mid-1980s.
2
otherwise favourable in Ireland, but this is assured by stable political and administrative
conditions, substantial investment in education to secondary and third level, an adequate
physical infrastructure and membership of the European Union.
This paper identifies the unique features of Irish manufacturing and discusses their implications
for interpreting Irish macroeconomic and other data, and for tax policy. We employ recently
published industrial production data based on the new NACE classification2 providing greater
detail than has hitherto been available. We find that most of the unusual industrial structure is
concentrated in four specific sub-sectors - certain speciality chemicals, software reproduction,
computers and certain food products, specifically production of cola concentrate. By 1995,
these four subsectors account for over a third of gross manufacturing output in Ireland and for
some 22,000 jobs. The labour share in net output in these sectors is very low, both by domestic
and international standards. They remit substantial profits abroad and pay substantial royalty
and license fees. The profits paid are far in excess of what would be a normal required return on
the capital invested in these sectors in Ireland.
Double entry accounting for these intangible elements of the gross output inflates the apparent
size of these and (to a lesser extent) several other sectors and can be misleading to the unwary.
Part of the problem is the use of transfer pricing by MNCs to ensure that sufficient profits are
located in their Irish affiliates to make the most of the tax planning opportunities.3
We suggest that the activities of these sectors can best be seen by making an analogy with the
activities of entrepôts. In the entrepôt, warehousing, logistics and other activities are applied to
valuable physical cargoes which in turn are shipped in and out on costly vessels and aircraft.
But the entrepôt does not actually produce or substantially modify the cargoes or the ships, and
2Earlier analyses, such as Honohan (1984), O'Leary (1984), NESC (1993) and Conroy (1994) were based on the NACE 1970 disaggregation. The newer NACE Rev. 1 classification allows a more refined analysis.
3There is also a parallel tax-driven offshore financial centre, the Dublin International Financial Services Centre (IFSC) which emerged under new tax concessions introduced in the late 1980s. It has contributed several thousand additional jobs and substantial tax revenue. We do not consider the IFSC further here.
3
these are not included in the export or production data of an entrepôt. In much the same way,
the activities of these unusual Irish manufacturing sectors do require the intangible
technological and other resources that are paid for through royalties , license fees and profits to
parent companies; but the intangible resources are not substantially modified in the process and
can be seen as analogous to the cargoes passing through the entrepôt, or even to the ships
carrying the cargoes.
This pattern of high measured labour productivity in a profitable MNC sector is not new in
Ireland, but was already well established by the mid-1970s reflecting the fact that the tax
incentives too are of long-standing - and indeed used to be even more favourable than they are
today. Accordingly, the rapid recent growth in the Irish economy cannot be attributed to the
introduction of these tax incentives.
However, the magnitude of this invisible entrepôt business does substantially affect
macroeconomic aggregates and measured growth rates. It is well known that GDP figures are
strongly affected by the high profitability of foreign MNCs operating in Ireland, and that GNP is
not so affected. We point out, however, that looking at GNP does not give a clear picture of
domestic production undistorted by these unusual features. An undistorted domestic product
series would show substantially lower growth in recent years, and especially in 1993-97.
2 Low labour-share sectors: the data
Our focus is especially on sectors for which the recorded share of wages and salaries in net
output is especially low. We begin with the data included in the Census of Industrial Local
Units in the Census of Industrial Production (CIP). The reported value of net output of a sector
is obtained from gross output by the deduction of the value of purchases of industrial materials
for processing, industrial services (including transport), and fuel and power. Thus it includes
wages and salaries paid and in addition, interest and dividend payments, retained earnings,
depreciation and all other expenses and overheads. In particular, it should be noted that net
output does include the cost of non-industrial services supplied to firms in the sector, such the
rent of premises, insurance premiums on plant and premises and audit, legal, postal, advertising,
4
transport, entertainment and similar expenses. Clearly, therefore, there is more to net output
than simply the profits and labour income, and this needs to be borne in mind in considering the
data.
In 1995, the average labour share of net output in Irish industry was 21 per cent. This figure is
roughly the same whether we take all industries or just manufacturing industry on its own, as the
latter dominates the net output figures. But some sectors have much lower labour shares. At
the two digit level, the food & beverages sector 15 comes in with 19 per cent; the publishing,
printing & reproduction of recorded media sector 22 has a labour share of 14 per cent;
chemicals 24 has just under 10 per cent as has office machinery and computers 30.
With the exception of the last named sector (30), for which no further detailed breakdown is
available, it is possible to identify in each case the subsectors which chiefly contribute to these
relatively low labour shares. (Table 1)
In food, it is the residual subsector 1589 "manufacture of other food products not
elsewhere classified" that alone of the food subsectors identified has a labour share of
less than ten per cent.4 In 1994, the labour share of this subsector had fallen as low as
2.2 per cent (in 1995, this subsector's data is merged with that of 1588, probably to
protect the data of individual companies which dominate the subsector). It is known
that this subsector includes the cola concentrate firms, affiliates of the Coca Cola and
Pepsi Cola world companies, and it is they who are probably the major contributors to
the low labour share.
In publishing, etc., it is only subsector 223, namely "reproduction of recorded media"
(for which there is no further subdivision available) which, at 5 per cent, has a labour
share below 20 per cent. This is the subsector in which software reproduction
companies associated with Microsoft, Lotus and others are included. In 1995, the labour
4Three other subsectors of 15 have had labour shares between 10 and 20 per cent in recent years: "homogenized food preparations and dietetic food" 1588, distilling 1591, and brewing 1596. Distilling's labour share of about 12-15 per cent in 1994-95 has risen from 7 per cent in 1990.
5
share of this subsector was 4.8 per cent.
Chemicals has three distinct subsectors with labour shares below 10 per cent.5 With the
lowest share at 3.9 per cent in 1995 is 2414 "manufacture of other organic basic
chemicals". The other two, both of which have had labour shares in the region 8-10 per
cent are 2441 "manufacture of basic pharmaceutical products" and 2464-2466, a group
which is not further subdivided, and which includes manufacture of "photographic
chemical material", of "prepared unrecorded media" and of "other chemical products not
elsewhere classified".
We may thus refer to the three subsectors with exceptionally low labour shares (less than 5 per
cent) as cola concentrates 1589, software reproduction 223, and organic basic chemicals 2414.
We focus on these, together with the broader computer sector 30 in what follows. Between
them, they employed over 22,000 workers in 1995 - more than a half of these in computers
(Table 2). This is equivalent to about 10 per cent of total manufacturing employment in Ireland.
The share of these four sectors in total manufacturing output in 1995 was much larger at 35 per
cent, of which about one half in computers. This reflects the extremely high net output per
employee - over £1 million in 1994 for the cola concentrate companies, with lesser, but still
very high figures in the other two.
For some of the subsequent analysis, we have to use a slightly coarser mesh, and include a few
other product groups in order to use the companion data of the census of industrial enterprises,
to get a longer time series, or internationally comparable data.
As mentioned, some of the low labour share is attributable to the purchase of non-industrial
services. Data on these purchases are included in the census of industrial enterprises (as distinct
from the census of industrial local units). On average in the manufacturing sector, purchases of
5And a further three, 2416, plastics in primary forms, 2442, pharmaceutical preparations, and 2452, perfumes and toilet preparations with labour shares between 10 and 20 per cent in recent years.
6
non-industrial services are approximately equal to labour cost but, as shown in Table 3, three of
the four sectors of our focus have a much higher ratio - as high as 14 times in the case of the
broad other food products group (only available for this broader grouping). The substantial use
of non-industrial services, which would include royalties and consultancy fees, reflects the
degree to which these sectors rely on proprietary technology and other immaterial resources.
Subtracting out purchases of industrial services gives us a closer approximation to the return on
capital - profits, interest etc. In order to make a rough assessment of the return on capital
invested in Ireland, we formed an estimate of this capital stock using a perpetual inventory
method.6 It is not possible to obtain perfect continuity with the old Irish industrial census
statistics in use before 1991 (the new sectoral classification is not simply a refinement of the old
one). Nevertheless, we have been able to construct a series that is not too much affected by the
definitional change, and which is still based on the four subsectors described (Table 2A).
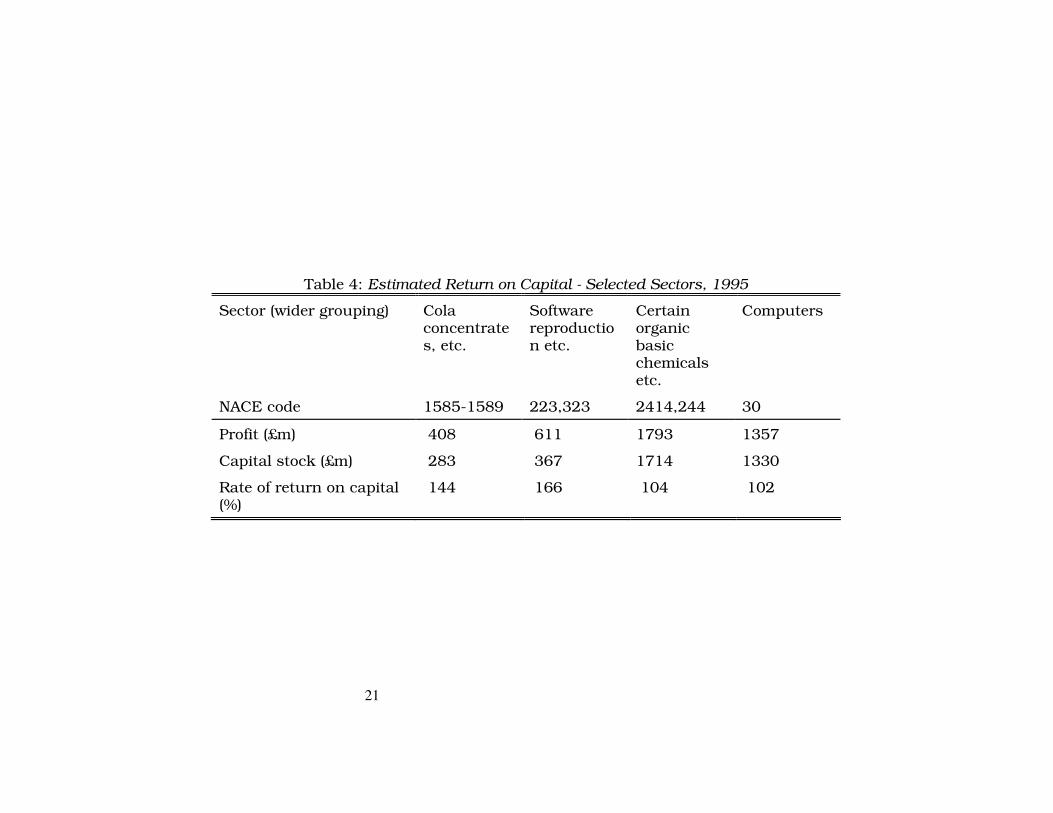
The result of the profitability and capital stock exercise is shown in Table 4. By 1995,
cumulative capital accumulation over ten years was, in the case of each of the four sectors,
lower than 1995 return on capital. The estimated rate of return on capital in that year varied
between about 100 per cent per annum (organic chemicals and computers) to 166 per cent
(software reproduction).
The required rate of return on capital would, of course, be far lower than this, so that we can
take it that the bulk of the return to capital in these sectors is an "excess return" attributable to
accumulated technological know-how, brands or other sources of market power.
This result does depend on the accuracy of the capital formation series in the CIP. It is possible
that some investment by start-up firms might be missed by the CIP. One check on this would be
to compare with the independently collected data for capital formation in manufacturing shown
in the National Income and Expenditure (NIE) accounts (although there is not a perfect
conceptual correspondence between these two). It turns out that the total capital formation
6The results presented employ a ten-year rectangular life of capital; plausible alternative depreciation assumptions make little difference.
7
recorded in the CIP for manufacturing 1985-1995 (excluding 1991-92 not yet published)
exceeds the corresponding figure in the NIE. The CIP figures were much higher than NIE in the
1990s, and somewhat lower in the 1980s. While we are unable to reconcile these two series, the
discrepancies do not indicate any overstatement of the rates of return estimated by our method.
Nevertheless, it is clear that our estimated rates of return need to be treated with caution.
3 The invisible entrepôt: a way of interpreting the activity of the low labour-share
sectors
The four sectors which we have singled out thus have very high excess returns on capital and
use exceptionally high volumes of non-industrial services. Both the high return on capital and
the high use of non-industrial services indicated by the data implies that, in addition to physical
materials and the other standard forms of input, this segment of Irish manufacturing is using
invisible or immaterial resources to generate the measured value of output. These immaterial
resources reflect technological, scientific or market knowledge, brands and other elements
contributing to market power and to market value. The owners of these immaterial factors,
usually a parent or associate of the entity that is manufacturing in Ireland, are rewarded by
royalties, license fees and dividends and other distributions.
These immaterial factors are present in all economies. But Irish manufacturing relies on them to
a greater extent than others because of the extent of foreign ownership, the modest extent to
which these sources of market value are actually generated in Ireland (through R&D and the
like).
Other European countries do not show similar ratios of labour share to net output for these
sectors. Table 5 shows the net output per person employed in Ireland and in the average of the
rest of the EU. Clearly net output per worker in Ireland in these sectors is much higher than in
the other countries. Using other EU countries as a benchmark, we can calculate what Irish net
output in these sectors would be at current levels of employment and EU-average per capita
output. The results of this calculation7 is presented in Table 5. The scale of this effect is very
7There are many obvious shortcomings in this methodology, not least the fact that the micro-
8
substantial: the total amounted in 1995 to over one-third of manufacturing net output in Ireland.
It is also growing, as can be seen from the time series in Figure 1.
How should we interpret these differences? One way is to take the analogy of an entrepôt.
Think of the great port cities such as Hong Kong and Singapore. These are the two largest
container ports in the world, and they add considerable value by expediting the shipment of
goods. Both began as staple ports, exporting the agricultural produce of the interior. Now they
are hubs, where container loads (and air-freight pallets) from all over the world are
disassembled and reassembled for onward shipment elsewhere. These port and transit activities
employ considerable human and physical resources and add substantial value. Nobody would
suggest that Singapore or Hong Kong actually produce the goods that are transhipped through
the ports (although both cities do also have substantial manufacturing output). Instead, the
value of the cargo being transhipped is seen as something that is effectively "offshore" of the
cities' economies.
The ratio of the value of material inputs to labour inputs in the four Irish manufacturing sectors
is not really high enough for this to be seen as an entrepôt activity in the normal - material -
sense of the word. Even including fuel and industrial services, the ratio is only between 4 and 6
for three of the sectors, though it does rise to a fairly high 13 for computers.
But relative to normal experience, the payments to intangible or immaterial factors - excess
profits and most of the payment for non-industrial services - is so high that it can be seen as
constituting a kind of invisible entrepôt activity operating in parallel with and linked to the
actual manufacturing process. Thus in 1995, between 62 and 92 per cent of measured net
output in these sectors was the embodiment of these immaterial factors. This value is not
irrelevant: just as the sophisticated and costly port activities of Hong Kong and Singapore would
not be in demand if the value of the cargoes involved was not high, the Irish manufacturing
activity in these sectors would likely be less if the final output did not embody the value of the
immaterial factors. Excess profits, royalties and similar payments swirl invisibly around these
composition of the sectors may be quite different in the different countries.
9
Irish manufacturing activities just as container-loads of valuable physical cargoes are swung
from vessel to vessel on cranes and transporters in the great ports.
4 Issues
Data and interpretation
The official data capture all of this in a reasonably adequate way, as long as one knows how to
interpret the data. And the official treatment is within the accepted parameters of international
practice. But there are pitfalls for the unwary. The most serious problem relates to international
comparability of GDP data. To be sure, royalties and license fees paid abroad are now excluded
from measures of Gross Domestic Product (GDP), so that part of this entrepôt business no
longer contributes to any confusion in the GDP accounts. But profits and other capital income
accruing to non-residents are left in GDP, though not in GNP. Inasmuch as one would not wish
to include the value of transhipped cargoes in the value of Singapore's GDP, this partial
inclusion of the value of the invisible entrepôt trade can evidently be misleading.8 The fact that
GDP is much more widely used worldwide as a portmanteau measure of economic activity than
GNP underlines the importance of this problem.
Because the scale of the invisible entrepôt activity has been growing, it is not only the level of
GDP which is affected but also its growth rate. Growth rates calculated after subtracting out
this invisible entrepôt activity are considerably lower than those in GDP.
It is sometimes thought that an easy and adequate approach to this problem of interpretation is
to look at GNP instead of GDP. It is true that GNP data is little affected by the problem. But
the difference between GDP and GNP is not confined to the profits of foreign MNCs. National
debt interest and other net outflows of investment income are also subtracted from GDP to
obtain GNP. The shrinkage of these latter flows in recent years has served to mask the degree to
which GDP growth is inflated by the inclusion of MNC profits. Excluding MNC profits from
GDP altogether would reduce the average growth rate during 1993-1997 by 1.6 percentage
8Although the revised 1993 SNA standard would have allowed the exclusion from GDP of such profits as were attributable to the practice of transfer pricing, the European standard does not adopt this approach.
10
points,9 whereas GNP growth in those years was only 0.7 percentage points lower than GDP
growth.
An additional factor is the systematic decline in the terms of trade which has been noticed in
recent years, and is partly attributable to the short product cycle in some of these sectors. To see
why this is happening think of a newly developed product - say a new drug or a new generation
of a computer component. In the first year of production, this product will have a high price;
subsequently, the price will decline, so that even if the volume of production (e.g. number of
micro-chips) is maintained, the value will decline. Through this mechanism, the growth in the
purchasing power of Irish manufacturing output has been much slower than the growth in the
volume of output. By the same token, the average price of Irish manufacturing exports has risen
much more slowly than that of imports - i.e. the terms of trade have been worsening.
Manufacturing has been a significant contributor to an overall worsening of the terms of trade
which has subtracted a further 1.3 per cent per annum from the purchasing power of GDP in the
period 1993-97. Some may question the relevance of this terms of trade effect to the present
context; the link is to be found in the fact that the parent companies of these high profit sectors
only retain their high worldwide profitability by continuous innovation at a rapid rate, and that
short product cycles and declining real prices is a correlate of such rates of innovation.
Gross National Disposable Income (GNDI) is the usual measure of the international purchasing
power of Irish income. Its growth has averaged 6.8 per cent in 1993-97 as compared with 8.7
per cent for GDP and 8.0 per cent for GNP.10 Had it not been for the improvement in National
debt interest and other flows of investment income mentioned above, GNDI would have grown
by only 5.8 per cent in this period. That is perhaps a better broad indication of the strength of
the Irish output boom in these years than the figures of 8-9 per cent customarily used.
Related pitfalls can be found in analysis of export market share and of productivity trends.
9It would be more precisely consistent with our approach just to exclude what we have referred to as "excess profits", if that data were available.
10These estimates use the National Income and Expenditure 1996, and the ESRI Quarterly Economic Commentary December 1997.
11
Aggregate exports of goods and services in the Irish economy will outstrip GNP for the first
time in 1998. But the fact that the export figures embody all of the invisible entrepôt activity
(royalties as well as profits) takes some of the shine off this remarkable statistic. The
geographic destination of trade could also be distorted. In order to see whether this was a
significant in practice, we calculated adjusted export shares to exclude the entrepôt activity of
our four sectors. In fact the adjustments proved to be small, increasing the share of the UK by
only 1 percentage point in 1995 (though by rather more in earlier years).
Tax policy issues
Taxation is undoubtedly the major driver of the invisible entrepôt. As is well known, the
structure of Irish company taxation has long made Ireland exceptionally attractive for high profit
companies. Since multinational corporations have a considerable discretion in choosing how to
account for the worldwide operations, they could arrange for the material inputs to their Irish
operations to be valued in such a way as to embody the immaterial, it is inevitable that such
firms that can use the favourable Irish tax regime to lower their worldwide tax liabilities will
seek to do so.
There has been much discussion of the tax policy implications. Though this tax planning
behaviour undoubtedly encourages location in Ireland rather than elsewhere of some
employment creating firms - and we have already indicated that these four sectors employ about
22,000 people in Ireland - this is not the whole story. For one thing, by encouraging low labour-
share activities, it skews the structure of Irish manufacturing in a way which may not be
conducive to long-run maximization of per capita incomes. Economy-wide labour productivity
has not grown particularly rapidly during the current boom: a 4 per cent average annual
employment growth has been the major contributor to output growth in 1993-97.
Second, though tax avoidance is the motive, it does not follow that aggregate corporate tax
revenue in the world would increase by much if the low Irish tax regime were not present.
Many other tax-advantaged locations exist: footloose firms for whom tax avoidance is important
would move to the next most favourable invisible entrepôt.
12
Concluding remarks
The existence of invisible entrepôt activity in Irish manufacturing, much of it concentrated in a
handful of subsectors, is an important aspect of the recent growth spurt. Furthermore it does
contaminate the macroeconomic data and makes careful interpretation of that data necessary.
Though stripping out the contribution of this activity to measured output would sharply reduce
recent growth rates, it would not alter the evident reality of a broad-based and vigorous boom.
13
References Bradley, J., J. Fitz Gerald, P. Honohan and I. Kearney (1997), "Interpreting the Recent Irish Growth Experience", in D. Duffy, J. Fitz Gerald, I. Kearney and F. Shortall, eds., Medium-Term Review: 1997-2003 (Dublin: Economic and Social Research Institute). Central Statistics Office (Various years), Census of Industrial Production (Dublin: Government Publications). Conroy, C. (1994), "Low Labour Content Sectors: Implications for the Interpretation of Macroeconomic Data", Economic and Social Research Institute, unpublished. Honohan, P. (1984), "Transfer Pricing in Ireland - A Cautionary Note", Central Bank of Ireland Research Paper 2/R/84 (unpublished). National Economic and Social Council (1993), The Association Between Economic Growth and Employment Growth in Ireland (Dublin, NESC). O'Leary, J. (1984), "Some Implications of the Revisions to the Balance of Payments and the National Accounts", Irish Banking Review, September.
Table 1: Low Labour Share Sectors 1994
2-digit sectors below 20% labour share Subsectors below 20% labour share Net output £m