16
How Markets Work SM January 2007 Recent Trends in Shareholder Class Action Litigation: Filings Plummet, Settlements Soar Todd Foster Ronald I. Miller, Ph.D. Stephanie Plancich, Ph.D.
| Date post: | 10-Feb-2018 |
| Category: |
Documents |
| Upload: | trankhuong |
| View: | 217 times |
| Download: | 3 times |

How Markets WorkSM
January 2007
Recent Trends in ShareholderClass Action Litigation:Filings Plummet, Settlements Soar
Todd FosterRonald I. Miller, Ph.D.Stephanie Plancich, Ph.D.

Only 129 federal shareholder
class actions were fi led
from January 1 through
December 15, 2006, with 135
fi lings for the full year if the
same pace is maintained.
This is a 36% drop from 2005
levels, and a 44% decline from
the post-PSLRA average.
Recent Trends in Shareholder Class Action Litigation:
Filings Plummet, Settlements Soar
January 2007
Todd Foster, Ronald I.Miller, Ph.D., Stephanie Plancich, Ph.D.1
Settlements Break Records, While Filings Continue to Decline
This year will stand out as one of record settlements. There were more settlements over $100 million—the so-called
mega-settlements—in 2006 than in 2005, itself a record-breaking year. In 2006, there were four settlements over
$1 billion.2 This is an astonishing development given that before 2006 only three settlements had ever exceeded
$1 billion. Litigation in the Enron matter continues, with over $7.1 billion allocated to fund settlements so far.
These huge cases have raised average settlement values to their highest level ever.
While eyes have been focused on these settlements, federal court fi lings of shareholder class-actions have plummeted.
The drop-off in fi lings, fi rst observed at the end of 2005, accelerated through 2006. Annual 2006 federal fi lings
are at the lowest level since 1996—a year that was itself unusually low because many fi lings were moved to state courts
in an attempt to bypass the restrictions imposed by the 1995 passage of the Private Securities Litigation
Reform Act (“PSLRA”).
Federal Filings Continue to Drop
Filings in federal courts in 2005 were somewhat low relative to the average over the previous decade. More
specifi cally, there were 211 fi lings for full-year 2005, compared to the annual post-PSLRA average of 239 standard
fi lings each year.3 Examining these fi lings more closely reveals an even more dramatic picture: while fi lings were
roughly in line with prior years through the fi rst half of 2005, they began to drop rapidly starting in July of that year.
There were only 78 fi lings in second-half 2005, compared to 131 in second-half 2004. By contrast, the fi rst half of
2005 had more fi lings than the fi rst half of 2004.
nera.com 1

2 nera.com
We noted this decline in a previous NERA report that
considered year-end 2005 data.4 However, because fi lings
can have substantial month-to-month variation, it was
impossible to tell at that point whether the decline refl ected
a temporary aberration or a new trend. The continued
decline in 2006 allows us to conclude that the change is
indeed statistically signifi cant. Only 129 federal shareholder
class actions were fi led from January 1 through December
15, 2006, with 135 fi lings for the full year if the same
pace is maintained. This is a 36% drop from 2005 levels,
and a 44% decline from the post-PSLRA average.
While the magnitude of this drop-off in fi lings is notable,
the decline has not been evenly distributed across the
circuits. The largest drop in absolute terms has come from
the Ninth Circuit, where, compared to a peak of 68 in
2004, there have been only 27 shareholder class action
suits fi led through December 15, 2006. However, every
circuit has fewer standard fi lings in 2006 than the average
level from 1998-2004. The drop is smallest in the Second
Circuit, which in 2006 has seen fully 87% of the fi lings it
typically received over 1998-2004.5 The rest of the circuits
as a group have received only about half of their typical
1998-2004 fi lings. All but two of the circuits had a
decline of at least one-third from 2005 to the projected
2006 fi gures.
It is not yet clear what is driving this precipitous decline. One
hypothesis is that Sarbanes-Oxley (“SOX”), passed in July
2002, has now had enough time to cause improvements in
Federal FilingsJanuary 1, 1991 – December 15, 2006
550
500
450
400
350
300
250
200
150
100
50
1991
167
1992
206
1993
172
1994
244
1995
213
1996
130
1997
201
1998
277
1999
252
2000
240
2002
288
2005
211
2001
518
2003
250
2004
257
2006
135
Market Timing CasesLaddering Cases Analyst Cases Projected FilingsStandard Filings
15 1131
246225
254
210
129
304
corporate governance that have limited fraud and resulting
shareholder class actions. For this story to hold, however,
SOX would need to have had strongly different effects
across the Circuits, with much less impact in the Second
Circuit. This differential effect seems unlikely. One possible
explanation for the difference is that the fi nance sector,
strongly represented in the Second Circuit, has reacted less
to SOX than have other industries. However, the fi nance
sector has seen lower than average fi lings this year, leaving
us without a clear explanation for why the Second Circuit
has had such a different experience from the rest of
the country.
Another possibility is that the decline is the result of
distraction on the part of some of the largest plaintiffs’
law fi rms. Milberg Weiss has been the subject of federal
indictment and has suffered the highly-publicized loss of
some partners, while Lerach Coughlin has been occupied
with a mass of litigation surrounding Enron. If limitations
in the resources of the plaintiffs’ bar turn out to be the
cause of the trend in fi lings then we would expect fi lings
to return to higher levels in the future. In this case, we
might also expect average settlements to rise going
forward (or dismissal rates to fall) as an entrepreneurial
plaintiffs’ bar would focus its energy on the most
promising cases.

nera.com 3
Companies Face a 1.6% Chance of a Suit each Year
1993-1995 2004-2006 %Change
No. of Publicly Traded Companies 11,688 12,339 5.6%
Annual Filings 210 201 -4.2%
Probability of Shareholder Class Action (SCA) 1.8% 1.6% -9.3%
Probability of Dismissal 19.4% 38.2% 97.0%
Probability of SCA that Surivives Motion to Dismiss 1.4% 1.0% -30.4%
Standard Federal Filings By Circuit2005 vs. Projected 2006
60
50
40
30
20
10
DC23
1st
8
2nd
44
3rd
13
4th
4
5th 6th
3
7th
2
8th 9th
28
11th
13
10th
3
45
Projected 20062005
1310
14
52
21
11 10 12
69 11
7
Moreover, the decline in the likelihood of facing a suit
has been augmented by an increased dismissal rate
so that the probability of a company facing a suit that
survives a motion to dismiss has fallen by more than 30%.
Based on the fi ling rate from 2004 to 2006, the average
public corporation faces a 7.9% probability that it will face
at least one shareholder class action lawsuit over a fi ve-year
period.6 The annual likelihood of a suit has fallen 9%
since the period from 1993 to 1995, from 1.8% to 1.6%.
Every circuit but two had a decline of at
least one-third from 2005 to the projected
2006 fi gures.
4 nera.com
Filings Dropped Despite Options
Backdating Litigation
The drop in fi lings in 2006 is even more surprising given
that the count of 129 fi lings through December 15 includes
22 fi lings involving allegations of options backdating. These
cases represent something novel and distinct from more
typical issues for shareholder class action litigation. Indeed,
as the litigation plays out, it may make sense to group
these cases with the IPO laddering and Wall Street analyst
cases as non-standard fi lings. As with these other litigations,
options backdating cases may be a short-term block of
litigation that is unlikely to recur. If this is correct, then
the numbers above understate the drop in the volume
of standard shareholder class action litigation, and the
trend rate of fi lings has fallen even further than it
currently appears.
These counts of fi lings for options backdating cases may
appear low given the volume of media and professional
attention that backdating has received. This is because the
majority of backdating litigation involves derivative actions,
not shareholder class actions. Indeed, there have been
at least 80 derivative actions fi led through December 15.
Filing of a shareholder class action suit with a substantial
chance of success requires an unusual drop in share prices,
a feature not shared by many of the backdating cases
where derivative actions have been fi led.
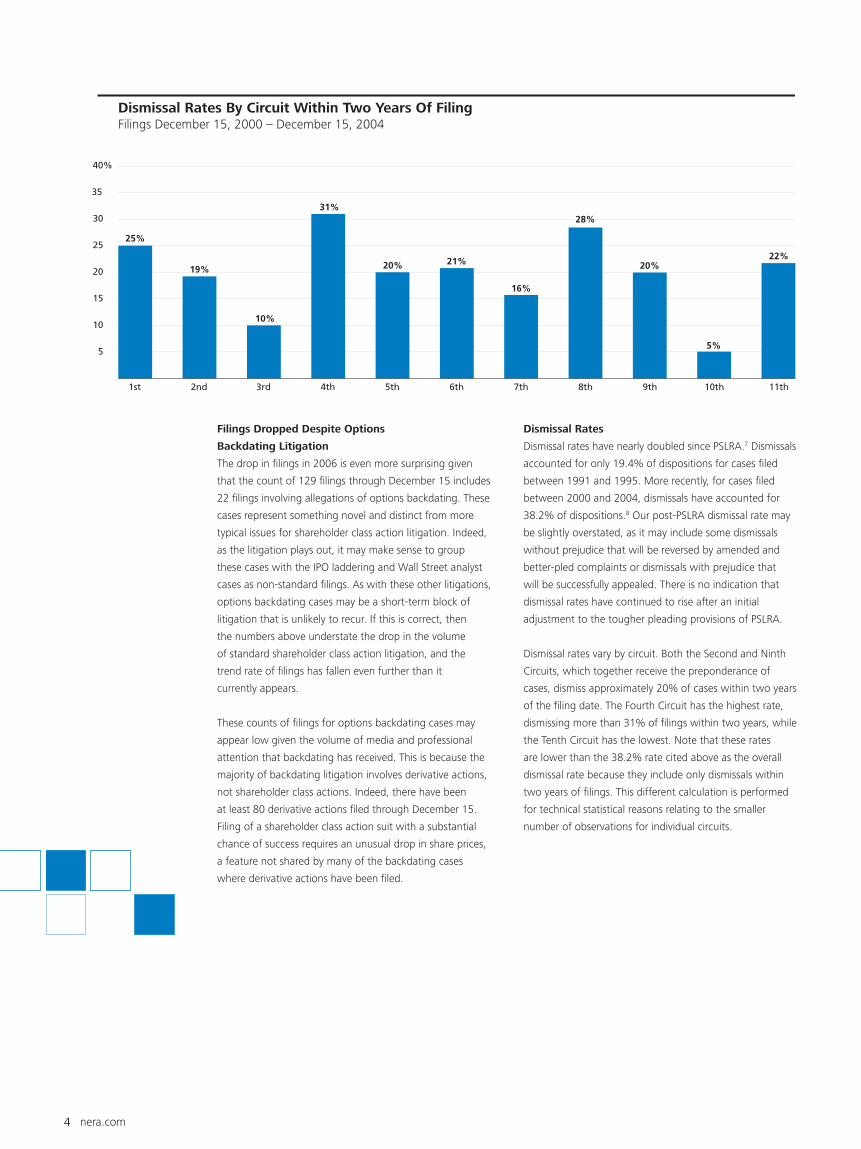
Dismissal Rates By Circuit Within Two Years Of FilingFilings December 15, 2000 – December 15, 2004
40%
35
30%
25%
20%
15%
10%
5%
1st
25%
2nd
19%
3rd
10%
4th
31%
5th
20%
6th
21%
7th
16%
8th
28%
9th
20%
10th
5%
11th
22%
Dismissal Rates
Dismissal rates have nearly doubled since PSLRA.7 Dismissals
accounted for only 19.4% of dispositions for cases fi led
between 1991 and 1995. More recently, for cases fi led
between 2000 and 2004, dismissals have accounted for
38.2% of dispositions.8 Our post-PSLRA dismissal rate may
be slightly overstated, as it may include some dismissals
without prejudice that will be reversed by amended and
better-pled complaints or dismissals with prejudice that
will be successfully appealed. There is no indication that
dismissal rates have continued to rise after an initial
adjustment to the tougher pleading provisions of PSLRA.
Dismissal rates vary by circuit. Both the Second and Ninth
Circuits, which together receive the preponderance of
cases, dismiss approximately 20% of cases within two years
of the fi ling date. The Fourth Circuit has the highest rate,
dismissing more than 31% of fi lings within two years, while
the Tenth Circuit has the lowest. Note that these rates
are lower than the 38.2% rate cited above as the overall
dismissal rate because they include only dismissals within
two years of fi lings. This different calculation is performed
for technical statistical reasons relating to the smaller
number of observations for individual circuits.

Top Ten Shareholder Class Action SettlementsAs of December 2006
Settlement
Value
Ranking Company Year ($MM)
1 Enron Corp.� 2006 $7,144
2 WorldCom, Inc. 2005 6,156
3 Cendant Corp. �� 2000 3,561
4 AOL Time Warner Inc. 2006 2,650
5 Nortel Networks (I) 2006 1,143
6 Royal Ahold, NV 2006 1,100
7 Nortel Networks (II) 2006 1,074
8 McKessson HBOC Inc. 2006 960
9 Lucent Technologies, Inc. 2003 517
10 BankAmerica Corp. and NationsBank Corp. 2002 490
� This is a partial settlement including only some defendants.
�� The settlement value incorporates a $374 million settlement in the Cendant PRIDES cases.
The Era of Mega-Settlements: Seven of the Ten
Largest Settlements Occurred in 2005-2006
In 2000, the $3.6 billion Cendant settlement dwarfed
all prior class action settlements.9 For the next four years,
no settlement would approach even one-fi fth of its size.
In 2005, however, Cendant lost its title as the largest
settlement, bumped by the $6.2 billion WorldCom
settlement. Now, in 2006, with only some of the
defendants settled, Enron’s $7.1 billion settlement has
already knocked WorldCom out of the top spot. In
fact, seven of the ten largest securities class action
settlements have occurred in 2005 and 2006.
These mega-settlements share a common feature: they
are associated with enormous “investor losses.” Investor
losses—an estimate of what investors lost over a class
period relative to an investment in the S&P 500—are the
single most powerful predictor of settlement size.10 Thus,
while eye-popping settlements have grabbed headlines
recently, their magnitude is not surprising in light of the
losses involved.11
In what will surely be chilling news to non-US issuers
already wary of being embroiled in US litigation, three of
the six 2006 settlements on the top ten list, two for Nortel
Networks of Canada and one for Royal Ahold NV of the
Netherlands, were by non-US companies. The larger of the
Nortel settlements exceeds the previous record for a foreign
issuer, Daimler-Chrysler, by a factor of more than three.
nera.com 5
Seven of the ten largest
securities class action
settlements have occurred
in 2005 and 2006.
Driven by Mega-Settlements, Average Settlement
Values Hit Post-PSLRA High
In 2006, average settlements rose 37% relative to 2005,
even excluding the partial Enron settlement and other
complete settlements over $1 billion (AOL Time Warner,
Royal Ahold NV, and Nortel Networks). Through
December 15, the average settlement, excluding the
settlements mentioned above, is approximately $34
million. If we include the settlements over $1 billion, the
average rises to $86.7 million. This average is even higher
than the 2005 average of $73.6 million, which included
the record-breaking WorldCom settlement. Note that
these averages do not include the Enron settlement
because not all parties in that litigation have settled.

6 nera.com
This sharp spike in average settlement values is driven by a shift in the distribution pattern of settlements: in 2006,
10% of settlements were “mega-settlements” of over $100 million. This is a marked difference from prior years,
when an average of only 3% of settlements crossed the $100 million threshold. Almost all of the increase in average
settlement values is associated with these very large settlements.
Mega-Settlements By Year (%)
10%
8
6
4
2
1991
1.1%
1992
1.7%
1993
0.0%
1994
1.5% 1.5%
1995
2.1%
1996 1997
0.0%
1999
2.0%
2000
2.8%
2001
2.3%
2002
4.1%
2003
5.2%
2004
3.4%
2005
6.4%
2006
10.0%
1998
1.8%
Average Settlement Value ($MM)
$35
30
25
20
15
10
5
Average: $11.5 MM Average: $24.3 MM
1996
$9
1997
$9
1998
$11
1999
$11
2001
$14
2000
$16
2002
$24
2005
$25
2004
$20
2006
$34
2003
$22
Note: The average settlement values exclude the 2000 Cendant, 2005 Worldcom, and the 2006 Royal
Ahold, AOL Time Warner, and two Nortel Networks settlements.
Note: We defi ne mega-settlements to be those exceeding $100 million.

nera.com 7
Median Settlement Value ($MM)
$8
7
6
5
4
3
2
1
Median: $4.7 MM Median: $6.2 MM
1996
$3.9
1997
$4.4
1998
$5.4
1999
$4.4
2001
$5.0
2000
$5.0
2002
$6.0
2005
$7.0
2004
$5.2
2006
$7.3
2003
$5.6
Median Settlements Continued to Rise in 2006
While average settlements tend to be dominated by the
very largest settlements, the median is more descriptive of
typical cases. Median settlements continued to rise in 2006,
hitting a new peak of $7.3 million.
Again, these median statistics are driven by the distribution
of settlement values. Settlements under $3 million remained
historically low, with 22% of 2006 settlements less than
or equal to $3 million compared to 44% of settlements in
1996. The 2006 results are similar to 2005, when 26% of
settlements resolved for less than $3 million.
Despite these higher averages, however, we fi nd no
statistically signifi cant change in settlement values since the
passage of SOX once we control for other factors, including
investor losses. Higher investor losses for more recently
resolved cases explain the rise in settlements, as we will
discuss further below.
Explaining Settlements
NERA has estimated a settlement prediction model that
explains over 60% of the variation in settlements, using
data on more than 600 settled cases fi led after January 1,
1996.12 This section discusses the sensitivity of settlement
values to various lawsuit characteristics; the sensitivity
measures described are calculated controlling for other
characteristics of the suit and remove the effect of overall
price infl ation.
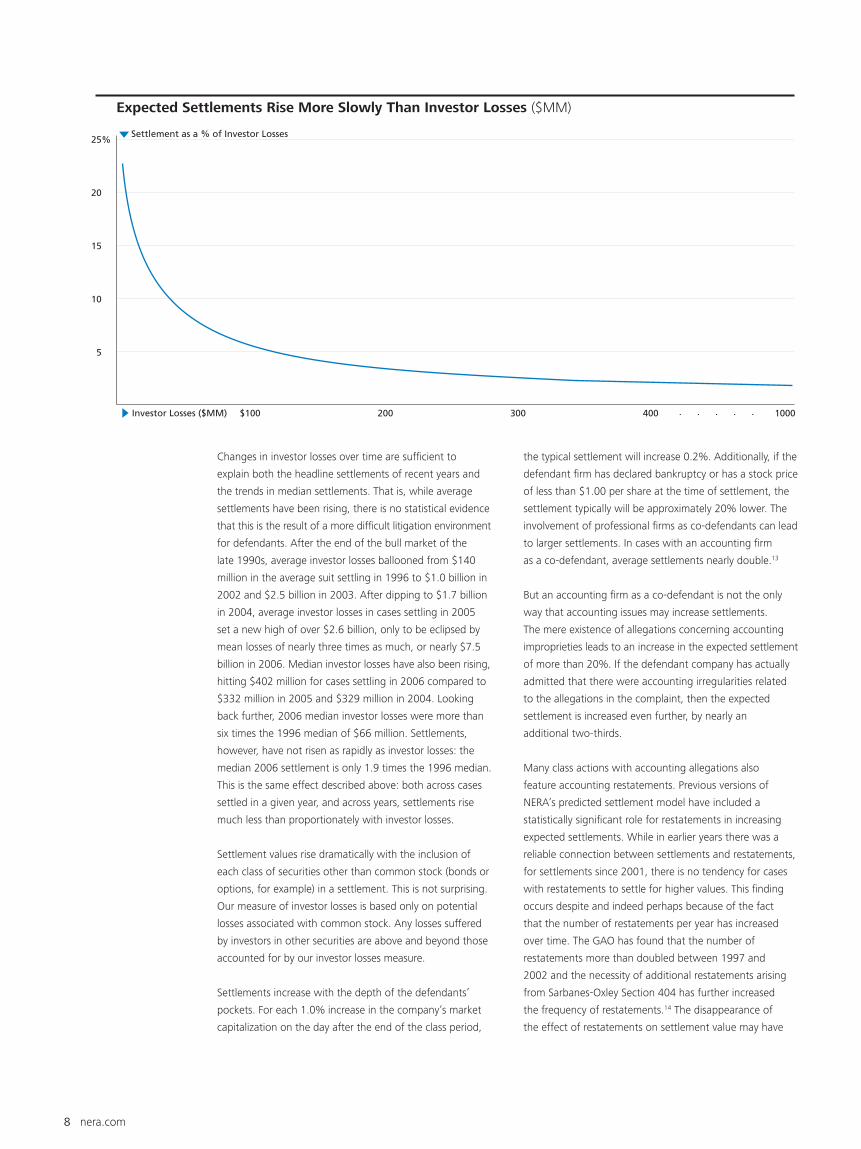
Investor losses constitute the single most powerful
publicly available determinant of settlements, explaining
approximately 50% of their variation. Settlements increase
far less than one-to-one with investor losses. A 1.0%
increase in investor losses results in a 0.4% increase in
the size of the expected settlement.
8 nera.com
Changes in investor losses over time are suffi cient to
explain both the headline settlements of recent years and
the trends in median settlements. That is, while average
settlements have been rising, there is no statistical evidence
that this is the result of a more diffi cult litigation environment
for defendants. After the end of the bull market of the
late 1990s, average investor losses ballooned from $140
million in the average suit settling in 1996 to $1.0 billion in
2002 and $2.5 billion in 2003. After dipping to $1.7 billion
in 2004, average investor losses in cases settling in 2005
set a new high of over $2.6 billion, only to be eclipsed by
mean losses of nearly three times as much, or nearly $7.5
billion in 2006. Median investor losses have also been rising,
hitting $402 million for cases settling in 2006 compared to
$332 million in 2005 and $329 million in 2004. Looking
back further, 2006 median investor losses were more than
six times the 1996 median of $66 million. Settlements,
however, have not risen as rapidly as investor losses: the
median 2006 settlement is only 1.9 times the 1996 median.
This is the same effect described above: both across cases
settled in a given year, and across years, settlements rise
much less than proportionately with investor losses.
Settlement values rise dramatically with the inclusion of
each class of securities other than common stock (bonds or
options, for example) in a settlement. This is not surprising.
Our measure of investor losses is based only on potential
losses associated with common stock. Any losses suffered
by investors in other securities are above and beyond those
accounted for by our investor losses measure.
Settlements increase with the depth of the defendants’
pockets. For each 1.0% increase in the company’s market
capitalization on the day after the end of the class period,
Expected Settlements Rise More Slowly Than Investor Losses ($MM)
25%
20%
15%
10%
5%
$100Investor Losses ($MM) 200 300 400 1000
Settlement as a % of Investor Losses
. . . . .
the typical settlement will increase 0.2%. Additionally, if the
defendant fi rm has declared bankruptcy or has a stock price
of less than $1.00 per share at the time of settlement, the
settlement typically will be approximately 20% lower. The
involvement of professional fi rms as co-defendants can lead
to larger settlements. In cases with an accounting fi rm
as a co-defendant, average settlements nearly double.13
But an accounting fi rm as a co-defendant is not the only
way that accounting issues may increase settlements.
The mere existence of allegations concerning accounting
improprieties leads to an increase in the expected settlement
of more than 20%. If the defendant company has actually
admitted that there were accounting irregularities related
to the allegations in the complaint, then the expected
settlement is increased even further, by nearly an
additional two-thirds.
Many class actions with accounting allegations also
feature accounting restatements. Previous versions of
NERA’s predicted settlement model have included a
statistically signifi cant role for restatements in increasing
expected settlements. While in earlier years there was a
reliable connection between settlements and restatements,
for settlements since 2001, there is no tendency for cases
with restatements to settle for higher values. This fi nding
occurs despite and indeed perhaps because of the fact
that the number of restatements per year has increased
over time. The GAO has found that the number of
restatements more than doubled between 1997 and
2002 and the necessity of additional restatements arising
from Sarbanes-Oxley Section 404 has further increased
the frequency of restatements.14 The disappearance of
the effect of restatements on settlement value may have

nera.com 9
Investor Losses Have Risen More Rapidly Than Settlements, But May Be Stabilizing
$450
400
350
300
250
200
150
100
50
1991
$54
1992
$96
1993
$62
1994
$63
1995
$85
1996
$66
1997
$93
1998
$119
1999
$108
2000
$158
2001 2003
Median Investor Losses ($MM)
2002
$302
2005
$332
2004
$329
2006
$402
Median Ratio of Settlement to Investor Losses (%)
8%
7
6
5
4
3
2
1
5.2%
4.8%
5.9%
5.8%6.1%
7.2%
5.6%
4.9%
4.8%
4.0%
3.4%
2.9%2.7%
2.8%
2.4%2.2%
$176
$215
occurred simply because restatements have become too
common to make their presence a factor that affects
settlement values.15
It is diffi cult to quantify the merits of the allegations in a
particular case. The strength of the merits is, of course,
normally a major point of contention between defense
counsel and plaintiffs’ counsel, underscoring the diffi culty
of objective measurement. As described above, admissions
of accounting irregularities are taken into account in our
model as one indicator of the merits of a case. We have
also found that cases with any kind of offi cial investigation,
consent decree, or penalty settle for, on average,
approximately 20% more than cases without any offi cial
action. This includes any announced investigation by any
offi cial body (SEC, the New York Attorney General’s Offi ce,
etc.) relevant to the allegations in the complaint. Although
many investigations result in no fi nding of fault, this broad
measure of offi cial action has greater predictive power for
settlement values than measures based on some actual
fi nding of fault.
One of Congress’s major goals for the PSLRA was to involve
institutional investors as lead plaintiffs, with the intention
that institutional investor plaintiffs play a more active role
in litigation and generate better outcomes for plaintiffs.
Cases with an institutional investor acting as lead plaintiff
settle for approximately one-third more on average. It is
impossible to judge whether this correlation refl ects the
actions of the lead plaintiff, or the nature of the cases in
which institutions choose to be lead plaintiffs. It could
be that institutional lead plaintiffs retain more effective
counsel, supervise counsel more effectively, or provide
an independent contribution to the plaintiffs’ strategy.
Alternatively, it could be that institutional investors choose
to become involved in cases where the allegations have
greater merit or the defendants’ capacity to pay is greater.
This would only be true to the extent that the merit or
capacity to pay is not fully captured by other variables in
the statistical model.
Settlements increase by an average of approximately
one-third if an IPO is involved. Such cases involve potential
Section 11 claims, which have a lower burden of proof for
plaintiffs than the accompanying 10b-5 claims.

10 nera.com
Changes in investor losses
over time are suffi cient to
explain both the headline
settlements of recent years
and the trends in median
settlements. That is, while
average settlements have
been rising, there is no
statistical evidence that
this is the result of a more
diffi cult litigation environment
for defendants.

nera.com 11
8 Because it is not uncommon for judges to take up to two years
from the fi ling date to rule on motions to dismiss, it would be
premature to evaluate dismissal rates of cases fi led in 2005-2006.
The increase in dismissals is statistically signifi cant.
9 Including the $374 million Cendant PRIDES settlements.
10 We use investor losses as a proxy for the damages estimates
presented by plaintiffs’ side prior to settlement because we
generally do not have access to plaintiffs’ fi gures.
11 This is not to suggest that these settlements are necessarily fair
or reasonable. Our measure of investor losses does not take
into account any of the merits of the case.
12 Technically, the model explains over 60% of the variation of the
logarithm of settlement values. The current version of the predicted
settlement model contains cases settled through June 15, 2006.
13 Settlement values throughout this report are taken to be the total
settlement from all defendants.
14 GAO 03-138, Financial Statement Restatements: Trends, Market
Impacts, Regulatory Responses, and Remaining Challenges,
October 2002.
15 As with all of the other estimates described in this section, the
measured effect is conditional on other features of the case.
Thus, the correct interpretation of the fi nding of no effect from
restatements is that given other features of the case, including
the presence of accounting allegations, irregularities, or
accounting co-defendants, there is no additional role for
restatements in explaining settlements.
1 This edition of NERA’s research on recent trends in securities class
action litigation expands on previous work by our colleagues Lucy
Allen, Elaine Buckberg, Frederick C. Dunbar, Vinita M. Juneja,
Denise Neumann Martin, and David I. Tabak. We gratefully
acknowledge their contributions to previous editions as well as
this current version. In addition, the authors thank Brian Saxton
for coordinating the research effort and Inna Bruter, Dean Chang,
Rachel Herbold, Stacey-Ann Johnson, Janeen McIntosh, Plamen
Petkov, Sheena Siu, Steven Towler, and Ivelina Velikova for further
assistance. These individuals receive credit only for improving this
paper; all errors and omissions are ours.
2 The four 2006 settlements were AOL Time Warner, Royal Ahold,
and the two Nortel Networks settlements. In the table of top
settlements, Enron is dated as 2006 because litigation continues,
but there have been no important new settlements related to Enron
in 2006. Unless otherwise noted, data on settlements and fi lings in
this report are as of December 15, 2006.
3 The post-PSLRA average is calculated for the period from 1998
to 2005, and therefore excludes 1996 and 1997. A large drop
in federal fi lings occurred in those year as plaintiffs fi led in state
courts to avoid the restrictions of PSLRA, making them atypical.
Standard fi lings for the period 1998 to 2005 are defi ned to
exclude laddering, analyst, and mutual fund market timing cases.
4 Ronald I. Miller, Todd Foster, and Elaine Buckberg, Recent Trends in
Shareholder Class Action Litigation: Beyond the Mega-Settlements, is
Stabilization Ahead?, NERA Economic Consulting, April 2006.
5 Excepting the DC circuit, which saw its typical level of just two
fi lings this year.
6 The probability of not facing a suit is 98.4% per year. Assuming
that the probability of facing a suit in each year is independent and
compounding over fi ve years yields a 92.1% chance of no suit, or
a 7.9% chance of at least one suit, in fi ve years. The 2004-2006
fi ling rate is based on the number of fi lings projected for all of 2006.
7 Our dismissal statistics include summary judgments but exclude
partial dismissals.
End Notes
We have investigated whether defendants in different
industries end up paying signifi cantly different settlements.
Only in the health services sector do defendants pay
markedly different settlements, typically one-third higher
than in other industries. This fi nding may relate to the
existence of concurrent billing fraud allegations against
health services companies brought under the federal
False Claims Act.
Conclusion
In 2006, two divergent trends observed in 2005 have
continued. The sharp decline in federal fi lings, which began
in mid-2005 and was particularly apparent in the Ninth
Circuit, has persisted and accelerated in 2006, spreading
to all of the other circuits. The relatively smaller decline in
the Second Circuit suggests that the overall decline is
not the result of the passage of SOX and an associated
benefi cial effect on corporate governance, however.
Until the root causes can be understood, the durability
of this decline remains in doubt.
The era of mega-settlements ushered in by WorldCom
and the Enron partial settlement in 2005 has also
continued into 2006, with the AOL Time Warner, Royal
Ahold, and Nortel settlements leading the way. These
mega-settlements have increased as a proportion of all
settled cases, driving up average settlement values. It
seems likely that such large settlements will continue for
at least the near future, as cases with enormous investor
losses continue to work through the court system.

12 nera.com
About NERA
NERA Economic Consulting is an international fi rm of economists who understand how
markets work. We provide economic analysis and advice to corporations, governments, law
fi rms, regulatory agencies, trade associations, and international agencies. Our global team
of more than 600 professionals operates in over 20 offi ces across North and South America,
Europe, Asia, and Australia.
NERA provides practical economic advice related to highly complex business and legal issues
arising from competition, regulation, public policy, strategy, fi nance, and litigation. Our
more than 45 years of experience creating strategies, studies, reports, expert testimony, and
policy recommendations refl ects our specialization in industrial and fi nancial economics.
Because of our commitment to deliver unbiased fi ndings, we are widely recognized for our
independence. Our clients come to us expecting integrity and the unvarnished truth.
NERA Economic Consulting (www.nera.com), founded in 1961 as National Economic
Research Associates, is a unit of Mercer Specialty Consulting, an MMC company.
Contact Information
Todd Foster
Vice President
NERA Economic Consulting
Two Logan Square
Suite 800
Philadelphia, PA 19103
Tel: +1 215 864 3876
Fax: +1 215 864 3840
Dr. Ronald I. Miller
Senior Consultant
NERA Economic Consulting
1166 Avenue of the Americas
34th Floor
New York, NY 10036
Tel: +1 212 345 3141
Fax: +1 212 345 4650
Dr. Stephanie Plancich
Senior Consultant
NERA Economic Consulting
1166 Avenue of the Americas
34th Floor
New York, NY 10036
Tel: +1 212 345 7719
Fax: +1 212 345 4650


Visit www.nera.com to learn
more about our practice areas
and global offi ces.
© Copyright 2007
National Economic Research
Associates, Inc.
All rights reserved.
Printed in the USA.
SEC1288-G03


