6
brandingbrand.com MOBILE COMMERCE INDEX JANUARY 2015 BRANDING BRAND
| Date post: | 17-Jul-2015 |
| Category: |
Mobile |
| Upload: | branding-brand |
| View: | 210 times |
| Download: | 1 times |

brandingbrand.com
MOBILE COMMERCE INDEX
JANUARY 2015
BRANDING BRAND

2VISITS
brandingbrand.com
In January 2015, mobile devices generated 53% of all online visits, an 18% increase from January 2014.
JAN2014 27%
45%
18%
Mobile
TabletSmartphoneTotal Visits: 155,521,235
55%
Desktop
38%
53%
15%
Mobile
TabletSmartphoneTotal Visits: 157,419,344
JAN2015
47%
Desktop
Compared to January 2014, desktop’s share of total online visits decreased 15%; smartphone’s share increased 41%.
YEAR-OVER-YEAR CHANGE IN MARKET SHARE
Data Used50 U.S. Mobile Sites on Branding Brand’s Platform; January 1 - 31, 2014 & 2015
Desktop
15%Tablet
17%Smartphone
41%
brandingbrand.com
REVENUE 3
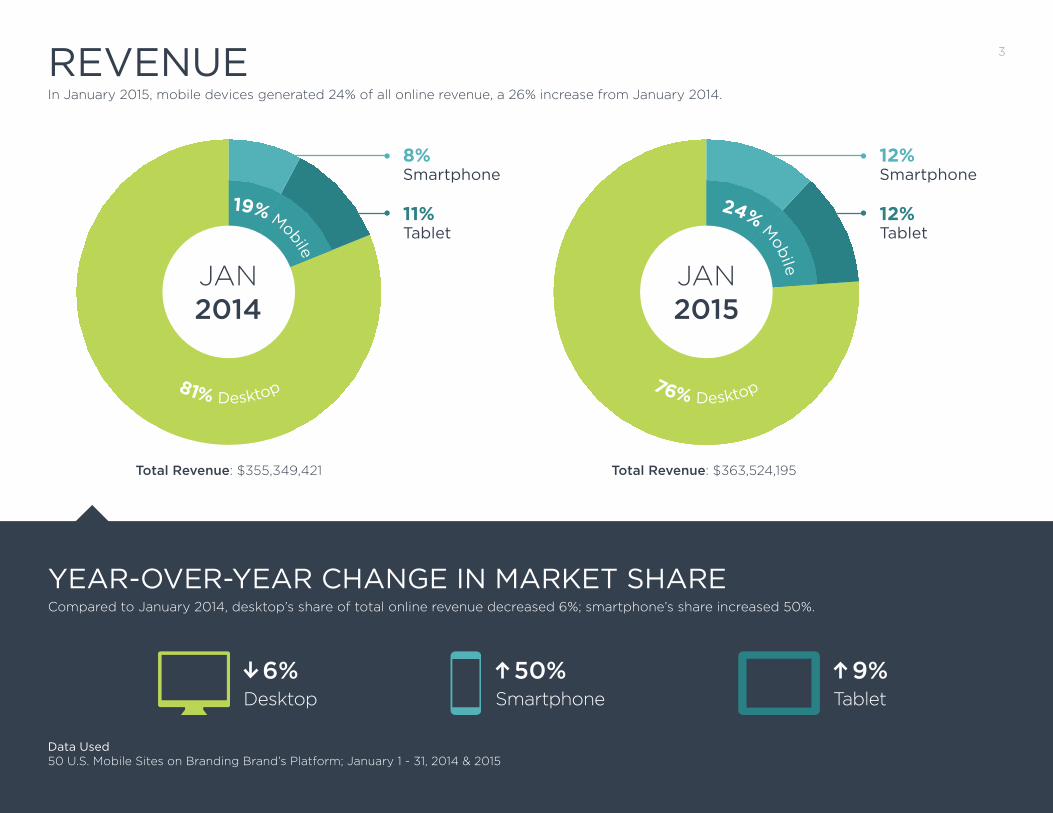
In January 2015, mobile devices generated 24% of all online revenue, a 26% increase from January 2014.
Compared to January 2014, desktop’s share of total online revenue decreased 6%; smartphone’s share increased 50%.
YEAR-OVER-YEAR CHANGE IN MARKET SHARE
Desktop
6%Tablet
9%Smartphone
50%
Total Revenue: $355,349,421
81% Desktop
19% Mobile
JAN2014
8%Smartphone
Tablet11%
Total Revenue: $363,524,195
76% Desktop
24% M
obile
JAN2015
12%Smartphone
Tablet12%
Data Used50 U.S. Mobile Sites on Branding Brand’s Platform; January 1 - 31, 2014 & 2015

4
brandingbrand.com
YEAR-OVER-YEAR CHANGE IN GROWTH RATE
Desktop
3%Tablet
10%Smartphone
30%
CONVERSION
JANUARY 2014 JANUARY 2015
3.03%
Desktop DesktopSmartphone SmartphoneTablet Tablet
3.13%
0.99%
2.24%
0.76%
2.04%
In January 2015, the average mobile conversion across all industries was 1.62%, a 16% increase from January 2014.
Compared to January 2014, smartphone conversion increased 30%.
Data Used50 U.S. Mobile Sites on Branding Brand’s Platform; January 1 - 31, 2014 & 2015

5
1 A.M. 5 A.M. 9 A.M. 1 P.M. 5 P.M. 9 P.M.
A DAY IN MOBILE SHOPPINGThroughout January 2015, daily smartphone and tablet visits peaked at 9:00 P.M. EST. Revenue peaked at 10:00 P.M. for smartphones and 9:00 P.M. for tablets.
1 A.M. 5 A.M. 9 A.M. 1 P.M. 5 P.M. 9 P.M.
VISITS REVENUE
brandingbrand.com
U U $ $
A WEEK IN MOBILE SHOPPING
Data Used100 U.S. Mobile Sites on Branding Brand’s Platform; January 1 - 31, 2015
SMARTPHONE
9:00 P.M. ESTSMARTPHONE
10:00 P.M. ESTTABLET
9:00 PM ESTTABLET
9:00 P.M. EST
MON TUES FRI SATTHURSWEDSUN
U $ U $
In January 2015, Sundays produced more visits and revenue than any other day of the week, for smartphones as well as tablets.

6QUICK HIGHLIGHTS
brandingbrand.com
ABOUT THE MOBILE COMMERCE INDEX
The Branding Brand Mobile Commerce Index (MCI) is the largest collection of data on retail websites specifically designed for mobile devices. Each month at blog.brandingbrand.com, the Index identifies commerce and consumer trends across samples of Branding Brand clients in various industries, including apparel, health and beauty, and home goods.
In total, Branding Brand’s platform powers the mobile websites and apps of over 200 major retailers around the world.
• In January 2015, mobile devices generated 53% of all online visits. (pg 2)
• In January 2015, mobile devices generated 24% of all online revenue. (pg 3)
• Compared to January 2014, smartphone conversion increased 30%. (pg 4)
• Compared to January 2014, desktop’s share of total online visits decreased 15%; smartphone’s share increased 41%. (pg 2)
• Compared to January 2014, desktop’s share of total online revenue decreased 6%; smartphone’s share increased 50%. (pg 3)
• Throughout January 2015, daily smartphone and tablet visits peaked at 9:00 P.M. EST. (pg 5)
• In January 2015, Sundays produced more visits and revenue than any other day of the week, for smartphones as well as tablets. (pg 5)
• In January 2015, the average mobile conversion across all industries was 1.62%. (pg 4)


