January 2015 LOCAL WATER SECTOR GOVERNANCE IN TANZANIA Mapping monitoring and evaluation actors, activities and use in two villages of Mzumbe Ward (Mvomero District, Morogoro Region) Preliminary Findings Nathalie HOLVOET, Liesbeth INBERG and Katrien VAN AELST Institute of Development Policy and Management, University of Antwerp Elisabeth LULU and Yona MATEKERE Institute of Development Studies, Mzumbe University, Tanzania
Transcript
January 2015
LOCAL WATER SECTOR GOVERNANCE IN TANZANIA
Mapping monitoring and evaluation actors, activities and use in two villages of Mzumbe Ward (Mvomero District, Morogoro Region)
Preliminary Findings
Nathalie HOLVOET, Liesbeth INBERG and Katrien VAN AELST Institute of Development Policy and Management, University of Antwerp
Elisabeth LULU and Yona MATEKERE Institute of Development Studies, Mzumbe University, Tanzania
2
Table of Contents 0. Preface ................................................................................................................................. 4
1.List of abbreviations ....................................................................................................................... 71
4
0. Preface
This report presents selected preliminary findings from a joint (north-south) research that takes place within the context of the VLIR-UOS funded programme (the Gre@t programme) of interuniversity cooperation among Flemish universities and the rural-based Mzumbe University (Tanzania)1. This six-year programme (2013-2018) aims at strengthening the teaching, research and service delivery capacity of Mzumbe University staff while exchange and joint activities also enrich the academic activities and outputs of Flemish partner universities. The programme consists of four projects situated in the areas of institutional strengthening of academic skills (project 1), strengthening of ICT (project 2), strengthening of academic capacities, activities and outputs in the area of local governance (project 3) and entrepreneurship (project 4). This specific study is situated under project 3 and aims at building research capacity and output in the area of local governance through joint research between Flemish and Tanzanian researchers. The findings of the study will also be disseminated to the actors involved in local water governance (the interviewees of the study) and may be useful to design possible interventions that aim at improving local water governance in rural villages. This study draws upon primary data collected through preliminary village studies, a household survey and semi-structured interviews with actors directly and indirectly involved in water sector service delivery and governance. We would like to thank the staff and research assistants involved in data collection as well as all interviewees. The household survey was mainly administered by Katrien Van Aelst who is funded under the University of Antwerp research project ‘The interplay between household decision-making, gender relations and climate variability in Morogoro Region, Tanzania. Insights from the water sector’.
1 See http://vlir-uos.mzumbe.ac.tz for more information on the programme.
5
1. Introduction
In order to improve local service delivery the government of Tanzania has elaborated a number of reform policies and programmes, including the Tanzania Local Government Reform Programme. Under this programme a set of new mechanisms has been designed to improve governance of local service delivery. These mechanisms are both targeted at the supply and demand side of service delivery and include amongst others the use of all types of monitoring and evaluative (M&E) activities. ‘Evaluation’ is generally defined as ‘the systematic and objective assessment of an ongoing or completed project, programme or policy, its design, implementation and results’ (OECD/DAC, 2002: 20) while ‘monitoring’2 is understood as ‘a continuous management function that uses systematic collection of data on specified indicators to provide management and the main stakeholders of an ongoing development intervention with indications of the extent of progress and achievements of objectives and progress in the use of allocated funds’ (OECD/DAC, 2002: 28). While ‘monitoring’ and ‘evaluation’ are clearly distinct activities, they are highly complementary. Quoting Kusek and Rist (2004: 13), ‘evaluation is a complement to monitoring in that when a monitoring system sends signals that the efforts are going off track then good evaluative information can help clarify the realities and trends noted with the monitoring system’. The basic functions of M&E are, on the one hand, the fulfilment of ‘ accountability’ towards funders, taxpayers and citizens, and, on the other hand ‘ lesson learning’ and ‘feedback’ towards management and policy makers3. M&E activities can be categorised according to several criteria, including amongst others the moment at which they take place (before, during, after an intervention), the methods being used (quantitative, qualitative, mixed), the actors involved or taking the lead (internal, external, participatory), the focus (implementation, results), etc. As regards the specific topic under study, in particular the distinction between:
inside government top-down (vertical downward) or horizontal types of M&E activities (such as routine M&E through sector management information systems, performance reviews, district league tables, supervision, inspection, audit, district league tables, and performance related incentives, etc.)
outside government bottom up (vertical upward) M&E initiatives. These also often labelled social accountability initiatives, including initiatives led by citizens such as user committees or user associations and initiatives led by NGOs, media, etc.
more hybrid forms of combined initiatives (such as participation of CSOs in government-led performance reviews)
Besides these types of M&E activities, there are also the more traditional ‘political’ ways in which government and service delivery entities can be held accountable, for instance in democratic systems citizens hold politicians and policy-makers accountable through elections or they can contact them with complaints, etc. (bottom up/vertical upward representative accountability). Politicians themselves can try to hold administration (service delivery entities) accountable (top-down/vertical downward political accountability)4. There might also exist combinations of the above mentioned M&E initiatives and the more traditional political accountability mechanisms. Citizen-led initiatives or NGOs can for instance transfer information from their M&E activities to politicians who can draw upon this information in their efforts to hold administration accountable. Previous research has not led to unequivocal conclusions with respect to the functioning and effectiveness of different M&E mechanisms (see e.g. Bruns et al., 2012; Gaventa and McGee, 2013; Mc Gee and Gaventa, 2011). In short, while there are various studies that report positive results of
2 Monitoring is thus rather descriptive and assesses whether different levels of an intervention (inputs,
activities, outputs, outcomes and impact) are realised as expected, whereas evaluation necessitates more analytical depth to tackle the ‘why’ questions. 3 In line with the two-fold function of monitoring and evaluation, an alternative (and less technical) label for
‘M&E’ mechanisms is ‘accountability and learning’ mechanisms. 4 See Lindberg, S. (2013) for an overview of different (sub)types of accountability.
6
top-down M&E instruments which are often inspired by the New Public Management (NPM) paradigm (see e.g. Basinga et al., 2011), others show that instruments such as performance-based finance (PBF) or pay for performance (P4P) lead to misreporting and a unique focus on those issues that are captured in targets at the expense of services that are not included (i.e. crowding out) (see e.g. Ireland et al., 2011). A major element of criticism is that NPM-type of reforms are often blueprint, not locally grounded nor owned as they do not start from an analysis of local political, economic and cultural realities which influence the implementation and effectiveness of such type of reforms (see e.g. Therkildsen, 2000). As to address the failure and limitations of NPM-type of reforms, community based approaches have been propagated starting from the assumption that these enhance local ownership, trigger transparency and accountability, eventually increasing the quantity and quality of local service delivery (see e.g. Björkman and Svensson, 2009; Deiniger and Mpuga, 2005). However, others are more nuanced and emphasize that the details of the local setting, the degree of inclusiveness and the way citizens are given a chance to participate are crucial to arrive at results (see e.g. Pritchett et al., 2010). In line with this are studies that highlight the limited enforceability of bottom-up initiatives (see e.g. Olkon, 2007; Lassibille et al., 2010), hinting at the fact that they are best used in combination with top-down within-state accountability mechanisms (such as performance-based systems, supervision, regulatory services; some also refer in this respect to combinations of ‘hard’ top-down and ‘soft’ bottom-up incentives) (see Golooba-Mutebi, 2005, 2012; Mitchell and Bossert, 2010). More specifically, the importance of creating interfaces and bridges among citizen-driven and state-driven accountability mechanisms is often put into the picture as a way to increase effectiveness. Finally, there are also scholars (see Kelsall, 2003) who focus on ‘traditional’ localized ways and rituals for ensuring accountability (such as cursing, witchcraft, etc.) which are considered to be more effective than the ‘imported’ mechanisms of bottom-up and top-down accountability. Against this background of inconclusive, at times contradictory, evidence, this research focuses on the functioning and effectiveness of different M&E mechanisms in the water and education sector in selected villages surrounding Mzumbe University. More specifically, the aim is i) to map and (comparatively) analyse different types of M&E mechanisms and their (perceived) functioning in the water and education sector, ii) to map and analyse the use of M&E information for accountability and learning by different actors involved, iii) to analyse the amount and quality of water and education service delivery and explore possible linkages with M&E mechanisms, iv) to analyse different citizens’ service use and satisfaction as well as citizens’ accessibility to and perceived quality of information related to water and education services. The selection of education and water has mainly been guided by the fact that in citizen satisfaction surveys (primary) education is the service that mostly stands out as best rated, probably due to an enormous increase in enrolment from 2000 to 2006 (from 4.4 million to 8 million, see Ministry of Planning, Economy and Empowerment and the National Bureau of Statistics, 2007) and the abolition of school fees in 2001 while water services are generally considered among the worst performing sectors and improved water supply as the most urgent need (see Braathen et al., 2005). There are also specific concerns regarding accountability and learning in the water sector, as the substantial increase in expenditure between 2000 and 2012 has not been translated in increased quantity and quality of water service delivery (see also Twaweza, 2014). Before we explore and analyse this sector comparative perspective in future studies, this specific report sets out with mapping different types of M&E mechanisms in the water sector in two selected villages around Mzumbe University (Changarawe and Vikenge). Additionally, we describe and analyse the use of M&E information for accountability and learning as perceived by actors who are involved in M&E (M&E supply side) and those who are at the receiving end (M&E demand side). Finally, we bring in citizens’ use of water services, their perceived quality of water services as well as their accessibility to water-related information and their appreciation of its quality. This mapping exercise
7
of M&E and governance mechanisms is not only theoretically interesting, it is also highly policy relevant as it is increasingly acknowledged that problems in the water sector, and particularly lack of sustainability, are more related with institutional/governance issues then with technicalities. Mapping what mechanisms currently exist in the sector is relevant as it is increasingly demonstrated that small incremental changes to existing M&E (and governance) mechanisms are more feasible that imposing blueprints from the outside (see e.g. Santiso, 2008; North, 1990). As set out in section three, we draw upon various data sources, including secondary data as well as primary data collected through exploratory interviews with key persons, quasi-structured interviews with actors involved in water governance at village, ward and district level as well as a household survey in the villages of Changarawe and Vikenge. The presentation of selected findings has mainly been guided by Ostrom’s Institutional Analysis and Development Framework (IAD) (Ostrom et al., 1994). We consider the IAD particularly useful as it strongly relates to the idea that context-related factors influence the outlook and the effectiveness of different M&E practices and outcomes. More particularly, IAD helps to unveil how material conditions, formal policies and directives as well as informal rules-in-use, govern incentive structures underlying the behaviour and interaction of different actors involved in the supply of and demand for M&E activities and outputs in the two villages. This type of institutional analysis helps us to understand the prevailing bottom-up and top-down M&E practices, their interlinkages and functioning as well as the use that is being made of M&E outputs and information for accountability and learning. Such an approach is particularly useful in the water sector where a tendency exists to focus on formal administrative structures, neglecting the importance of contextually grounded incentives that influence the behaviour of the different actors involved (see also Stein et al., 2011; UNDP, 2013). The structure of the report is as follows: we start with a short presentation of the conceptual framework and give a brief account of data collection, case selection and setting in section 3. Sections 4 to 8 present findings structured alongside our conceptual framework and deal subsequently with bio-physical conditions (4), the formal and informal rules in use (5) and community attributes (6). Section 7 introduces the different actors involved in rural water service delivery, accountability and learning mechanisms, maps the M&E activities and outputs from the perspective of the actors involved while also a brief account is given from a citizens’ point of view. Section 8 provides an overview of the different types of use of M&E information, as perceived by the water governance actors involved in the supply and demand of M&E information. In section 9 a summative overview is given of the main findings related to the action arena and the use of M&E, subdivided over M&E by the Community Owned Water Supply Organisation (COWSO, as service delivery unit), top-down, bottom-up M&E and M&E by local media. In explaining findings regarding M&E activities, outputs and use, the influence of contextual factors that shape different actors’ incentive structures is explored. Additionally, possible linkages to water performance outputs are highlighted while also issues for further research are pointed out.
8
2. Conceptual framework
The IAD framework was initially developed by a group of social scientists as a tool for policy analysts to evaluate policy design and interventions (Polski and Ostrom, 1999). The framework has been applied to various topics, including development cooperation (Ostrom et al., 2001), but it is particularly popular in the area of natural resource management (NRM) where it is used to analyse the performance of different NRM institutional arrangements as well as to understand how change is enabled or resisted (see e.g. Blackstock and Carter, 2007). The framework (visualised in figure 2.1) starts by specifying exogenous factors, including physical and material conditions, community attributes and rules-in-use, as these are considered to have significant implications for policy design, politics and collective action, all of which are crucial elements of the policy making process. The action arena is the focus of policy analysis and design, as this is where policy action takes place. Within the action arena, actors inform themselves, consider alternative courses of action, make decisions, take action and experience the consequences of these actions. Their actions are influenced by the physical and material conditions, the community attributes and the rules-in-use that were previously specified. Next, the patterns of interaction are considered to flow logically from the behaviour of the actors defined in the action arena. In this specific subcomponent of the framework the structural characteristics of an action situation and the behaviour of participants in the resulting structure are analysed. Finally, patterns of interaction are thought to produce the outcomes (Polski and Ostrom, 1999). Figure 2.1. The Institutional Analysis and Development framework
exogenous factors
Source : Ostrom et al. (1994)
The framework can be applied in different ways, either by examining the outcomes and then moving backwards to the physical and material conditions, the community attributes and the rules-in-use, or
Physical and material conditions
Patterns of interaction
Action arena: actors, positions,
actions
Community attributes
Outcomes
Rules-in-use: formal and
informal
9
conversely by starting from these latter building blocks and moving forwards to finish with an analysis of the outcomes. The first approach is more suitable for analysing established policy situations, while the second approach is more apt for the analysis of new policy initiatives (Polski and Ostrom, 1999). In this paper we take the exogenous factors at play as our starting point (sections 4 to 6), after which we focus on the action arena where different actors intervene in M&E activities related to the water sector (section 7) and shift then in section 8 towards the use of M&E water information. As explained in section 8 we draw upon the existing literature on use/influence of M&E and distinguish among conceptual and instrumental use of M&E in the water sector, whereby the latter refers to use of M&E findings and processes for effective changes in water policies and practices and the former to contributions of M&E to new ideas, awareness raising, etc. Additionally, we also differentiate among changes related to water sector service (quantity & quality of services), strategic (budgets, revenue collection) and structural (priority setting, access to decision-making) power issues. As visualised in Figure 2.2., contextual factors are thought to shape incentives of actors which influence M&E activities and the use of M&E information (section 9). Finally, we consider processes to be iterative and dynamic with changes in use of M&E information affecting contextual variables as well as the action arena. Figure 2.2. Conceptual Framework
CONTEXT
Source : based on Ostrom et al. (1994)
Physical and material conditions (4)
Inputs, activities and outputs of water sector
Action arena (7) Service unit level
(COWSO), top-down & bottom up M&E
actors, activities and outputs in water
sector
Formal (5.1) and Informal rules (5.2) in use
(water) policies and implementation,
corruption, clientelism
Use of M&E (8) -conceptual and instrumental
use -use for changes related to
water sector service, strategic and service power issues
Community attributes (6)
Political, governance, socio-economic,
cultural, religious context
Contextually grounded incentives (9)
10
3. Methodology
3.1 Data collection
Our research draws upon secondary data, including official documents of the government of Tanzania (e.g. policies on decentralisation and water), the water point mapping (WPM) database (www.wpm.maji.tz), academic and grey literature on Tanzania’s water sector, as well as primary data. Primary data collection was organised in four different rounds: early 2013 baseline data was collected on village characteristics and quality of governance as perceived by citizens and village leaders in three villages (Tangeni, Changarawe and Vikenge) surrounding Mzumbe University (Makombe et al., 2012). This round of data collection fed into the selection of our two case study villages (see below) where additional data was gathered on general village characteristics and community attributes in April-May 2014 (Matekere and Van Aelst, 2014). At this stage, a list of actors involved in water (and education) governance at village (Charangawe and Vikenge), ward (Mzumbe) and district (Mvomero) level was drafted. In July 2014 structured interviews were organised with heads or representatives of these actors situated at different levels. In total 34 interviews were conducted with actors involved in the water sector covering issues related to organisation attributes, lines of reporting, M&E activities, outputs and perceived use of M&E information that was produced and/or received by different actors. Additionally, perceived changes in the quantity and quality of M&E activities and use were captured as well as the possible reasons for changes (if any). Data collection on use distinguishes between the conceptual use of M&E for awareness raising among different stakeholders (including citizens) and instrumental use to bring about changes. The latter is further disaggregated alongside changes at service level (e.g. availability of services, quality of services, sanctioning of actors and users), strategic level (e.g. budget allocation between sectors and within the water sector, revenue collection) and structural level (e.g. priority setting, access to decision-making)(see also section 8). This round of data collection also registered personal characteristics of the interviewees (level of education, tribe, religion, residence, etc.), the formal and informal relationships and networks among actors as well as the level of influence actors have on each other’s thinking and acting in the area of rural water governance. Finally, in July and August 2014, household surveys were undertaken with a random sample of 129 and 116 households living in Changarawe and Vikenge respectively. Our response rate was approximately 98% while sample rates are difficult to calculate as there is no recent information about the number of households in the two villages. The most recent Population and Housing Census of Mvomero District (2012) estimates the total population in Changarawe and Vikenge at 5271 and 2175 respectively. On the basis of this information, we estimate the sample rates for Changarawe and Vikenge around 10% and 25% respectively. In 73 of the 129 Changarawe households, both husband and wife were interviewed (separately), and the remaining 56 households were single-headed households where the household head was interviewed. In Vikenge, both husband and wife were interviewed in 81 of the 116 households, in 34 single-headed households the household head was interviewed, and in 1 household 1 men and 2 women were interviewed. In total 112 and 107 women were interviewed and 90 and 92 men in Changarawe and Vikenge respectively. Household surveys collected information on personal and household characteristics, access and quality of water (and education) services, availability and quality of information regarding services, etc. In this report we mainly draw upon secondary data and primary data collection from the village studies, the structured interviews with actors involved in rural water governance and the household survey. Findings related to education sector governance are presented and discussed in Holvoet et al. (2015b).
11
3.2 Case selection and location
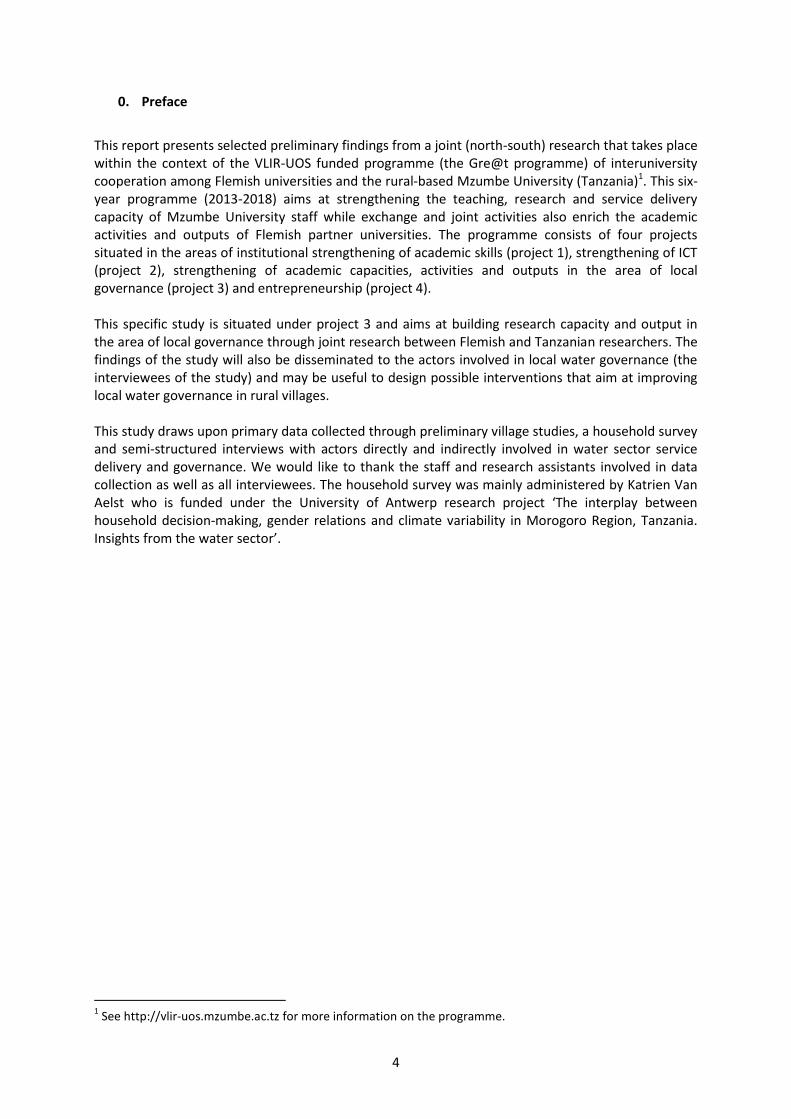
Case selection was guided by different elements and took place in different steps. First, the selection of ‘villages surrounding Mzumbe University’ was influenced by the broader context of the interuniversity collaboration. As to further narrow down the research setting, discussions took place with key informants who are familiar with the basic characteristics of the surrounding villages and the (perceived) quality of local governance. Based on these discussions, a first round of exploratory data collection took place in three villages (Tangeni, Changarawe and Vikenge) collecting data on basic village characteristics, availability and quality of water and education resources, quality of governance as perceived by citizens and heads of village councils. While each of the villages are interesting settings for case study research and comparative analysis among the education and water sector, initial analysis of the three villages highlighted a number of similarities and differences among the three villages in terms of bio-physical conditions and community attributes whose possible influence on water (and education) governance is interesting to further explore from a comparative village perspective. Finally, time and resource constraints led to the withdrawal of Tangeni, which is located furthest away from Mzumbe University. Changarawe and Vikenge are located in Mzumbe Ward, one of 17 wards5 of Mvomero District, which is itself one of the 7 districts of Morogoro region6. Map 1 highlights the location of Morogoro Region and Mvomero District while Map 2 showcases the latest available version of Mvomero District Map. This map does not include Mzumbe ward as it was still part of Mlali ward at the moment the district map was drawn. More details on the selected villages as well as Mzumbe Ward, Mvomero District and Morogoro region is included in sections 4 to 6. Map 1. Location of Morogoro region and Mvomero District
5 The other 16 wards are Bunduki, Diongoya, Doma, Hembeti, Kanga, Kibati, Kikeo, Langali, Maskati, Melela,
Mhonda, Mlali, Mtibwa, Mvomero, Sungaji, Tchenzema. 6 The other 6 districts are Gairo (since March 2012), Kilombero, Kilosa, Morogoro Rural District, Morogoro
Urban District and Ulanga.
12
Map 2. Mvomero District Map
Source: Mvomero District
3.3 Limitations
This study has been constrained by the limited availability of secondary information on rural water governance, and more particularly monitoring and evaluative activities, in the specific villages under study. Our study findings are thus largely based upon our own primary data collection without much room for triangulation with similar studies’ findings. Data collection regarding M&E activities, quality or outputs and use of M&E outputs is to a large extent based upon self-report by the actors involved, which has obviously introduced a bias in our findings. However, we tried to reduce bias through cross-checking and triangulation among different respondents’ answers whenever possible. We have as well deliberately designed questions in such a way as to reduce bias as much as possible: e.g. questions have been made as specific as possible, ‘use’ has been subdivided in different categories so as to enable the respondent to differentiate among use for different purposes and to lower social desirable answering (allowing for limited to no use – answers) while respondents were also asked to illustrate their answers with concrete examples. Given the limited set of previous studies on the same topic in this specific research setting, our study is highly exploratory in nature. Case study villages have also not been randomly selected from a set of villages with similar characteristics and findings can thus not be extrapolated beyond our case study area. It is the aim of future research to zoom into specific findings of this exploratory research and to test on a larger scale whether they hold across settings with similar and different context characteristics (see also section 9 for issues for further research)
13
4. Bio-physical conditions
Physical and material conditions refer to “the physical and human resources and capabilities related to providing and producing goods and services”, e.g. capital, labour, technology (Polski & Ostrom, 1999: 9). In this paper we focus on the inputs (4.1.) and outputs (4.2.) of the water sector.
4.1 Inputs to the water sector
In the budget of 2012/13, 3.8% is allocated to the water sector, which is a slight increase as compared to the budget in 2011/2012, but considerably lower than the 6.5% that was allocated in 2007/08. Whereas rural water supply is a priority, only 13% of the 2012/13 water budget was allocated to rural water supply and sanitation, compared to 37% in the 2011/2012 budget (Quinn with Tilley, 2013). The part of the budget that is funded by the Government of Tanzania increased from 23% in 2010/2011 to 31% in 2012/13, government´s part in the development budget (which accounts for 89-92% of expenditure in the water sector) increased from 12% to 25%. Donors still provide the largest part of the budget, 68% of the total water budget and 74% of the water development budget (Quinn with Tilley, 2013). Most donors (mainly including Germany, France, World Bank, African Development Bank) pool funds through the sector basked funding mechanism while Japan and the US aid agencies still use their own bilateral aid channels (AMCOW, 2011). While more than 900 million USD has been spent since the launch of the Water Sector Development Programme in 2007 (see 5.1.3.), access did not improve (see 4.2.). As Twaweza (2012:7) emphasises: “The fact that there is no positive relationship between expenditure and service delivery in the water sector in Tanzania raises serious questions about policy choices and accountability”. Because of the government’s policy of decentralisation by devolution (see also section 5), more responsibilities are shifted towards local authorities and the role of the Water Ministry (MOW) is gradually changing towards supporting activities such as policy and planning, coordination, M&E, etc. This shift in responsibilities also involves transfers of a larger part of the investment budget to urban water authorities, river basin agencies and local government authorities. However, this process is far from complete (see Van den Berg et al., 2009) and recent data even shows a reversing trend. While allocation from central government to the local government was 45% of funds allocated to water in 2008/09, in 2012/13 it was only 11% (Quinn with Tilley , 2013), which is comparable to the share of 10% in 2004/05 (WaterAid (n.d.). The largest part of the district allocation is spent on staff salaries (WaterAid, n.d.). Within districts, the allocation of resources to projects in rural areas should be based on a combination of need (based on current levels of access) and demand (based on the bottom up planning process). However, given serious shortcomings with the bottom-up planning process (see also section 5), demand is in practice derived on the basis of village water funds as this is considered a proxy for community contribution and genuine demand. This often leads to a bias towards wealthier, less-remote and already better serviced communities (TAWASANET, 2009; Taylor, 2008). Additionally, there is also political influence on decision-making with attempts of councillors to influence allocative decisions in favour of their wards and villages (TAWASANET, 2009). At the moment of planning, districts also often do not have detailed and reliable information regarding budget availability which undermines their planning and investment in long-term projects. Adding to this is the fact that the existing formulas for the allocation of block and development grants to LGA (the Local Government Capital Development Grant System, LGCDG) are not consistently applied in the water sector, which further limits predictability, allocative efficiency as well as equity (Van den Berg et al., 2009).
14
In order to stimulate sustainability and ensure availability of funds for maintenance, the government has elaborated different cost recovery policies. In the case of rural water supply, communities should in principle pay operational and maintenance costs. However, in reality richer households with piped water often do not pay their water bills, while, poorer households who are more dependent on standpipes are often not able to pay (higher) tariffs (see Van den Berg et al., 2009). Additionally, even when tariffs are paid, funds are often used for other community purposes or for the own purpose of those who collected the money. If anything, this mismanagement of water funds does not incentivize citizens to pay their water bills (see also Taylor, 2009; WaterAid, n.d.; WaterAid, 2009). The accounts of Local Government Authorities are generally audited by the office of the Controller and Auditor General (CAG). After an audit, the CAG issues a professional opinion, which can be clean, unclean or adverse. Uwazi, part of a citizen-centred initiative (Twaweza) which aims to make information more accessible7, ranked the districts on the basis of the opinions received between 2005/06 and 2009/10 and highlighted that “despite five years of Local Government Authorities’ audits, internal financial controls in LGAs are still astonishingly weak and irregularities identified by the CAG are ignored. The trend of audit opinions in the last few years has, as a consequence, been deteriorating and financial management seems to have gotten worse” (Uwazi, 2011a: 8). Mvomero figured among those districts where financial management weakened between 2005/06 and 2009/2010. More specifically, it received a clean opinion (but with emphasis on some matters it had to address, score 2) in 2005/06 and 2006/07 and an unclean opinion (score 1) in 2007/08, 2008/09 and 2009/10. With an average score of 1.4 in five years, Mvomero is ranked 97 out of 135 districts; in the Morogoro region, only Kilosa performed worse ranking 120th. As regards the water sector, the Water Sector Development Strategy (2006-2015) highlights that, in addition to overall weak monitoring and evaluation in the sector, internal audit functions are largely absent or failing in water sector agencies (see PER; United Republic of Tanzania, 2006). Given the weak effectiveness and efficiency of translating its expenditures into activities, outputs and outcomes, the government is gradually moving towards more performance based transfers, which is amongst others evident from the Big Results Now initiative (see section 5). However, the functioning of such a performance based transfer system is largely dependent upon the existence of well-functioning M&E mechanisms in the sector (see also Van den Berg et al., 2009), while it might as well be undermined by negative side-effects such as gaming or crowding out, or even fail to be implemented because of lack of fit with national or local culture (see e.g. Chimhutu et al., 2014) (see also 6.4).
4.2 Water sector activities and outputs
Whereas Millennium Development Goals have been met worldwide, access to clean water in Tanzania declined from 55% to 53% in the past two decades. Compared to countries with a similar level of development and geography Tanzania stays behind (Twaweza, 2014). In its summary of key findings of a mobile phone survey (among 1702 households) and a baseline survey (among 2000 households), the WHO/UNICEF joint monitoring programme for water supply and sanitation and the 2012 Afrobarometer survey, Twaweza (2014) highlight the following:
- Access to clean water in Tanzania has either stagnated or declined over the past two decades, counter to generally positive regional trends and despite significant investments.
- Nearly one-third of Tanzanians indicate that the challenges of water supply are among the three most serious problems facing the country today.
7 See http://twaweza.org/go/uwazi for more information on Uwazi.
- The vast majority of Tanzanians (89%) collect water for their daily needs from public sources. This can take an hour or more – which is twice the official target of 30 minutes.
- Women and girls have the primary responsibility to collect water for their households’ daily needs (Twaweza, 2014: 2).
A water mapping in ten districts by SNV Netherlands Development Organisation in 2007 and 2008 shows that 43% of the water points were not functional at the time. Water points that were owned or managed by the government were more often not functional than privately owned or managed water points. Frequency of payment influenced functionality as well: while all water schemes where water users pay monthly were functional, none of the water schemes where water users pay yearly were functional. SNV points to a number of reasons for non-functionality of water points in the ten districts, of which the most important one, according to them, is the top down and supply-driven character of most rural water supply projects. As water users are hardly or not consulted or involved in planning, design and implementation, a sense of ownership among citizens is lacking. Most of the citizens are not aware of the changing role of government, water users and other stakeholders. As citizens are not formally recognised as owners and managers of water supply schemes and services, water services are still considered to be a public good with no economic value. SNV also refers to the fact that an accountability system through which water users can track funding is absent (SNV, 2010).
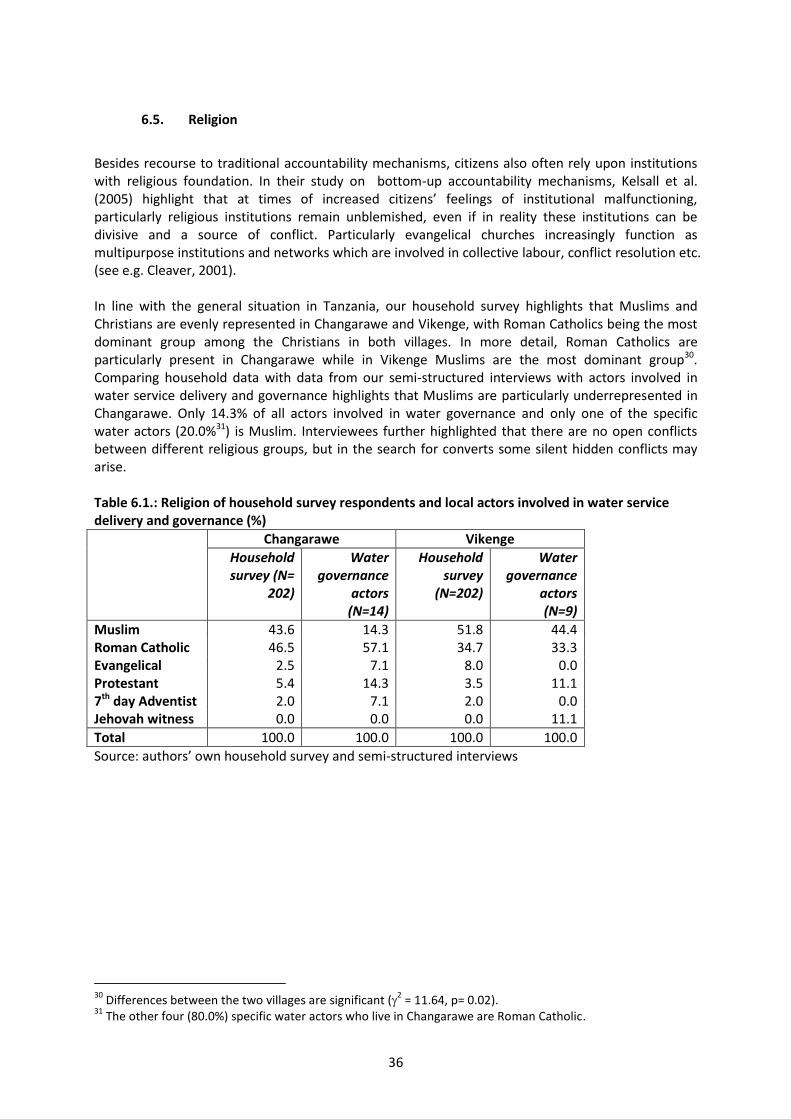
4.2.1. Morogoro Region, Mvomero District and Mzumbe Ward Drawing upon information from the water point mapping survey (see www.wpm.maji.tz), table 4.1 provides an overview of the type of water points, their functionality, perceived quantity and quality of water as well as information on water point density in Tanzania, Morogoro region, Mvomero district and Mzumbe Ward. Throughout Tanzania, handpumps and particularly communal standpipes are the most common types of water points. While the percentage of handpumps is substantially higher in Morogoro than generally in Tanzania (almost 45% as compared to 30%), the functionality of water points in Morogoro region is generally in line with the Tanzanian average. Of the 5,039 water points in Morogoro region 52.9% are functional, 7.8% are functional but in need of repair while the remaining 39.3% are non-functional as compared to 54.4%, 7.2 % and 38.3% respectively for Tanzania in general. Within the Morogoro region, Mvomero is the worst performing district and the only one with more non-functional than functional water points. Disaggregating further to the ward level shows large differences among wards of Mvomero district, with some of them performing strongly (such as Tchenzema or Bundiki), while others such as Mlali, Melela, Sungaji, Kibati or Hembeti performing very weakly. Mzumbe ward is among the better performing wards with 54.6% functional water points, 11. 4 % in need of repair and 34% non-functional water points. It is then not surprising that a higher percentage of the rural population has access to water services in Mzumbe ward as compared to the other wards of Mvomero district. Also regarding the perceived quantity and quality of water provided through the water points, Mzumbe clearly outperforms the other wards of Mvomero district with 72.7% versus 56.9% of the water points perceived to have enough water available throughout the year. While Morogoro region scores relatively weak on the perceived quantity of water, with almost 41 % of the water points providing insufficient water, the quality of the water provided is considered to be of a good quality for almost 80% of the water points. Table 4.1. Water Points in Morogoro Region, Mvomero District and Mzumbe ward (functionality, type, density, quantity and quality)
Mzumbe ward Mvomero district Morogoro region Tanzania (average)
Source: own calculations based on www.wpm.maji.tz (last consulted December, 4th 2014) In addition to the Water Point Mapping System database which is set up by the Water Ministry as a kind of Water Management Information System, also the Afrobarometer survey provides interesting information on water accessibility. Of the 48 Mvomero district respondents who participated in the 2012 Afrobarometer survey round, 19.4% have a piped water system. While 39.0% of the respondents have never gone without water, almost half of them (45.5%) have been without water either several times or many times and 5.9% of the respondents are always without water. For most of the respondents (95.3%) the main source of water is outside the compound (Repoa and Michingan State University, 2012). In the same survey, Mvomero´s respondents highlighted that they normally don´t have to pay bribes for water and sanitation services: more than half of them have (56.6%) never experienced it, while the other respondents (43.4%) did not experience it in the past year (nation-wide, 60% never experienced bribes, 29% not in the last year, 6% once or twice, 4% a few times, 1% often and 1% don´t know). However, respondents are very negative of the provision of water and sanitation services, 73.6% of them thinks the government is handling the provision of water and sanitation services either very badly or fairly badly (as opposed to 18.7% who considers the provision fairly well and 7.8% thinks very well) (Repoa and Michingan State University, 2012).
As is evident from the figures mentioned above, a major problem is the lack of sustainability of waterpoints, with substantial parts of waterpoints not being functional or in need of repair. As highlighted in a 2009 Wateraid Tanzania study (Taylor, 2009; WaterAid Tanzania, 2009), the low sustainability is to a large extent related to governance issues (which are not necessarily sector-specific) and more particularly to the ownership and management of water supply schemes at the moment of construction and after installation. The study highlights the importance of i) finding a balance between community participation and understanding of technical and management options, ii) the involvement of autonomous entities, such as COWSO or WUA, to ensure that funds are effectively collected and used for maintenance. The latter may be guaranteed through iii) the registration of independent legal entities, iv) the use of transparent accounts and public information sharing of income and expenditure statements in order to hold the local water entities accountable to the water users as well as through v) monitoring and auditing at local and district level of water fund bank accounts. Along the same lines, Haysom (2006) highlights the importance of joint signatures for water fund bank accounts, including the signature of the District Water Engineer and a representative of the local water entity. Finally, vi) capacity building and support from the district water office in the area of strengthening of local entities in terms of technical (maintenance, spare parts), management (involvement of water users, organisation of meetings, relationship with village council, etc.) and financial issues (collection of water bills) (Taylor, 2009; WaterAid Tanzania, 2009).
4.2.2. Changarawe and Vikenge In Changarawe and Vikenge the main source of water for domestic consumption is a tap outside the house (65.3% of the household survey respondents in Changarawe and 58.3% of the household respondents in Vikenge). Relatively more households in Vikenge use a tap inside the house for domestic consumption (32.7% versus 21.1% in Changarawe8). For the majority of the household survey respondents the main source of water during the dry season is within 10 minutes’ walk (68.5% in Changarawe, 52.3% in Vikenge). Only a few respondents use a vehicle to fetch water, 2 respondents in Changarawe (with a distance of 20 to 30 minutes and a distance of more than 30 minutes respectively) and 1 in Vikenge (with a distance of less than 10 minutes9). In the majority of the households the wife fetches water for domestic use (59.9% of the household respondents in Changarawe mention the wife fetched water in the last seven days and 63% in Vikenge). While there
are no significant differences in answers between Changarawe and Vikenge (2= 5.22, p= 0.39), there are significant differences between male and female respondents10. Men indicate more often than women that the husband is the one who fetched water in the past seven days (male respondents in Changarawe 18.2%, female respondents in Changarawe 4.6%; male respondents in Vikenge: 9.2%, female respondents: 2.0%), while women more often mention that the wife is the one who fetched water (male respondents in Changarawe 45.5%, female respondents in Changarawe 64.2%; male respondents in Vikenge: 57.5%, female respondents: 67.6%). Sons are also more often mentioned by the fathers than by the mothers (3.4% in Changarawe, 8.0% in Vikenge, versus 0.9% of female respondents in Changarawe and 1.0% of female respondents in Vikenge), while daughters are more often mentioned by mothers in Changarawe (12.8% versus 9.1% of male respondents), but more often by fathers in Vikenge (13.8% versus 9.8% of female respondents). 43.1% and 45.2% of the household survey respondents in Changarawe and Vikenge respectively rate the availability of water for domestic consumption as either excellent, very good or good, with relatively more respondents in Vikenge rating the availability as either excellent or very good. In Changarawe relatively more respondents rate the availability as low or very bad (14.0% compared to
8 Differences between Changarawe and Vikenge are statistically significant (
2=12.34, p= 0.02).
9 These three are women, the men of the same households indicate another distance: one mentions that the
main water source is in the house, while the other two mention a distance of less than 10 minutes’ walk. 10
In Changarawe: 2= 13.74, p=0.02; in Vikenge:
2 =16.52, p= 0.01.
18
5.1% in Vikenge). Whereas differences between the two villages are significant (2= 13.92, p= 0.03),
differences between men and women in the two villages are even more outspoken (Changarawe: 2=
23.34, p=0.001; Vikenge men-women: 2= 15.12, p= 0.02). Especially women in Changarawe are more positive of the quantity of water (51.8% of the women in Changarawe rate the availability as either excellent, very good or good, compared to 32.2% of the men, 12.7% of the women rate the quantity as low or very bad, compared to 15.5% of the men). Among the respondents in Vikenge relatively more women than men are positive of water availability (47.2% rate the quantity of water as either excellent, very good or good, compared to 42.9% of the men), while relatively more women rate the quantity as low or very bad (5.7%, compared to 4.4% of the men). While Vikenge´s household survey respondents are relatively more positive with regard to the availability (quantity) of water for domestic consumption, Changarawe´s respondents are relatively more positive regarding the quality of water for domestic consumption. In Changarawe 66.6% of the respondents rate the quality as either excellent, very good or good and 1.8% as low (very bad is not mentioned), in Vikenge 52.2% of the respondents rate the quality as either excellent, very good or good and 3.5% as low (very bad is not mentioned)11. Men and women in both villages are relatively positive about the quality of water, but relatively more women rate the quality as either excellent or good (34.2% of the women in Changarawe, compared to 21.1% of the men and 34.0% of the women in Vikenge compared to 7.6% of the men). Differences between men and women in Vikenge are
significant (2= 30.82, p= 0.000), while they are not in Changarawe (2= 8.23, p=0.14). In Changarawe 20.3% of the respondents use water for farming; in Vikenge 23.6%12. While in Changarawe relatively more men indicate that they use water for irrigation (26.7% versus 15.2% of female respondents), in Vikenge more women indicate that they use water for irrigation (81.3% versus 70.7% among male respondents)13. Differences could be explained by the fact that in Changarawe more men are commercial farmers, while in Vikenge more women are involved in commercial farming (see 6.3.). Among the respondents that use water for farming, bucket irrigation is the most used method (56.1% in Changarawe and 76.6% in Vikenge). Other methods are pump irrigation and hose (36.6% in Changarawe and 17.0% in Vikenge) and channels (19.5% in Changarawe and 17.0% in Vikenge). As Table 4.2. shows, the main sources of water used for farming are unprotected wells (28.8% in Changarawe, 38.3% in Vikenge) and streams/rivers (23.1% in Changarawe and 36.2% in Vikenge). It is remarkable that many respondents in Changarawe use rainwater for farming (21.2%), while none of the respondents in Vikenge do. Table 4.2 highlights
significant differences between the two villages (2= 1.604, p=: 0.01) as well as between men and women in both villages14. Table 4.2.: Main source of water for farming (%)
Changarawe Vikenge
Men (N=30)
Women (N=22)
Total (N= 52)
Men (N=27)
Women (N=20)
Total (N=47)
Tap on farm 0.0 4.5 1.9 0.0 0.0 0.0 Tap near farm 0.0 13.6 5.8 0.0 5.0 2.1 Public tap 0.0 0.0 0.0 3.7 5.0 4.3 Well (protected) 6.7 9.1 7.7 0.0 40.0 17.0 Well (unprotected) 33.3 22.7 28.8 51.9 20.0 38.3 Stream/ river 13.3 36.4 23.1 40.7 30.0 36.2
11
Differences are significant: 2= 9.79, p= 0.08.
12 Differences between the two villages are not significant:
2=0.65, p= 0.42.
13 Differences between men and women in both villages are significant. Changarawe:
2=4.07, p=0.04, Vikenge:
2=3.11, p=0.08.
14 Changarawe:
2=19.60, p= 0.01; Vikenge:
2=16.346, p= 0.01.
19
Spring 6.7 0.0 3.8 3.7 0.0 2.1 Rainwater 33.3 4.5 21.2 0.0 0.0 0.0 Water vendor 0.0 9.1 3.8 0.0 0.0 0.0 Other 6.7 0.0 3.8 0.0 0.0 0.0
Total 100.0 100.0 100.0 100.0 100.0 100.0
Source: authors’ own household survey For the majority of the respondents the closest main water source used for farming is on the farm itself (35.7% in Changarawe, 32.0% in Vikenge), within less than 10 minutes’ walk (38.1% in Changarawe, 32.0% in Vikenge) or ten to twenty minutes’ walk (19.9% in Changarawe, 30.0% in Vikenge). Only one of the respondents indicates that she uses a vehicle to fetch water (the man in the same household, however, mentions that the main water source is on the farm itself). As regards division of labour for water fetching for farming, findings are in line with those for domestic water
collection. While there are only small differences among the villages (2= 2.84, p= 0.73), differences
among male and female respondents are significant (Changarawe: 2= 10.91, p= 0.07; Vikenge: 2= 17.18, p=0.002). Men mention far more that they are the ones who collected water (in Changarawe 60.9% of the men against 14.3% of the women; in Vikenge 80.8% versus 20.0%), and especially in Vikenge women (as compared to their husbands) mention more often they are the ones who fetches water (30.0% versus 7.7% of the men who mention the wife as being the one who fetches water, in Changarawe 28.6% of the women and 21.7% of the men). With regard to the availability of water for farming, respondents in Changarawe are far more positive than respondents in Vikenge. 65.1% of the respondents in Changarawe think the availability is either excellent, very good or good, against 31.9% of the respondents in Vikenge. Nevertheless, relatively more respondents in Changarawe think the quality is low (7.0% compared to 4.3%, very bad is not
mentioned). Differences between the two villages are significant (2= 15.73, p= 0.01), while
differences between men and women in both villages are not (Changarawe: 2= 7.89, p= 0.16;
Vikenge: 2= 5.58, p=0.35). Respondents are more positive on the quality than on the availability of water, with Vikenge´s respondents being more critical; 73.4% of the respondents in Changarawe think water quality is either excellent, very good or good against 44.6% of the respondents in Vikenge15. Female respondents in Vikenge, however, are more positive than male respondents regarding water quality: 70% of them rate the quality as either excellent, very good or good16. Most of the respondents think that the availability of water services has increased over time (59% in Changarawe, 75.9% in Vikenge). More respondents (especially male) in Changarawe than in Vikenge think the availability has decreased over time: 14.4% in Changarawe (21.6% of male respondents, 8.4% of female) against 4.5% in Vikenge (2.2% of male respondents, 6.5% of female respondents)17. The tables below highlight that household survey interviewees in Changarawe and Vikenge relate both the increase (Table 4.3.) and decrease (Table 4.4.) in availability and quality of water to a large extent to more or less supervision from local government. Especially male respondents in Changarawe also refer to a more active user organisation as an element that contributed to an increase in the availability of water services.
15
Differences between the two villages are significant: 2=15.79, p= 0.01.
16 Differences between men and women are significant in Vikenge (
2=14.91, p= 0.01), in Changarawe
differences are not (2=2.89. p= 0.72).
17 Differences between Changarawe and Vikenge and differences between men and women in Changarawe are
significant (2=16.49, p= 0.001 respectively
2=8.73, p= 0.03), differences between men and women in Vikenge
are not (2=3.68, p= 0.30).
20
Table 4.3.: Elements that contribute to an increase in the availability of water services (as perceived by respondents (%)
Changarawe Vikenge
Men (N=45)
Women (N=70)
Total (N=115)
Men (N=74)
Women (N=77)
Total (N=151)
More active user organisation
48.9 20.0 31.3 21.6 28.6 25.2
More control from local government
73.3 71.4 72.2 95.9 77.9 86.8
More control from higher level government
31.1 21.4 25.2 16.2 16.9 16.6
More active donor agency 0.0 25.7 15.7 23.0 32.5 27.8 More active NGO 4.4 0.0 1.7 1.4 0.0 0.7 More intervention from media
2.2 0.0 0.9 10.8 1.3 6.0
More active traditional village leaders
0.0 2.9 1.7 0.0 1.3 0.7
More intervention from powerful villagers
17.8 7.1 11.3 32.4 3.9 17.9
Other reason18 8.9 11.4 10.4 8.1 20.8 14.6
Source: authors’ own household survey Table 4.4.: Elements that contribute to a decrease in the availability of water services (as perceived by respondents (%)
Changarawe Vikenge
Men (N=19)
Women (N=9)
Total (N=28)
Men (N=2)
Women (N=7)
Total (N=9)
Less active user org. 21.1 22.2 21.4 0.0 28.6 22.2 Less control from loc.gov. 78.9 44.4 67.9 50.0 57.1 55.6 Less control from higher level government
52.6 33.3 46.4 0.0 71.4 55.6
Less active donor agency 0.0 0.0 0.0 0.0 0.0 0.0 Less active NGO 0.0 0.0 0.0 0.0 0.0 0.0 Less intervention from media
0.0 0.0 0.0 0.0 0.0 0.0
Less active traditional village leaders
0.0 0.0 0.0 0.0 0.0 0.0
Less intervention from powerful villagers
0.0 0.0 0.0 0.0 0.0 0.0
Other reason19 31.6 55.6 32.1 50.0 28.6 33.3
Source: authors’ own household survey The majority of the respondents think that the quality of water services has increased over time as well (53.6% in Changarawe and 65% in Vikenge), with respondents in Changarawe, especially the
18
23 respondents (7 in Changarawe and 16 in Vikenge) refer to a favourable climate with relatively heavy rains in the last year as an element that contributed to an increase in the availability of water services. As this seems to be rather related to the availability of water and not of water service delivery, it might be that the question is misunderstood by these respondents. It is also possible that these respondents do not mainly depend on taps for their water use, or that they are more aware of the link between rain, river water availability and local water availability (as the river in Tangeni is the source of water for the taps in Changarawe and Vikenge). 19
See footnote 18.
21
male respondents, being again more critical (10.2% of the male respondents in Changarawe thinks the quality of water services has decreased, against 2.8% of female respondents; in Vikenge 2.2% of the male respondents and 5.7% of the female respondents). As highlighted in the tables below, more/less control of local government is considered to be an important element that contributed to an increase (Table 4.5.) or decrease in quality (Table 4.6.). Table 4.5.: Elements that contribute to an increase in the quality of water services (as perceived by respondents (%)
Changarawe Vikenge
Men (N=36)
Women (N=68)
Total (N=104)
Men (N=57)
Women (N=71)
Total (N=128)
More active user org. 22.2 17.6 19.2 15.8 56.3 38.3 More control from local government
61.1 82.4 75.0 93.0 83.1 87.5
More control from higher level government
38.9 22.1 27.9 24.6 16.9 20.3
More active donor agency 8.3 16.2 13.5 29.8 25.4 27.3 More/less active NGO 8.3 1.5 3.8 5.3 1.4 3.1 More active media 5.6 0.0 1.9 15.8 0.0 7.0 More active traditional village leaders
5.6 2.9 3.8 0.0 1.4 0.8
More intervention from powerful villagers
36.1 4.4 15.4 36.8 4.2 18.8
Other reason 2.8 4.4 3.8 0.0 1.4 0.8
Table 4.6.: Elements that contribute to a decrease in the quality of water services (as perceived by respondents (%)
Changarawe Vikenge
Men (N=9)
Women (N=3)
Total (N=12)
Men (N=2)
Women (N=6)
Total (N=8)
Less active user org. 11.1 0.0 8.3 0.0 33.3 25.0 Less control from local government
66.7 33.3 58.3 100.0 66.7 75.0
Less control from higher level government
55.6 33.3 50.0 0.0 66.7 50.0
Less active donor agency 0.0 0.0 0.0 0.0 0.0 0.0 Less active NGO 0.0 0.0 0.0 0.0 0.0 0.0 Less active media 0.0 0.0 0.0 0.0 0.0 0.0 Less active traditional village leaders
One respondent spoke of the increase in population and increased utilization of water service as a reason for the lower quality of water services, which might refer to a perceived consequence of increasing pollution at the water point. Two respondents mentioned the increase in rainfall as a reason for better quality of water services, which seems to be related to availability rather than quality, and those respondents might thus have misunderstood this question. Moreover, one respondent indicated local people pushing local leaders to achieve change as a reason for increased quality of water services (more specifically via interaction with people from outside the village and hence getting an image of what is possible in terms of service delivery).
22
5. Rules in use
Rules-in-use refer to “the operating rules that are commonly used by most participants and the sources of these rules” (Polski & Ostrom, 1999: 15) and can be either formal (5.1) or informal (5.2). We limit the discussion below to those issues that are considered relevant for the topic under study.
5.1 Rules in use (formal)
Direction and guidance on national priorities for socio-economic development to public and private sectors are provided by the Tanzania Development Vision 2025, the Medium Term Plan (MTP), the National Strategy for Growth and Reduction of Poverty (NSGRP, or Mkukuta), sector policies and strategies, Decentralisation by Devolution and the Plan and Budget Guidelines. In what follows, we zoom into some of these policies and initiatives which are important instruments that guide local development in general and the water sector in particular.
5.1.1 Decentralisation A first important instrument is the Local Government Reform Programme (LGRP) which was launched in 1996 to make local governments more efficient and effective, as well as to introduce participatory planning. In 2008 a new LGRP (referred to as LGRP II) has been elaborated for the period July 2008-June 2013 with more focus on decentralisation by devolution (D by D). At central level the Prime Minister Office – Regional Administration and Local Government (PMO-RALG) coordinates the decentralised responsibilities (The United Republic of Tanzania, 2008). In 2001, the PMO-RALG adopted the Opportunities and Obstacles for Development (O&OD) as a kind of national planning and budgeting system that informs local plans and budgets from the local to the council level. The aim is to increase the involvement of citizens to bridge the gap between centrally-driven development and local needs (Msami, 2011). O&OD starts from the opportunities that are inherently present in a community environment instead of focusing on obstacles and in this way “attempts to change the peoples´ mind sets that development is possible by using the resource endowment of the local environment” (Cooksey and Kikula, 2005: 6). According to the Government of Tanzania, the LGRP resulted in an increased awareness of local government reform, enhanced capacities of authorities and an increase in community participation in local development (Government of the United Republic of Tanzania, 2009). However, more critical voices highlight that the process, which was largely donor-driven, has installed complex layers of government and public administration, parallel systems of reporting and answerability without much improvement of accountability (see Hariss et al., 2011). One of the paradoxes of the reform is notably that it has increased the central government’s control over local government, through e.g. the grant system, which sets minimal national standards on the basis of which local authorities have to frame their budgets (Braathen et al., 2005). In addition constraints such as the timely availability of realistic budget estimates from central level, lack of transport, poor communication and unmotivated and untrained staff undermine the feasibility of bottom-up planning (Cooksey & Kikula, 2005). According to Cooksey & Kikula (2005: 27) “the reality of local government relations with communities is often the reverse of participation and empowerment”. As a consequence, the O&OD methodology does not work and priorities in district plans are set by central government rather than by local communities (Fjeldstad et al., 2010). As citizens are aware of the insignificance of the procedure, the number of people participating in village meetings is rather low (Mollel & Tollenaar, 2011). These findings also hold for the case study villages. In Changarawe, the most recently available village plan of 2012 has been drafted according to the O&OD methodology, but in practice citizens did not participate in the drafting. In Vikenge, the village plan was not drafted alongside the O&OD methodology; it is rather a list of objectives and priorities which can easily change due to changing needs or central-level priorities. The latter is also confirmed by ordinary citizens of both villages who
23
emphasize that village meetings are not about setting local priorities, but rather about the provision of orders from above. In line with the decentralisation policy, local government authorities also take over responsibilities for rural water supply investment and implementation while the national water ministry focuses on policy, guidelines, capacity development and performance monitoring. In reality, the implementation of this shift in responsibilities only started to be implemented from 2007 onwards while there are still many centrally-coordinated projects (AMCOW, 2011). In 2013, at the moment of the evaluation of Phase I of the Water Sector Development Programme (WSDP)(see 5.1.3), implementation of the WSDP was still largely in hands of the Ministry of Water. Adding to this is the fact that so far district-wide water and sanitation plans which entail a long-term vision on water supply and sanitation are still lacking, while the elaboration of such plans was one of the activities foreseen under the WSDP (Oxford Policy Management, 2013). The limited shift in responsibilities from the Water Ministry to LGA and the pressure to increase the transfer in responsibilities also creates tension among the Water Ministry and PMO-RALG.
5.1.2 Open Government Partnership and Big Results Now Initiative In 2011 Tanzania joined the Open Government Partnership (OGP) initiative21, which is “a global initiative that aims at promoting transparency, empower citizens, fight corruption and encourage use of new technologies to improve governance” (United Republic Tanzania, 2012). The Open Government Partnership aims to improve service delivery and to make Government more responsible and accountable to their citizens. The PMO-RALG is the most important Tanzanian player in the Open Government Partnership, as it has to ensure that districts, municipals and city councils implement the Open Government Partnership commitments (Tepani, 2013). For the period 2012-2013 the government of Tanzania elaborated an action plan for the Open Government Partnership which includes commitments in the areas of ´transparency´, ´citizen participation´, ´accountability and integrity´ and ´technology and innovation´. The OGP action plan also refers to the recent establishment of a Water Sector Management Information System (WSMIS), which includes a web-based water point mapping system to be used for planning and monitoring of water distribution services (United Republic of Tanzania, 2012). With the action plan 2012-2013 the government commits itself to finalise the water point mapping system for Local Government Agencies and to make disaggregated data available online) (United Republic of Tanzania, 2012). However, in 2014, this commitment has been only partly realised (see Twaweza, 2014). A new action plan of the Open Government Partnership will be linked with a new government initiative, the Big Results Now (BRN), which aims to increase the pace of economic growth and poverty reduction in six key priority areas: education, water, oil and gas, agriculture, transport and revenue mobilization (United Republic Tanzania, 2013b). The basic idea is to increase accountability through the use of time bound Key Performance Indicators (KPIs)(United Republic of Tanzania, 2014). In the water sector the BRN initiative is expected to contribute to the provision of access to safe and clean water to more than 15.4 million rural people. The target set is for 75% of the population to have access to safe and clean water by 2015 (Twaweza, 2014) and to achieve 67% rural water coverage by 2015 (United Republic of Tanzania, 2014). Although the original baseline stood at 57%, more detailed analysis of baseline data highlighted that the current baseline is 40% (United Republic of Tanzania, 2014). In spite of the fact that the BRN initiative has led to an installation of approx. 16,800 additional water points in one year time (2013-2014) as compared to a total achievement of approx. 16,000 water points during the previous six years of implementation of the WSDP (United
21
The Open Government Partnership was launched in New York in September 2011 by 8 founding members: Brazil, Indonesia, Mexico, Norway, Philippines, South Africa, United Kingdom and United States.
24
Republic of Tanzania, 2014), TAWASENET considers the target unrealistic (see also 4.2). Given the impressive results obtained by the BRN, the WSDP Phase II (2014) announces that the BRN implementation tracking mechanism will be adopted in the water sector (see also 5.1.3).
5.1.3 Water Until 1991 free water policies were prevalent in Tanzania, with central government financing all water supply investments and costs of operation and maintenance. From the mid 70s onwards, donors took over water supply in different regions of Tanzania, largely bypassing government systems and transferring infrastructure to regional engineers, however without budgets for operation and maintenance (see also WaterAid, n.d.). The first National Water Policy (1991) was the start of a long-term reform process, introducing amongst others user charges (AMCOW, 2011). Currently, the water sector is guided by the 2002 National Water Policy, the Water Sector Development Strategy (NWSDS)(2006-2015) and two new water acts (Water Supply and Sanitation Act and the Water Resource Management Act) which were passed by Parliament in 2009 (AMCOW, 2011). The latter two acts highlight that a distinction is made between the institutional framework for Water Resources Management (WRM) and for Water Supply and Sanitation (WSS) with different organisations being responsible for these domains or the same organisation having different functions and responsibilities, which often leads to confusion on the ground. Key components of the 2002 National Water Policy include community participation (through village water user entities), ownership and cost sharing with local communities paying a portion of the capital costs, in kind and cash to rehabilitate and extend the existing schemes and employ user fees to cover the full costs of operation and maintenance (Cleaver & Toner, 2006). The National Water Policy also recognises the need for gender mainstreaming. According to Cleaver and Toner (2006) Tanzanian evolving approaches to water are in line with international consensus on water governance, which is characterised by a shift from an interventionist high modernist state to implementation of water policy through polycentric governance, taking place at different levels and involving a diverse set of actors (see also UNDP, 2013). This is also obvious from the National Water Sector Development Strategy (NWSDS)(2006-2015) which introduces a new institutional framework, in which the role of the government is changed from service provision to coordination, formulation of policy and guidelines and regulation (United Republic of Tanzania, 2006). When it comes to M&E, the NWSDS explicitly points out the existence of poor monitoring procedures, weak management information systems and a lack of stakeholder involvement and highlights the importance of investing in an effective performance monitory system for all providers of water supply and sewerage service (United Republic of Tanzania, 2006). The National Water Sector Development Strategy more particularly aims to
- “develop a comprehensive reporting, evaluation, and feedback mechanism to the organisation responsible for monitoring and regulation;
- introduce computerisation of performance monitoring records and evaluation; - involve all key stakeholders in the monitoring and evaluation process, including establishing
consumer consultative committees; and - enhance the monitoring capacity of the Water Users and Water Consumers Associations”
(United Republic of Tanzania, 2006). The NWSDS is translated into a Water Sector Development Programme (WSDP) which entails three phases of five years (2007-2014; 2014-2019 and 2019-2025). While phase I was initially foreseen to finish by 2012, it has been extended to 2014 to take into account the backlog at the start of the programme (Oxford Policy Management et al., 2014). The programme is subdivided into four components including: i) water resources management (WRM), ii) rural water supply and sanitation, iii) urban water supply and sewerage and iv) institutional development and capacity building.
25
Implementation of the programme on the ground is through Local Government Authorities (for rural water supply and sanitation), Basin Water Boards (for WRM), and Urban Water Supply and Sanitation Authorities (for urban water supply and sanitation). The programme is funded through a Sector Wide Approach (SWAp), which pools donor funding and aims at strengthening sector institutions to increase water access (United Republic of Tanzania, 2014). In the context of the SWAP, there is an active Development Partner Group for Water which coordinates different donor activities and which co-organises (with the government) the Joint Sector Review (JSR). JSRs bring together different actors and stakeholders, including central and local government, CSOs, budget support and project donors to discuss and analyse progress in the sector and identify priorities for the next period. The main input to the JSR is the annual sector performance report, in addition to additional studies that are commissioned as well as reality check field monitoring missions (see also Holvoet and Inberg, 2009). An example of such additional studies is the equity report which is yearly published by TAWASANET (see e.g. TAWASANET, 2009), an important network of CSOs such as WaterAid, Daraja and Shahidi wa Maji22. Donor coordination and the move towards a SWAP have benefitted M&E activities, at least at the national level. As performance monitoring in the sector was generally perceived of as a weak point, a diagnosis of the existing monitoring frameworks and mechanisms was commissioned in the context of the SWAP (AMCOW, 2011). This study amongst others points out the confusing overlap of different and changing monitoring frameworks to follow up the WSDP, including the Performance Assessment Framework (PAF) linked to the MKUKUTA, the World Bank (WSDP) Monitoring Framework and the Sector Performance Monitoring Framework (see Taylor, 2009a). The study further highlights an inconsistent use of definitions and indicators in surveys and slow improvement in routine monitoring systems for rural water supply (Taylor, 2009a cited in AMCOW, 2011: 18). Similar to other sectors and other countries, the quality of sector performance reports is at best variable, but improving (learning by doing), and mainly provides monitoring data while evaluative analysis is largely lacking. This does not come as a surprise as the sector performance report is the output of the M&E system which is largely biased towards monitoring. The focus is also predominantly on water substance issues, while there is much less attention for the more systemic issues, such as the functioning of the COWSOs itself, in spite of the fact that it is generally acknowledged that institutional and management issues have a large influence on performance, particularly as regards sustainability (see e.g. Harriss et al., 2011). Similar to other countries and sectors, one of the most challenging issues is the feedback and use of performance reports (and M&E output in general). This holds both for use for learning and accountability purposes, at different levels (and particularly at local level) and within and outside government. In the context of the elaboration of the Water Sector Development Programme (WSDP) Phase II, an evaluation has been performed of Phase I (see Oxford Policy Management et al., 2013; United Republic of Tanzania, 2014). As regards the more governance/M&E-related components, the report highlights amongst others the following issues:
- There is upstream progress in policy and institutional reform but this is undermined by downstream management and implementation challenges, amongst others related to highly dispersed management responsibilities and unclear division of responsibilities among LGA and the Water Ministry, among PMO-RALG and the Water Ministry (see also 5.1.1)
22
WaterAid is an international NGO in the area of water, sanitation and hygiene education, Daraja is a Tanzanian organisation mainly working in rural Tanzania and focused on government – citizen relationships, while Shahidi wa Maji is a Tanzanian NGO dealing with sustainability, equity and accountability in water resource and environmental management (see TAWASANET, 2009).
26
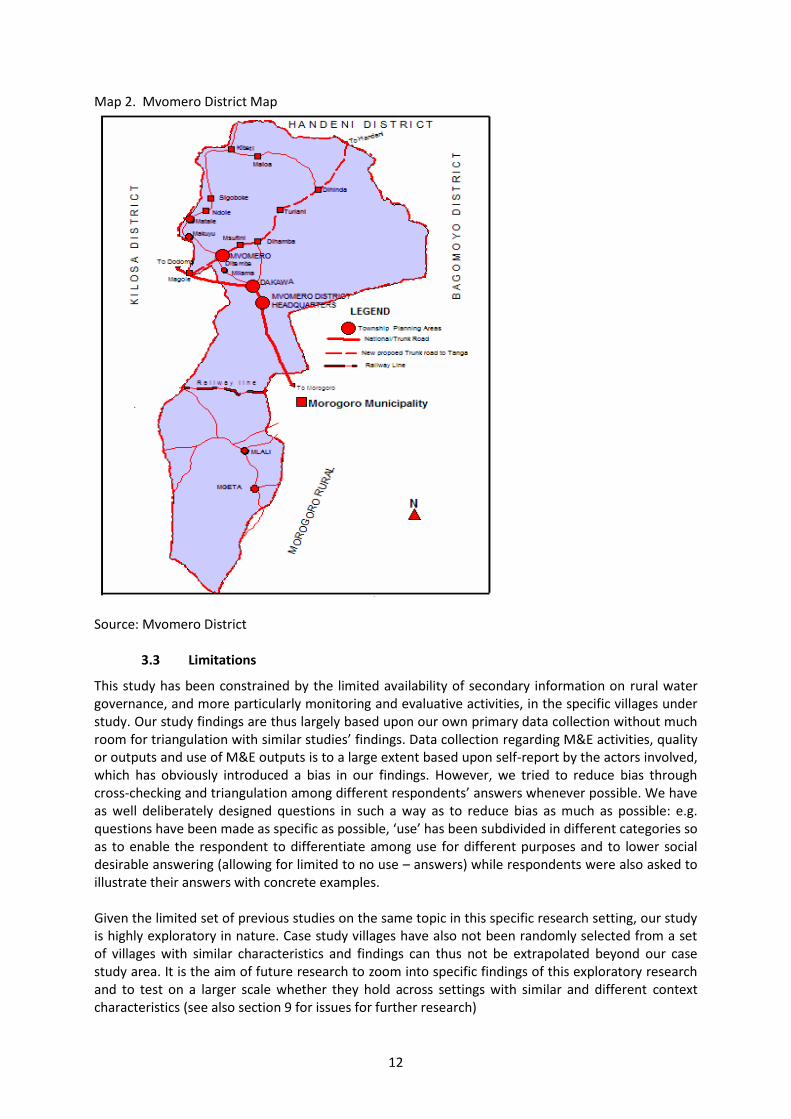
- An integrated M&E framework & system is lacking, instead there is a confusing patchwork of M&E frameworks (see also Taylor, 2009).
- Different databases and M&E frameworks do not always use the same definition for indicators, leading to different estimates for apparently similar indicators. E.g. ‘functionality’ in the WPM survey is measured as ‘yielding water at the time of the survey’, whereas it is defined by the Water Ministry in its performance reports as ‘being operational more than half of the time’ and as ‘year round supply’ in the 2002 Water Policy (see Taylor, 2009: 6).
- There is a lack of distinction between output and outcome indicators (see also Taylor, 2009). Distinguishing among the two is important from a learning and accountability perspective : while the former are related to issues (such as instalment of water points) that are mainly under the control of and manageable by the supply side, the latter are related to issues (such as use of water) that necessitate an interaction between the supply and demand side (the users).
- While sources of data collection are clear (see table 5.1.), in practice there are doubts about data reliability while also accessibility of reports is problematic. In order to solve this the move towards an automated MIS system is considered important. However, until 2012, there was little progress; only during the Phase I extension between 2012-2014, more emphasis has been put on the Water Sector Management Information System – MIS and Water Point Mapping and the related improvement of planning, budgeting, performance monitoring, financial management and reporting. Another issue is related to limited internet connectivity which might undermine the functionality of the MIS.
- There has generally been more focus on hardware investments and little on human capacity development. During the extension period there has been some re-focus in this respect (1,000 new staff members have been recruited and more than 1,500 staff members have been trained in financial management and MIS reporting).
- There is sometimes limited technical water-related capacity at district level and lack of adequate technical support from the district level to actors at village level.
- While the need for gender mainstreaming is recognized in the Water Policy and while some initiatives have been taken (including amongst others gender budgeting), in reality women are still underrepresented at all levels of decision-making, planning, supervision and management (WaterAid, n.d.: 8).
- There is low technical capacity and motivation of COWSO members which is thought to be partially related to the absence of a follow-up system of COWSO functioning at district level.
Table 5.1.: Data sources along the Water and Sanitation Results Chain
Inputs (eg. finance, staff time)
Activities (eg. drilling)
Outputs (eg. boreholes, toilets, water points)
Outcomes (e.g. people using facilities)
Impacts (e.g. reduced diarrhoeal disease)
National MIS/EPICOR Summary of regional reports by PMO-RALG
Summary of regional reports by PMO-RALG
Household surveys (e.g. DHS, HBS)
Household surveys (e.g. DHS, HBS)
Regional MIS/EPICOR Compiling of LGA reports by RS
Compiling of LGA reports by RS
Some surveys with large sample size (e.g. census)
Some surveys with large sample size (e.g. census)
Local MIS/EPICOR LGA quarterly reports
LGA quarterly reports
None Health Information System (MoHSW)
Source: Oxford Policy Management et al., 2013: 24.
27
In order to address some of the WDSP Phase I-weaknesses, WSDP Phase II will amongst others focus on (see United Republic of Tanzania, 2014):
- Strengthening of processes of district wide planning and increasing community participation in the planning processes. Related to this, the Ministry of Water will prepare and disseminate guidelines for LGAs to prepare comprehensive District Water Supply and Sanitation Plans which will amongst others be based on survey data.
- Project appraisal criteria will be based upon these District Water Supply and Sanitation Plans while also considering updated WPM data.
- The integrated Water Sector Monitoring and Evaluation Framework including interventions such as traditional daily and periodical follow ups at different levels (input, activity, outputs, outcomes and based on a streamlined set of key indicators) will be implemented and feed into annual sector reviews, mid-terms and end-of-programme reviews and evaluation.
- An important component of the Water Sector M&E framework that needs particular attention is the sector’s Management Information System (MIS) which aims to inform management and to feed into real-time WSDP II progress reporting. This will involve tailored trainings for increase reliable data entry, particularly at the lowest government levels.
- Given the impressive results of the Big Results Now initiative, the Big Results Now implementation tracking mechanism will be adopted. However, it is not clear how this system will be related to the Water Sector Management Information System or to other data collection initiatives in the sector.
- In line with the BRN Initiative, there will also be more focus on regulation and monitoring of COWSOs, by the village government and the district level, through:
o a standard MU between LGAs and each COWSO, outlining regulatory mechanisms o a comprehensive established monitoring checklist to collect data at COWSO level on
a regular basis, including financial performance data o weekly publication of the most important financial data (collection, expenditure and
balance) at village level (open notice board) in order to increase transparency (bottom-up)
o monthly reporting on financial matters to the community o more support (in technical, financial and management issues) by the ward and
district level: at ward level a technician will provide daily backstopping to all COWSOs in the ward
5.2 Rules in use (informal)
In addition to formal rules, informal rules determine the behaviour of actors in the water sector. These typically relate to norms and customary traditions of how to allocate, distribute and use water resources. “Informal rules often respond to a different logic of answerability and sanctions than those imposed by formal laws and are generally more difficult to change” (Lawson and Rakner, 2005; Hussman and Mmuya 2005 cited in Harriss et al., 2011: 10). If they are not in favour of government reforms, they can possibly delay them (see also Prinsen, 2007). According to Tilley (2013) informal rules and norms dominate in the water sector “as the existing legal and institutional framework for the sector is difficult to implement and follow effectively, resulting in confusion and a lack of clarity around the processes that should be followed. Consequently, political incentives result in the longer-term needs of communities being side-lined” (Tilley, 2013: 9). On the ground this leads to a mixture of principles and organisational forms derived from different logics. In such situations of legal pluralism, “what logic dominates is dictated by costs and benefits that derive from one system or another and by the balance of power between different actors (see Harriss et al., 2011: 10).
28
Three common, related informal institutions that are affecting all service delivery sectors are corruption, clientelism and ‘big man’ presidentialism (Bratton, 2007). Clientelism is the “expression of political loyalty to providers of patronage” (Bratton, 2007: 98) while ‘big man’ presidentialism specifically refers to the personalisation of power around the president. In such cases, “he is literally above the law, controls in many cases a large proportion of state finance with little accountability, and delegates remarkably little of his authority on important matters” (Van de Walle, 2003: 310). ‘Big man’ presidentialism and clientelism allow highly placed politicians, including the president, and highly placed officials to influence policy, which could result in policies for which the administration is not yet ready or policies that contradict already existing sector policies (Cambridge Education, 2010). Corruption, which mainly results from an institutionalization of political clientelism, among elected leaders as well as among appointed officials (Carlitz and McGee, 2013) and also includes bribery and absenteeism (´quiet corruption´), generally affects service delivery in Tanzania. While bribery as such does not seem to be a widespread problem in the water sector (see also 4.2.2.), financial mismanagement such as the personal appropriation of water funds by those collecting the water bills and the non-payment for piped water by wealthier households, is an important problem adding to the limited sustainability of water points. While the World Bank governance indicators show an improvement on the control of corruption indicator for Tanzania between mid 1990s to mid 2000s, scores on this indicator gradually deteriorated between 2006 and 2013 (World Bank, nd). On the Corruption Perceptions Index, which ranks countries on the perceived corruption of a country´s public sector, Tanzania is with a score of 33/100 (0 = highly corrupt, 100 = very clean) ranked 111th out of 177 countries in 2013 (http://www.transparency.org/country#TZA). This score is slightly better than neighbouring countries such as Kenya and Uganda, which score respectively 27/100 (rank 136/177) and 26/100 (rank 140/177), but (not surprisingly) much worse than Rwanda which scores 53/100 (rank 49/177). (http://www.transparency.org/country#KEN; http://www.transparency.org/country#UGA). Interestingly, a 2006 Repoa brief on the Afrobarometer findings indicates that fighting corruption is not necessarily top priority for ordinary citizens who are more concerned with other priorities such as water supply and health services (Repoa, 2006). Similarly, the 2012 Afrobarometer findings highlight that 27.2% and 20.3% of the Mvomero respondents consider water supply and health services to be the most important problems as compared to 5.9% of the respondents who identified corruption to be the most important problem (Repoa and Michingan State University, 2012). According to Carlitz and McGee (2013:4): “Close observers of Tanzanian politics hold that corruption is tolerated so long as local constituents receive sufficient resources from those in power (even if such resources are channelled in a “clientelistic” fashion)” (Carlitz and McGee, 2013: 4). In fact, due to patronage networks, individual Tanzanians do not have an incentive to challenge a corrupt system, but rather to become part of it, as confronting local power structures is very costly and generally leads to less access to scare resources and opportunities of the patronage network (Hoffman, 2013).
Community attributes refer to “the demographic features of the community, generally accepted norms about policy activities, the degree of common understanding potential participants share about activities in the policy area and the extent to which potential participants´ values, beliefs, and preferences about policy-oriented strategies and outcomes are homogenous” (Polski and Ostrom, 1999: 13). In this paper we sub-divide community attributes in politics (6.1.), governance (6.2.), socio-economy (6.3), culture (6.4.) and religion (6.5.). A lengthy in-depth discussion on each of these issues is beyond the scope of this study, we only focus on those issues that are considered relevant for the topic under study.
6.1 Political context
While Tanzania is characterized by fragmentation in terms ethnic groups (with more than 120 ethnic groups) and religion (with as many Christians and Muslims), it has a reputation of political stability. Government has created Swahili as a national language, used the education system to create one nation and mandated for years ethnically heterogeneous secondary schools (see Hoffman, 2013: 1-2). On the basis of its ´polity score´23, Tanzania can be classified as an anocracy which “is characterized by institutions and political elites that are far less capable of performing fundamental tasks and ensuring their own continuity” (Marshall and Cole, 2011: 9). Rather than being a distinct form of governance, anocracies are “countries whose governments are neither fully democratic nor fully autocratic but, rather, combine an, often, incoherent mix of democratic and autocratic traits and practices” (Marshall and Cole, 2011: 9). Since the introduction of a multiparty system in 1995 the polity score of Tanzania has not changed and the Chama Cha Mapinduzi (CCM) upholds its dominant position (Carlitz and McGee, 2013). The electoral system of plurality voting also favours the CCM while the fact that the process of re-election is party-based further increases its power (see e.g. Lawson and Rakner, 2005). However, opposition parties such as Chama cha Demokrasia na Maendeleo (CHADEMA) are beginning to emerge because of increasing frustration (particularly among the youth) with CCM’s rule (Hoffman, 2013). Yet, as mentioned below, the most recent Afrobarometer survey findings showcase that citizens generally still have more trust in CCM than in opposition parties (see Repoa and State University of Michigan, 2012). There is a large degree of overlap among the party and the state with concentration of political (and economic) power in hands of a small number of people in the executive branch and CCM leadership. Weak judiciary and parliamentary powers do not function as effective checks and balances and the limited level of accountability is further undermined by CCM’s impressive bureaucracy and fusion among politics and administration which ensures enforcement of party priorities from local to central level (see also Harriss et al., 2011; Hoffman, 2013; Lawson and Rakner, 2005). Policy making under the CCM regime is rather secretive and closed (Carlitz and McGee, 2013), although Tanzania is mentioned by Marshall and Cole (2011) as one of the anocracies that has recently become more open. Two of the most important recent political trends in this regard are the ongoing constitutional reform process and the internal elections within CCM. First, the constitutional review is addressing reforms such as granting greater power to the legislative to conduct more effective oversight which should in principle lead to increased accountability (see Hoffman, 2013). Yet, some observers are more sceptical and consider these changes window dressing to satisfy donors who have been pushing for these types of reforms (see Harrison, 2001). Secondly, while there
23
The Polity score ranges from -10, fully institutionalized autocracy, to +10, fully institutionalized democracy,
Tanzania scores a -1 (Carlitz and McGee, 2013).
30
is little interparty competition, there is an increasing level of internal competition and fight within the CCM (Hoffman, 2013), which also holds for our case study villages (see below). In Mvomero district, 77.4% of the 48 respondents of the 2012 round of the Afrobarometer survey voted for CCM as compared to only 3.6% for CHADEMA. Similarly, the majority of the respondents in Mvomero district also seem to have more trust in the ruling party (54.2%) then in the opposition parties (15.7%). According to 67.2% of the respondents the last national elections were completely free and fair and 92.2% felt completely free to cast their vote for their preferred candidate (see www.afrobarometer.org). In Charangawe, only one member of the village council belongs to CHADEMA while in Vikenge all members are from the ruling party (CCM) (Matekere and Van Aelst, 2014). According to key informants living in Charangawe and Vikenge village, there is not a lot of competition between the members of different political parties in Changarawe (score 3 on a scale of 1 to 10) and Vikenge (score 1), while there is more political competition between members of the same political parties, especially in Changarawe (score 8 on a scale of 1 to 10, for Vikenge this score is 3) (Matekere and Van Aelst, 2014). Among our own 34 interviewees (actors in water sector service delivery and governance) none is member of an opposition party, while more than half (55.9%) is member of CCM. The majority of those who mentioned not be a member of a political party are church leaders and civil servants, which is in line with civil servants not being officially allowed to be a member of a political party. Yet, some of the interviewees highlighted that this does not hold in reality and referred to the fact that many civil servants have a CCM affiliation.
6.2 Governance context
In 2013 Tanzania scored above the Sub-Saharan Africa mean on the World Governance Indicators except for control of corruption. Between 2003 and 2013 Tanzania´s scores on voice and accountability, political stability and absence of violence/ terrorism regulatory quality improved, while scores on government effectiveness and rule of law deteriorated. Scores on control of corruption were higher than the Sub-Saharan Africa average between 2004 and 2011, but since 2006 they have deteriorated (see also 5.2.). (http://info.worldbank.org/governance/wgi/index.aspx#reports). Also comparison between the 2008 and 2012 Afrobarometer rounds reveals an increase of people’s perception of corruption among local councillers24 (see www.afrobarometer.org). Findings from the 2012 Open Budget Survey show that Tanzania also scores low on indicators such as citizen’s budget, access to information law, etc.; the lowest score is on public engagement (below 34, whereas the average score for Tanzania is 47/100)(International Budget Partnership, 2012). However, there are also some initiatives that are worth mentioning. One of these is the Tanzania Governance Noticeboard initiative by the research institution ‘Research on Poverty Alleviation’ (REPOA)(active until 2007) which is aimed at making information from monitoring exercises publicly available (see www.repoa.or.tz/noticeboard). It includes amongst others data from the auditor general’s reports and budget data from ministries and local authorities. Another interesting evolution is the rise of a small number of CSOs, such as Haki Elimu, Twaweza, Uwazi, etc. that are gradually getting policy influence, despite the 2002 NGO act which constraints CSO’s role in politics (see also Hoffman, 2013). These organisations typically aim at increasing awareness among citizens’
24
In 2008 3% of the respondents thought all the local councillors were corrupt, versus 5% in 2012; in 2008 10% thought most of them were corrupt, versus 21% in 2012 in both 2008 and 2012 58% thought some of them were corrupt; and in 2008 14% thought none of them were corrupt, versus 12% in 2012.
about their right to information which is in contrast to the traditional role of CSOs as implementers of CCM dominated processes. Similarly, also media is becoming more vocal, notwithstanding the continuous postponement of a Freedom of Information Act. Media has particularly been active in reporting on instances of CCM and government corruption scandals (see Hoffman, 2013). There are also interesting alliances emerging among CSOs and media. For instance, Haki Elimu used TV and radio in its attempts to hold government accountable for its promises on primary education. Government responded by banning its spots which created resistance in media, subsequently leading to even more critical spots (see Hoffman, 2013). The rapidly increasing internet access might also be an important source of critical information about government, particularly among the youth. As regards Charangawe and Vikenge, citizens particularly listen to Abood Radio and watch Abood Television. Also donors increasingly invest in strengthening the demand side of accountability through their support of Transparency Accountability initiatives (TAI) such as the Accountability in Tanzania programme (multi-donor) or the STAR (United States Agency for International Development) programme (Hoffman, 2013). Yet, NGOs involved in TAI often face challenges to mobilize citizens who often have less trust in NGOs than in their elected officials or civil servants and this particularly holds when such initiatives involve elements of confrontation with local power structures (see also 6.4.). This low level of citizen’s mobilization to hold government accountable is also obvious in the villages of Changarawe and Vikenge where most villagers do not attend village meetings, nor do they engage in follow-up of issues at the level of the village government.
6.3 Socio-economic context
According to the 2014 Word Development Report, Tanzania is ranked among the low income group countries with a Gross Domestic Product (GDP)/capita (PPP, Purchasing Power Parities) of 1,590 US$ (compared to an average of 1387 US $ PPP for the low income group) and a growth rate of 3.4 % (as compared to an average of 3.7%). Official Development Assistance (ODA) as % of Gross National Income ranged from 13.1% in 2010 to 10.1% in 2012 (www.oecd.org/dac/stats/aid-at-a-glance). Major bilateral donors are the US, UK, EU, Japan, Sweden, Denmark and Norway. In the period 2011-2012, the largest part of ODA was spent in the health and population sector (37.1%), the water sector receives about 4.5% of ODA (OECD/DAC, 2014). As regards the water sector in the Morogoro region, the most important donors are the World Bank, SNV, World Vision and Lion Pure Water25 while none of these donors has specific activities in the villages under study (interviewees). As regards the 2013 Human Development Index (HDI), which gives an indication of a country’s score in terms of life expectancy, education and purchasing power for investment in human development, Tanzania ranks 159/187 with a score of 0.488 (as compared to an average of 0.502 for SSA countries). Looking at the different sub-indicators of the HDI, it is obvious that Tanzania is particularly lagging behind other SSA countries in terms of purchasing power while it does relatively well compared to the SSA average with respect to the average life expectancy at birth (61.5 as compared to the SSA average of 56.8 in 2013), the average mean years of schooling for people aged 25 (5.1 as compared to the SSA average of 4.8 in 2012) while it performs in line with the SSA average when it comes to the years of schooling a child at school entrance currently can expect to have (9.2 as compared to the SSA average of 9.7). Over the period 2000-2013, Tanzania’s average yearly HDI growth was 2.08%. Over the period 2008-2013 the growth in human development has been higher in Tanzania as compared to other countries with similar HDI (which led to an improved HDI ranking of 5).
25
Lion Pure Water is a Swedish organisation which supports water projects in the rural areas of Morogoro region.
Correcting the HDI-value for income inequality leads to a loss of about 27% in the HDI value which is less compared to other countries with similar levels of HDI. The fact that Tanzania is performing slightly better in this regard is also evident from its Gini coefficient which is about 37% as compared to coefficients of 44.3% and 50.8% for Uganda and Rwanda respectively (Belgium’s Gini coefficient stands at 33%, that of the US at 40.8%). Also when it comes to gender equality, Tanzania does relatively well with a female/male HDI of 91.6%, as compared to averages of 83.4% for low human development countries and 87.7% for medium human development countries. As regards the specific socio-economic context of Morogoro region and Mvomero district the most recently available data is included in the 2007 Morogoro Regional Economic Profile (Ministry of Planning, Economy and Empowerment and the National Bureau of Statistics, 2007). Morogoro, the second largest region in Tanzania, covers about 7.7% of the total land area which is almost exclusively covered by land (about 97%). Only three districts have significant water bodies. Mvomero district, which is the second smallest district of Morogoro region (10% of the land area) has only an insignificant water area (Ministry of Planning, Economy and Empowerment and the National Bureau of Statistics, 2007: 1-3). In terms of the Morogoro Region’s topography, two features are interesting to highlight: on the one hand the mountainous and hilly areas of the Ukaguru, Uluguru and Nguru mountain ranges and on the other hand the lowlands of the Kilombero valley and the northern parts of the region (Ministry of Planning, Economy and Empowerment and the National Bureau of Statistics, 2007: 18). Mvomero district contains 17 out of the 171 wards of Morogoro region, 101 out of the 540 villages and 577 out of the 3,204 streets (Vitongoji). The population density in Mvomero district (37.9 persons/ km2) is slightly higher than Morogoro’s average population density (27 persons/ km2), which
was among the lowest in Tanzania in 2006 (Ministry of Planning, Economy and Empowerment and the National Bureau of Statistics, 2007: 1-6). The age structure in all districts of Morogoro is in line with that of many developing countries and characterized by large dominant age groups of 0-4 and 5-14 years, followed by the 15-44 and 45-64 age groups, which leads to high dependency ratios. Also the average household size in Mvomero district (4.7 in 2006) was in line with that of Tanzania in general (4.7; 4.9 in rural areas and 4.2 in urban areas) while the sex ratio (M/F) was slightly higher in Mvomero district (102) than in Morogoro region and Tanzania in general (99). The most recently available population census data show that Mvomero’s sex ratio currently stands at 98 while the household average size is estimated at 4.3 (Tanzania National Bureau of Statistics, 2012). While the average household size among our survey population in Changarawe is close to Mvomero´s average (4.2), the average household size in Vikenge is slightly higher (4.9). Given the abundant availability of land for agriculture and the favorable climate, the Morogoro region is considered to have great potential for economic development and investment. This is amongst others evident from the fact that in 2006 Morogoro region ranked 8th (on a total of 21 regions) in terms of income per capita. As expected, crop farming is the major economic activity in terms of labour force participation, followed by streets vending, crafts, small business, professional jobs while industrial activity is currently still low. This also holds for Mvomero district where also livestock keepers are significantly present while fishermen are (as expected) a small minority. Both food and cash crops are cultivated, with maize being the most important food crop, while sisal which used to be the most important cash crop in the region has been replaced by coffee, oil palms, sugarcane and mangos. Typical for Mvomero district is the large proportion of dairy cows which make about half of all dairy cattle in Morogoro region. The increase in agricultural and livestock production has put the forest cover under serious pressure over the past decade. This has led to a rise in forest conservation initiatives, initiated by the government, communities and NGOs. In fact, Morogoro is considered to be one of the regions in Tanzania which has been relatively effective in forest conservation (Ministry of Planning, Economy and Empowerment and the National Bureau of Statistics, 2007: 51).
33
In Changarawe and Vikenge the majority of citizens are subsistence farmers (83.7% among the respondents of our household survey in Changarawe, 81.4% in Vikenge). Vikenge has more commercial farmers than Changarawe (11.6% compared to 5.9%), defined in this study as selling more than half of their crop yields (and is thus not related to the size of their farm or harvest). In Vikenge these are more often women (17 women against 6 men; 15.9% of the women are commercial farmers compared to 6.5% of the men)26. In Changarawe men are more often commercial farmers (5 women against 7 men; 7.8% of the men are commercial farmers compared to 4.5% of women). Landownership is also higher among the respondents of the household survey in Vikenge, 45% own land and 33.7% own and rent land, whereas 38.6% of the respondents of the households in Changarawe own land and 30.2% own and rent land27. Additionally, also the average amount of owned land is higher in Vikenge (4.8 acres with men indicating an average of 5.0 acres and women 4.6 acres) than in Changarawe (3.6 acres, with men on average 3.9 acres and women 3.4 acres). Concerning the level of education among the respondents of the household survey, the majority completed only primary education (60.9% in Changarawe, 58.3% in Vikenge). Table 6.1. further shows small differences among our respondents in the two villages: while in Vikenge there is a higher percentage of respondents who did not benefit from formal education, at the same time, there is also a higher percentage of respondents with advanced secondary education and tertiary education28. Table 6.1. Level of education of Changarawe and Vikenge household survey respondents
Total 100.0 100.0 100 100.0 100.0 100 100.0 100 100
26
Differences in occupation between men and women in Vikenge are significant (2
=14.62, p=0.01), differences in main occupation between the two villages and between men and women in Changarawe are not significant
(between villages, (2
=8.53, p=0.29, between men and women in Changarawe 2= 11.62, p=0.11).
27 Differences between the two villages are, however, not significant (
2= 5.04, p=0.17). Differences between
men and women are higher in Vikenge: 41.3% of the men indicated that their household owns land, compared to 48.6% of the women. 39.1% of the men said that their household both owns and rents land, compared to
29.0% of the women (differences between the answers of men and women are not significant, 2= 3.05,
p=0.38). In Changarawe 38.9% of the men said that their household owns land, compared to 38.4% of the women, while 28.9% of the men indicate their household owns and rents land, compared to 31.3% of the
women (differences between the responses of men and women are not significant, 2
= 0.12, p= 0.99). 28
Differences between the two villages are not significant (2 = 4.94 p= 0.55). Differences between men and
women within the two villages are significant, especially in Vikenge (2 =19.67, p= 0.003, in Changarawe p= 0.08,
2 = 11.42).
34
Finally (and somehow related to the next issue), it is interesting to highlight that the Morogoro region has a history of involvement in cooperative activities, which is amongst others evident from the strong presence of Savings and Credit Cooperatives (SACCOS) which are locally known as VICOBAs (Village Community Banks). Membership of all kinds of cooperatives (such as SACCOS, consumer cooperatives and marketing cooperatives) is particularly high in Mvomero district.
6.4 Cultural context
Various Afrobarometer survey rounds (see e.g. rounds 3, 4 and 5) highlight that Tanzanians generally do not have an attitude of scepticism about authority which is partially linked to a history of one-party structures. In line with this, a REPOA survey shows that Tanzanians, particularly women, are embedded in a culture of acceptance. Even though gradually more people are voicing claims, these are individual initiatives and no instances of collective action. This is amongst others illustrated by survey findings which highlight that 79% of the rural and 80% of the urban interviewees would never attend a demonstration (Hoffman, 2013). There is generally also little incentive to sanction others for violating rules such as the use of footwear around water points because of local existing networks and the dislike of conflict. In line with this REPOA study and Lecoutere (2011) who describes in her study on water management how distributive conflicts are avoided, the preliminary study in Changarawe and Vikenge (Matekere and Van Aelst, 2014) shows that open confrontation is not culturally accepted and not really allowed in either of the villages. This culture of open conflict avoidance may obviously also impact upon the effectiveness of community-based types of monitoring and/or the feasibility and effectiveness of NPM-type of reforms as these are often built upon mechanisms such as ‘naming and shaming’, sanctioning and open confrontation. It is in this respect also interesting to refer to Kelsall (2008: 11) who highlights in his research that “the lack of fit between the local culture and imported institutions of accountability creates incentives for rule-breaking and opportunities for self-enrichment”. The importance of taking into account the local culture when implementing NPM-types of reforms (including the recently implemented BRN) was also emphasized in a recent study on the effectiveness of a Pay for Performance (P4P) scheme to lower home birth in Mvomero district (see Chimhutu et al., 2014). Whereas the scheme was effective in increasing the number of institutional deliveries (with health workers being particularly inclined to use coercive strategies against village women), payments to health workers and facilities were not made in line with performance but rather equally spread over different health facilities, irrespective of their performance. While this violation of the basic principle of P4P may be partly linked to the lack of a well-functioning M&E mechanism upon which the implementation of the principle is conditional, the authors suggest that the predominance of the egalitarian fairness principle in the Tanzanian context has also shaped the way in which the programme was implemented. In more egalitarian societies (as opposed to libertarian) performance-based incentives tend to be considered unfair as individuals should not be held responsible for factors beyond their control. Adding to this is the fact that existing social relationships among local policy makers and health workers make it even more difficult to reward health workers based on performance (see Chimhutu et al., 2014). The implementation of performance related pay might also not always be politically feasible. This is for instance the case in the education sector where salaries of teaches is something that is not easily challenged because they are the largest group of public employees and important allies for CCM at times of elections (Therkildsen, 2000; Kelsall, 2002). Communities in Tanzania are also often reluctant to participate in all types of participatory exercises, which may partly be linked to a history of coerced demands for participation under the Villagization policy. This type of top-down demands for participation and community labour still exist. For
35
instance in the context of the guideline to build secondary schools in each ward of the country, local communities, also in our case study villages, were ‘forced’ by the District Commissioner to contribute in the form of labour and materials (see also Hoffman, 2013). While villagers do not openly resist participation, there are instances of passive resistance (see also Tilley, 2013). Such culture of passive resistance also typically leads to large implementation gaps and instances of ‘ritualized’ reforms. The latter is for instance obvious in the case of the Opportunities and Obstacles approach to development planning processes which have either not been implemented or only in a ritual manner (see also section 5.1.1.). In terms of ethnic composition, whereas the Luguru are the original inhabitants of the area around Changarawe and Vikenge, nowadays the two villages are characterized by ethnic heterogeneity. While the majority of the 401 participants of the household surveys is Luguru (i.e. 62.9% in Changarawe and 70.4% in Vikenge), 29 and 22 other tribes are represented among our household survey respondents in Changarawe and Vikenge respectively. Focusing only on the local actors involved in water service delivery and governance, the picture is somewhat different: 7 out of 14 Changarawee interviewees are Luguru (50%), while the other 7 all belong to different ethnic groups. In Vikenge, 3 out of 9 interviewees are Luguru (33.3%) while the other 6 belong to different ethnic groups. In the two villages, no real tensions are reported between the different ethnic groups (Matekere and Van Aelst, 2014). Elites are present in both villages and mostly based on professional status. Because of the proximity of Mzumbe University, some of the elite members are professors from Mzumbe, who sometimes live on campus or in the villages. In both villages, the elite is somehow integrated though they often live in fenced houses (Matekere and Van Aelst, 2014). In line with the culture of open conflict resistance and conflict minimization, there generally exists a strong preference for pragmatic problem solving (see Lecoutere, 2011) or to solve conflicts at the lowest level possible which leads to very few cases being brought to court (see also Maganga, 1999). This also holds for our case study villages where conflicts over scare resources are normally settled by hamlet chairpersons. If the conflict is not solved, then it is taken to the police station and only in those exceptional cases where no solution is found at that level, it is brought to court. Conflicts between people who worship in one denomination are sometimes also solved by religious leaders and whenever there is a conflict, the focus always remains on cooperation (Matekere and Van Aelst, 2014). Taboos on the use of resources or fear of sorcery when taboos are not respected used to exist in both villages and have somehow declined due to the mixing of people from different ethnic backgrounds. However, within ethnic groups and at the household and extended family level taboos and fear of sorcery still have a major influence29 (Matekere and Van Aelst, 2014). This is in line with findings of Colding and Folke (2001) who highlight that particularly where the same norms are shared by the community, supernatural enforcement mechanisms are less costly to hold people accountable. Such systems where people do not directly accuse or punish also often match the local socio-cultural context better (see e.g. Colding and Folke, 2001; Sasoake and Laumonier, 2012). It has also been showcased that when people feel they cannot expect much from government (e.g. top-down M&E) or societal institutions (e.g. bottom-up M&E) they also often turn to occult rituals such as pot-breaking (see e.g. Kelsall, 2003; 2008). When it comes to solving conflicts over natural resources, sangu customs are often referred to while some villages (not Changarawe and Vikenge) have installed sungusungu which is borrowed from traditional traditional customary defense organisations (see Cleaver, 2001). Also beyond the local level, there is a renewed interest in traditional and ritual systems of cursing and oathing. Kelsall (2008) refers in this respect to the Prime Minister’s use of a Maasai anti-corruption oath. In combination with public praise and shame these supernatural instruments can be powerful instruments to hold people accountable.
29
In one of her in-depth interviews, K. Van Aelst recorded the case of a couple who did not cultivate their land any longer because they feared to die after it had been cursed with the help of a local medicine man.
36
6.5. Religion
Besides recourse to traditional accountability mechanisms, citizens also often rely upon institutions with religious foundation. In their study on bottom-up accountability mechanisms, Kelsall et al. (2005) highlight that at times of increased citizens’ feelings of institutional malfunctioning, particularly religious institutions remain unblemished, even if in reality these institutions can be divisive and a source of conflict. Particularly evangelical churches increasingly function as multipurpose institutions and networks which are involved in collective labour, conflict resolution etc. (see e.g. Cleaver, 2001). In line with the general situation in Tanzania, our household survey highlights that Muslims and Christians are evenly represented in Changarawe and Vikenge, with Roman Catholics being the most dominant group among the Christians in both villages. In more detail, Roman Catholics are particularly present in Changarawe while in Vikenge Muslims are the most dominant group30. Comparing household data with data from our semi-structured interviews with actors involved in water service delivery and governance highlights that Muslims are particularly underrepresented in Changarawe. Only 14.3% of all actors involved in water governance and only one of the specific water actors (20.0%31) is Muslim. Interviewees further highlighted that there are no open conflicts between different religious groups, but in the search for converts some silent hidden conflicts may arise. Table 6.1.: Religion of household survey respondents and local actors involved in water service delivery and governance (%)
Source: authors’ own household survey and semi-structured interviews
30
Differences between the two villages are significant (2 = 11.64, p= 0.02).
31 The other four (80.0%) specific water actors who live in Changarawe are Roman Catholic.
37
7. Into the action arena: Monitoring & Evaluation (M&E) actors, activities and outputs
This section sketches different M&E actors, mechanisms and activities that are relevant in the rural water service delivery sector. In what follows, we set out with an overview of M&E activities at the level of the community-owned water supply organisations (COWSO) which are the main service delivery units in the water sector (7.1.), after which a distinction is made between top-down actors who are situated at ward and district level and trigger accountability and learning through various M&E-types of instruments (7.2); bottom-up actors such as specific water committees within village councils and village general assemblies who aim at achieving similar objectives (7.3) and media (7.4). Sections 7.1. to 7.4 draw upon insights from semi-structured interviews with actors that are directly and indirectly involved in water service delivery and governance. Section 7.5. gives a brief account of Changarawe and Vikenge’s citizens’ reporting of water-related problems (7.5.1), access to (7.5.2) and perceived quality of water-related information (7.5.3), drawing upon data from the household survey. Figure 7.1. provides an overview of the lines of official reporting between these different actors. Figure 7.1.: lines of official reporting District District Council DC DED PO, IAO Water Engineer Ward Councillor WEO
Sakovicha Village Council VEO General Assembly Service delivery unit at village level COWSO Water Technician COWSO: Community Owned Water Supply Organisations; DC: District Commissioner; DED: District Executive Director; IAO: Internal Audit Office; PO: Planning Officer; WEO: Ward Executive Director; VEO: Village Executive Officer
7.1 Community Owned Water Supply Organisations (COWSOs) and Sakovicha
At local levels COWSOs32 have been installed after the adoption of the Water Sector Development Strategy (NWSDS)(2006-2015). COWSOs are “bodies legally constituted by a community to own, manage, operate and maintain the water supply systems on behalf of the community” (United Republic of Tanzania, 2006: 43). COWSOs can take different forms, including water user groups and private companies, and must be established and registered as independent legal entities (AMCOW, 2011: 14). According to Tilley (2013) it is not entirely clear if a COWSO is a government, civil society
32
The local Swahili name for the COWSO is Chombo cha Maji.
38
or private organisation. While COWSOs did not emerge from the local level and were rather imposed from above, they do seem to contribute to an empowerment of local communities (Tilley, 2013). COWSO responsibilities were previously handled by village water committees. Village water committees (VWC), as part of village councils, were set up in the context of the 1991 Water Policy which aimed at shifting responsibility for rural water supplies from the government to the village (see also Haysom, 2006). However, over time it has increasingly been acknowledged that these committees were often ineffective or not functional (Tilley, 2013). In line with this the 2002 Water Policy and the Water Sector Development Strategy and Programme (WSDS and WSDP) have replaced VWC with more autonomous water entities, such as COWSO, WUA (Water User Associations), WUG (Water User Groups), etc. However, on the ground, autonomous water entities have not been installed everywhere, or they have not yet been registered (which is time-consuming and complex) and even where such entities exist, VWCs also often remain in place (while not necessarily being operational) (AMCOW, 2011; Haystrom, 2006). This often creates tensed relationships and confusion regarding mandates, which also holds in the villages under study where both COWSO and VWC are co-existing. In Changarawe, a COWSO was installed four years ago, after the village council and more particularly the VWC, which was until then responsible for the collection of fees, had been accused of consuming water fees (interviewees). The COWSO in Changarawe has ten members, of which three are women33. The present COWSO in Vikenge was installed one year ago, after the previous one was dissolved because of malfunctioning of the treasurer (interviewees). Vikenge´s COWSO has eight members of which three are women34. The COWSOs collect information on access to and quality of services, behaviour of water users while they are also responsible for revenue collection and information related to the latter. A predetermined checklist for data collection does not exist so far and data is collected on the basis of reality checks (see table 7.1.). One of the COWSO members is the village water technician, who is in charge of technical activities, including daily checking of water sources and connecting of new water consumers. While the village water technician in Changarawe is paid a monthly allowance of 70,000 Tanzanian shilling (other COWSO members receive 50,000 Tanzanian shilling a month), the village water technician (nor the other COWSO members) in Vikenge does not receive an allowance. The water technicians in Changarawe and Vikenge collect data through reality checks, but they do not analyse or validate data or write reports. Nevertheless, findings are discussed with other members of the COWSOs (interviewees). The chair, secretary and treasurer of the COWSOs of Changarawe and Vikenge, as well as the members of COWSOs of two other villages (Kongo and Sanga Sanga), meet and exchange information through the Sakovicha Water User Association (12 members35), which is responsible for ensuring water supply in the four villages. The association focuses on the functioning of the four COWSOs and reports to the district council.
33
Two of these women are also household survey interviewees. 34
Three male members are also household survey interviewees. 35
Three of our household survey respondents (one women in Changarawe and two men in Vikenge) are member of Sakovicha.
39
Table 7.1.: M&E activities and quality of M&E outputs of the COWSOs in Changarawe and Vikenge (self-reported)
M&E activities and outputs
Changarawe Vikenge Sakovicha
COWSO Water technician
COWSO Water technician
Collection of data through…
reality check reality check reality check passive: informed by citizens
reality check reality check
Change in M&E activities over time
No increase increase no increase
Channel dissemination of information
reports sent through regular post
information is verbally shared face to face and through telephone
reports handed over face to face
information is verbally shared face to face and through telephone
reports handed over face to face
Quality of outputs: Timely sometimes always often Credible and reliable
always always always
Respond to specific problems
often always often always always
Understandable for ordinary citizens
often always always
Change in quality M&E outputs over time
increase increase no increase
Source: authors’ own semi-structured interviews The increase in M&E activities of Changarawe´s water technician is related to an increase in the number of public taps from six to twelve. Due to more experience, the quality of COWSO´s M&E outputs increased. While Vikenge´s water technician does not point out an increase in M&E activities or quality of M&E outputs, according to the chairperson of the COWSO both M&E activities and quality of M&E outputs increased due to an increase in population and feedback from the VEO respectively. The district has a role in the increase of Sakovicha´s M&E activities (more pressure) and quality of M&E outputs (more directions on how to report).
7.2 District and ward level actors
7.2.1 General (non-water specific)
Most of the actors interviewed are indirectly involved in the water sector. The lines of accountability between different sets of actors are often unclear and this particularly holds for the relationships among the District Commissioner (DC), the District Executive Director (DED) and the elected officials, councillors and members of parliament (see Harris et al., 2011). The District Commissioner (DC) is the most powerful officer in the district with major influence over the DED and the entire civil service. While he has no constitutional power, he represents the central government and the party (CCM) and officially reports to the Prime Minister’s Office (interviewee). According to Harris et al. (2011) and Hoffman (2013) the distinction between the central and local level tends to be blurred by the District Commissioner, who has informal but substantial power which also holds for the case of Mvomero district where the district commissioner is well connected to different actors situated at
40
ward and village level, amongst others through their CCM membership. In districts where the elected council is active there is often a tension between the Council and the District Commissioner. Such tensions were not reported in Mvomero District (interviewees). While the DC is in reality the most powerful officer in the district, the District Executive Director (DED) is formally the most powerful civil servant in the district. The District Executive Director is not a party official, but appointed by the Prime Minister and he is the head of the local government administration. He/ she is e.g. responsible for approving budgets and projects (Harris et al., 2011) and reports to the Prime Minister´s Office and the District Commissioner. The District Executive Director is the chairperson of the District Management Team (Cooksey and Kikula, 2005), which includes all heads of departments in the District Council and he is responsible for district planning. Some department heads are still appointed by the central government, as a result of which department heads are sometimes more royal to their professional department in the sector ministries (Cooksey and Kikula, 2005) and which makes it difficult for councils to discipline them (Braathen et al., 2005). Civil servants are officially not allowed to be member of a political party, but some of the interviewed district civil servants disclosed that they are member of CCM (see also 6.1). An important actor of top-down (financial) accountability at district level is the Internal Audit Office, which has three staff members (including one woman who is heading the office) in Mvomero District. The Internal Audit Office is amongst others responsible for controlling the spending of district funds. All three staff members have been trained in auditing and follow a standardized audit programme to perform audits. According to the head of the Internal Audit Office audit reports are always credible and reliable and while reports are mostly responding to specific problems and understandable for ordinary citizens, they are not always finalised on time. This is mainly related to the fact that an increasing number of entities need to be audited with the same number of staff members (interviewees). On the other hand, quality of reports seems to have increased due to training, experience and feedback of those who read the reports and ask for clarification or additional information and due to more pressure from donors. The DED appoints the Ward Executive Officers (WEO) and Village Executive Officers (VEO) (Harris et al., 2011). The Ward Executive Officer directly reports to the DED, while the VEO reports to the WEO (interviewees). The Ward Executive Officer and Village Executive Officer are responsible for revenue collection, developmental issues and law-and-order functions at ward and village level respectively while the VEO is also the secretary of the Village Council (Braathen et al., 2005). Both the Ward Executive Officer of Mzumbe Ward and the Village Executive Officer of Changarawe live in Morogoro town, thus outside the ward and village where they work, while the Village Executive Officer of Vikenge lives in a neighbouring village (Tangeni). Both Village Executive Officers are from the same local tribe (Luguru) and alike many other citizens they combine their formal job with farming activities (interviewees). This is in contrast with the Ward Executive Officer who does not perform any agricultural activities while she also belongs to another tribe (Sukuma) (interviewees). Another set of actors involved are the elected officials, councillors and members of parliament. They have little formal power and plan projects from discretionary budgets. They themselves tend to be the most accountable set of actors because they are elected (interviewees; see also Kaduma et al., 2011). According to the law, 30% of the elected councillors should be women (Braathen et al. 2005), which is with 29% almost attained in Mvomero district (interviewees). Generally there is a strong sense of distrust between elected councillors and formally employed administrative (district) staff and difficulties in understanding the division of responsibilities and roles. Employed (district) staff generally perceive councillors to be less educated and to meddle in administrative affairs which they consider to be the domain of technical experts. Councillors on the other hand think that (district) staff undermine them and use resources for private gain (Braathen et al., 2005). In Mvomero district, SNV Tanzania has implemented a councillors´ coaching programme, as the improvement of
41
institutional dynamics are increasingly recognised as being a crucial element of sector budget support. This programme was specifically aimed at the water, sanitation and hygiene (WaSH) sector to contribute to a better understanding in WaSH planning, budgeting and implementing. Existing data and contacts with citizens are used to keep the executive accountable (SNV, 2011). In Mvomero district, the Education, Health and Water Committee, which consists of twelve members (of which four are women) from the district council, is responsible for supervision of social service delivery to communities. The Education, Health and Water Committee collects and validates data and submits quarterly reports to the District Council. However, data collection and analysis is not done in a systematic way, nor is it done according to a specific template or format while councillors do not receive a specific training. In most cases, data is related to ad-hoc reality checks in councillors’ villages of residence or it is based upon anecdotal evidence reported by citizens. This also holds for the village of Vikenge (and the neighbouring village of Changarawe) where the head (councillor) of the District Education, Health and Water Committee resides who is actively involved in local-level reality checks and considered an influential person by many of the actors interviewed (at village, ward and district level)(see table 7.1.). In fact, various interviewees hinted at the fact that she influenced the allocation of more water points within the district in favour of Vikenge. Ward Councillors are members of the district council, but they are elected at ward level during general elections36. The councillor of Mzumbe ward is a CCM member and is now living in Morogoro Municipal. The councillor is the chairperson of the Ward Development Committee, which is responsible for general supervision of education, health and water issues. In Mzumbe ward, the Ward Development Committee37 has seven members (in addition to the Ward Councillor), all of which are men. Similar to the Education, Health and Water Committee, the Ward Development Committee does not collect and validate data systematically, but acts on information received from citizens in an ad-hoc manner (interviewees) (see table 7.3.). Written reports prepared by the Ward Development Committee are handed over to the Ward Councillors. Both the Ward Development Committee and the District Education, Health and Water Committee indicate that M&E activities have increased due to an increase in population while quality of M&E outputs have increased due to feedback received on reports. Table 7.2.: M&E activities and quality of M&E outputs of the Ward Development Committee and District Social Service Committee (self-reported)
Ward Development Committee District Education, Health and Water Committee
(ad hoc) collection of data through…
reality check key informant interviews passive: informed by citizens
reality check passive: informed by citizens
Change in M&E activities increase increase
Channel dissemination of information
reports handed over face to face
reports handed over face to face
Quality of outputs: Timely often always Credible and reliable always always
36
There are also councillors who are elected at division level as women’s representatives (a division is composed of different wards). In the case of Mlali division (to which Mzumbe ward belongs) one of these female councilors is living in Vikenge and another one in Changarawe. 37
The Ward Development Committee is composed of all village chairpersons within the ward (7 in the case of Mzumbe ward), the ward councillor who is the chairperson and the ward executive director (secretary). In addition, there might be invited members for specific topics, such as education, health, water, etc.
42
Respond to specific problems often often Understandable for ordinary citizens
always always
Change in quality M&E outputs
increase increase
Source: authors’ own semi-structured interviews
7.2.2 Water actors At district level, the District Water Engineer is in charge of six staff members, who are involved in planning, design construction and supervision of community water schemes and COWSOs. Currently, there is no systematic approach in doing this follow up and monitoring which is also evident from the fact that there is no format for reporting from village to the district level. However, our interviewees highlighted that the set up of a reporting system and format is one of the issues the Water Ministry is currently working on, which is also in line with the Water Sector Development Programme Phase II. The District Water Engineer himself reports to the District Executive Director. One of the members of the water department is the water technician, who is specifically responsible for technical water related activities, including daily reporting and checking the functionality of water supply systems in the villages. He reports to the District Water Engineer. Table 7.3.: M&E activities and quality of M&E outputs of the District Water Engineer and District Water Technician (self-reported)
M&E activities and outputs
District Water Engineer
District Water Technician
Collection of data through…
reality check management information system
reality check
Change in M&E activities over time
increase Increase
Channel dissemination of information
face to face during meetings regular post internet
face to face during meetings
Quality of outputs: Timely always often Credible and reliable
always always
Respond to specific problems
always always
Understandable for ordinary citizens
often sometimes
Change in quality M&E outputs over time
increase increase
Source: authors’ own semi-structured interviews Both the District Water Engineer and the District Water Technician mention an increase in M&E activities and an increase in the quality of M&E outputs. The M&E activities increased due to a general increase in workload, e.g. under influence of the Big Results Now initiative, while the number of staff decreased. The District Water Engineer also points to more pressure from funding agencies
43
such as the World Bank. The quality of M&E outputs increased due to more experience and feedback while the Ministry of Water also provides trainings and workshops.
7.3 Village level actors
As regards the water sector, there do not exist citizen-led bottom up entities or initiatives that hold the service delivery entities accountable. There are two major organs of governance at the village level, the village assembly (VA) and Village Council (VC) to which service delivery entities (in general) are accountable (i.e. top-down political accountability) and through citizens can hold service delivery entities indirectly accountable (i.e. bottom-up representative accountability). The Village Council consists of a chairman (elected by the Village Assembly), chairmen of all the hamlets of the village (elected by the adult members of the hamlet) and at least 15 and not more than 25 village councillors (elected by the Village Assembly) (Uwazi, n.d.). The village councils of Changarawe and Vikenge both have 25 members, of which respectively 10 and 12 are women (interviewees). Both chairmen of Changarawe and Vikenge belong to CCM and have lived for almost their entire lives in their village. In Changarawe the Village Council discusses and approves the village development plan, which is prepared by the Village Executive Officer (VEO), the chairperson of the village committees and experts of the village. A budget ceiling is not available; the plan is based on what they intend to achieve and the predicted income from local sources and a Mkukuta development fund which is provided by the district. While it is drafted according to the O&OD methodology, in practice citizens did not participate in the elaboration of the plan while the absence of a budget ceiling renders the planning and budgeting exercise a cosmetic and frustrating undertaking. In fact, this might hint at a case of ‘isomorphic mimicry’ in which the VEO and village council have ‘imitated’ a format without real functionality (see Pritchett et al., 2010). In Vikenge, there is no real village development plan but rather a list of objectives and priorities which can easily change due to shifting priorities and in particular central-level orders (Matekere and Van Aelst, 2014). In Changarawe and Vikenge decisions of the Village Council and the District Council and information about revenues and expenditures are made public to citizens through the Village Assembly, notice boards and verbal announcements (Matekere and Van Aelst, 2014). The Village Assembly is responsible for the election and removal of the members of the village council (Uwazi, n.d.). All villagers aged above 18 years are member of the Village Assembly (Uwazi, n.d.), which is the sovereign oversight body at village/ hamlet level and which role is in practice rather consultative (Cooksey and Kikula, 2005). In both Changarawe and Vikenge village meetings are supposed to be organised every three months, but in practice they are not systematically conducted and attendance is unpredictable (Matekere and Van Aelst, 2014). According to interviewees, village meetings are not about setting local priorities, but rather about the provision of orders from above. Village Council members can participate in commissions which are located in between the council and administration. They oversee the implementation of council decisions and the work of the administrative departments (REPOA, 2008). Both Changarawe and Vikenge have a committee that deals with water: the water committee with ten members (of which three women) in Changarawe and the Social Services Committee with eight members in Vikenge. As the Social Services Committee is also responsible for education and health issues there is a specific subcommittee that supervises water issues in the village. The Water Committee in Changarawe reports indirectly to the village council through the chair of the village council, while the Social Services Committee in Vikenge does this reporting through the Village Executive Officer (who is the secretary of the village council). As mentioned above village water committees were previously responsible for water point management, including financial management. As presently they supervise the operation of the
44
COWSO, which are now responsible for water point management, the relationship between the two is rather challenging (Tilley, 2013). Similar to the Ward Development Committee and the District Welfare Committee, both committees do not collect data systematically. They collect and validate ad hoc data on quality and delivery of and access to services, revenue collection and behaviour of users. Vikenge´s Social Services Committee also collects information on budget allocation to the water sector. While both committees discuss findings, only Changarawe´s Water Committee writes reports as well. As table 7.5. shows, the M&E activities of both committees increased, due to more pressure from citizens in Changarawe and due to an increase in population and therefore an increase in the number of taps in Vikenge. The quality of M&E outputs increased as well, in Changarawe due to more pressure from citizens, in Vikenge due to an increase in resources (time, budget, training) and more experience. Table 7.4.: M&E activities and quality of M&E outputs of Water Committee (Changarawe) and Social Services Committee (Vikenge) (self-reported)
Water Committee Changarawe
Social Services Committee Vikenge
(ad hoc) collection of data through
reality check reality check
Change in M&E activities over time
increase increase
Channel dissemination of information
reports sent through regular post and handed over face to face
information is verbally shared face to face
Quality of outputs: Timely always often Credible and reliable always often Respond to specific problems often always Understandable for ordinary citizens
sometimes always
Change in quality M&E outputs over time
increase increase
Source: authors’ own semi-structured interviews
7.4 Local Media
A local television and radio station that has an influence in the water sector in Changarawe and Vikenge is Abood Media which acts as a mechanism of bottom-up societal accountability. Abood media has 35 staff members (of which 10 women) and is active in the Morogoro region. In addition to entertainment Abood Media aims to inform the population and increase awareness regarding important development issues. Data on water related issues is collected through reality checks and interviews with key informants. According to one of the programme managers M&E activities and the quality of M&E outputs have increased due to more importance attached to M&E and more attention to the quality of outputs in the organisation. The quality of M&E outputs is perceived to be sometimes timely and always credible and reliable, responding to specific problems and understandable for ordinary citizens.
45
7.5 Citizens’ reporting of and access to water-related information
7.5.1. Citizens’ reporting of water-related problems
In case citizens have water related complaints, many of them report to the Village Water Committee or to the local government, as is highlighted in table 7.5. About one third of the household survey respondents also mention the COWSO and higher level government as an authority to report problems to. Particularly the differences between men and women in reporting to local politicians is quite striking. In Changarawe none of the women report to local politicians and in Vikenge only 2.8% of the female respondents, while 15.6% and 19.6% of male respondents in Changarawe and Vikenge respectively report to local politicians. On the other hand none of the men report to traditional village leaders, while a few of the women in both villages do. Table 7.5.: Respondents report complaints to (%)
Changarawe Vikenge
Men (N=90)
Women (N=112)
Total (N= 202)
Men (N=92)
Women (N=107)
Total (n=199)
COWSO 40.0 33.9 36.6 30.4 27.1 28.6 Village Water Committee
76.7 79.5 78.2 77.2 89.7 83.9
Local government 73.3 67.0 69.8 90.2 72.9 80.9 Higher level government 30.0 30.4 30.2 34.8 36.4 35.7 Donor agency 4.4 1.8 3.0 1.1 0.9 1.0 Local politicians 15.6 0.0 6.9 19.6 2.8 10.6 Traditional village leader 0.0 2.7 1.5 0.0 0.9 0.5 Powerful villagers 0.0 0.0 0.0 1.1 0.0 0.5 Other 4.4 0.0 2.0 3.3 0.0 1.5
Source: authors’ own household survey
7.5.2 Citizens’ access to water-related information The majority of respondents in Changarawe and Vikenge receive information on water related issues; more specifically, 83.4% of the respondents in Changarawe and 94% in Vikenge. Of the male respondents in Vikenge even 98.9% receive information (compared to 89.7% of the female respondents). Differences between the two villages and between men and women in Vikenge are significant38. Table 7.6. shows that most of the respondents receive information on the location and functionality of water points. On most of the topics relatively more respondents in Vikenge receive information; only on the functioning of water boards and committees relatively more respondents in Changarawe receive information. While there are differences among the villages, there are as well differences between men and women. While male respondents in both villages report more often to receive information on location and functionality of water points and the number of water users, relatively more female respondents highlight that they receive information on budgets, quality of water and functioning of water boards and committees.
38
Differences between Changarawe and Vikenge: 2=11.05, p=0.001; differences between men and women in
Vikenge: 2=7.38, p= 0.01. Differences between men and women in Changarawe are not significant:
2=0.09,
p=0.77.
46
Table 7.6.: Issues on which respondents receive information (%)
Changarawe Vikenge
Men (N=75)
Women (N=91)
Total (N=166)
Men (N=91)
Women (N=96)
Total (n=187)
Location of water points 76.0 64.8 69.9 93.4 71.9 82.4 Functionality of water points 53.3 49.5 51.2 81.3 51.0 65.8 Budgets 33.3 59.3 47.6 44.0 65.6 55.1 Quality of water 28.0 52.7 41.6 42.9 49.0 46.0 Functioning of water boards and committees
28.0 31.9 30.1 18.7 29.2 24.1
Number of water users 20.0 8.8 13.9 37.4 5.2 20.9 Other issues 17.3 1.1 8.4 9.9 2.1 5.9
Respondents would in particular like to receive information on water quality. Differences between currently received information (Table 7.6) and information respondents would like to receive (Table 7.7.) is 32.2% in Changarawe and 34.9% in Vikenge. As relatively more women already receive information on water quality, differences for male respondents are higher (47.6% in Changarawe and 52.8% in Vikenge). Respondents would also like to receive more information on budgets and the functioning of water boards and committees (differences of 10.8% and 5.5% respectively in Changarawe; 13.7% and 14.1% respectively in Vikenge). Differences between currently received information and information respondents would like to receive are particularly high on the issue of functioning of water boards and committees for male respondents in Vikenge (a difference of 42.2%). Table 7.7.: Issues on which respondents would like to receive information (%)
Changarawe Vikenge
Men (N=90)
Women (N=112)
Total (N=202)
Men (N=92)
Women (N=107)
Total (n=199)
Location of water points 84.4 72.3 77.7 95.7 65.4 79.4 Functionality of water points
46.7 42.9 44.6 45.7 35.5 40.2
Budgets 60.0 57.1 58.4 59.8 76.6 68.8 Quality of water 75.6 72.3 73.8 95.7 68.2 80.9 Functioning of water boards and committees
53.3 21.4 35.6 60.9 18.7 38.2
Number of water users 2.2 0.0 1.0 6.5 0.0 3.0 Other issues
Source: authors’ own household survey As table 7.8 highlights the Village Water Committee is the most important source of information in Changarawe and in Vikenge and this holds for both men and women. Among respondents who indicated only one channel of information (29 in Changarawe and 19 in Vikenge)39 the Village Water Committee is also most often mentioned (27.6% in Changarawe and 36.8% in Vikenge). Other important channels include friends and neighbours, the Village Council and local village leaders. These channels (as well as text messaging) are also mentioned among the respondents who indicated only one channel of information40. While relatively more respondents in Vikenge receive information
39
Differences between respondents who indicated only one channel in Changarawe and Vikenge are not
significant (2=8.61, p= 0.20), neither are differences between men and women in both villages (Changarawe:
2=3.84, p= 0.57; Vikenge:
2=5.91, p=0.21).
40 Friends and neighbours: 10.3% in Changarawe and 0.0% in Vikenge; Village Council: 10.3% in Changarawe
and 21.1% in Vikenge; local village leaders: 24.1% in Changarawe and 5.3% in Vikenge; text message: 0.0% in Changarawe and 5.3% in Vikenge.
47
through most of the channels, this is not the case for the COWSO, which is apparently more pro-active in transferring information to citizens in Changarawe. Table 7.8.: Channels through which respondents receive information (%)
Changarawe Vikenge
Men (N=75)
Women (N=91)
Total (N=166)
Men (N=91)
Women (N=96)
Total (n=187)
COWSO 28.0 41.8 35.5 16.5 20.8 18.7 Village Water Committee
53.3 70.3 62.7 73.6 70.8 72.2
Village Council 30.7 51.6 42.2 23.1 38.5 57.2 Media 29.3 13.2 20.5 46.2 7.3 26.2 Text message 4.0 2.2 3.0 0.0 15.6 8.0 Internet 0.0 0.0 0.0 0.0 0.0 0.0 Friends and neighbours 45.3 57.1 51.8 58.2 58.3 58.3 Church or Mosque 5.3 0.0 2.4 0.0 0.0 0.0 Local village leaders 46.7 37.4 41.6 45.1 47.9 46.5 Family or household member
* Other: 15x Village announcer (Changarawe 6; Vikenge 9) Source: authors’ own household survey Respondents, especially male respondents, would like to receive more information through text messages. While currently 3% and 8% of the respondents in Changarawe and Vikenge respectively receive water related information through text messages (see Table 7.8), 17.8% and 21.6% in Changarawe and Vikenge would like to receive information through this channel (Table 7.9). Differences are more pronounced among men (26% and 28.3% in Changarawe and Vikenge respectively) than among women (5.8% and 0.3% in Changarawe and Vikenge respectively). Respondents, and particularly men, would like to receive more information through media (difference between actual and preferable channel is 22.9% among male respondents in Changarawe and 11.4% in Vikenge, while differences are 7.3% among female respondents in Changarawe and -0.8% among female respondents in Vikenge). Table 7.9.: Channels through which respondents would like to receive information (%)
Changarawe Vikenge
Men (N=90)
Women (N=112)
Total (N=202)
Men (N=92)
Women (N=107)
Total (n=199)
COWSO 41.1 26.8 33.2 26.1 28.0 27.1 Village Water Committee
63.3 80.4 72.8 69.6 83.2 76.9
Village Council 35.6 51.8 44.6 30.4 47.7 39.7 Media 52.2 20.5 34.7 57.6 6.5 30.2 Text message 30.0 8.0 17.8 28.3 15.9 21.6 Internet 2.2 0.0 1.0 0.0 0.0 0.0 Friends and neighbours 34.4 52.7 44.6 54.3 29.9 41.2 Church or Mosque 8.9 1.8 5.0 0.0 0.9 0.5 Local village leaders 35.6 30.4 32.7 43.5 29.9 36.2 Family or household member
Source: authors’ own household survey According to the majority of the respondents, information received increased over time (see Table
7.10). While the differences between the two villages are minimal and not significant (2=5.58, p= 0.13), differences between men and women are statistically significant with relatively more women than men highlighting an increase of the information received over time41. Table 7.10.: Change in information received over time (%)
Changarawe (N=182) Vikenge (N=195)
Men Women Total Men Women Total
Increased over time 39.7 72.1 58.2 51.1 71.4 62.1 Remained stable 52.6 23.1 35.7 47.8 26.7 36.4 Decreased over time 7.7 3.8 5.5 1.1 1.9 1.5 Don´t know 0.0 1.0 0.5 0.0 0.0 0.0
Total 100.0 100.0 100.0 100.0 100.0 100.0
Source: authors’ own household survey
7.5.3 Citizens’ perceived quality of water-related information Most of the household survey respondents are rather positive of the quality of information received, with interviewees in Changarawe being relatively more positive than respondents in Vikenge42: 56.9% of the respondents in Changarawe and 40.9% of the respondents in Vikenge think the quality is either excellent, very good or good (see table 7.11.). Particularly female respondents in Vikenge are positive: 56.0% of them think the quality is either excellent, very good or good compared to 25.5% of the male respondents43. Table 7.11.: Perceived quality of water-related information (%)
Differences are significant, especially in Vikenge (2=24.71, p=0.000); Changarawe (
2=11.87, p= 0.07).
42 Differences between the villages are significant:
2=46.92, p= 0.000.
43 Differences between men and women in Changarawe (
2=11.87, p= 0.07) and Vikenge (
2=24.71, p=0.000)
are statistically significant.
49
8. Use of information
Our classification of different types of use of information based upon M&E activities, findings and outputs was inspired by the rapidly increasing literature on evaluation use. Use of evaluation is usually classified into instrumental use, conceptual use and symbolic use (Weiss et al., 2005). In short, instrumental use refers to evaluation findings giving direction to policy and practice and is the mostly commonly known interpretation of evaluation use. Over time, other notions of evaluation use have been introduced referring to less direct and instrumental uses of evaluation. More specifically, conceptual use refers to evaluation findings feeding into new ideas, concepts and new generalisations while symbolic use is related to findings being used to justify pre-existing preferences and actions (see Weiss et al., 2005). In addition, Patton (1997) introduced process use in order to broaden the concept beyond use related to evaluation findings towards changes in knowledge and behaviour as a result of participation in the evaluation process. These different classifications (instrumental/conceptual/symbolic on the one hand and process/findings on the other hand) are obviously not independent. As Mark and Henry (2004) rightly point out, process use generally overlaps with other types of use, as it can stimulate both instrumental and conceptual use. In our study, we retain the distinction between instrumental and conceptual use, while we are aware of the fact that a process-type of use is likely to be common as formal M&E reports are often lacking and part of evaluative activities take place during meetings where information from monitoring is analysed, discussed and validated. As far as conceptual use is concerned, we focus on use of information for awareness raising among citizens and actors (both actors who are directly as well as indirectly involved in water service delivery and governance) about problems in the sector, such as water scarcity, the lack of functionality of water points or the non-payment of water bills. As regards instrumental use, we further distinguish among three different dimensions of service delivery in line with Skelcher (1993) who differentiates between issues related to service power (power to determine accessibility), strategic power (power to define and specify a service) and structural power (power to decide on selection of important issues and on access to decision-making) (see figure 8.1.). Figure 8.1.: different types of use Conceptual
- Awareness raising Use Instrumental
- Issues related to service power - Issues related to strategic power - Issues related to structural power
As far as service power is concerned, we look in our study at use of M&E information for changes in availability and quality of service delivery and sanctioning of actors and users; M&E information that feeds into changes in revenue collection and budget allocation between sectors and within the water sector is classified as use related to strategic power issues while changes in priority setting and access to decision-making (such as changes in the composition of COWSO, changes in division of responsibilities among COWSO and village water committee) have been included under structural power issues. While we tried to distinguish clearly among the different categories during the semi-structured interviews, we had to re-classify some of the examples referred to by the interviewees during data analysis. This was particularly the case for structural change examples which were in some of the cases better captured under service or strategic power changes.
50
Besides the classification of use displayed in figure 8.1., we also further distinguish among the use of information as perceived by the actors that provide information (the M&E supply side actors) (section 8.1) and the (partly overlapping set of) actors that receive or demand information (the M&E demand side) (section 8.2). 8.1 Use of M&E information from an M&E supply side perspective
Suppliers of water-related information include the COWSOs and Sakovicha (8.1.1.), the District Internal Audit Office, the District Water Engineer (8.1.2.) and the council committees at district, ward and village level (8.1.3.).
8.1.1 Use of M&E information supplied by COWSOs and Sakovicha Table 8.1. provides an overview of the different types of use of information supplied by the Changarawe and Vikenge COWSOs and Sakovicha. Table 8.1.: Use of M&E information from COWSOs in Changarawe and Vikenge and from Sakovicha (as perceived by these actors)
Changarawe Vikenge Sakovicha
COWSO Water technician
COWSO Water technician
Conceptual use
more awareness among actors involved
very much somewhat not at all not at all somewhat
more awareness among citizens much somewhat somewhat not at all not at all
Instrumental use: changes in service power
sanctioning of actors not at all not at all somewhat not at all not at all sanctioning of users much somewhat somewhat not at all not at all
changes in availability of water supply somewhat somewhat somewhat not at all much
changes in quality of water supply somewhat not at all somewhat not at all not at all
Instrumental use: changes in strategic power
changes in revenue collection much not at all somewhat not at all not at all
changes in budget allocation not at all somewhat not at all not at all somewhat
changes of budgets within sector not at all somewhat not at all not at all not at all
Instrumental use: changes in structural power
structural changes (changes in priority setting, access to decision-making, etc.)
not at all somewhat not at all not at all not at all
Source: authors’ own semi-structured interviews Table 8.1. shows that information from most of these water actors is hardly used. Changarawe´s COWSO indicates the highest use while the water technician of Vikenge highlights that information is not used at all. According to Vikenge´s water technician contracts with water users are often not respected because of interference of the village council which makes it difficult to use the available information for sanctioning. He also refers to the fact that there is no clear division of tasks among the COWSO and the village water committee, which was previously responsible for water management in the villages (see 7.3) which somehow demotivates the COWSO. Adding to this is the
51
fact that he is not paid, which further demotivates him to collect and use data (see also 7.1.1.). The importance of providing a payment for those who take responsibility in the COWSO, and as such transform it into a real job with incentives, has also been emphasised in earlier research (see Haystrom, 2006). The chairman of Vikenge´s COWSO is less negative: he refers to some conceptual use, to instrumental use related to changes in service power and contribution of information to changes in revenue collection. He also provides examples of sanctioning of both actors and users: for instance, the previous treasurer of the COWSO was replaced because he was appropriating funds for personal use while users who do not pay are disconnected. Disconnection in case of misuse of water taps is also practiced in Changarawe. According to the COWSO´s chairperson, the information they collected and provided to citizens contributed to more awareness among citizens as the latter now understand the effect of citizens’ own water misuse on the availability and quality of water services. Interestingly, the chairperson highlights that because of the increased awareness, citizens now watch (monitor) themselves if others are misusing water taps. Changarawe´s water technician is the only one who points out the influence of M&E on structural changes. More specifically, he refers to the fact that the information regarding water misuse has led to the introduction of a user contract which, in his opinion, has led to less misuse of water. Sakovicha’s chairperson highlights that their M&E activities only have an indirect effect through the exchange of information among the COWSO members during Sakovicha meetings. He highlights that through such exchanges and discussions COWSO members learn how others are dealing with problems that were diagnosed which may lead to changes in practices elsewhere.
8.1.2 Use of M&E information supplied by district level actors Table 8.2. provides an overview of the different types of use of information supplied by the Internal Audit Office, the District Water Engineer and the District Water Technician. Table 8.2.: Use of information from District level actors (as perceived by these actors)
Internal Audit Office
District Water Engineer
District Water Technician
Conceptual use
more awareness among actors involved much much somewhat more awareness among citizens somewhat much somewhat
Instrumental use: changes in service power
sanctioning of actors much somewhat somewhat
sanctioning of users not at all not at all somewhat
changes in availability of water supply somewhat somewhat somewhat changes in quality of water supply somewhat not at all not at all
Instrumental use: changes in strategic power
changes in revenue collection somewhat not at all somewhat changes in budget allocation not at all not at all somewhat changes of budgets within sector not at all not at all somewhat
Instrumental use: changes in structural power
structural changes (changes in priority setting, changes in access to decision-making, etc.)
somewhat much somewhat
Source: authors’ own semi-structured interviews
52
All three district actors refer to (some) conceptual use and instrumental use for changes in structural power issues. The District Water Engineer refers to the fact that the inclusion of information related to the functionality of water points in progress reports has led to more awareness among actors involved in the water sector. The District Water Technician, however, puts this influence on awareness raising somehow into perspective as reports are mainly written in English to comply with donor M&E needs. The head of the Internal Audit Office highlights that COWSO can be sanctioned if they do not keep their accounts well, but in practice this has not happened often. On the other hand, information from the internal audit office has led to structural changes in practices, more specifically to the use of water metres and COWSO separate bank accounts. These interventions are particularly important from an accountability and sustainability perspective as poor financial management is often one the important factors affecting sustainability. More specifically, the use of water metres may increase revenue collection while separate bank accounts may decrease the use of money for other purposes than operation and maintenance of water points. Besides the immediate effect of generating increased funds for maintenance, improving the quality of financial management may also incentivize some of the water users to pay their bills.
8.1.3 Use of M&E information supplied by district, ward and village committees As discussed in section 7.1.3., council committees at district, ward and village level collect data, but not in a structured way. Table 8.3. provides an overview of the different types of use of information provided by these committees. Table 8.3.: Use of M&E information from committees at district, ward and village level (as perceived by these actors)
District Ed/Health/Wat. Committee
Ward Development Committee
Water Committee Changarawe
Social Services Committee of Vikenge
Conceptual use
more awareness among actors involved Much somewhat much somewhat more awareness among citizens Much somewhat much somewhat
Instrumental use: changes in service power
sanctioning of actors somewhat not at all not at all somewhat
sanctioning of users not at all not at all somewhat somewhat changes in availability of water services somewhat somewhat much somewhat changes in quality of water service somewhat somewhat much not at all
Instrumental use: changes in strategic power
changes in revenue collection somewhat somewhat not at all somewhat
changes in budget allocation somewhat not at all somewhat not at all changes of budgets within sector somewhat not at all not at all not at all
Instrumental use: changes in structural power
structural changes (changes in priority setting, access to decision-making, etc.) somewhat not at all much much
Source: authors’ own semi-structured interviews
53
All committees indicate (some) conceptual use of information. As also indicated by the chairperson of Changarawe´s COWSO (see above), citizens are increasingly becoming aware of water-related problems. According to the District Welfare Committee this awareness resulted in more citizens’ contributions to install additional taps. The chairperson of the Ward Development Committee points towards an increased awareness among the COWSOs as well, as a result of which they have improved their services to the population. Respondents from the committees highlight that their M&E outputs do not contribute much to the sanctioning of actors or users. Both the chairperson of the District Education, Health and Water Committee and the chairperson of Vikenge´s Social Services Committee point out the discontinuance of Vikenge´s previous COWSO as an instance where an actor was sanctioned, amongst others based on their information. Sanctioning of users is not really in the power of the District Education, Health and Water Committee or the Ward Development Committee while Changarawe´s Water Committee and Vikenge´s Social Services Committee highlight that their monitoring indirectly leads to sanctioning as they transfer (ad-hoc) information to the COWSO or the village council. The chairperson of the Social Services Committee also points out an example of contribution to structural changes. More specifically, he refers to the fact that based on the monitoring and the diagnosed problems with the previous COWSO, they have restricted the independency of the current COWSO. While the previous COWSO increased prices of water bills independently, the new one follows the required channel for doing this which involves the intermediation of the village water committee, the village council and the village assembly.
8.1.4 Use of M&E information supplied by local media
Table 8.4: Use of information from local media (as perceived by actor)
Abood media
Conceptual use
more awareness among actors involved somewhat
more awareness among citizens very much
Instrumental use: changes in service power
sanctioning of actors very much
sanctioning of users not at all
changes in availability of water supply very much
changes in quality of water supply very much
Instrumental use: changes in strategic power
changes in revenue collection very much
changes in budget allocation not at all
changes of budgets within sector not at all
Instrumental use: changes in structural power
structural changes not at all
Source: authors’ own semi-structured interviews Use of Abood´s information is mainly related to conceptual use and instrumental use in the area of service power issues, such as availability and quality of water services as well as sanctioning of actors. One of the journalists at Abood Media specifically deals with water-related issues which has led to more water-related problems being revealed, which has, according to Abood’s programme manager, contributed to citizens’ awareness raising and indirectly to sanctioning of actors.
54
8.2 Use of M&E information from an M&E demand side perspective
Actors that demand M&E information include top-down actors at district and ward levels (8.2.1.), bottom-up actors at village level (8.2.2.) and village actors (Village Executive Officer, Council, General Assembly) (8.2.3.).
8.2.1 Use of M&E information by district and ward level actors Table 8.5. provides an overview of the different types of use of water-related information by the District Planning Officer and the Ward Executive Officer. Table 8.5: Use of M&E information by top-down actors
District Planning Officer
WEO
Conceptual use
More awareness about problems in the sector
very much much
Instrumental use: changes in service power
Changes in availability and quality of service delivery
very much very much
Sanctioning of actors very much not at all
Sanctioning of users not at all much
Instrumental use: changes in strategic power
Changes in budget allocation Much much
Changes in revenue collection very much very much
Instrumental use: changes in structural power
Structural changes (changes in priority setting, access to decision-making, etc.)
very much not at all
Source: authors’ own semi-structured interviews The table reveals that the top-down M&E actors involved, and particularly the Planning Officer, use information both conceptually and instrumentally. The Ward Executive Officer provides an example of information contributing to changes at the level of water availability and revenue collection in Vikenge. More specifically, information on a water shortage in Vikenge was shared with the district, which decided that water pipes would be delivered if villagers also made a contribution. This contributed as well to more awareness among the citizens of the importance of collective action while simultaneously increasing citizens’ perceived effectiveness of collective action. More citizens also started sharing water with their neighbours while also the number of shallow wells has increased because of information related to water shortage. It has also attracted the attention of donors, who have contributed to the construction of wells as well. The Planning Officer referred to the set-up of COWSOs as an example of structural change.
8.2.2 Use of M&E information by village level actors
Table 8.6. provides an overview of the different types of use of information by the village actors.
55
Table 8.6. Use of information by the Village Executive Officers, Village Councils and Village General Assemblies in Changarawe and Vikenge
Changarawe Vikenge
Village Executive Officer
Village Council
Village General Assembly
Village Executive Officer
Village Council
Village General Assembly
Conceptual use
Awareness about problems in the sector
somewhat somewhat somewhat much much much
Instrumental use: changes in service power
Changes in availability and quality of service delivery
somewhat somewhat somewhat somewhat much somewhat
Sanctioning of actors not at all not at all not at all not at all not at all not at all
Sanctioning of users somewhat somewhat somewhat somewhat somewhat somewhat
Instrumental use: changes in strategic power
Changes in budget allocation
not at all not at all not at all somewhat not at all somewhat
Changes in revenue collection
somewhat somewhat somewhat somewhat much much
Instrumental: changes in structural power
Structural changes (changes in priority setting, access to decision-making, etc.)
somewhat somewhat somewhat somewhat much much
Source: authors’ own semi-structured interviews The table clearly shows that village actors use information less than top-down actors at district and ward level. The chair of Vikenge´s Village Council indicates the highest use and refers to the use of information to increase awareness of problems among citizens which has, in his opinion, contributed to reduction of water wastage and an increased payment of bills. Vikenge´s Village Executive Officer indicates that due to information more priority has been given to invest in areas with less water. On the basis of information received from the COWSO and the Village Water Committee, Changarawe´s Village Executive Officer advised them to check the water taps more often. He also advised the COWSO to prioritise money for the rehabilitation of water taps. All actors in Changarawe mention the rationing of water, as a result of which water is available for everyone. The chairperson of the Village Council refers to the increase of water bills (revenue collection), as a result of which the COWSO has more funds available for reparations.
56
9. Discussion, conclusion and issues for further research
With the aim to improve local service delivery the government of Tanzania has elaborated a number of reform policies and programmes, including the Tanzania Local Government Reform Programme. Under this programme a set of new mechanisms has been designed to improve governance of local service delivery. These mechanisms are both targeted at the supply and demand side of service delivery and include amongst others the use of different types of monitoring and evaluative (M&E) activities. A distinction can be made between top-down types of M&E activities such as supervision, inspection, audit, district league tables, and performance related incentives; bottom up initiatives, which are often citizen-led (such as monitoring through user committees or associations) and more hybrid forms of combined mechanisms. In academic and policy related literature, there is no unequivocal evidence with regard to the functioning and effectiveness of these different types of instruments. Top-down M&E instruments which are often inspired by the New Public Management (NPM) philosophy often lead to crowding out and misreporting while they have also been criticized for not being locally owned or grounded. While bottom-up M&E initiatives are more locally embedded, they often suffer from a low degree of inclusiveness and limited enforceability. Various studies currently hint at the fact that combined initiatives and the creation of interfaces among the more (citizen-driven) bottom up and top-down state driven mechanisms might be the way forward. Against the background of this inconclusive evidence our exploratory research aims at mapping the functioning and effectiveness of different types of M&E mechanisms in selected villages (Changarawe and Vikenge) around Mzumbe University. More specifically, we map and analyse the functioning of different M&E mechanisms in the water sector and the use of M&E information for changes in local water supply practices and thinking. We distinguish among changes in practices related to the availability and quality of water services (service power issues), revenue collection and budgets for water service delivery (strategic power issues), priority setting and access to decision-making (structural power issues). While use for effective changes in these three areas are examples of instrumental use we also try to capture use for changes in awareness raising (conceptual use). Our mapping exercise draws upon data from semi-structured interviews with 34 actors who are directly and indirectly involved in water service delivery and governance (with a specific focus on M&E) at district, ward and village level. Additionally, household survey data from two randomly selected samples of 129 and 116 households in Changarawe and Vikenge respectively give insight into citizens’ use and satisfaction of water services as well as their accessibility to and perceived quality of water-related information. As there is common agreement on the fact that contextual factors strongly influence the outlook, functioning and effectiveness of different M&E mechanisms, we have adopted Ostrom’s Institutional Analysis and Development (IAD) Framework as a guiding analytical framework. More specifically, the IAD helps to unveil how contextual factors (discussed in chapters 4 to 6), including physical and material conditions, formal and informal rules in use and political, governance, socio-economic, cultural and religious community attributes shape incentive structures that influence behaviour and interactions of different M&E actors. This results in specific M&E activities and outputs (discussed in chapter 7) and use (and non-use) of M&E for changes in local water service practices and awareness raising among water sector actors and citizens (chapter 8). In what follows, we first give a summative overview of the main findings related to the M&E actors, activities and M&E use, subdivided over M&E at the level of community organised water supply organisations, top-down, bottom-up M&E and M&E by local media. In explaining findings, we explore the influence of contextual factors that shape different actors’ incentive structures. Finally, we also sketch some possible linkages with water service outputs and highlight issues for further research.
57
M&E at the level of COWSOs and Sakovicha
With the introduction of the Water Sector Development Programme (WSDP) in 2009 Community Owned Water Supply Organisations (COWSO) have been installed at local level to own, manage, operate and maintain water supply systems on behalf of the communities. In doing this they replace Village Water Committees (VWC) which were installed in the context of the 1991 Water Policy, but which were in many cases not effectively functioning. In Charangawe and Vikenge, COWSOs have only been installed some years ago, while also the VWC are still existing or have been re-installed after they had been dissolved because of financial mismanagement. Together with the COWSO from two neighbouring villages, they have established Sakovicha which supports the 4 COWSOs and functions as a kind of intermediary between the COWSOs and the district water department. Because of increased pressure from the latter, Sakovicha’s quantity and quality of monitoring activities have increased over time. The COWSOs in Changarawe and Vikenge (including the water technicians) are involved in the monitoring of the quantity and quality of water supply, behaviour of users and revenue collection, while analysis (evaluation) is generally lacking. Pre-determined checklists for data collection do not exist and data is mainly collected through reality checks. While monitoring activities of Changarawe´s water technician, Vikenge´s COWSO and Sakovicha have increased over time, monitoring activities of Vikenge´s water technician and Changarawe´s COWSO have remained the same. Reports are written by the COWSOs and Sakovicha and respondents involved are rather positive of the quality of their outputs (only Changarawa´s COWSO indicates that reports are usually late) and also point out an increase in quality over time. Focusing on use of findings as perceived by the chair persons, the water technicians of the COWSOs and the chairperson of Sakovicha highlights that monitoring information is hardly used. Changarawe´s COWSO indicates the highest use, and especially refers to conceptual use (awareness raising), while Vikenge´s water technician highlights that there is no use at all. Vikenge´s water technician refers to the fact that the COWSO is rather demotivated because of an unclear division of labour between the COWSO and the water village committee, which was previously responsible for water management in the village and which still exists. He also refers to the fact that user contracts are often not respected because of interference of the village council. What further does not really incentivize him to monitor water supply or act upon information, is the fact that he does not receive an allowance, as opposed to the water technician in Changarawe. The chairperson of Vikenge´s COWSO is more positive and refers to some instrumental use, especially for changes in availability and quality of water services and sanctioning of water users and actors. As regards the latter, he refers to the fact that the previous COWSO of Vikenge has been replaced by a new one because of the malfunctioning of the treasurer. He also points out an increase in monitoring because of an increased number of water taps, while feedback from the VEO fed into increased quality of reporting. Changarawa´s water technician is the only one who refers to use of information for structural changes when highlighting that information regarding misuse of water has contributed to the introduction of user contracts. As regards learning at the level of COWSOs themselves, the exchange of information among COWSO during Sakovicha’s meetings is considered particularly useful.
Top-down M&E by actors directly and indirectly involved in rural water supply
With respect to top-down M&E we distinguish among i) actors at district, ward and village level; among ii) civil servants versus elected members of councils and committees as well as among iii) specific water actors versus actors who are indirectly involved in water M&E.
58
At district level the most important civil servants involved in water sector M&E (and compiling and aggregating data from local levels) are the District Water Engineer, in charge of the water department, and the District Water Technician, one of the members of the district water department. The District Water Technician mainly collects data through reality checks, while the District Water Engineer also refers to the management information system, which is gradually improving and receiving increased attention in the context of WSDP Phase II. Also the introduction of a specific format for follow-up and monitoring of COWSO is something which is expected to be introduced at district level in the context of WSDP Phase II (under the auspices of the water ministry). This also holds for the set-up of an intermediate service at ward level to improve follow up and support COWSOs technically and institutionally. M&E activities of the district water department have increased due to an increase in water service points as well as because of the Big Results Now Initiative, yet no additional staff have been added to the department. Feedback on reports and increased experience have contributed to an increase in M&E quality. Besides these specific water actors, other actors involved at district level are the District Executive Director who is (officially) the most powerful civil servant at district level who appoints the ward and village executive officers; the Internal Audit Office which is responsible for financial (and performance) auditing of local government entities and service delivery units (such as COWSOs), the Planning Officer; and the District Commissioner (DC) who is the representative of the state and the ruling party (CCM) and in practice the most powerful actor in the district. As the DC tends to control the entire administration, the distinction between politics and administration as well as between the central and local level risks to get blurred. As regards the water sector, the distinction between central and local level is even more unclear, given the fact that the shift in responsibilities from the Water Ministry to LGA has only been implemented since 2006, while there are currently still many centrally-driven water projects. Planning at district level and use of district level water and sanitation plans is also not straightforward given the low predictability of budgets and the absence of a well-functioning water sector management information system (water point mapping) which could feed into more objective needs assessment. While the strengthening of the water sector MIS and allocation of water points on the basis of district water and sanitation plans figures among the priorities of the WSDP Phase II (2014-2019), it is too early to make any assessment regarding progress in this regard. Besides civil servants, also elected councillors are involved in water M&E. Given the fact that they are elected, they tend to be the most accountable set of actors both towards citizens as towards CCM leadership (in particular) as the process of re-election is party-based. At the level of Mvomero district, monitoring is mainly done through the Education, Health and Water Committee that consists of 12 members who are involved in some ad-hoc data collection and reality checks while they mainly rely upon anecdotal evidence reported by citizens to write their reports. A similar type of monitoring is also performed by the members of the ward development committee at ward level. Both committees stated that their monitoring activities have increased due to an increase in Mvomero’s district population while reporting quality increased as a result of feedback received on reports. Given the quality and focus of M&E activities, it does not entirely come as a surprise that monitoring information provided by elected committees at district and ward level is (perceived to be) less used than monitoring information generated by the (water) civil servants at district level. More specifically, committee members highlighted that their M&E findings mainly contributed to awareness raising among citizens and in those instances where monitoring information was also used instrumentally, it was at the level of the availability and quality of water services and not or hardly for sanctioning, strategic or structural power issues. One exceptional case reported was related to the discontinuance of Vikenge’s COWSO which was dissolved because of malfunctioning of the treasurer. This sanctioning was apparently based on information and action from various channels, including committees at district, ward and village level. Besides sanctioning of the COWSO, it also led to a
59
reduced independence of Vikenge’s COWSO which currently has to consult the village council before it can take decisions regarding e.g. the level of water bills. The generally limited use of information from district and ward committees is in contrast to M&E information supplied by the district officers which is often used to sanction water actors like COWSOs, to bring about changes in the quantity and quality of water services and to feed into budgetary allocation and priority setting. As regards financial management, the introduction of water metres and separate bank accounts are considered important structural changes that have been promoted, amongst others, through information regarding financial mismanagement. One of the interviewees also hinted at the fact that information on water shortage in Vikenge, in combination with lobbying from the district councillor residing in Vikenge, led to awareness raising both among actors involved and users which also contributed to joint action for instrumental changes. More specifically, additional water points have been foreseen by the district with support of villagers, which has also led to behavioural changes among users and an increase of perceived effectiveness of collective action. Some interviewees somehow put into perspective the importance of district and ward level M&E for priority setting and budgetary allocation at district and village levels. They rather hint at the overarching influence of central level directives, initiatives such as the ‘Big Results Now’ and individual lobbying of influential councillors (such as the one from Vikenge) in favour of their own villages.
Bottom-up M&E by actors directly and indirectly involved in the water service sector There do not really exist citizen’s led bottom-actors (similar to e.g. a school board in the education sector) that promote accountability to water users and community at large. In Changarawe and Vikenge local actors which somehow represent local citizens (bottom-up representative accountability), include the water committee in Changarawe and the water sub-committee of the Social Service Committee in Vikenge. Members of both committees are selected among the village councils and are appointed to follow up water-related issues (in relation to COWSO, they act as a mechanism of top-down political accountability44). Similar to the committees at district and ward level, data collection is not systematic and is mainly based upon villagers’ informal reporting of water-related problems to committee members. Interestingly, our household survey data for both villages (and particularly Vikenge) has highlighted that villagers more often report water-related problems to village water committees than to COWSOs, which might in the case of Vikenge be related to the fact that the currently existing COWSO has only been operational since one year. During committee meetings water-related issues are discussed which are subsequently reported to the village council. The committees do not write reports themselves but the main findings are included in the village council reports which are elaborated by the village executive officer. Village council reports are presented and discussed at village meetings/village general assemblies, which is, in principle, the main body through which villagers can hold the village council (and indirectly service delivery entities) accountable. In reality, participation in village meetings is low, both in Changarawe and Vikenge as citizens feel that it is rather a forum through which central level directives are imposed upon them. Especially the water committee in Changarawe reports conceptual use and instrumental use for changes in availability and quality of water services. In contrast to the COWSOs in both villages, both committees report instrumental use for structural changes. As mentioned above, use of information from Vikenge’s water committee contributed to the discontinuance of the previous COWSO and
44
In relation to citizens, these bodies can be considered mechanisms of bottom-up (vertical upwards) representative accountability while in relation to COWSOs, they are mechanisms of top-down (vertical downwards) political accountability.
60
reduced independence of the currently existing COWSO. Other local level village actors that use monitoring information include the Village Executive Officers and the chairpersons of the village council, particularly those of Vikenge. They have mainly used monitoring information to increase awareness about water problems and the importance of paying contributions which, in their opinion, has contributed to a reduction of water wastage and an increase in revenue collection.
Local media Local media, including Abood Radio and TV has become more active in follow-up and reporting on water issues, due to more importance attached to M&E within the organisation. One of Abood´s journalists specifically deals with water related issues which has led to more water-related problems being revealed and reported through media. This has contributed to citizens’ awareness raising and indirectly to sanctioning of actors. Our findings point out a number of patterns in M&E activities and use which may be better understood against the background of a contextually grounded analysis of incentives. First, while there are important differences among M&E activities and use of M&E output by different actors, a general conclusion is that there is an important bias towards monitoring at the expense of evaluation. A focus on monitoring may be a logical first step in the set-up of an M&E system as monitoring generally demands less financial and human resources as compared to evaluation. Evaluation is analytically more demanding and needs cross-reading and triangulation among different information sources. This includes e.g. comparison of input data on the one hand with data on activities and outputs on the other hand, comparison of data at the level of activities and outputs on the one hand with data on intermediate and final outcomes on the other hand. As regards the water sector, input data is budgetary data that is available from the Ministry of Finance, activity & output data includes data on the number and spread of water points, their level of functionality, the quality of water available, etc. and this type of data is generated through the routine Management Information Systems such as the Water Point Mapping database which falls under the responsibility of the Water Ministry. Intermediate and final outcome data focuses on effective access and use of water for different purposes by different households (and different members in households) and is available through household surveys undertaken by the National Bureau of Statistics. While the water point mapping system data has significantly improved over time, it remains the weakest chain in the data collection process and it is not yet intensively used for monitoring and planning purposes, particularly not at the local level (see also below). Additionally, as suggested by various sources (see African Ministers’ Council on Water, 2011; Taylor, 2009), there is also often blurring of output and outcome data, which puts into perspective cross-reading and analysis. The relatively weak quality of routine data collection, the blurring of output and outcome data and the fact that cross-reading is analytically demanding and institutionally difficult as it necessitates collaboration between different ministries clearly jeopardizes evaluative activity. However, particularly evaluative activity at different moments in time (needs assessment prior to service delivery), during (evaluation of implementation and effectiveness), and after (evaluation of impact and sustainability) help to get insight into underlying reasons for (non)-performance and feed into learning and improvement. This might be particularly important in the water sector where increased financial investment does not translate into improved and sustainable accessibility. Besides the technical and institutional difficulties surrounding evaluation, a strong one-party state with asymmetric power relations, and considerable corruption, might neither be very much
61
interested in evaluative analysis. In-depth analysis and evidence regarding reasons and responsibilities for limited results in terms of sustained water accessibility might not necessarily be in the interest of those in power who rather want to preserve the status quo. Given the existing local culture of neo-patrimonalism and dislike of conflict, there is also limited citizens’ demand for thorough evaluation. While some of the CSOs and media are becoming more vocal and some of the donors are supporting Transparency and Accountability Initiatives, the impact of these initiatives remains thus far underresearched. Second, the bias towards monitoring at the expense of evaluation might even become more outspoken in the future under the auspices of donor-driven results-based types of mechanisms such as e.g. the Big Results Now initiative. While such initiatives in principle stimulate ‘management for results’ and the set-up of effective M&E mechanisms, in reality they are often misinterpreted as ‘management by results’. In such cases the focus tends to shift towards easy measurable and achievable targets for which additional data collection is organised (quantitative outputs of service delivery) crowding out the less tangible elements of service delivery (quality issues and systemic issues). This bias in monitoring is in fact currently already visible as the focus is much more on monitoring activities related to the offer (service power issues) and much less on the more deep-rooted and more systemic issues related to the composition and functioning of the service delivery entities. While such bias is technically understandable, it is again more politically safe, as particularly analysis of more systemic issues risks to put into perspective existing power relations. If anything, also donors are not necessarily strongly incentivized to invest in sound in-depth evaluative activities in countries such as Tanzania where large amounts of funds have been channelled through SWAPs and budget support, among others in the water sector. In fact, they can not be too openly critical of performance in terms of service delivery outcomes or existing accountability and learning mechanisms as the M&E outputs produced by the country itself are an important source of their own reporting to their home constituencies (see also Holvoet and Rombouts, 2008). In addition, as donor agencies are generally under pressure to disburse, they will not be inclined to withdraw their support even if efforts of recipients (including in strengthening their accountability and learning systems) are low. As recipients are aware of this, they do not have any incentive to make a serious effort (i.e. the Samaritan’s dilemma, see Ostrom et al., 2001) but are rather inclined towards ritual implementation of reforms and processes of isomorphic mimicry (see also Pritchett et al., 2010). Third, increased donor’s involvement in the sector’s M&E mechanisms also often leads to more focus on monitoring of the two extremes of ‘causal’ chains, i.e. ‘inputs’ on the one hand and ‘final outcomes’ on the other hand, at the expense of monitoring of the intermediate levels of activities and outputs. While donors are generally most interested in Public Financial Management (PFM, input level) and Millennium Development Goals (final outcomes), it is particularly information regarding the in-between dimensions (activities and outputs) that is of interest to those involved in local policy-making and implementation. This is related to the fact that the latter levels are more under control of local level supply side actors and change more rapidly. Similar to other countries, data collection regarding inputs (ministry of finance) and final outcomes (statistical office) is already well established while it are typically the Management Information Systems that collect activity and output which are generally less well developed. Positively, the WSDP Phase II underscores at several instances the low quality of the sector’s management information system and emphasizes the importance of the MIS’ strengthening. An important point of attention in this regard is the need for coordinated capacity building as multiple and uncoordinated interventions (e.g. by different donors, or by a parallel implementation of a RBN tracking mechanism) might further complicate the M&E system and lead to additional burdening of local level actors. While the MIS is in principle a particularly valuable tool for local level monitoring and decision-making, it is currently hardly used in this respect as district water and sanitation plans are largely lacking and decision-making and allocation are influenced by other factors (including politics). This limited use does not really incentivize local level staff to invest in the
62
system, while those who prefer to retain the status quo and the current allocation system neither have much interest in strengthening the MIS and its use. Fourth, in the context of the donor-supported WSDP Phase II, it is gradually acknowledged that the more deep-rooted governance (and M&E) issues which affect accountability and learning strongly influence the operation and maintenance of water supply schemes and their sustainability. This is obvious from the fact that the need to monitor, follow-up and support COWSO is emphasized, at least on paper. Whether and how this attention will materialise on the ground, is to a large extent also dependent on the above mentioned context-related factors that are not in favour of such type of monitoring and analysis, let alone for bringing about changes in their operation. In line with the above, our mapping exercise underscores the fact that there is, at least in the villages under study, relatively limited M&E activity of COWSO themselves, little top-down M&E and support of COWSO, while a real bottom-up mechanism for stimulating accountability of COWSO to local citizens and the broader community is largely absent. While the set up of local organisations such as VWC and COWSO to manage local resources nurtures local ownership, experiences with COWSOs in Vikenge and the VWC in Charangawe highlights that limited accountability and capacity of these organisations might lead to financial mismanagement. While there is a need for independence and autonomy of these organisations, there is also need for some form of top-down monitoring of COWSO’s functioning, by actors positioned at ward or district level who have the authority to sanction. Additionally, there is need for some form of bottom-up accountability through the regular dissemination of information (regarding financial issues, number of users, quality of water, functionality of water points) towards citizens. Our household survey has shown that information dissemination already exists, but it could still be further improved particularly in the areas of quality of water, budgets and functioning of COWSO and through the use of some new channels such as mobile technology. Information dissemination to local citizens is necessary to increase answerability of COWSO to local citizens while it might increase as well local ownership, awareness regarding the fact that water is an economic good (and not for free), and incentivize users to pay their bills in case of good financial management. However to stimulate enforceability (and perceived effectiveness), particularly in areas that need more technical knowledge (such as water quality), linkages between bottom-up accountability initiatives and top-down M&E actors are necessary. This might be stimulated through information exchange among local citizens and district level actors, through Memoranda of Understanding between district water department and COWSO, or through initiatives such as joint local-district signatures on COWSO bank accounts (see e.g. Haysom, 2006). Reversely, there is not only need for increased accountability from COWSO to ward or district level, but also need for capacity building of COWSO’s technical and institutional capacity to deal with complex matters such as sustainability of water points which have been transferred from central through district to the local level without much transfer of resources. An intermediate mechanism for learning, might be organisations such as Sakovicha which share experiences amongst each other, or similar types of organisations which are operational at ward level. Additionally, the functioning of COWSO might also increase if its members, and particularly the village water technician, are incentivized through some form of payment. Another element which might influence COWSO’s functioning is more clarity about the division of mandates and responsibilities among the COWSO and the VWC as well as a reduction of the interference of local political actors and local elites who sometimes undermine COWSO’s functioning (e.g. by non-payment of local water bills or the prevention of sanctioning non-payment) which leads to limited perceived effectiveness among COWSO members. Fifth (and related to the above) our findings also generally confirm the importance of credible sanctions for future behaviour (see e.g. Joshi, 2013). Various interviewees have pointed out that sanctioning of past non-compliance, both of actors and citizens, has led to changes in behaviour and
63
a decrease of sanctioning. Additionally, it might as well be that the act of sanctioning further increases perceived effectiveness of those involved in monitoring activities. As mentioned above, the reverse also holds: the non-sanctioning of non-compliance and the undermining of the sanctioning capacity of an organisation such as the COWSO leads to a decline of the perceived effectiveness and eventually its M&E activities. While our exploratory study does not allow to establish causal linkages among M&E activities and use on the one hand and water-related output indicators on the other hand (amongst other because there is no management information system that provides data at village level), it is interesting to highlight a number of observations. Based on our own household surveys and interviews with actors involved in water governance, there are no clear-cut patterns which differentiate functionality of water points in Charangawe and Vikenge. While interviewees in Vikenge are more satisfied regarding water availability for domestic consumption, respondents in Changarawe are more satisfied about quality of water for domestic consumption. With regard to availability and quality of water for farming, a reverse picture emerges with respondents in Changarawe being far more positive than respondents in Vikenge about quantity but less positive about water quality. Interestingly, while most respondents think that the quantity and quality of water has increased over time, this observation is much more outspoken in Vikenge than Changarawe. Household survey interviewees themselves relate these changes mainly to more or less supervision from local government. Particularly in Changarawe, interviewees also hint at increased activities of the COWSO, which is somehow in line with data from our own semi-structured interviews with water governance actors. As regards Vikenge, our semi-structured interviews hint at the influence of a combination of different factors. More specifically, it is thought that information on water shortage in Vikenge, in combination with lobbying by the well-connected district councillor residing in Vikenge, led to awareness raising both among actors involved and users which also contributed to joint action for instrumental changes. More specifically, additional water points have been foreseen by the district with support of villagers, which has also led to behavioural changes among users and an increase of perceived effectiveness of collective action. A better functioning water point mapping system and particularly the availability of village-level disaggregated data, might also be particularly valuable in future research that aims at exploring factors that influence water point functionality. Other interesting issues on the research agenda are the possible increasing influence of media, ICT, internet and mobile technologies. Tanzania is one of the countries where accessibility to internet and mobile technologies in particular is rapidly expanding (see http://www.audiencescapes.org). This technological evolution might have important effects both on the supply and demand for information within and outside government. As regards the Water Sector Management Information System, the WSDP Phase II for instance announces an increased use of ICT which might have an important effect on the availability of data for district planning. Our household surveys highlight that villagers (particularly men) are also increasingly interested to receive information regarding water related issues through text messaging. While we did not specifically interview youth, it is highly likely that the interest to receive water-related information through mobile technology is even higher among this group of citizens who is often also involved in water collection. Higher accessibility and exchange of information obviously opens opportunities and poses considerable challenges (amongst others in terms of gender equality) as well, while particularly the effect in terms of increased use of that information for accountability and learning is uncertain. More specifically, it might be interesting to investigate in what way internet and ICT influence institutionally grounded incentives that shape the behaviour and interaction of different actors involved in water governance and M&E in particular.
64
Similarly, it is also interesting to monitor and analyse how possible changes in the political landscape as a result of the upcoming 2015 elections might affect incentives and different actors’ behaviour in terms of M&E activities and use for accountability and learning. For instance, it is yet unknown what the likely effect will be (if any) of a possible increase in political competition, a reduction of overlap among party and state, etc. Another element which deserves follow-up, is the influence of religion and churches on the topic under study. At this stage, there are not many tensions among different religious groups which are almost evenly represented, and while Roman Catholics are currently the dominant Christian group, an increasing number of citizens are becoming member of the evangelical church. As the latter increasingly function as multipurpose institutions and networks which are involved in collective labour, conflict resolution etc. (see e.g. Cleaver, 2001), there might be as well be an influence on incentives for doing and using M&E (e.g. networking might solve the collective action problem which could increase M&E while networks that are too close might as well limit M&E). Finally, and as already highlighted above, the analysis of the implementation, effectiveness and impact of WSDP Phase II interventions in the area of M&E should be high on the research agenda. The same holds for the Big Results Now initiative, which is particularly interesting as the effectiveness of such as performance-based system depends to a large extent on the set up and functioning of monitoring and evaluation frameworks and mechanisms. A first step in such an evaluative undertaking is the close monitoring and analysis of the implementation of the BRN on the ground as implementation is likely to deviate from the blueprint and to be affected by the particular local setting, by the actors that are responsible for implementation, by the service delivery actors, etc. In other to address some of the above research questions, additional research is needed, including longitudinal research which tracks changes over time, in combination with comparative case study research to zoom into specific factors of interest (such as different types of goods – e.g. education versus water -, different political contexts, etc.) while also in-depth ethnographic research might be needed to capture the influence of more deep-rooted community attributes and the importance of traditional accountability mechanisms.
65
References
African Ministers’ Council on Water (AMCOW) (2011) “Water Supply and Sanitation in Tanzania. Turning Finance into Services for 2015 and Beyond”. Washington D.C.: World Bank, Water and Sanitation Program. Basinga, P., Gertler PJ, Binagwaho A., Soucat A., Sturdy J. and Vermeesch, C. (2011) “Effect on maternal and child health services in Rwanda of payment to primary health-care providers for performance: an impact evaluation”, Lancet 377 (9775): 1421-1428. Björkmann, M. and Svensson, J. (2009) “Power to the people: evidence from a randomized field experiment on community-based monitoring in Uganda”, The Quarterly Journal of Economics 124(2): 735-769. Blackstock, K.L. and Carter, C.E. (2007) “Operationalising sustainability science for a sustainability directive? Reflecting on three pilot projects”, The Geographical Journal 173 (4): 343-357. Braathen, E., Chaligha, A. and Fjeldstad, O. H. (2005) “Local governance, finances and services delivery in Tanzania. A summary of findings from six councils”, Joint Report NIBR, CMI and REPOA. Bratton, M. (2007) “Formal vs. Informal Institutions in Africa”, Journal of Democracy 18 (3): 96-110. Bruns, B., Filmer, D. and Patrinos, H.A. (2011) “Making Schools Work. New Evidence on Accountability Reforms”. Washington DC: The World Bank. Cambridge Education (2010) “Fast Track Initiative Appraisal Report: Updated Education Sector Strategic Plan 2010-2015” (final draft September 2010). Kampala: Government of Uganda, Ministry of Education and Sports and Education Development Partners. Carlitz, R. and McGee, R. (2013) “Raising The Stakes: The Impact of HakiElimu´s Advocacy Work on Education Policy and Budget in Tanzania”, From Analysis to Impact Partnership Initiative Case Study Series No.12. Washington D.C.: International Budget Partnership. Chimhutu, V., Lindkvist, I. and Lange, S. (2014) “When incentives work too well: locally implemented pay for performance (P4P) and adverse sanctions towards home birth in Tanzania – a qualitative study”, BMC Health Services Research 14 (23): 1-12 Cleaver, F. (2001) “Institutional bricolage, conflict and cooperation in Usungu”, IDS Bulletin 32 (4): 26-35. Colding, J. and Folke, C. (2001) “Social taboos: “Invisible” systems of local resource management and biological conservation”, Ecological Application 11 (2): 584-600. Cooksey, B. and Kikula, I. (2005) “When bottom-up meets top-down: The limits of local participation in local government planning in Tanzania”. Repoa, Dar es Salaam. Deiniger, K. and Mpuga, P. (2005) “Does greater accountability improve the quality of public service delivery? Evidence from Uganda”, World Development 33 (1): 171-191 Fjeldstad,O.-H., Katera, L. and Ngalewa, E. (2010) “Planning in local government authorities in Tanzania: Bottom-up meets Top-down”, Repoa Brief nr. 18. Dar es Salaam: Repoa.
66
Fox, J. (2001) “Vertically integrated policy monitoring: A tool for civil society policy advocacy”, Non Profit and voluntary sector quarterly 30 (3): 616-627. Gaventa, J. and McGee, R. (2013) “The Impact of Transparancy and Accountability Initiatives”, Development Policy Review 31: s3-s28. Golooba-Mutebi, F. (2005) “When popular participation won’t improve service provision: primary health care in Uganda”, Development Policy Review 23 (2): 165-182. Golooba-Mutebi, F. (2012) “In search of the right formula: public, private and community-driven provision of safe water in Rwanda and Uganda”, Public administration and development 32: 430-443. Government of the United Republic of Tanzania (2009) “Local Government Reform Programme II (Decentralisation by Devolution), executive summary, July 2008 – June 2013” (draft). Dar es Salaam: Government of the United Republic of Tanzania, Prime Minister´s Office, Regional Administration and Local Government. Harris, D., Domingo, P., Sianga, C., Chengullah, E. and Kavishe, C.B. (2011) “The Political Economy of Social Accountability in Tanzania. Anti-logging Advocacy and the Mama Misitu Campaign”. London: ODI, Accountability in Tanzania Programme. Harrison, G. (2001) “Post-conditionality politics and administrative reform: reflections on the cases of Uganda and Rwanda”, Development and Change 32 (4): 657-679. Haysom A. (2006) “A study of the factors affecting sustainability of rural water supplies in Tanzania”. Dar Es Salaam: WaterAid Tanzania. Hoffman, B.D. (2013) “Political Economy of Tanzania”. Washington, D.C.: Georgetown University, Center for Democracy and Civil Society. Holvoet, N. and Inberg, L. (2009) “Joint sector reviews – M&E experiments in the context of changing aid modalities: experiences from JSRs in the education sector of Burkina Faso, Niger and Mali ”, Public Administration and Development 29(3): 204-217. Holvoet, N., Inberg, L. with Lulu, E. and Matekere, Y. (2015b) “Education Sector Governance in Mvomero District (Tanzania). Mapping monitoring and evaluation actors, activities and use in two selected village of Mzumbe ward (Mvomero District)”, Study report (unpublished). University of Antwerp/Mzumbe University: Institute of Development Policy and Management/Institute of Development Studies. Holvoet, N. and Rombouts, H. (2008) “The challenge of monitoring and evaluation under the new aid modalities: experiences from Rwanda”, Journal of modern African studies 46: 577-602 Hussmann, K. and Mmuya, M. (2007) “Anti-corruption policy making in practice: Tanzania – A Country Case Study” U4 REPORT 1:PART 2E. Ireland, M., Paul, E. and Dujardin, B. (2011) “Can performance-based financing be used to reform health systems in developing countries?”, Bull World Health Organisation 89. Joshi, A. (2013) “Do they Work? Assessing the Impact of Transparency and
67
Accountability Initiatives in Service Delivery”, Development Policy Review 31, Issue supplement S1: s 29-s48. Kaduma, F., Taylor, B. and Kapongola, N. (2011) “We can’t change things”. Dar es Salaam: REPOA Kelsall, T. (2003) “Rituals of verification: indigenous and imported accountability in northern Tanzania”, Africa 73 (2): 174-201 Kelsall, T., Lange S., Mesaki, S. and Mmuya, M. with Kaaya, J.R., Kambele, Z., Minja G., Mlele M., Ndesaulwa, S. and Shule, L. (2005) “Understanding Patterns of Accountability in Tanzania Component 2: The bottom-up perspective - Final Report”. Dar es Salaam, Bergen, Oxford: REPOA, Christian Michelsen Institute Oxford Policy Management Kelsall, T. (2008) “Going with the grain in African Development”, Power and Politics Programme Discussion Paper 1. London: ODI. Kusek, J. and Rist, R. (2004) Ten Steps to Results-based Monitoring and Evaluation System. Washington, DC: World Bank. Lassibille, G., Tan, J., Jesse, C. and Nguyen, T. (2010) “Managing for Results in Primary Education in Madagascar: evaluating the impact of selected workflow interventions”, World Bank Economic Review 24 (2): 303-329 Lawson, Andrew and Lise Rakner (2005) “Understanding Patterns of Accountability in Tanzania: Final Synthesis Report”, Dar es Salaam, Bergen, Oxford: REPOA, Christian Michelsen Institute Oxford Policy Management. Lein, H. and Tagseth, M. (2009) “Tanzanian water policy reforms - between principles and practical applications”, Water Policy (11): 203-220. Lecoutere, E. (2011) “Institutions under construction: resolving resource conflicts in Tanzanian irrigation schemes”, Journal of Eastern African Studies 5 (2): 252-273. Lindberg S.I. (2013) “Mapping accountability: core concept and subtypes”, International Review of Administrative Sciences 79 (2): 202-226. Makombe, I.A.M., Lulu, E.G., Kunkuta, G., Matekere, Y., Ndunguru, M. (2012) “Project 3: Enhancing good governance through integrated community-based activities”, Baseline study report (unpublished). Mzumbe: Mzumbe University. Mark, M.M. and Henry, G.T. (2004) “The Mechanisms and Outcomes of Evaluation Influence”, Evaluation 10 (1): 35-57. Marshall, M.G. and Cole, B.R. (2011) Conflict, Governance, and State Fragility. Vienna: Center for Systematic Peace. Matekere, Y. and Van Aelst, K. (2014) “Preliminary Village Study: Education and Water Sector Governance in Changarawe and Vikenge”, Study Report (unpublished). Mzumbe University/University of Antwerp: Institute of Development Studies/Institute of Development Policy and Management.
68
Mc Gee, R. and Gaventa, J. (2011) “Shifting power? Assessing the impact of transparency and accountability initiatives”, IDS Working Paper 383. Sussex: IDS. Ministry of Planning, Economy and Empowerment and National Bureau of Statistics (2007) “Morogoro Regional Socio-Economic Profile”. Dar es Salaam: Ministry of Planning, Economy and Empowerment and National Bureau of Statistics. Mitchell, A. and Bossert, T (2010) “Decentralization, Governance and Health System Performance: “Where you stand depends on where you sit”, Development Policy Review 28 (6): 669-691. Mollel, H.A. and Tollenaar, A. (2011) “Participation for Development : Does the Decentralisation Policy in Tanzania Make a Difference? Available at SSRN: http://ssrn.com/abstract=1865755 or http://dx.doi.org/10.2139/ssrn.1865755 North, D. C. (1990) Institutions, Institutional Change and Economic Performance. Cambridge: Cambridge University Press. OECD/DAC (2002) Key Terms in Evaluation and Results Based Management. Paris: OECD/DAC. OECD/DAC (2014) Aid at a glance chart Tanzania (http://www.oecd.org/countries/tanzania/recipientcharts.htm#T) Olken, B. (2007) “Monitoring Corruption: Evidence from a Field Experiment in Indonesia”, Journal of Political Economy 115 (2): 200-249. Ostrom, E., Gardner, R. and Walker, J. (1994) Rules, Games, and Common-Pool Resources. Ann Arbor: University of Michigan Press, 1994. Ostrom, E., Gibson, C., Shivakumar, S. and Andersson, K. (2001) Aid, Incentives and Sustainability. An Institutional Analysis of Development Cooperation. Stockholm: Swedish International Development Cooperation Agency. Oxford Policy Management, United Republic of Tanzania and JICA (2013) “Water Sector Development Programme 2007-2014. Evaluation of Phase I”. UK, Oxford: Oxford Policy Management Patton, M. (1997) Utilization-focused Evaluation. Thousand Oaks: Sage. Polski, M-M, and Ostrom, E. (1999) “An Institutional Framework for Policy Analyses and Design”, Working Paper No. W98-27. Prinsen, G. (2007) “The parents, the patients and the privileged. Accountability and elite capture in schools and clinics in Uganda and Tanzania”. SNV Tanzania. Pritchett L., Woolcock, M. and Andrews, M. (2010) “Capability traps? The mechanisms of persistent implementation failure”, Working paper 234. Washington, D.C.: Center for Global Development. Quinn, A. with Tilley, H. (2013) ”Rapid Budget Analysis of the Water Sector in Tanzania”. London: Overseas Development Institute. Repoa (2006) “Combating corruption in Tanzania: Perception and Experience”, Afrobarometer Briefing Paper 33. Dar es Salaam: Repoa.
Repoa (2008) “The oversight processes of local councils in Tanzania. Final Report”. Dar es Salaam: Repoa. Repoa and Michigan State University (2012) “Summary of results Round 5 Afrobarometer Tanzania”. Repoa and Michigan State University. Santiso, C. (2008) ‘Eyes Wide Shut? Reforming and Defusing Checks and Balances in Argentina’, Public Administration and Development 28: 67-84. Sasaoka en Laumonier (2012) “Suitability of Local Resource Management Practices Based on Supernatural Enforcement Mechanisms in the Local Social-cultural Context”, Ecology and Society 17 (4) Skelcher, C. (1993) “Involvement and empowerment in local public services”, Public Money and Management 13 (3): 13-20. SNV (2010) “Water Point Mapping. The Experience of SNV Tanzania”. Dar es Salaam: SNV Tanzania. SNV (2011) ”Supporting Domestic Accountability”, East and Southern Africa Policy Brief 1, November 2011. Stein, C., Ernstson, H. and Barron, J. (2011 ) ”A social network approach to analyzing water governance: the case of the Mkindo catchment, Tanzania”, Physics and Chemistry of the Earth (36): 1085-1092. Tanzania Education Network (2002) School Committee Capacity Development: Lessons from Civil Society Organisations. Dar Es Salaam: TEN/Oxfam Ireland Tanzania National Bureau of Statistics (2012) Population and Age Statistics (district level). Dar es Salaam: Tanzania National Bureau of Statistics Taylor, B. (2008) “More for some or some for more?”. Dar es Salaam: WaterAid Tanzania. Taylor, B. (2009a) “Comprehensive Review of Sector Performance Monitoring Framework and Systems”. Dar es Salaam: WaterAid Tanzania Taylor, B. (2009b) ”Addressing the sustainability crisis. Lessons from research on managing rural water projects”. Dar es Salaam: WaterAid Tanzania. Tepani, N. (2013) “Independent Reporting Mechanism Tanzania: Progress Report 2011-13”. Therkildsen, O. (2000) “Public sector reform in a poor, aid-dependent country”, Public Administration
and Development 20: 61-71.
Tilley, H. (2013) “Rural water in Tanzania”, Unblocking Results Case Study. London: Overseas Development Institute (ODI), Centre for Aid and Public Expenditure. Tawasanet (2009) Out of sight and out of mind? Are marginalised communities being overlooked in decision-making? Tanzania: Tanzania Water and Sanitation Network (TAWASANET). Twaweza (2014) “Money flows, water trickles. Challenges of access to clean water in Tanzania”. Sauti za Wananchi brief no 10. Dar es Salaam: Twaweza.
70
United Nations Development Programme (UNDP)(2013) User’s Guide on Assessing Water Governance. New York: UNDP. United Nations Development Programme (UNDP)(2014) Human Development Report 2014. New York: UNDP. United Republic of Tanzania (2006) “National Water Sector Development Strategy 2006 to 2015”. Dar es Salaam: United Republic of Tanzania, Ministry of Water. United Republic of Tanzania (2014) “Water Sector Development Programme. Phase II (2014/2015-2018/2019)”. Dar es Salaam: United Republic of Tanzania, Ministry of Water. United Republic of Tanzania (2012) “Tanzania Open Government Partnership (OGP) Action Plan 2012-2013)”. Dar es Salaam: The United Republic of Tanzania.
United Republic of Tanzania (2014) “Government budget for financial year 2014/15 citizens´ budget edition”. Dar es Salaam: United Republic of Tanzania, Ministry of Finance. Uwazi (2010) “Capitation grant for education: When will it make a difference?”, Policy Brief TZ.08/2010E. Dar es Salaam: Uwazi, Twaweza. Uwazi (2011a) “If findings are ignored, why audit? Lessons from five years of local government audits”, Policy Brief TZ.03/2011E”. Dar es Salaam: Uwazi, Twaweza. Uwazi (nd) “Key Institutions in RURAL local government”. Dar es Salaam: Uwazi, Twaweza. http://uwazi.org/uploads/files/Key%20institutions%20in%20RURAL%20local%20government%20PPT.pdf. Van De Walle, N (2003) “Presidentialism and clientelism in Africa’s emerging party systems”, The Journal of Modern African Studies 41 (2): 297-321. Van den Berg, C., Burke, E., Chacha, L., Kessy, F. (2009) “Public Expenditure Review Water Sector Tanzania”. Washington, D.C.: World Bank. WaterAid Tanzania (n.d.) “National Water Sector Assessment, Tanzania”. London: WaterAid. Wateraid Tanzania (2009) “Management for Sustainability. Practical lessons from three studies on the management of rural water supplies”. Dar es Salaam: Wateraid Tanzania. Weiss, C.H., Murphy-Graham, E. and Birkeland, S. (2005) “An alternative route to policy influence: how evaluations affect D.A.R.E.”, American Journal of Evaluation 26 (1): 12-30. World Bank (nd) “World Wide Governance Indicators. Country Data Report for Tanzania, 1996-2013”. Washington DC: World Bank. World Bank (2014) World Development Report 2014. Washington, D.C.: World Bank.