45
Market outlook: From red to amber January 2016 www.ashmoregroup.com

Market outlook: From red to amber
January 2016
www.ashmoregroup.com

R: 0
G: 41
B: 91
R: 0
G: 174
B: 226
R: 152
G: 152
B: 156
R: 93
G: 92
B: 97
R: 225
G: 160
B: 15
R: 48
G: 144
B: 197
R: 160
G: 1
B: 46
R: 92
G: 146
B: 51
R: 176
G: 194
B: 6
R: 96
G: 187
B: 163
R: 200
G: 98
B: 27
R: 0
G: 127
B: 114
This confidential document is issued by Ashmore. The term “Ashmore” used in this document refers to Ashmore Group plc and its subsidiaries and associated entities, including Ashmore Investment Management Limited, which is authorised and
regulated by the Financial Conduct Authority and Ashmore Investment Advisors Limited, which is also authorised and regulated by the Financial Conduct Authority. Any information on or reference to “Unregulated Collective Investment Schemes”
in this document are only suitable for use with Eligible Counterparties, Professional Clients or investors meeting the FCA’s COBS 4.12 categories as the promotion of these Schemes either within the UK or from the UK is severely restricted by
statute. Shares in any Unregulated Collective Investment Scheme are not available for sale in any jurisdiction in which such a sale would be prohibited and may only be purchased by persons with professional experience of participating in
unregulated schemes, and who understand the high degree and variety of risk involved in Emerging Market investment. The information and any opinions contained in this document have been compiled in good faith, but no representation or
warranty, express or implied, is made as to their accuracy, completeness or correctness. Except where otherwise indicated, the information in this document is based on matters as they are believed to exist as of the date this document was
prepared and not as of any future date, and will not be updated or otherwise revised to reflect information that subsequently becomes available or changes occurring after such date. Save to the extent (if any) that exclusion of liability is prohibited
by any applicable law or regulation, Ashmore, its officers, employees, representatives and agents expressly advise that they shall not be liable in any respect whatsoever for any loss or damage, whether direct, indirect, consequential or otherwise
however arising (whether in negligence or otherwise) out of or in connection with the contents of or any omissions from this document. This document does not constitute an offer to sell, purchase, subscribe for or otherwise invest in units or shares
of any Fund referred to in this document. The value of any investment in any such Fund may fall as well as rise and investors may not get back the amount originally invested. Past performance is not a reliable indicator of future results. All
prospective investors must obtain a copy of the final Scheme Particulars or (if applicable) other offering document relating to the relevant Fund prior to making any decision to invest in any such Fund. This document does not constitute and may
not be relied upon as constituting any form of investment advice and prospective investors are advised to ensure that they obtain appropriate independent professional advice before making any investment in any such Fund. The distribution of this
document in certain jurisdictions is likely to be restricted by law, and persons into whose possession this document comes should inform themselves about, and observe, any such restrictions.
Ashmore offices
2
Ashmore Head Office
61 Aldwych London WC2B 4AE U.K.
T: (44) 20 3077 6000
Ashmore China
Room 3401, Tower 1, China World Trade Centre Office
No.1 Jian Wai Da Jie, Chaoyang District, Beijing, China
T: +86 10 5764 2601
Ashmore-CCSC
Unit 1708, Level 17, Citigroup Tower, No. 33
Huayuanshiqiao Road, Pudong New District, Shanghai,
China, 200120
Ashmore Colombia
Calle 73 # 7 - 06 Piso 8
Bogotá, Colombia
T: +57 1 347 0649
Ashmore India
1103 One Indiabulls Centre, Tower 2A
Jupiter Mills Compound, S.B. Marg, Elphinstone Road
(W), 400 013, Mumbai, India
T: +91 22 6608 0000
Ashmore Indonesia
18 Parc SCBD, Tower E, 8th Floor,
Jl.Jenderal Sudirman Kav. 52-53, Jakarta, Indonesia
12190
T: + 62 21 2953 9000
Ashmore Japan
11F Shin-Marunouchi Building
1-5-1 Marunouchi, Chiyoda-ku, Tokyo, Japan 100-6511
T: +81 0 3 6860 3777
Ashmore Investment Saudi Arabia
3rd Floor, Tower B, Olaya Towers,
Olaya Main Street, Riyadh, Kingdom of Saudi Arabia
T: + 966 11 483 9100
Ashmore Singapore
1 George Street #15-04
Singapore 049145
T: +65 6580 8288
Ashmore Turkey
Comert Sk. Yapı Kredi Plaza C Blok Kat:11
Levent, 34330 Istanbul
T: +90 212 349 40 01
Ashmore USA
Ashmore USA New York
122 East 42nd Street, 50th Floor
New York, NY 10168, USA
T: +1 212 661 0061
Ashmore USA Washington D.C.
1001 19th Street North, 15th Floor
Arlington, VA 22209 USA
T: +1 (703) 243-8800
www.ashmoregroup.com

EM Outlook: From red to amber
R: 0
G: 41
B: 91
R: 0
G: 174
B: 226
R: 152
G: 152
B: 156
R: 93
G: 92
B: 97
R: 225
G: 160
B: 15
R: 48
G: 144
B: 197
R: 160
G: 1
B: 46
R: 92
G: 146
B: 51
R: 176
G: 194
B: 6
R: 96
G: 187
B: 163
R: 200
G: 98
B: 27
R: 0
G: 127
B: 114
• The Bid for Developed Markets is losing steam – easy money will continue, but the strong USD is
beginning to hurt the US economy and bond yields are getting too low in Europe
• More Balanced Outlook – after a protracted period of underperformance the outlook for Emerging
Market (EM) assets is now more balanced versus developed markets
• Fed hikes are a positive for EM – resumption of normal monetary policy reduces uncertainty and
hikes are priced into EM asset prices
• Better Value – EM assets offer good value, backed by strong technicals and no bubble risks,
especially compared to QE markets in developed countries
• EM credits stay healthy – cautious market sentiment has forced EM policy makers to respond to
stresses and external balances are now improving
• Domestic factors matter more – quality of policy matters more than external shocks for most EM
countries, so focus on credit differentiation
• Normalisation via inflation and currency debasement - normalisation of global monetary policy is
likely to involve inflation and currency realignment sooner than meaningfully higher real interest rates
• The return of inflation is key – inflation has been missing in the ‘QE economies’, but preparing for its
return is prudent
• China emerges – the reform drive is ambitious and other larger EM countries will eventually emulate
China’s effort to open its markets and seek global reserve currency status
• Rising geopolitical tensions – policy is becoming increasingly populist in developed economies as
short-term stimulus becomes less effective – watch out for policies punishing foreigners and future
generations
Source: Ashmore
EM Outlook: From red to amber
4

R: 0
G: 41
B: 91
R: 0
G: 174
B: 226
R: 152
G: 152
B: 156
R: 93
G: 92
B: 97
R: 225
G: 160
B: 15
R: 48
G: 144
B: 197
R: 160
G: 1
B: 46
R: 92
G: 146
B: 51
R: 176
G: 194
B: 6
R: 96
G: 187
B: 163
R: 200
G: 98
B: 27
R: 0
G: 127
B: 114
Source: Ashmore. JP Morgan, BAML
EM twelve months ahead
5
EM Bull Market Normal Markets UST Shock
Description of scenario Spread compression, 5% EM FX rally
and local bond yields fall to 5.5%
Zero spread compression, FX flat and
no change in yields
100bps USD shocks, spread
widening, -5% EM FX and local bond
yields go to 7%
Sovereign External Debt 10.9% 4.8% -7.6%
Investment Grade 8.8% 3.6% -4.9%
Corporate External Debt 10.5% 6.1% -4.5%
High Yield 16.0% 7.7% -9.8%
High Grade 6.7% 3.1% -4.3%
Local Currency
Government Debt 17.0% 6.3% 2.6%
Local Currency Corporate
Debt 19.9% 8.1% -2.6%
FX forwards 9.2% 4.6% 0.1%
Market scenarios

R: 0
G: 41
B: 91
R: 0
G: 174
B: 226
R: 152
G: 152
B: 156
R: 93
G: 92
B: 97
R: 225
G: 160
B: 15
R: 48
G: 144
B: 197
R: 160
G: 1
B: 46
R: 92
G: 146
B: 51
R: 176
G: 194
B: 6
R: 96
G: 187
B: 163
R: 200
G: 98
B: 27
R: 0
G: 127
B: 114
Source: Ashmore
Assumptions for twelve months ahead scenarios
6
EM Bull Market Normal Markets UST Shock
Sovereign
External Debt
UST go to forwards;
50% UST pass-through;
100bps spread compression;
IG 75bps spread compression
UST go to forwards;
50% UST pass-through;
zero spread compression
UST go to forwards +100 bps;
50% UST pass-through;
150bps spread widening;
IG 75bps spread widening
Corporate
External Debt
UST go to forwards;
Broad: 45% of UST move pass-through,
100bps spread compression;
HY: 20% UST pass-through, 200bps spread
compression;
HG: 56% UST pass-through, 75bps spread
compression
UST go to forwards;
Broad: 45% UST pass-through;
HY: 20% UST pass-through, zero
spread compression;
HG: 56% UST pass-through, zero
spread compression
UST go to forwards;
Broad: 45% UST pass-through,
200bps spread widening;
HY: 20% UST pass-through, 400bps
spread widening;
HG: 56% UST pass-through, 100bps
spread widening
Local Currency
UST go to forwards;
30% UST pass-through;
100bps LC corporate spread narrowing;
Government yield to 5.5%;
FX rallies 5%;
FX implied yield to 3.5%
UST go to forwards;
30% UST pass-through;
LC corporate spread unchanged;
Government yield unchanged;
FX flat;
FX implied yield unchanged
UST go to forwards;
30% UST pass-through;
+200bps LC corporate spread;
Government yield goes to 7%;
FX down 5%;
FX implied yield to 6%
Market scenarios

R: 0
G: 41
B: 91
R: 0
G: 174
B: 226
R: 152
G: 152
B: 156
R: 93
G: 92
B: 97
R: 225
G: 160
B: 15
R: 48
G: 144
B: 197
R: 160
G: 1
B: 46
R: 92
G: 146
B: 51
R: 176
G: 194
B: 6
R: 96
G: 187
B: 163
R: 200
G: 98
B: 27
R: 0
G: 127
B: 114
Source: Ashmore.
The Kilimanjaro trades
7
EM FX under QE policies in developed economies

R: 0
G: 41
B: 91
R: 0
G: 174
B: 226
R: 152
G: 152
B: 156
R: 93
G: 92
B: 97
R: 225
G: 160
B: 15
R: 48
G: 144
B: 197
R: 160
G: 1
B: 46
R: 92
G: 146
B: 51
R: 176
G: 194
B: 6
R: 96
G: 187
B: 163
R: 200
G: 98
B: 27
R: 0
G: 127
B: 114
China Roadmap
8
Vision: Transition from export-led to
consumption-led growth
Build political support
Encourage consumption
Adjust growth model to
deleveraging and QE in
developed economies
and diminishing labour
supply in China
Persuade domestic vested
interest groups to change
Facilitate
transmission
of monetary
policy
Consumption has major upside potential due to
49% savings rate; social safety nets, better
savings options
‘Biggest
bang’ in
history to
finance
Reduce turbulence
through foreign central
bank and institutional
participation
To facilitate
greater domestic
demand without
inflation
Supply-side
reforms to
improve
competitiveness
Liberate capital
account
Internationalise
RMB and
expand RQFII
Medium term RMB
appreciation and global
infrastructure investment
Raise
productivity
Reform markets,
SOEs, the
judiciary &
innovate
Slower growth in short term,
sustained long term growth
potential
Liberate interest
rates & develop
yield curves
Reform pensions,
mutual funds and
banks
Supportive for
government bonds,
‘price discovery’ for
muni/corporate bonds
Develop domestic
institutional
investor base

R: 0
G: 41
B: 91
R: 0
G: 174
B: 226
R: 152
G: 152
B: 156
R: 93
G: 92
B: 97
R: 225
G: 160
B: 15
R: 48
G: 144
B: 197
R: 160
G: 1
B: 46
R: 92
G: 146
B: 51
R: 176
G: 194
B: 6
R: 96
G: 187
B: 163
R: 200
G: 98
B: 27
R: 0
G: 127
B: 114
Yields: Various EM Fixed Income markets and US Treasuries
9
EM under QE: Benign neglect
Source: Ashmore, JP Morgan, Bloomberg. Data as at 17-Nov-15.
0
1
2
3
4
5
6
7
8
9
Lo
ca
lbo
nds
Exte
rnal
de
bt (I
G)
Exte
rnal
de
bt (H
Y)
Co
rpora
tede
bt (I
G)
Co
rpora
tede
bt (H
Y)
10
year
US
T
5 y
ear
US
T
%
Yield today (%)
Yield end-2006 (%)

R: 0
G: 41
B: 91
R: 0
G: 174
B: 226
R: 152
G: 152
B: 156
R: 93
G: 92
B: 97
R: 225
G: 160
B: 15
R: 48
G: 144
B: 197
R: 160
G: 1
B: 46
R: 92
G: 146
B: 51
R: 176
G: 194
B: 6
R: 96
G: 187
B: 163
R: 200
G: 98
B: 27
R: 0
G: 127
B: 114
• The vast majority of EM countries are well managed, stable, growing and largely self-funded in
local markets
• About 5-10% of EM countries get into trouble every year – most recover by reforming and
adjusting
• Domestic issues – especially quality of governance - matter more than external shocks
Stylised facts (there are always exceptions though!)
• Riskier EM credits
• Low quality governance
• Single commodity countries
• Cold War casualties
• Internally divided countries
• Countries with weak domestic investor base
• Less risky EM credits
• High quality governance
• Diverse, flexible economies
• Countries that can reform and invest in infrastructure
• Countries that have open markets and local savings institutions
Source: Ashmore
Domestic factors matter more than external factors
10
R: 0
G: 41
B: 91
R: 0
G: 174
B: 226
R: 152
G: 152
B: 156
R: 93
G: 92
B: 97
R: 225
G: 160
B: 15
R: 48
G: 144
B: 197
R: 160
G: 1
B: 46
R: 92
G: 146
B: 51
R: 176
G: 194
B: 6
R: 96
G: 187
B: 163
R: 200
G: 98
B: 27
R: 0
G: 127
B: 114
Source: BAML, Ashmore. Data as at 30-Jun-15
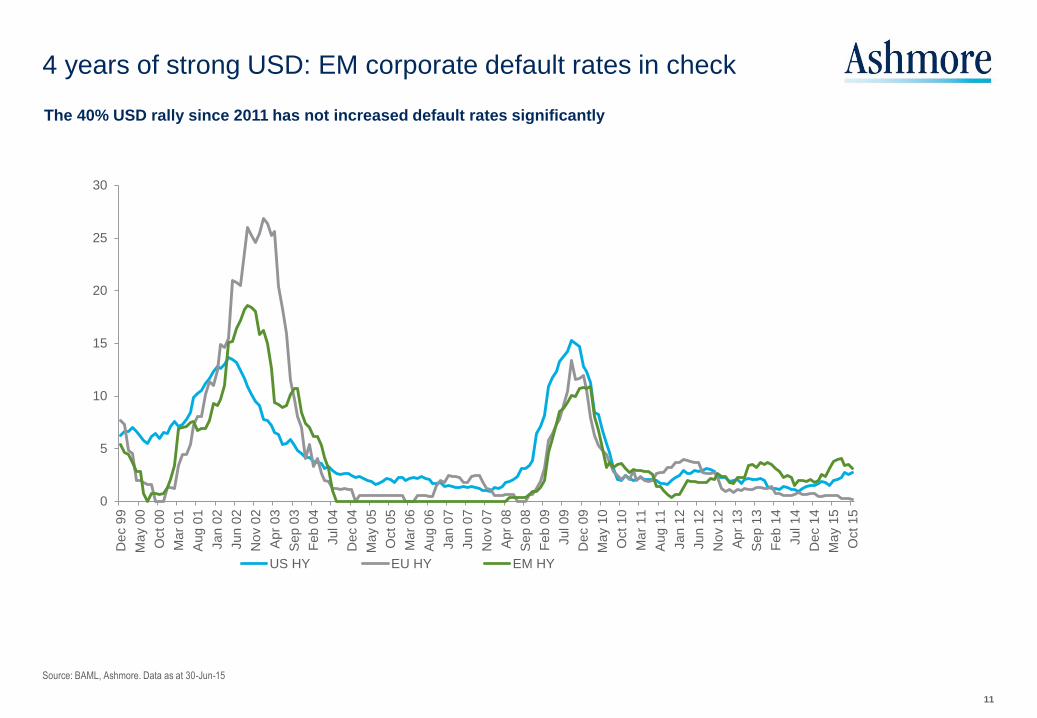
The 40% USD rally since 2011 has not increased default rates significantly
4 years of strong USD: EM corporate default rates in check
11
0
5
10
15
20
25
30
De
c 9
9
Ma
y 0
0
Oct 00
Ma
r 01
Aug 0
1
Jan 0
2
Jun 0
2
No
v 0
2
Apr
03
Sep 0
3
Feb
04
Jul 04
De
c 0
4
Ma
y 0
5
Oct 05
Ma
r 06
Aug 0
6
Jan 0
7
Jun 0
7
No
v 0
7
Apr
08
Sep 0
8
Feb
09
Jul 09
De
c 0
9
Ma
y 1
0
Oct 10
Ma
r 11
Aug 1
1
Jan 1
2
Jun 1
2
No
v 1
2
Apr
13
Sep 1
3
Feb
14
Jul 14
De
c 1
4
Ma
y 1
5
Oct 15
US HY EU HY EM HY

R: 0
G: 41
B: 91
R: 0
G: 174
B: 226
R: 152
G: 152
B: 156
R: 93
G: 92
B: 97
R: 225
G: 160
B: 15
R: 48
G: 144
B: 197
R: 160
G: 1
B: 46
R: 92
G: 146
B: 51
R: 176
G: 194
B: 6
R: 96
G: 187
B: 163
R: 200
G: 98
B: 27
R: 0
G: 127
B: 114
Source: Ashmore. Bloomberg, Data as at June 2015
4 years of a strong USD: No signs of inflation pass-through
12
Negative readings means inflation has been lower than expected
-30
-25
-20
-15
-10
-5
0
5
10
Jan 1
0
Ma
r 10
Ma
y 1
0
Jul 10
Sep 1
0
No
v 1
0
Jan 1
1
Ma
r 11
Ma
y 1
1
Jul 11
Sep 1
1
No
v 1
1
Jan 1
2
Ma
r 12
Ma
y 1
2
Jul 12
Sep 1
2
No
v 1
2
Jan 1
3
Ma
r 13
Ma
y 1
3
Jul 13
Sep 1
3
No
v 1
3
Jan 1
4
Ma
r 14
Ma
y 1
4
Jul 14
Sep 1
4
No
v 1
4
Jan 1
5
Ma
r 15
Ma
y 1
5
R: 0
G: 41
B: 91
R: 0
G: 174
B: 226
R: 152
G: 152
B: 156
R: 93
G: 92
B: 97
R: 225
G: 160
B: 15
R: 48
G: 144
B: 197
R: 160
G: 1
B: 46
R: 92
G: 146
B: 51
R: 176
G: 194
B: 6
R: 96
G: 187
B: 163
R: 200
G: 98
B: 27
R: 0
G: 127
B: 114
Source: Ashmore, Bloomberg, Citibank. Data as at 21 October 2015
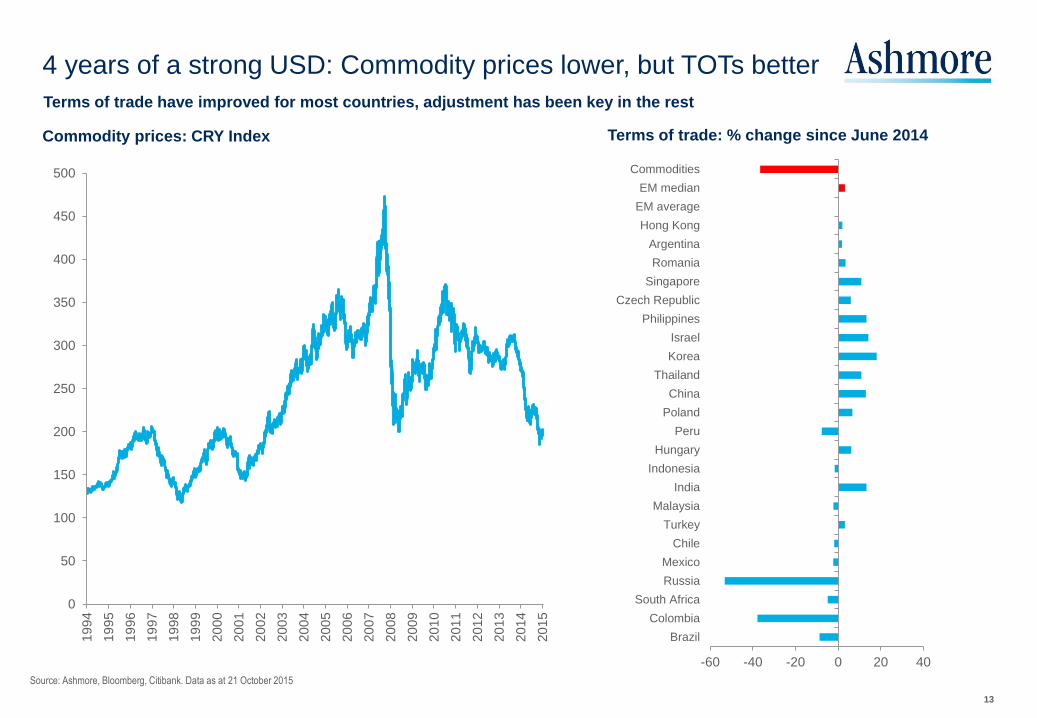
Commodity prices: CRY Index
4 years of a strong USD: Commodity prices lower, but TOTs better
13
Terms of trade: % change since June 2014
Terms of trade have improved for most countries, adjustment has been key in the rest
0
50
100
150
200
250
300
350
400
450
500
19
94
19
95
19
96
19
97
19
98
19
99
20
00
20
01
20
02
20
03
20
04
20
05
20
06
20
07
20
08
20
09
20
10
20
11
20
12
20
13
20
14
20
15
-60 -40 -20 0 20 40
Brazil
Colombia
South Africa
Russia
Mexico
Chile
Turkey
Malaysia
India
Indonesia
Hungary
Peru
Poland
China
Thailand
Korea
Israel
Philippines
Czech Republic
Singapore
Romania
Argentina
Hong Kong
EM average
EM median
Commodities

R: 0
G: 41
B: 91
R: 0
G: 174
B: 226
R: 152
G: 152
B: 156
R: 93
G: 92
B: 97
R: 225
G: 160
B: 15
R: 48
G: 144
B: 197
R: 160
G: 1
B: 46
R: 92
G: 146
B: 51
R: 176
G: 194
B: 6
R: 96
G: 187
B: 163
R: 200
G: 98
B: 27
R: 0
G: 127
B: 114
Source:: Ashmore, Bloomberg
14
4 years of a strong USD: EM capital flows manageable
Changes in FX reserves for 54 EM countries 2001-March 2015
Current account changes and FX valuation effects dominate capital outflows
-20%
-10%
0%
10%
20%
30%
40%
2001 2002 2003 2004 2005 2006 2007 2008 2009 2010 2011 2012 2013 2014 2015 toMarch
FX valuation changes
Current account
Capital Flow
R: 0
G: 41
B: 91
R: 0
G: 174
B: 226
R: 152
G: 152
B: 156
R: 93
G: 92
B: 97
R: 225
G: 160
B: 15
R: 48
G: 144
B: 197
R: 160
G: 1
B: 46
R: 92
G: 146
B: 51
R: 176
G: 194
B: 6
R: 96
G: 187
B: 163
R: 200
G: 98
B: 27
R: 0
G: 127
B: 114
Source: Standard Chartered Bank. Data up to September 2015. Full 2015 forecast by Ashmore
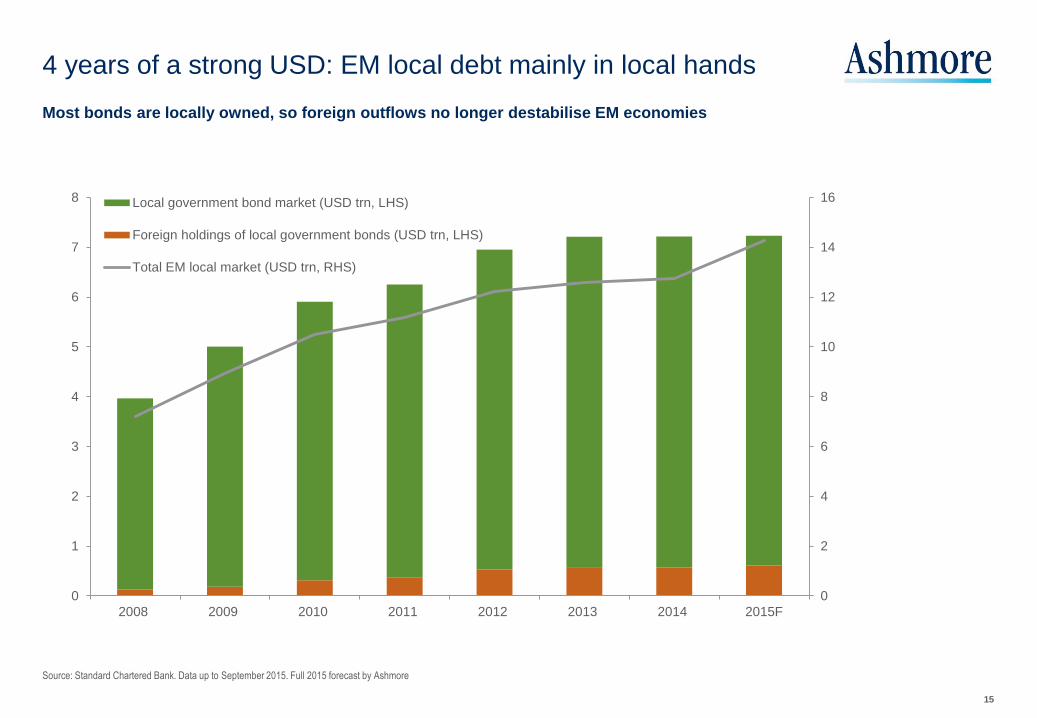
Most bonds are locally owned, so foreign outflows no longer destabilise EM economies
4 years of a strong USD: EM local debt mainly in local hands
15
0
2
4
6
8
10
12
14
16
0
1
2
3
4
5
6
7
8
2008 2009 2010 2011 2012 2013 2014 2015F
Local government bond market (USD trn, LHS)
Foreign holdings of local government bonds (USD trn, LHS)
Total EM local market (USD trn, RHS)
R: 0
G: 41
B: 91
R: 0
G: 174
B: 226
R: 152
G: 152
B: 156
R: 93
G: 92
B: 97
R: 225
G: 160
B: 15
R: 48
G: 144
B: 197
R: 160
G: 1
B: 46
R: 92
G: 146
B: 51
R: 176
G: 194
B: 6
R: 96
G: 187
B: 163
R: 200
G: 98
B: 27
R: 0
G: 127
B: 114
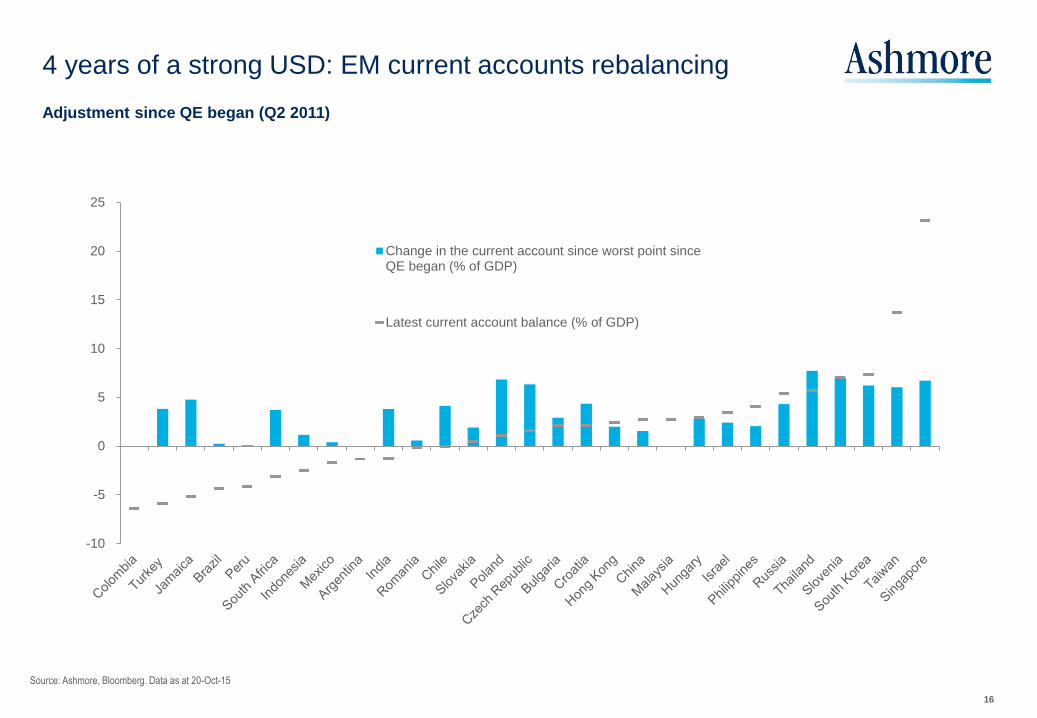
Source: Ashmore, Bloomberg. Data as at 20-Oct-15
4 years of a strong USD: EM current accounts rebalancing
16
Adjustment since QE began (Q2 2011)
-10
-5
0
5
10
15
20
25
Change in the current account since worst point sinceQE began (% of GDP)
Latest current account balance (% of GDP)

R: 0
G: 41
B: 91
R: 0
G: 174
B: 226
R: 152
G: 152
B: 156
R: 93
G: 92
B: 97
R: 225
G: 160
B: 15
R: 48
G: 144
B: 197
R: 160
G: 1
B: 46
R: 92
G: 146
B: 51
R: 176
G: 194
B: 6
R: 96
G: 187
B: 163
R: 200
G: 98
B: 27
R: 0
G: 127
B: 114
Source: Ashmore, BIS, Bloomberg. Data as at 22 October 2015
4 years of a strong USD: REERs restoring competitiveness
17
Real Effective Exchange Rates in EM and DM since QE began
-50
-40
-30
-20
-10
0
10
20
30
40
Bra
zil
Co
lom
bia
South
Afr
ica
Ru
ssia
Hu
nga
ry
Czech R
epu
blic
Me
xic
o
India
Ch
ile
Indon
esia
Pola
nd
Ro
man
ia
Arg
entina
Bulg
aria
Cro
atia
Ma
laysia
Turk
ey
Slo
ven
ia
Lithu
ania
Slo
vakia
La
tvia
Esto
nia
Isra
el
Alg
eria
Taiw
an
Tha
iland
Peru
Sin
gapo
re
Kore
a
Phili
ppin
es
Un
ite
d A
rab E
mira
tes
Saud
i A
rabia
Ho
ng K
on
g
Ch
ina
Japa
n
Austr
alia
Ca
nad
a
Euro
are
a
Fra
nce
Germ
any
Ita
ly
Un
ite
d K
ing
dom
Un
ite
d S
tate
s

R: 0
G: 41
B: 91
R: 0
G: 174
B: 226
R: 152
G: 152
B: 156
R: 93
G: 92
B: 97
R: 225
G: 160
B: 15
R: 48
G: 144
B: 197
R: 160
G: 1
B: 46
R: 92
G: 146
B: 51
R: 176
G: 194
B: 6
R: 96
G: 187
B: 163
R: 200
G: 98
B: 27
R: 0
G: 127
B: 114
Fed hikes (1): A positive for EM
18
Source: Ashmore, Bloomberg, Data 22-July-15
%
bps
0
200
400
600
800
1,000
1,200
1,400
1,600
0.00
1.00
2.00
3.00
4.00
5.00
6.00
7.00
8.00
1997 1998 1999 2000 2001 2002 2003 2004 2005 2006 2007 2008 2009 2010 2011 2012 2013 2014
EMBI GD Spread vs. 2yr UST
Fed Fund hiking
2yr UST
EMBI GD Spread
Start of hikes reduce spreads as uncertainty falls and confidence in growth increases

R: 0
G: 41
B: 91
R: 0
G: 174
B: 226
R: 152
G: 152
B: 156
R: 93
G: 92
B: 97
R: 225
G: 160
B: 15
R: 48
G: 144
B: 197
R: 160
G: 1
B: 46
R: 92
G: 146
B: 51
R: 176
G: 194
B: 6
R: 96
G: 187
B: 163
R: 200
G: 98
B: 27
R: 0
G: 127
B: 114
Fed hikes(2): Impact on various markets
19
2004 hiking cycle: impact on US Treasury curve EM vs DM: Cumulative returns since start of the
rate sell-off on April 1st 2004
0
1
2
3
4
5
6
7
05/2003 05/2004 05/2005 05/2006
Fed Funds UST 2YR UST 5YR UST 10YR UST 30YR
-10% 0% 10% 20%
DM government bonds
USD high grade
EUR corporate IG
USD corporate IG
US high yield
EM Corp high yield
EM GB hard currency
EM GB local currency
3 month return (before hike)
6 month return (3 months pre and 3 months post hike)
12 month return(3 months pre and 9 months post hike)Source: Ashmore, Bloomberg, May-15.

R: 0
G: 41
B: 91
R: 0
G: 174
B: 226
R: 152
G: 152
B: 156
R: 93
G: 92
B: 97
R: 225
G: 160
B: 15
R: 48
G: 144
B: 197
R: 160
G: 1
B: 46
R: 92
G: 146
B: 51
R: 176
G: 194
B: 6
R: 96
G: 187
B: 163
R: 200
G: 98
B: 27
R: 0
G: 127
B: 114
Source: IMF Data as at Oct. 2015
GDP per capita (Index rebased, 1980 = 100)
The Case for EM: Better growth
20
Adjustment
Convergence
0
100
200
300
400
500
600
700
800
900
1000
Developed countries
Emerging Market and developing economies
Cold War

R: 0
G: 41
B: 91
R: 0
G: 174
B: 226
R: 152
G: 152
B: 156
R: 93
G: 92
B: 97
R: 225
G: 160
B: 15
R: 48
G: 144
B: 197
R: 160
G: 1
B: 46
R: 92
G: 146
B: 51
R: 176
G: 194
B: 6
R: 96
G: 187
B: 163
R: 200
G: 98
B: 27
R: 0
G: 127
B: 114
Source: Ashmore, IMF WEO October 2015
Real GDP growth rates by epoch EM vs DM
The Case for EM: No middle income trap
21
0.0
0.5
1.0
1.5
2.0
2.5
3.0
3.5
4.0
4.5
5.0
EM * DM *
1980-1989 1990-1999 2000-2009 2010-2015 2016-2020 (IMF forecast) Average (1980-2019)

R: 0
G: 41
B: 91
R: 0
G: 174
B: 226
R: 152
G: 152
B: 156
R: 93
G: 92
B: 97
R: 225
G: 160
B: 15
R: 48
G: 144
B: 197
R: 160
G: 1
B: 46
R: 92
G: 146
B: 51
R: 176
G: 194
B: 6
R: 96
G: 187
B: 163
R: 200
G: 98
B: 27
R: 0
G: 127
B: 114
Source: Ashmore, IMF WEO October 2015 (2015 estimate, 2016 onwards forecasts)
% global GDP (based on purchasing power parity)
The Case for EM: 57% of Global GDP en route to 61%
22
% of Emerging Markets
(2015 based on purchasing power parity)
0
10
20
30
40
50
60
70
19
80
19
82
19
84
19
86
19
88
19
90
19
92
19
94
19
96
19
98
20
00
20
02
20
04
20
06
20
08
20
10
20
12
20
14
20
16
20
18
20
20
Advanced economies
Emerging market and developingeconomies
8%
54%
6%
14%
13%
5%
Commonwealth ofIndependent States
Emerging and developingAsia
Emerging and developingEurope
Latin America and theCaribbean
Middle East, North Africa,Afghanistan, and Pakistan
Sub-Saharan Africa

R: 0
G: 41
B: 91
R: 0
G: 174
B: 226
R: 152
G: 152
B: 156
R: 93
G: 92
B: 97
R: 225
G: 160
B: 15
R: 48
G: 144
B: 197
R: 160
G: 1
B: 46
R: 92
G: 146
B: 51
R: 176
G: 194
B: 6
R: 96
G: 187
B: 163
R: 200
G: 98
B: 27
R: 0
G: 127
B: 114
Source: Ashmore, BAML, IMF WEO October 2015 (2015 estimate, 2016 onwards forecasts)
EM has less debt and a bigger share of global GDP
The Case for EM: Domestic credit and tradable debt
23
0%
10%
20%
30%
40%
50%
60%
70%
80%
90%
100%
0
20
40
60
80
100
120
140
160
180
EM DM
US
D t
rn
Tradable bonds (Left axis) Domestic Credit (Left axis) Share of Global GDP (%, right axis)

R: 0
G: 41
B: 91
R: 0
G: 174
B: 226
R: 152
G: 152
B: 156
R: 93
G: 92
B: 97
R: 225
G: 160
B: 15
R: 48
G: 144
B: 197
R: 160
G: 1
B: 46
R: 92
G: 146
B: 51
R: 176
G: 194
B: 6
R: 96
G: 187
B: 163
R: 200
G: 98
B: 27
R: 0
G: 127
B: 114
Source: Ashmore, BAML, IMF
% of GDP in selected EM and DM countries
The Case for EM: Domestic credit and tradable debt
24
0%
100%
200%
300%
400%
500%
600%
700%
Nig
eri
a
Ecua
dor
Arg
en
tina
Eg
yp
t
Trin
idad
& T
ob
ago
Dom
inic
an R
ep
ub
lic
Sa
ud
i A
rab
ia
Ve
ne
zue
la
Uru
gua
y
Rom
an
ia
Indo
nesia
Sri
La
nka
Qa
tar
Ka
za
kh
sta
n
Pa
kis
tan
Pe
ru
Ku
wait
El S
alv
ad
or
Bu
lga
ria
Russia
Ph
ilipp
ines
Slo
va
kia
Tu
nis
ia
Colo
mbia
Unite
d A
rab
Em
ira
tes
Czech
Rep
ublic
India
Me
xic
o
Po
lan
d
Mo
rocco
Ukra
ine
Vie
tna
m
Tu
rke
y
Ba
hra
in
Cro
atia
Costa
Ric
a
Slo
ve
nia
So
uth
Afr
ica
Pa
na
ma
Hun
ga
ry
Lith
uan
ia
Bra
zil
Chile
Chin
a
Sin
ga
pore
Th
aila
nd
Ma
laysia
So
uth
Ko
rea
Leb
an
on
Cypru
s
Hon
g K
on
g
Jam
aic
a
Neth
erl
an
ds
Unite
d K
ing
do
m
Jap
an
US
Sp
ain
Po
rtug
al
Fra
nce
Italy
Ge
rma
ny
Local
External
Credit

Global Backdrop

R: 0
G: 41
B: 91
R: 0
G: 174
B: 226
R: 152
G: 152
B: 156
R: 93
G: 92
B: 97
R: 225
G: 160
B: 15
R: 48
G: 144
B: 197
R: 160
G: 1
B: 46
R: 92
G: 146
B: 51
R: 176
G: 194
B: 6
R: 96
G: 187
B: 163
R: 200
G: 98
B: 27
R: 0
G: 127
B: 114
QE led recoveries in developed markets: theory and practice
26
Source Ashmore
R: 0
G: 41
B: 91
R: 0
G: 174
B: 226
R: 152
G: 152
B: 156
R: 93
G: 92
B: 97
R: 225
G: 160
B: 15
R: 48
G: 144
B: 197
R: 160
G: 1
B: 46
R: 92
G: 146
B: 51
R: 176
G: 194
B: 6
R: 96
G: 187
B: 163
R: 200
G: 98
B: 27
R: 0
G: 127
B: 114
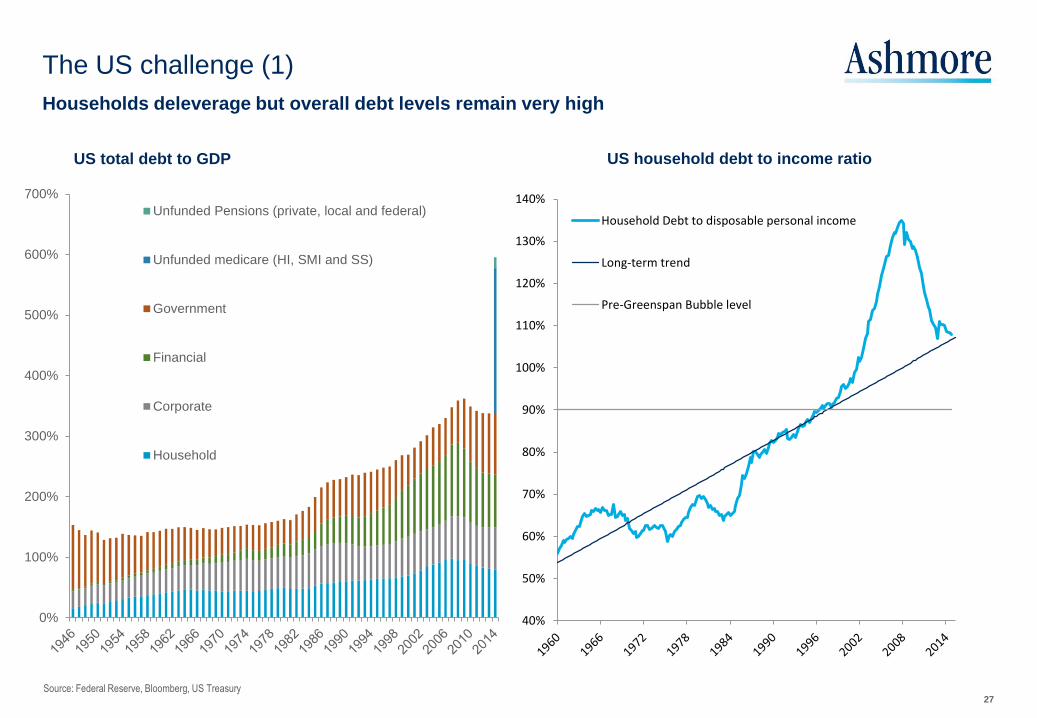
Source: Federal Reserve, Bloomberg, US Treasury
The US challenge (1)
27
Households deleverage but overall debt levels remain very high
40%
50%
60%
70%
80%
90%
100%
110%
120%
130%
140%
Household Debt to disposable personal income
Long-term trend
Pre-Greenspan Bubble level
US total debt to GDP US household debt to income ratio
0%
100%
200%
300%
400%
500%
600%
700%
Unfunded Pensions (private, local and federal)
Unfunded medicare (HI, SMI and SS)
Government
Financial
Corporate
Household

R: 0
G: 41
B: 91
R: 0
G: 174
B: 226
R: 152
G: 152
B: 156
R: 93
G: 92
B: 97
R: 225
G: 160
B: 15
R: 48
G: 144
B: 197
R: 160
G: 1
B: 46
R: 92
G: 146
B: 51
R: 176
G: 194
B: 6
R: 96
G: 187
B: 163
R: 200
G: 98
B: 27
R: 0
G: 127
B: 114
American-style ‘Dutch Disease’ points to less directional/more choppy outlook for USD
Source: Ashmore, Bloomberg.
The US challenge (2): Rising REERs and falling productivity
28
US Real Effective Exchange Rate US productivity (% yoy)
-2
-1
0
1
2
3
4
5
6
7
De
c 0
0
Aug 0
1
Apr
02
De
c 0
2
Aug 0
3
Apr
04
De
c 0
4
Aug 0
5
Apr
06
De
c 0
6
Aug 0
7
Apr
08
De
c 0
8
Aug 0
9
Apr
10
De
c 1
0
Aug 1
1
Apr
12
De
c 1
2
Aug 1
3
Apr
14
De
c 1
4
US nonfarm business sector output per person
Linear (US nonfarm business sector output perperson)
95
97
99
101
103
105
107
109
111
113
115
Jan 1
1
Apr
11
Jul 11
Oct 11
Jan 1
2
Apr
12
Jul 12
Oct 12
Jan 1
3
Apr
13
Jul 13
Oct 13
Jan 1
4
Apr
14
Jul 14
Oct 14
Jan 1
5
Apr
15
Jul 15

R: 0
G: 41
B: 91
R: 0
G: 174
B: 226
R: 152
G: 152
B: 156
R: 93
G: 92
B: 97
R: 225
G: 160
B: 15
R: 48
G: 144
B: 197
R: 160
G: 1
B: 46
R: 92
G: 146
B: 51
R: 176
G: 194
B: 6
R: 96
G: 187
B: 163
R: 200
G: 98
B: 27
R: 0
G: 127
B: 114
US inflation
29
Source Ashmore, Bloomberg
Power base effects push yoy inflation up sharply in 2016
(yoy projections based on 0.2% mom each month in 2016)
-0.5%
0.0%
0.5%
1.0%
1.5%
2.0%
2.5%
3.0%
3.5%
4.0%
4.5%
Jan 1
1
Mar 1
1
May 1
1
Jul 1
1
Sep 1
1
Nov 1
1
Jan 1
2
Mar 1
2
May 1
2
Jul 1
2
Sep 1
2
Nov 1
2
Jan 1
3
Mar 1
3
May 1
3
Jul 1
3
Sep 1
3
Nov 1
3
Jan 1
4
Mar 1
4
May 1
4
Jul 1
4
Sep 1
4
Nov 1
4
Jan 1
5
Mar 1
5
May 1
5
Jul 1
5
Sep 1
5
Nov 1
5
Jan 1
6
Mar 1
6
May 1
6
Jul 1
6
Sep 1
6
Nov 1
6

R: 0
G: 41
B: 91
R: 0
G: 174
B: 226
R: 152
G: 152
B: 156
R: 93
G: 92
B: 97
R: 225
G: 160
B: 15
R: 48
G: 144
B: 197
R: 160
G: 1
B: 46
R: 92
G: 146
B: 51
R: 176
G: 194
B: 6
R: 96
G: 187
B: 163
R: 200
G: 98
B: 27
R: 0
G: 127
B: 114
Does debt constrain
growth and rates?
Other structural
challenges to growth?
Can central
bank create inflation?
Is currency a major
reserve currency? Long-term outlook
US
Yes.
Overall debt too high,
but household debt
becoming less onerous
Yes and No.
Banks recapitalised, but
infrastructure and long-
term liabilities still a
problem
Yes.
Financial
intermediation works
and household credit
demand is improving
Yes.
The US can pass the
cost of debt reduction
onto foreigners
Grow, then inflate and devalue
amidst very gentle normalisation of
monetary policy
Europe
Yes.
Households debts and
government debts
excessive
Yes.
Banks and ABS markets
dysfunctional
No.
Financial transmission
mechanism is
dysfunctional
Yes.
But debt mainly held at
home, so ability to
deleverage via FX is
limited
Slow growth, deflation fears and
credit vulnerabilities
Japan Yes.
569% of GDP
Yes.
Demographics, fiscal
position and economic
flexibility
No.
‘Abenomics’ impact is
temporary
No.
Currency devaluation
does not reduce debt
Structural problems return after
short-term stimulus and risks of a
debt crisis re-emerge
EM
No.
Average public debt
about 1/3 of DMs.
Private debt highest in
richer EM countries
Mixed.
Infrastructure is a
general problem, but EM
countries generally
reform
Yes.
But political costs of
inflation tend to be
very high
No.
EM central banks have
almost zero exposure to
EM bonds
Long-term currency appreciation,
slower growth and challenges
transitioning from export-led to
domestic demand-led growth.
Greater credit differentiation
Source: Ashmore.
Global economy: The path back to long-term equilibrium
30

R: 0
G: 41
B: 91
R: 0
G: 174
B: 226
R: 152
G: 152
B: 156
R: 93
G: 92
B: 97
R: 225
G: 160
B: 15
R: 48
G: 144
B: 197
R: 160
G: 1
B: 46
R: 92
G: 146
B: 51
R: 176
G: 194
B: 6
R: 96
G: 187
B: 163
R: 200
G: 98
B: 27
R: 0
G: 127
B: 114
Source: Ashmore, October 2015.
The direction of US monetary policy
31
Key developments Approximate time
period
Deleveraging
Improving but sub-par growth and stable low inflation
Now until late-2016 Very gradual normalisation of monetary policy
Long end of yield curve well supported
Strong market bias towards long Dollar positions
Inflation
Inflation begins to emerge as the dominant macroeconomic problem
10 years starting in
late 2016
Debt overhangs, weak trend growth and past QE liquidity constrain Fed tightening
Nominal yields rise, but real yield stay low amidst rising inflation
Dollar commences decade long adjustment lower
Export competitiveness improves
Yield curve bear steepens
Real debt stock declines
‘Volcker II’
The flight against inflation assumes top priority
The period
thereafter
Real rates rise materially without destroying less indebted economy
Recession and rebound
Dollar rallies – still a global reserve currency but now alongside larger EM currencies
Next debt fuelled consumption boom begins
Financial de-regulation
Three phases of monetary policy normalisation

R: 0
G: 41
B: 91
R: 0
G: 174
B: 226
R: 152
G: 152
B: 156
R: 93
G: 92
B: 97
R: 225
G: 160
B: 15
R: 48
G: 144
B: 197
R: 160
G: 1
B: 46
R: 92
G: 146
B: 51
R: 176
G: 194
B: 6
R: 96
G: 187
B: 163
R: 200
G: 98
B: 27
R: 0
G: 127
B: 114
Source: Federal Reserve , BAML, Bloomberg.
Debt and reserves (USD trn)
Global Imbalances
32
1970’s : Inflation, real rates and the Dollar
70
75
80
85
90
95
100
105
-10
-5
0
5
10
15
20
1967 1969 1971 1972 1974 1976 1977 1979
CPI inflation (LHS, % yoy)
Real 5yr UST yields (LHS, %)
DXY (RHS, 1967 index =100)
0
2
4
6
8
10
12
14
16
18
20
0
2
4
6
8
10
12
2003 2005 2007 2009 2011 2013
Reserves in rest of EM (LHS)
Reserves in China (LHS)
Foreign Holdings of UST (LHS)
US total public debt (RHS)

EM Fixed Income: Characteristics

R: 0
G: 41
B: 91
R: 0
G: 174
B: 226
R: 152
G: 152
B: 156
R: 93
G: 92
B: 97
R: 225
G: 160
B: 15
R: 48
G: 144
B: 197
R: 160
G: 1
B: 46
R: 92
G: 146
B: 51
R: 176
G: 194
B: 6
R: 96
G: 187
B: 163
R: 200
G: 98
B: 27
R: 0
G: 127
B: 114
• Being an ‘Emerging Market’ says nothing per se about the quality of the investment
- Companies and countries can be managed badly or well regardless of whether they are Emerging Markets or not
• Emerging Markets is not a ‘derivative’ asset class
- Economic and financial performance in EM mainly hinges on domestic factors, not external ones
Emerging Markets are countries that are transcending the stages of economic and financial development that developed
economies have already gone through
Defining Emerging Markets
34
Market characteristics
Emerging Markets Developed Markets
Income per capita Low, growing rapidly High, stable or growing slowly
Capital markets Shallow, developing Sophisticated, mature
Structural change On-going, possibly substantial Minor

R: 0
G: 41
B: 91
R: 0
G: 174
B: 226
R: 152
G: 152
B: 156
R: 93
G: 92
B: 97
R: 225
G: 160
B: 15
R: 48
G: 144
B: 197
R: 160
G: 1
B: 46
R: 92
G: 146
B: 51
R: 176
G: 194
B: 6
R: 96
G: 187
B: 163
R: 200
G: 98
B: 27
R: 0
G: 127
B: 114
Source: Ashmore(forecasts beyond 2014), BAML
EM fixed income (USD trn)
Growing investment universe
35
0
5
10
15
20
25
30
35
2000 2001 2002 2003 2004 2005 2006 2007 2008 2009 2010 2011 2012 2013 2014 2015 2016 2017 2018 2019 2020
External sovereign
External corporate
Local sovereign
Local corporate

R: 0
G: 41
B: 91
R: 0
G: 174
B: 226
R: 152
G: 152
B: 156
R: 93
G: 92
B: 97
R: 225
G: 160
B: 15
R: 48
G: 144
B: 197
R: 160
G: 1
B: 46
R: 92
G: 146
B: 51
R: 176
G: 194
B: 6
R: 96
G: 187
B: 163
R: 200
G: 98
B: 27
R: 0
G: 127
B: 114
Source: Ashmore, JP Morgan , BAML
Risk aversion events are good buying opportunities
36
EMBI GD EMGI GD
IG
EMBI GD
HY CEMBI BD
CEMBI BD
HG
CEMBI BD
HY
GBI EM
GD ELMI+
% outperform
vs.passive 18% 31% 12% 28% 21% 55% 30% 50%
Absolute alpha vs.
passive 2% 2% 1% 2% 1% 5% 2% 3%
12m active return 11% 10% 12% 9% 8% 14% 9% 8%
12m passive return 9% 8% 11% 7% 7% 9% 7% 6%
Month Event Month Event
Apr-94 Fed hikes Aug-07 BNP Paribas gates funds over sub-
prime losses
Oct-97 Asian crisis Sep-08 Lehman
Aug-98 Russian crisis May-10 Greece I
Oct-00 Fear of slowing US economy Mar-11 Japan earthquake
Sep-01 9/11 Aug-11 US debt ceiling and Eurozone crisis
Jul-02 Fear of slowing US economy Oct-14 Rate hike fears
Jun-06 Hike triggers recession fears Aug-15 Fed hike fears
+10 pts VIX spikes – most country specific or developed market events
Passive versus active timing in response to +10 pts VIX spikes: Returns and alpha 1993 to September 2015

R: 0
G: 41
B: 91
R: 0
G: 174
B: 226
R: 152
G: 152
B: 156
R: 93
G: 92
B: 97
R: 225
G: 160
B: 15
R: 48
G: 144
B: 197
R: 160
G: 1
B: 46
R: 92
G: 146
B: 51
R: 176
G: 194
B: 6
R: 96
G: 187
B: 163
R: 200
G: 98
B: 27
R: 0
G: 127
B: 114
Source: Ashmore, JP Morgan , BAML.
EM: Poor index representation
37
Asset class Index
name
Index
acronym
Index
provider
No. of
countries
No. of
issuers
No. of
issues
Index market
cap
(USD bn)
Asset class
(USD bn)
Index as %
of asset
class
External
Sovereign Debt
EMBI Global
Diversified EMBI GD JP Morgan 62 125 459 362 793 46%
External
Corporate Debt
CEMBI Broad
Diversified CEMBI BD JP Morgan 49 552 1,166 291 1,284 23%
Local Currency
government Debt
GBI EM Global
Diversified GBI EM GD JP Morgan 16 16 195 941 6,651 14%
Local currency
Corporate Debt
Local EM non-
sovereign LOCL BAML 15 206 412 143 6,113 2%
All EM
Fixed Income 1,737 14,841 12%
As of end 2014
R: 0
G: 41
B: 91
R: 0
G: 174
B: 226
R: 152
G: 152
B: 156
R: 93
G: 92
B: 97
R: 225
G: 160
B: 15
R: 48
G: 144
B: 197
R: 160
G: 1
B: 46
R: 92
G: 146
B: 51
R: 176
G: 194
B: 6
R: 96
G: 187
B: 163
R: 200
G: 98
B: 27
R: 0
G: 127
B: 114
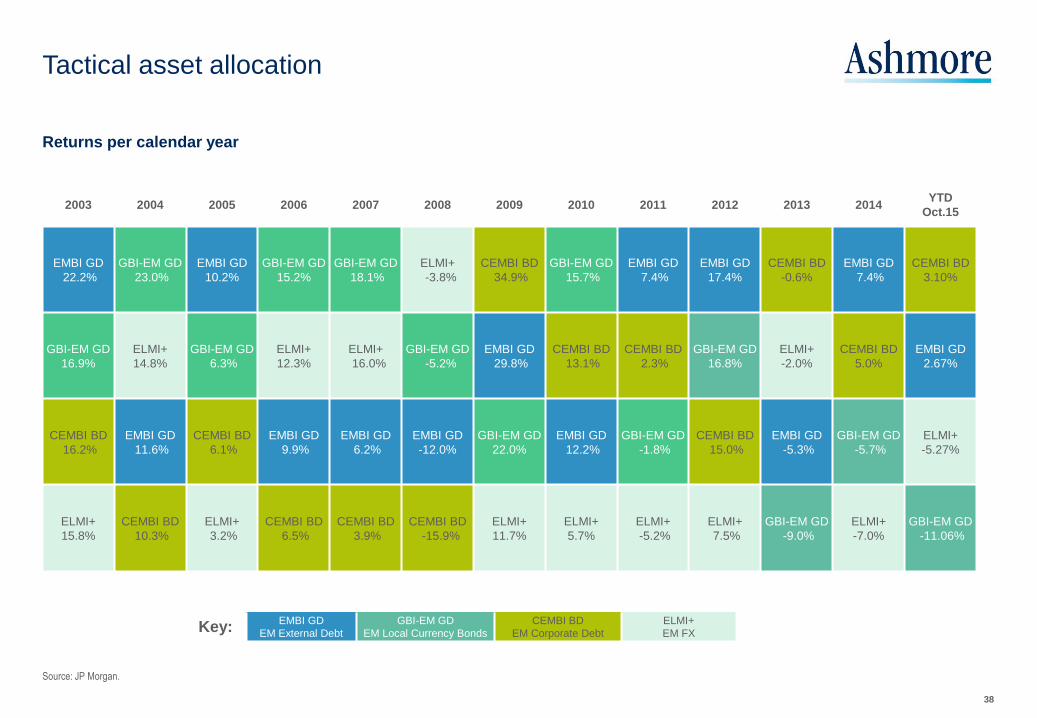
Source: JP Morgan.
Tactical asset allocation
38
EMBI GD
EM External Debt
GBI-EM GD
EM Local Currency Bonds
CEMBI BD
EM Corporate Debt
ELMI+
EM FX Key:
Returns per calendar year
2003 2004 2005 2006 2007 2008 2009 2010 2011 2012 2013 2014 YTD
Oct.15
EMBI GD
22.2%
GBI-EM GD
23.0%
EMBI GD
10.2%
GBI-EM GD
15.2%
GBI-EM GD
18.1%
ELMI+
-3.8%
CEMBI BD
34.9%
GBI-EM GD
15.7%
EMBI GD
7.4%
EMBI GD
17.4%
CEMBI BD
-0.6%
EMBI GD
7.4%
CEMBI BD
3.10%
GBI-EM GD
16.9%
ELMI+
14.8%
GBI-EM GD
6.3%
ELMI+
12.3%
ELMI+
16.0%
GBI-EM GD
-5.2%
EMBI GD
29.8%
CEMBI BD
13.1%
CEMBI BD
2.3%
GBI-EM GD
16.8%
ELMI+
-2.0%
CEMBI BD
5.0%
EMBI GD
2.67%
CEMBI BD
16.2%
EMBI GD
11.6%
CEMBI BD
6.1%
EMBI GD
9.9%
EMBI GD
6.2%
EMBI GD
-12.0%
GBI-EM GD
22.0%
EMBI GD
12.2%
GBI-EM GD
-1.8%
CEMBI BD
15.0%
EMBI GD
-5.3%
GBI-EM GD
-5.7%
ELMI+
-5.27%
ELMI+
15.8%
CEMBI BD
10.3%
ELMI+
3.2%
CEMBI BD
6.5%
CEMBI BD
3.9%
CEMBI BD
-15.9%
ELMI+
11.7%
ELMI+
5.7%
ELMI+
-5.2%
ELMI+
7.5%
GBI-EM GD
-9.0%
ELMI+
-7.0%
GBI-EM GD
-11.06%

Recent Market Developments
39

R: 0
G: 41
B: 91
R: 0
G: 174
B: 226
R: 152
G: 152
B: 156
R: 93
G: 92
B: 97
R: 225
G: 160
B: 15
R: 48
G: 144
B: 197
R: 160
G: 1
B: 46
R: 92
G: 146
B: 51
R: 176
G: 194
B: 6
R: 96
G: 187
B: 163
R: 200
G: 98
B: 27
R: 0
G: 127
B: 114
Source: JP Morgan, Ashmore. Data as at 9-Nov-15.
Mapping the EM Fixed Income investment themes
Recent price developments
40
Last 3y Hi 3y Low Last 3y Hi 3y Low
EMBI G.Div 6.6 375 428 237 11 6.12% 6.35% 4.33% 0.22%
IG 7.6 243 295 143 13 4.87% 5.33% 3.37% 0.25%
HY 5.4 596 717 390 -2 8.18% 9.13% 5.82% 0.09%
Cembi B.Div 4.8 383 447 274 25 6.00% 6.26% 4.43% 0.38%
IG 5.2 243 301 193 -2 4.60% 5.24% 3.72% 0.09%
HY 4.1 624 728 439 49 8.41% 9.06% 6.35% 0.64%
GBI EM GD 4.84 6.90% 7.27% 5.16% 0.08%
* Daily data.
** GDI EM GD spreads vs 5yr UST Yields
EM Fixed Income
BenchmarkDuration
Spreads Yields
3m Change 3m Change

R: 0
G: 41
B: 91
R: 0
G: 174
B: 226
R: 152
G: 152
B: 156
R: 93
G: 92
B: 97
R: 225
G: 160
B: 15
R: 48
G: 144
B: 197
R: 160
G: 1
B: 46
R: 92
G: 146
B: 51
R: 176
G: 194
B: 6
R: 96
G: 187
B: 163
R: 200
G: 98
B: 27
R: 0
G: 127
B: 114
Source: Ashmore, JP Morgan, Bloomberg. Data as at 28-Sep-15
External Debt Valuation: HY attractive, IG resilient
41
Sovereign spreads (bps over corresponding duration on US Treasury curve)
100
200
300
400
500
600
700
800
EMBI Global Diversified Spread
EMBI GD Spread EMBI GD IG EMBI GD HY

R: 0
G: 41
B: 91
R: 0
G: 174
B: 226
R: 152
G: 152
B: 156
R: 93
G: 92
B: 97
R: 225
G: 160
B: 15
R: 48
G: 144
B: 197
R: 160
G: 1
B: 46
R: 92
G: 146
B: 51
R: 176
G: 194
B: 6
R: 96
G: 187
B: 163
R: 200
G: 98
B: 27
R: 0
G: 127
B: 114
• Emerging Markets corporations have historically operated in a different environment, where leverage has been
a result of their operating and investment needs, not a result of LBOs and financial engineering
• Thus, historically their financial leverage (Total Debt/EBITDA) has been significantly lower
• After factoring their wider credit spread, investors can get nearly twice as much compensation per ‘turn of
leverage’ in Emerging Markets high yield debt then in US high yield debt
Source: BAML, as at 31-Dec-14.
Historically lower leverage than their developed markets’
counterparts
42
0
1
2
3
4
5
6
2007 2008 2009 2010 2011 2012 2013 2014
Global EM HY Leverage US HY Leverage
0 50 100 150 200
A
BBB
BB
B
Spread per turn of Leverage (bps/x)
US EM

R: 0
G: 41
B: 91
R: 0
G: 174
B: 226
R: 152
G: 152
B: 156
R: 93
G: 92
B: 97
R: 225
G: 160
B: 15
R: 48
G: 144
B: 197
R: 160
G: 1
B: 46
R: 92
G: 146
B: 51
R: 176
G: 194
B: 6
R: 96
G: 187
B: 163
R: 200
G: 98
B: 27
R: 0
G: 127
B: 114
Source: Bloomberg, Ashmore. Data as at Jun-15.
Local bonds: GBI-EM vs. 5yr UST: high returns + diversification
43
y = 0.2266x - 0.0022 R² = 0.0404
-0.60
-0.40
-0.20
0.00
0.20
0.40
0.60
-0.50 -0.30 -0.10 0.10 0.30 0.50
GBI EM DailyYield Change
5 Yr UST Yield vs GBI EM Yield (Jan/03 to Jun/15)
-0.8
-0.6
-0.4
-0.2
0
0.2
0.4
0.6
0.8
1
Jan
-03
Jul-0
3
Jan
-04
Jul-0
4
Jan
-05
Jul-0
5
Jan
-06
Jul-0
6
Jan
-07
Jul-0
7
Jan
-08
Jul-0
8
Jan
-09
Jul-0
9
Jan
-10
Jul-1
0
Jan
-11
Jul-1
1
Jan
-12
Jul-1
2
Jan
-13
Jul-1
3
Jan
-14
Jul-1
4
Jan
-15
GBI EM vs 5 Yr UST Yield Changes : 3M correlation
0.00
1.00
2.00
3.00
4.00
5.00
6.00
7.00
8.00
9.00
10.00
Jan
-03
Jul-0
3
Jan
-04
Jul-0
4
Jan
-05
Jul-0
5
Jan
-06
Jul-0
6
Jan
-07
Jul-0
7
Jan
-08
Jul-0
8
Jan
-09
Jul-0
9
Jan
-10
Jul-1
0
Jan
-11
Jul-1
1
Jan
-12
Jul-1
2
Jan
-13
Jul-1
3
Jan
-14
Jul-1
4
Jan
-15
Yields 5 yr UST
GBI-EM Yield
100
150
200
250
300
350
Jan
03
Jan
04
Jan
05
Jan
06
Jan
07
Jan
08
Jan
09
Jan
10
Jan
11
Jan
12
Jan
13
Jan
14
Jan
15
Total Return
GBI EM
UST 5y index

R: 0
G: 41
B: 91
R: 0
G: 174
B: 226
R: 152
G: 152
B: 156
R: 93
G: 92
B: 97
R: 225
G: 160
B: 15
R: 48
G: 144
B: 197
R: 160
G: 1
B: 46
R: 92
G: 146
B: 51
R: 176
G: 194
B: 6
R: 96
G: 187
B: 163
R: 200
G: 98
B: 27
R: 0
G: 127
B: 114
Source: Ashmore, UBS. Data as at 30-Sep-15.
Local Currency Debt: Real yield at healthy levels with inflation
trending down
44
-2.0
-1.0
-
1.0
2.0
3.0
4.0
5.0
Feb
/03
Jun/0
3
Oct/03
Feb
/04
Jun/0
4
Oct/04
Feb
/05
Jun/0
5
Oct/05
Feb
/06
Jun/0
6
Oct/06
Feb
/07
Jun/0
7
Oct/07
Feb
/08
Jun/0
8
Oct/08
Feb
/09
Jun/0
9
Oct/09
Feb
/10
Jun/1
0
Oct/10
Feb
/11
Jun/1
1
Oct/11
Feb
/12
Jun/1
2
Oct/12
Feb
/13
Jun/1
3
Oct/13
Feb
/14
Jun/1
4
Oct/14
Feb
/15
Jun/1
5
Real GBI Yield GTII5 Govt
-
1.00
2.00
3.00
4.00
5.00
6.00
7.00
8.00
9.00
-60
-40
-20
0
20
40
60
Feb
/03
Jun/0
3
Oct/03
Feb
/04
Jun/0
4
Oct/04
Feb
/05
Jun/0
5
Oct/05
Feb
/06
Jun/0
6
Oct/06
Feb
/07
Jun/0
7
Oct/07
Feb
/08
Jun/0
8
Oct/08
Feb
/09
Jun/0
9
Oct/09
Feb
/10
Jun/1
0
Oct/10
Feb
/11
Jun/1
1
Oct/11
Feb
/12
Jun/1
2
Oct/12
Feb
/13
Jun/1
3
Oct/13
Feb
/14
Jun/1
4
Oct/14
Feb
/15
Jun/1
5
CRY Index YoY (left axis)
GBI-EM GD Weighted CPI

R: 0
G: 41
B: 91
R: 0
G: 174
B: 226
R: 152
G: 152
B: 156
R: 93
G: 92
B: 97
R: 225
G: 160
B: 15
R: 48
G: 144
B: 197
R: 160
G: 1
B: 46
R: 92
G: 146
B: 51
R: 176
G: 194
B: 6
R: 96
G: 187
B: 163
R: 200
G: 98
B: 27
R: 0
G: 127
B: 114
Source: Ashmore. JP Morgan
USD and first Fed funds hike
45
Date Previous 12m DXY Subsequent 6m DXY Subsequent 12m DXY
10/11/15 12.15% TBD TBD
Average previous 4 cycles -5.03% -4.85% --5.62%
30/06/2004 -6.26% -7.86% 0.33%
28/02/1999 1.66% -0.84% 3.88%
28/02/1994 0.56% -4.95% -9.12%
31/12/1986 -16.09% -5.73% -17.56%
Date Previous 12m TWI Subsequent 6m TWI Subsequent 12m TWI
10/11/15 12.31% TBD TBD
Average previous 4 cycles 1.04% -2.63% -1.23%
30/06/2004 -1.32% -4.84% -3.58%
28/02/1999 -0.99% -1.61% 1.23%
28/02/1994 9.60% -0.42% 3.49%
31/12/1986 -4.02% -4.48% -6.06%


