TEACHER ACCOUNTABILITY REFORMS AND THE SUPPLY OF NEW TEACHERS Matthew A. Kraft Brown University Eric J. Brunner University of Connecticut Shaun M. Dougherty University of Connecticut David Schwegman Syracuse University January 2018 Abstract In recent years, states across the country have attempted to increase the accountability of public school teachers by implementing rigorous, high-stakes evaluation systems and in some cases repealing teacher tenure protections. We examine the effect of these reforms on the supply of new entrants into the teacher labor market by exploiting a unique panel dataset that includes the number of teaching licenses granted by states. Leveraging variation in the adoption of reforms across states and time, we find that evaluation reforms resulted in a steady decline in the statewide supply of new teachers, whereas tenure reforms produced a sharp but more temporary contraction. In exploratory analyses, we find no evidence that decreases in labor supply differed systematically across non-shortage and shortage licensure areas. We find mixed evidence of the effect of accountability on the selectivity of the institutions where prospective teachers earned their teaching degrees. Tenure reforms appear to have reduced supply most among candidates from less selective universities, while there is little evidence evaluation reforms had any differential effect by university selectivity. JEL No. I21, I28, J22, J24 Correspondence regarding the paper can be sent to Matthew Kraft at [email protected]; Brown University, PO Box 1938, Providence RI, 02478; (401) 863-3597. This work was generously supported by the Spencer Foundation [Award #201700052] and the Institute for Education Sciences [Award # R305A170053]. We thank Motaz Al- Chanati, Alif Al-Ibrahim, Michael Briskin, Bruna Lee, Matt Owen, and Sarah Novicoff for their excellent research assistance. We are grateful to David Deming, Tom Dee, Joshua Hyman, Joshua Goodman, Steve Ross, Matthew Steinberg, Eric Taylor and seminar participants at the University of Arkansas, University of Connecticut, and the Harvard Kennedy School who provided helpful comments.
Transcript
TEACHER ACCOUNTABILITY REFORMS AND THE SUPPLY OF NEW TEACHERS
Matthew A Kraft
Brown University
Eric J Brunner
University of Connecticut
Shaun M Dougherty
University of Connecticut
David Schwegman
Syracuse University
January 2018
Abstract
In recent years states across the country have attempted to increase the accountability of public
school teachers by implementing rigorous high-stakes evaluation systems and in some cases
repealing teacher tenure protections We examine the effect of these reforms on the supply of
new entrants into the teacher labor market by exploiting a unique panel dataset that includes the
number of teaching licenses granted by states Leveraging variation in the adoption of reforms
across states and time we find that evaluation reforms resulted in a steady decline in the
statewide supply of new teachers whereas tenure reforms produced a sharp but more temporary
contraction In exploratory analyses we find no evidence that decreases in labor supply differed
systematically across non-shortage and shortage licensure areas We find mixed evidence of the
effect of accountability on the selectivity of the institutions where prospective teachers earned
their teaching degrees Tenure reforms appear to have reduced supply most among candidates
from less selective universities while there is little evidence evaluation reforms had any
differential effect by university selectivity
JEL No I21 I28 J22 J24
Correspondence regarding the paper can be sent to Matthew Kraft at mkraftbrownedu Brown University PO
Box 1938 Providence RI 02478 (401) 863-3597 This work was generously supported by the Spencer Foundation
[Award 201700052] and the Institute for Education Sciences [Award R305A170053] We thank Motaz Al-
Chanati Alif Al-Ibrahim Michael Briskin Bruna Lee Matt Owen and Sarah Novicoff for their excellent research
assistance We are grateful to David Deming Tom Dee Joshua Hyman Joshua Goodman Steve Ross Matthew
Steinberg Eric Taylor and seminar participants at the University of Arkansas University of Connecticut and the
Harvard Kennedy School who provided helpful comments
2
I Introduction
In response to mounting public pressure and strong incentives from the federal
government state legislatures across the country have enacted laws aimed at increasing
accountability for public school teachers Many of these efforts have focused on implementing
high-stakes teacher evaluation systems and repealing teacher tenure By 2016 44 states had
implemented major reforms to their teacher evaluation systems These reforms were intended to
increase the rigor of the evaluation process and streamline the dismissal process Six states
enacted laws that effectively eliminated tenure for new teachers with three additional state
legislatures passing laws that were vetoed or immediately overturned by ballot referendum
Proponents assert these reforms are necessary given the wide variation in teacher quality
documented in the literature and the inability or reluctance of school districts to terminate
ineffective teachers (Wiesberg et al 2009 Hanushek 2009) In contrast opponents of
accountability reforms argue that teachers are already under immense pressure to perform and
that the implementation of high-stakes teacher evaluation systems and the elimination of tenure
protections would only serve to reduce both the quantity and quality of new college graduates
willing to pursue a career in teaching (Fullan 2011) However limited empirical evidence exists
on whether and how those reforms actually affect the teacher labor market
What evidence is available comes primarily from studies that examine the effect of
changes in job security on the behavior and career decisions of current teachers Research
demonstrates that teachers are less likely to be absent spend more of their own money on
classroom materials and participate in more extracurricular activities in the years before they
earn tenure (Hansen 2009 Jones 2015)1 Studies have also shown that the increased dismissal
1 Similarly Jacob (2013) finds that a policy change that gave Chicago Public School principals more freedom to
dismiss probationary teachers reduced teacher absences by 10 percent
3
threat under new high-stakes evaluation has led to greater voluntary attrition of lower-performing
teachers (Dee and Wyckoff 2015 Loeb Miller and Wyckoff 2014 Sartain and Steinberg 2016
Cullen Koedel and Parsons 2016 Strunk Barret and Lincove 2017)
This paper addresses the largely unexamined question of how accountability reforms
affect the supply of new teachers We exploit arguably exogenous variation in the timing of
teacher accountability reforms across states to provide the first empirical evidence on how these
reforms affected new teacher labor supply Our analyses also provide a direct empirical test of a
key assumption of the teacher quality literature namely that accountability reforms do not affect
the willingness of prospective teachers to enter the teacher labor market Many prior studies
estimate potential learning gains from dismissing low-performing teachers through simulation
analyses that rely on the untested assumption that dismissed teachers can always be replaced
with average-quality novice teachers (Gordon Kane and Staiger 2006 Hanushek 2009 Staiger
and Rockoff 2010 Winters and Cowen 2013a 2013b Goldhaber and Hansen 2010)
Our work builds most directly on Rothsteinrsquos (2015) simulation analyses of how a policy
that removes the bottom 20 percent of performers among teachers eligible for tenure would
affect the supply of both current and future teachers Although Rothsteinrsquos policy simulation is
far more extreme than any observed in practice his findings suggest that it would require
ldquosubstantial increases in teacher salariesrdquo to offset the accountability policy and continue to draw
equivalent numbers of new entrants into the teaching profession (p126)
We begin by presenting trends in the supply of new teachers from 2002 to 2016 based on
the total number of teaching licenses granted by states each year information that states are
required to report to the US Department of Education (DOE) This outcome provides a direct
measure of the potential supply of all new teachers eligible to work in publicly-funded schools
4
(traditional or charter) regardless of certification pathway or licensure type and links each
teacher to their state of intended employment Obtaining a license is often the last step prior to
entering the labor market and thus is likely to be immediately responsive to policy reforms We
complement our licensure measure with data on the number of university-based teacher
preparation program degree completers from the Integrated Postsecondary Education Data
System (IPEDS) Both measures suggest that nationally new teacher labor supply has fallen by
over 20 percent between pre-recession levels in 2007 and 2016
We then provide evidence on the relationship between accountability reforms and the
supply of new teachers using a completely flexible event-study specification that allows for an
examination of pre- and post-treatment trends We complement this non-parametric approach
with more structured difference-in-differences (DD) models to increase the precision of our
estimates In our preferred models we allow for differential linear trends pre- and post-policy
reform in treated states to explicitly test the parallel trends assumption as well as to model
separately any immediate effects of the policy reforms and any incremental effects on teacher
labor supply over time
We find consistent evidence that both implementing high-stakes evaluation reforms and
repealing tenure reduced teacher labor supply In joint models we estimate that the number of
licenses granted dropped by approximately 15 percent in states that adopted evaluation reforms
and 16 percent in states that repealed tenure on average Flexible models suggest that the timing
dynamics of these effects differ Specifically evaluation reforms appear to result in a steady
decline in new labor supply over time whereas tenure reforms result in a sharp and immediate
contraction in the supply of new teachers that then slowly rebounds These findings are robust to
5
a range of model specifications and falsification tests and are consistent with Rothsteinrsquos (2015)
predictions given that we find no evidence of offsetting increases in teacher salaries
The consequences of these reductions in new teacher labor supply depend in large part on
the composition of the prospective teachers who pursue other occupations Reductions in supply
could reflect market corrections to the large oversupply of general elementary and secondary
humanities teachers Reductions in supply could also reflect a disproportionate decrease in the
number of less-qualified (or highly-qualified) prospective teachers We explore these
possibilities using more detailed IPEDS data on the number of graduates from university-based
teacher preparation programs These data provide a less precise measure of state-specific new
teacher labor supply in the public sector but allow us to examine whether the impact of
accountability reforms varies by subject area specialization the selectivity and average freshman
SAT scores of institutions where prospective teachers attended a preparation program (a proxy
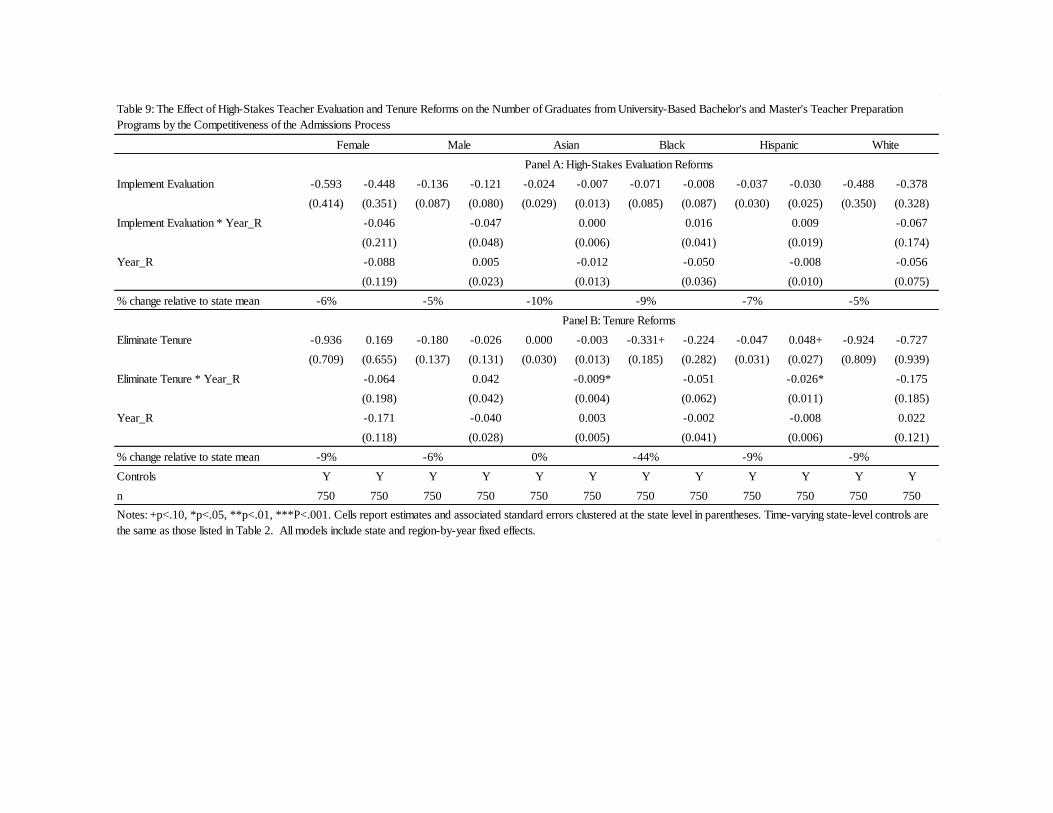
for teacher quality) gender and race
We find no evidence that decreases in labor supply differed systematically across non-
shortage versus shortage licensure areas Reductions were proportionally largest for secondary
English (non-shortage) and secondary science (shortage) We find mixed evidence of differential
effects of accountability reforms on the qualifications of graduates from teacher preparation
programs based on institutional selectivity and average freshman SAT scores Effects of high-
stakes evaluation reforms on teacher qualifications are mixed and imprecisely estimated while
evidence suggests tenure reforms increased the quality of the institutions where prospective
teachers receive their degrees We also find no conclusive evidence that accountability reforms
had a differential effect on prospective teachers by gender or race We conclude with a
discussion of the implications for policy practice and future research
6
II Teacher Accountability Reforms
Efforts to introduce greater accountability in schools and classrooms have ebbed and
flowed throughout the history of US public education Present George W Bushrsquos No Child Left
Behind (NCLB) act passed in 2002 expanded test-based school accountability policies
nationally and established more rigorous teacher licensure standards with the aim of improving
teacher quality In following years a growing body of research on teacher effectiveness
exploited new district administrative datasets linking students to teachers that NCLB helped to
create Three seminal findings from this research served as signposts for the teacher
accountability reform initiatives of the Obama administration 1) the effects teachers have on
student learning are large and vary considerably across teachers 2) teacher qualifications are
weakly related to their effects on student learning and 3) teacher evaluation systems were failing
to differentiate among teachers despite their large differences in effectiveness
Starting in 2009 the Obama administration leveraged $435 billion from the American
Reinvestment and Recovery Act to fund the Race to the Top (RTT) grant competition The RTT
application rubric detailed specific evaluation system reforms required for a competitive
proposal such as evaluating teachers using multiple measures including student achievement
growth rating teachers on a scale with multiple categories conducting annual evaluations and
providing feedback and using evaluations to make high-stakes personnel decisions The
opportunity to secure hundreds of millions of dollars in federal grant aid was too tempting for
most states to pass up in the wake of the Great Recession Forty-six states applied in the first of
three rounds of funding under RTT Private foundations and philanthropic organizations such as
the Gates and Broad Foundations and the New Schools Venture Fund also invested millions of
7
dollars to support evaluation reforms across the country In 2012 the Obama administration then
made adopting evaluation reforms a condition for states to receive a waiver from the increasingly
stringent accountability consequences of failing to meet targets set by NCLB
By 2016 44 states had passed legislation that mandated major teacher evaluation reforms
(NCTQ 2016) While new evaluation systems differ across states nearly all systems share a
common set of features 1) the incorporation of multiple measures of teacher performance
including test-based performance measures such as value-added measures or student growth
percentiles 2) the use of multiple performance rating categories and 3) the use of evaluation
ratings to inform high-stakes personnel decisions In many cases teachers receiving low
evaluation ratings could be dismissed or denied tenure or promotion while teachers with
exemplary ratings could be rewarded with merit pay or promoted to new positions on a career
ladder (Donaldson and Papay 2015)
Over this same period several states attempted to roll back teacher tenure protections
arguing that tenure laws made it unreasonably difficult to dismiss poor performing teachers
Teachersrsquo organizations and unions had long worked to secure and protect state statutes that
require school districts to follow detailed due process procedures and timelines when attempting
to dismiss a tenured teacher These statutes in combination with locally bargained employment
contracts and due process procedures establish the binding set of job protections known as
teacher tenure2 In practice teachers typically earn tenure by default after two to five years of
work experience As of 2016 lawmakers in nine states had passed legislation aimed at
2 By the turn of the 21st century all but two states (OR MS) had adopted formal tenure statutes
8
eliminating or effectively removing formal teacher tenure protections for new teachers with six
of these bills ultimately going into effect3
III Conceptual Framework
How might adopting high stakes evaluation systems and eliminating tenure affect the
decision of individuals to join the teaching profession Evidence suggests that individuals who
select into teacher preparation programs are more risk-averse and place a higher premium on job
security than other college graduates (Bowen Buck Deck Mills and Shuls 2015) Eliminating
or restricting this job security could negatively affect new teacher labor supply through several
mechanisms Evidence from other labor sectors demonstrates that workers in occupations with
higher unemployment risk earn higher salaries to compensate for this risk (Feinberg 1981)
Accountability reforms that weaken or eliminate job security could decrease labor supply if
teacher salaries remain fixed Reforms may also decrease new labor supply if they make the
profession less enjoyable by for example decreasing teacher autonomy through a prescribed
curriculum aligned with high-stakes tests and an increased focus on test preparation Importantly
even if accountability reforms have no direct effect on job protections or satisfaction they may
still affect new labor supply if they affect the perception among potential entrants into the
profession that teaching is a less secure or enjoyable career (Donaldson 2016 Donaldson
Anagnostopoulos and Yang 2017 Kraft and Gilmour 2016) At the same time merit pay
programs based on evaluation ratings could attract more qualified teachers into the profession
although the literature suggests that prospective teachers have little reliable information with
3 Ohio and South Dakota passed laws eliminating tenure protections that were overturned the same year by state
ballot referendums Pennsylvaniarsquos tenure bill was vetoed by Governor Wolf See Appendix B for further details on
state laws restricting or eliminating tenure
9
which to predict their future success in the classroom (Jackson Rockoff and Staiger 2014
Rothstein 2015)
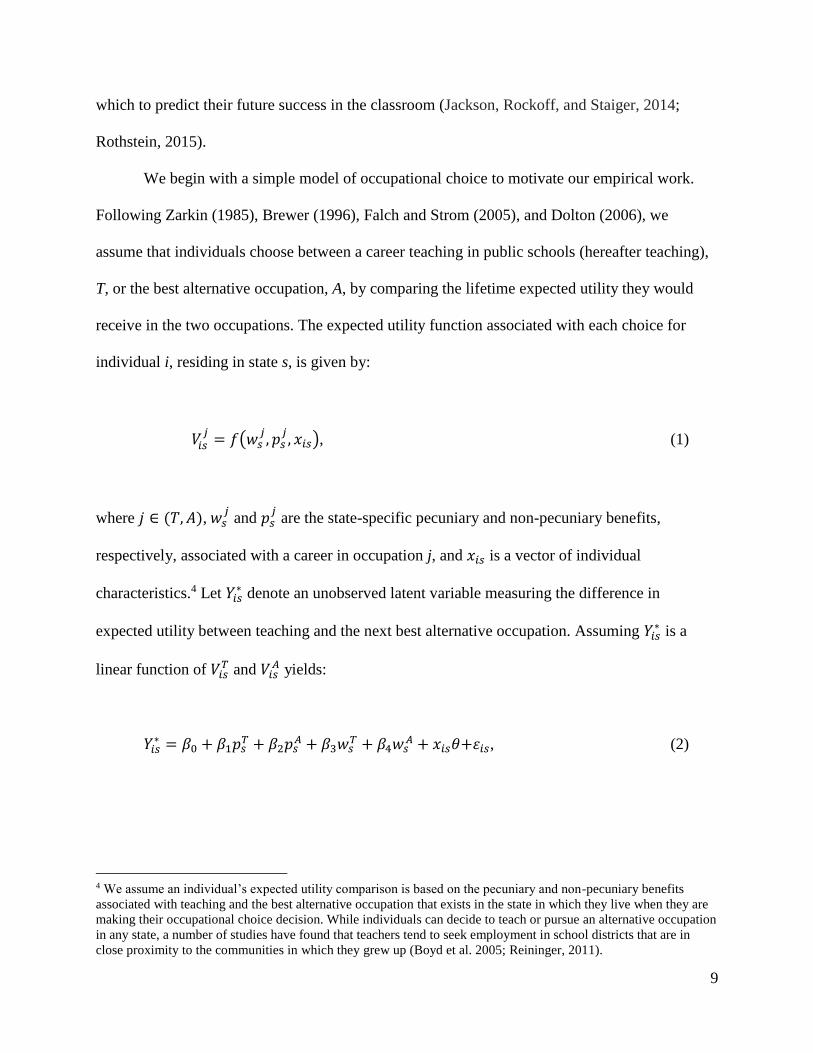
We begin with a simple model of occupational choice to motivate our empirical work
Following Zarkin (1985) Brewer (1996) Falch and Strom (2005) and Dolton (2006) we
assume that individuals choose between a career teaching in public schools (hereafter teaching)
T or the best alternative occupation A by comparing the lifetime expected utility they would
receive in the two occupations The expected utility function associated with each choice for
individual i residing in state s is given by
119881119894119904119895
= 119891(119908119904119895 119901119904
119895 119909119894119904) (1)
where 119895 isin (119879 119860) 119908119904119895 and 119901119904
119895 are the state-specific pecuniary and non-pecuniary benefits
respectively associated with a career in occupation j and 119909119894119904 is a vector of individual
characteristics4 Let 119884119894119904lowast denote an unobserved latent variable measuring the difference in
expected utility between teaching and the next best alternative occupation Assuming 119884119894119904lowast is a
linear function of 119881119894119904119879 and 119881119894119904
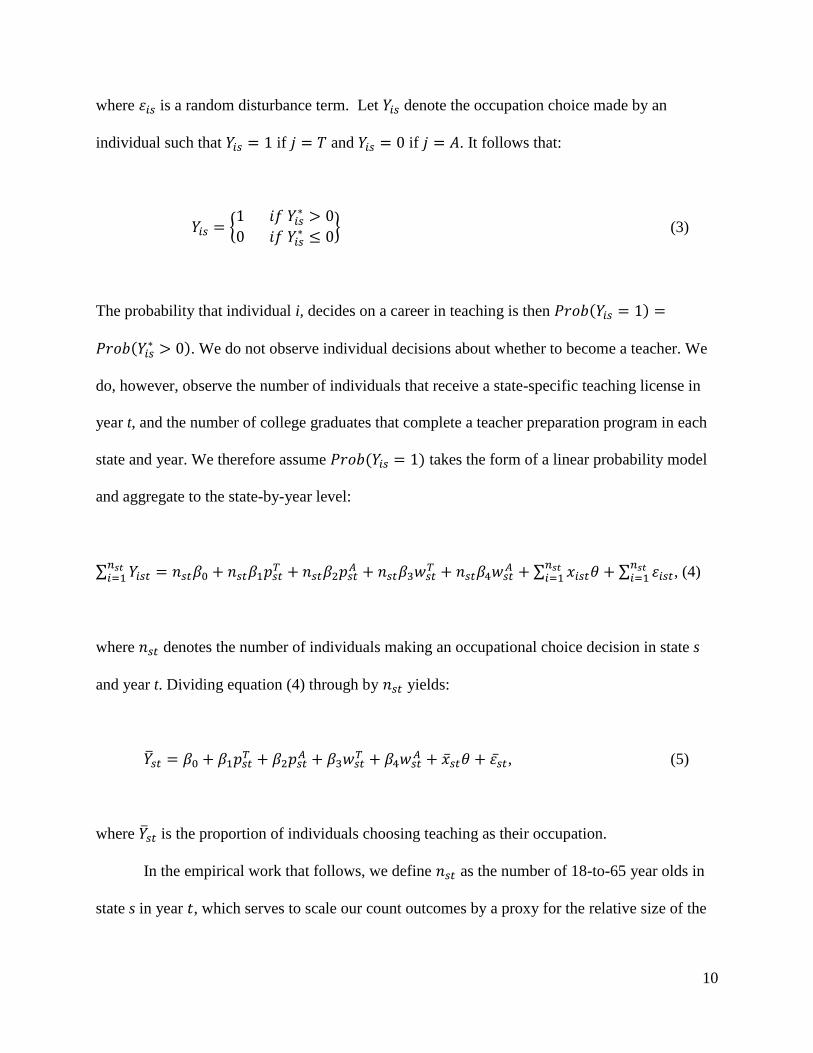
where 119904119905 is the proportion of individuals choosing teaching as their occupation
In the empirical work that follows we define 119899119904119905 as the number of 18-to-65 year olds in
state s in year 119905 which serves to scale our count outcomes by a proxy for the relative size of the
11
working-age pool of potential new entrants in the teaching profession in each state5 Defining 119899119904
in terms of the current year provides a consistent approach for scaling our outcomes of interest
and reflects that fact that prospective teachers likely make choices about where to apply for a
teaching license in the same year in which they enter the labor market While an individualrsquos
initial decision to major in education or pursue a graduate degree in education may occur
between one to four years prior to entering the labor market they can still choose to withdraw at
any point in time6
IV Data
We conduct our analyses using an original state-by-year panel that combines measures of
the number of individuals in each state planning to enter the teacher labor force measures of
state-level teacher accountability laws and time-variant state-level control variables from 2002
through 2016 Ideally we would measure new teacher labor supply as the total number of
candidates that applied for K-12 public school teaching positions for the first time Although
such a measure is unavailable at the national level data collected by the US Department of
Education (DOE) on the number of initial teacher licenses granted by states each year serves as
an advantageous proxy States are required to report these data as a condition for receiving
federal funding under Title II of the Higher Education Act7 These licensure count data include
traditional probationary licenses as well as temporary teaching licenses such as emergency and
5 State-specific data on the number of individuals between the ages of 18 and 65 comes from the US Census 6 Our results are consistent if we used lagged measures of state populations aged 18-to-65 given the high
autocorrelation of this measure within states over time 7 While states differ in the types of initial teacher licenses they issue and the requirements for these licenses there
are several elements commonly required to receive a license 1) possess a bachelorrsquos degree (often with a minimum
grade point average) 2) complete a set of required professional courses 3) pass state-specific licensure exams 4)
complete a minimum number of supervised student teaching or clinical hours and 5) pass a criminal background
check Prospective teachers must enroll in a state-approved teacher preparation program (TPP) to meet these
requirements
12
intern teaching credentials This measure is also robust to the rapid expansion of alternative
certification programs and charter schools over the panel Teachers who enter the profession via
alternative pathways such as Teach for America are still required by states to obtain temporary
licensures The vast majority of states also require teachers who work in charter schools to obtain
a state licensure8 Although licensure reciprocity agreements exist between some states
individuals seeking to teach in a new state must still acquire a state-specific initial teaching
license and will be included in our data9
We complement our licensure measure with data on the number of graduates from
university-based teacher preparation programs from the IPEDS survey We restrict our sample to
bachelorrsquos and masterrsquos degree recipients from programs in institutions of higher education
preparing students for classroom teaching10 The advantage of the IPEDS data is that it
disaggregates data across a number of subgroups thus allowing us to test for heterogeneous
effects across subject areas gender and race These data also allow us to test for differential
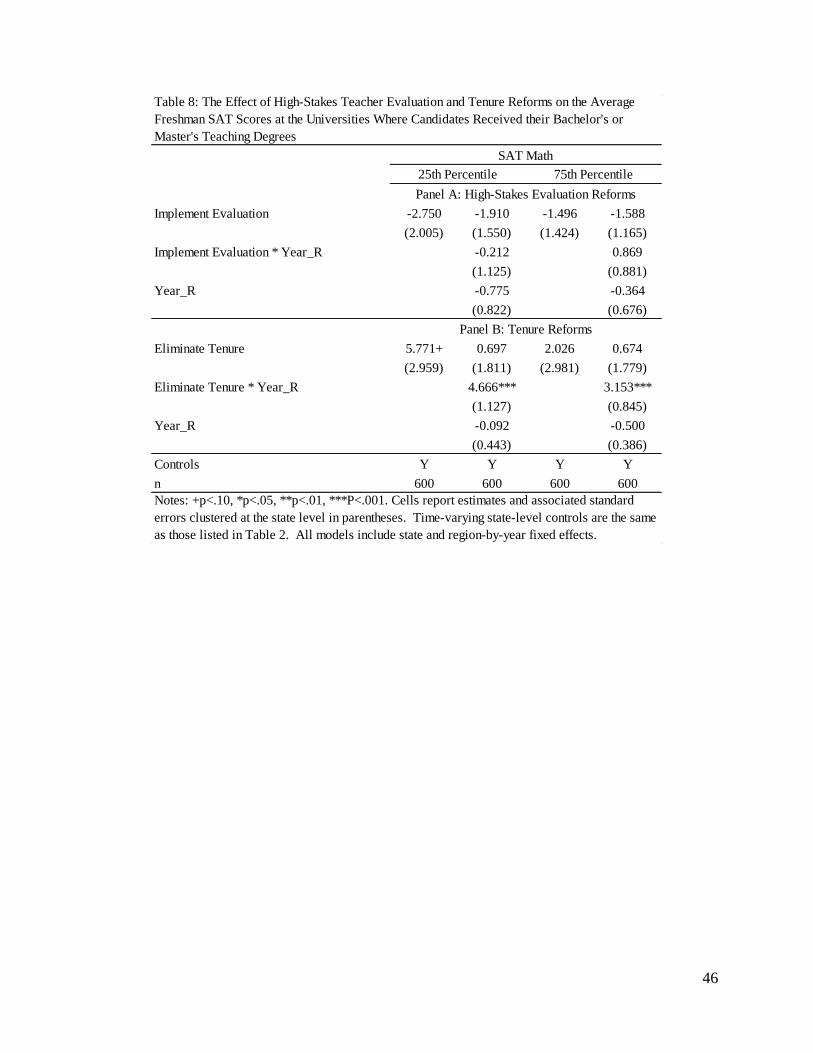
impacts by institutional selectivity as measured by the Barronrsquos index as well as the 25th and 75th
percentiles of freshman SAT math scores which have been shown to be predictive of teacher
effectiveness (Rockoff Jacob Kane and Staiger 2009 Jacob et al 2016)
These advantages are offset however by several limitations of this measure First
program completers may intend to teach in private schools or work outside of education We
8 Of the 42 states with charter school laws in 2016 28 states (67 percent) required that teachers obtain state licenses
while 11 states (26 percent) required the majority the teachers to be licensed (~ 50 to 75 percent of teachers) Only
three states (Arizona Alabama [which only allowed charters in 2015] and Louisiana) had no licensure requirement
for charter school teachers (Education Commission on the States 2016) 9 Evidence suggests that despite reciprocity agreements costs associated with transferring licensure are quite high
(National Association of State Directors of Teacher Education and Certification ND Barnum 2017 Sindelar
Bishop Gill Connelly and Rosenberg 2007) Thus mobility within a state is much more common than across state
lines (Goldhaber Grout Holden and Brown 2015) 10 See Appendix C for a detailed description of the classification of instructional programming (CIP) codes we used
to identify graduates of teacher preparation programs and subject areas
13
estimate that the percentage of teacher education program completers who actually go on to work
in public education ranges between 46 percent (Social Science and History) and 67 percent
(Special Needs) depending on subject type11 Second program completers may seek to teach in
a state other than the one in which they completed their degree Third this measures does not
include program completers from all institutions of higher education given that only institutions
that receive federal aid are required to report these data Finally any potential effect of teacher
accountability reforms on the choice of major for undergraduate students who constitute almost
half of all teacher preparation program completers is likely to be delayed across several years
Thus we employ IPEDS data to facilitate exploratory analyses that are not possible with license
data while recognizing that they are noisy measures of new teacher labor supply and will likely
understate any effect of state-specific accountability reforms
We draw upon two systematic reviews of teacher evaluation reforms to code the timing
of reform efforts across states (Steinberg and Donaldson 2016 NCTQ 2016) Implement
Evaluation is coded as one in the fall of the academic year in which districts across the state first
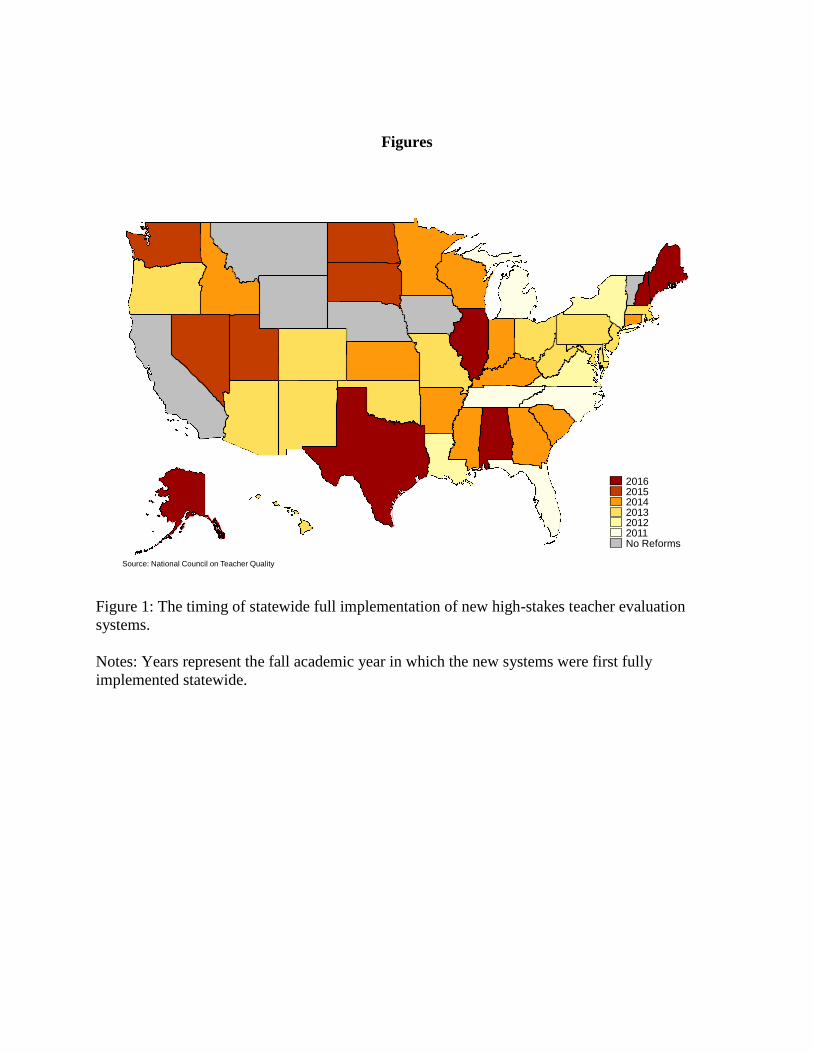
fully implemented the redesigned teacher evaluation system Figure 1 displays the timing of full
system implementation across states over time This tractable approach however cannot capture
important differences in system design features States adopted a wide range of weights they
assigned to test-score based measures of teacher performance ranging from 0 to 50 percent
Approximately half of the states also phased in requirements to use test-score based measures
across several years following statewide implementation Some states also delayed the use of
evaluation scores to inform high-stakes personnel decisions until after initial statewide
11 Calculations are based on employment data from the American Community Survey 3-year file from 2011-2013
These data include employment and earnings for individuals aged 25-64 We multiplied the national percentage of
individuals with a given major (eg elementary education) who were employed full time as an elementary or
secondary classroom teacher by the percentage of individuals with that degree who were found to be working at all
14
implementation We conduct several tests examining the effects of these differences across states
and discuss the implications of these staggered implementation patterns in more detail below
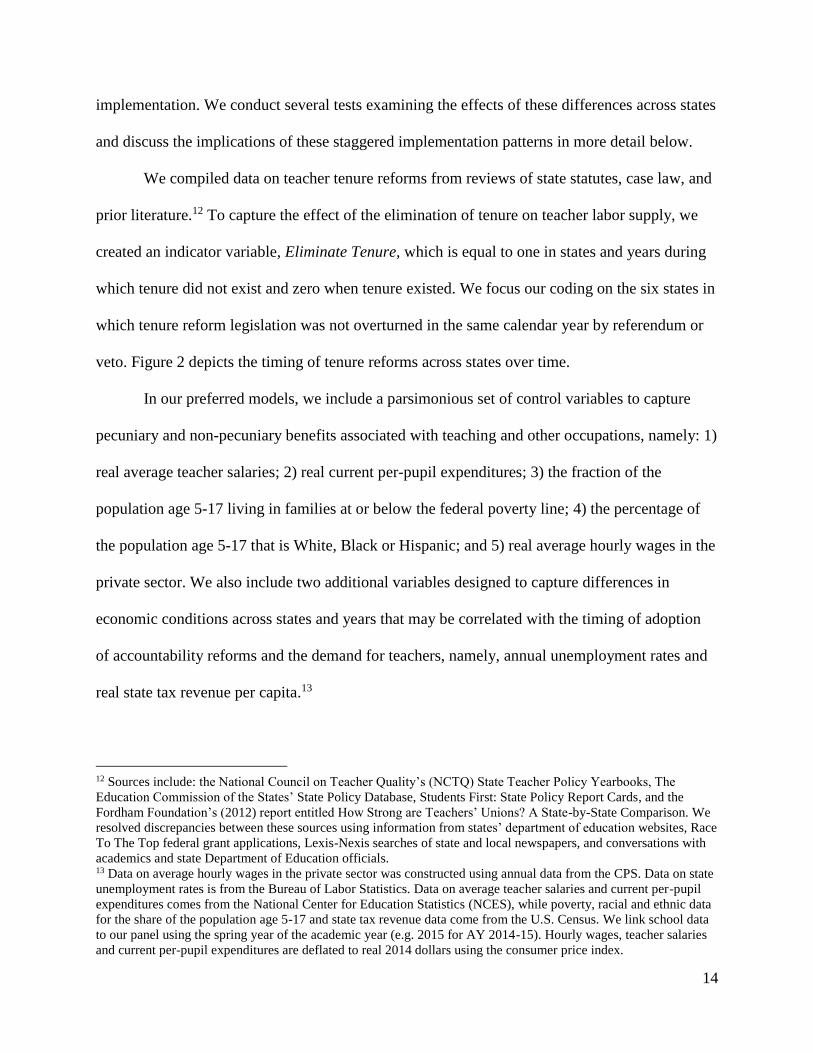
We compiled data on teacher tenure reforms from reviews of state statutes case law and
prior literature12 To capture the effect of the elimination of tenure on teacher labor supply we
created an indicator variable Eliminate Tenure which is equal to one in states and years during
which tenure did not exist and zero when tenure existed We focus our coding on the six states in
which tenure reform legislation was not overturned in the same calendar year by referendum or
veto Figure 2 depicts the timing of tenure reforms across states over time
In our preferred models we include a parsimonious set of control variables to capture
pecuniary and non-pecuniary benefits associated with teaching and other occupations namely 1)
real average teacher salaries 2) real current per-pupil expenditures 3) the fraction of the
population age 5-17 living in families at or below the federal poverty line 4) the percentage of
the population age 5-17 that is White Black or Hispanic and 5) real average hourly wages in the
private sector We also include two additional variables designed to capture differences in
economic conditions across states and years that may be correlated with the timing of adoption
of accountability reforms and the demand for teachers namely annual unemployment rates and
real state tax revenue per capita13
12 Sources include the National Council on Teacher Qualityrsquos (NCTQ) State Teacher Policy Yearbooks The
Education Commission of the Statesrsquo State Policy Database Students First State Policy Report Cards and the
Fordham Foundationrsquos (2012) report entitled How Strong are Teachersrsquo Unions A State-by-State Comparison We
resolved discrepancies between these sources using information from statesrsquo department of education websites Race
To The Top federal grant applications Lexis-Nexis searches of state and local newspapers and conversations with
academics and state Department of Education officials 13 Data on average hourly wages in the private sector was constructed using annual data from the CPS Data on state
unemployment rates is from the Bureau of Labor Statistics Data on average teacher salaries and current per-pupil
expenditures comes from the National Center for Education Statistics (NCES) while poverty racial and ethnic data
for the share of the population age 5-17 and state tax revenue data come from the US Census We link school data
to our panel using the spring year of the academic year (eg 2015 for AY 2014-15) Hourly wages teacher salaries
and current per-pupil expenditures are deflated to real 2014 dollars using the consumer price index
15
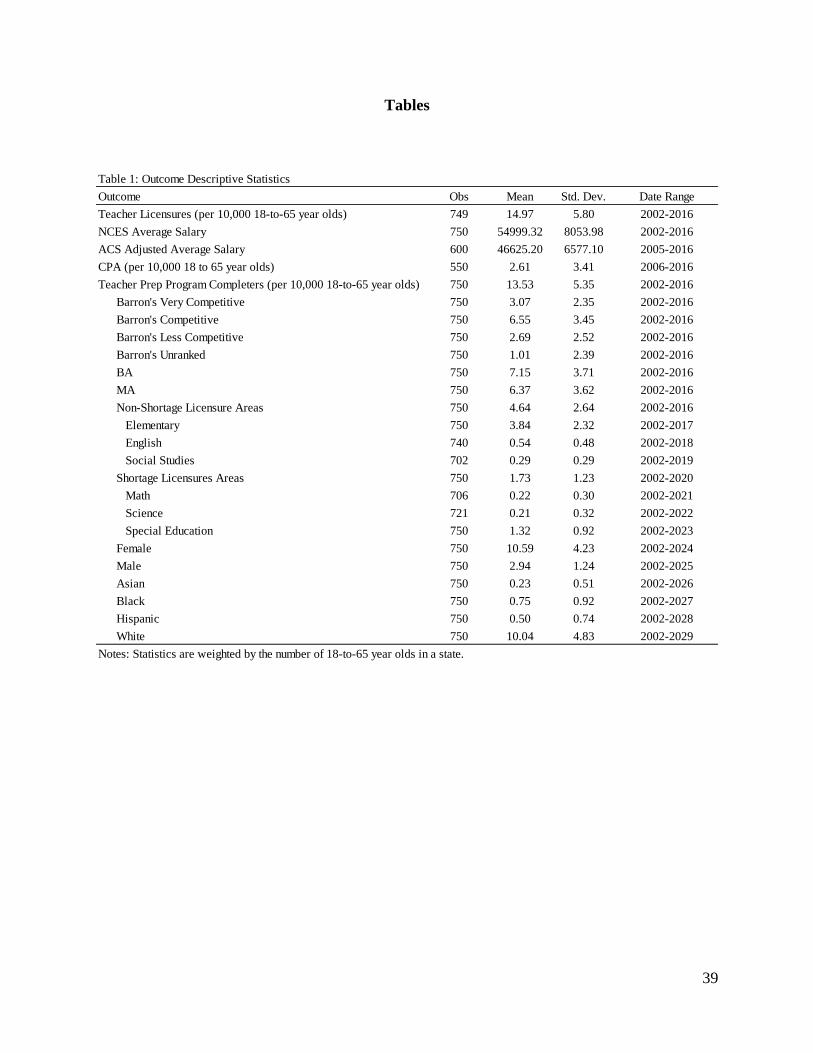
Table 1 presents the means and standard deviations of outcome variables used in our
analysis Across our 15-year panel the average annual number of licenses granted per state is 15
per 10000 adults age 18-to-65 We discuss the additional outcome variables used in exploratory
analyses below
V Empirical Framework
We estimate the effects of teacher accountability on the decision of individuals to enter
the teacher labor market using a difference-in-differences framework Our identification strategy
compares changes within treated states over time to other non-treated states in the same
geographic regions This approach relies on two key assumptions namely that the timing of
accountability reforms is as good as random and that there are no other concurrent changes in
labor market conditions or teacher policies across treated states but not untreated states
Importantly the differential timing of accountability reforms across treated states allows us to
remove any regional trends in teacher labor supply and demand that might confound our
estimates Teacher accountability reforms were not the only education policy reforms that
occurred during our panel period Some states also adopted related reforms such as reducing the
scope of collective bargaining rights passing right-to-work laws changing the length of
probationary period increasing teachersrsquo contributions to pension plans introducing new teacher
licensure exams adopting common core standards and administering new common-core aligned
tests However none of these reforms were implemented consistently in the same states and at
the same time as teacher accountability reforms In robustness tests presented below we find that
our results are largely unchanged when controlling for these additional policy reforms
16
We begin with a non-parametric event-study specification This allows us to model any
anticipatory effects of the policy in a fully flexible way as well as non-linear changes in the
post-period
119884119904119905 = sum 120582119868120591(119910119890119886119903119905 minus 1205910)3120591=minus7 + Γ119883119904119905 + 120587119904 + 120574119892119905 + 120598119904119905 (6)
where 119884119904119905 is an outcome of interest for state s in year t 120587119904 and 120574119892119905 are state and region-by-year
fixed effects respectively that account for fixed differences in the public teacher labor markets
across states and regional labor market shocks across time and 120598119904119905 is a random disturbance term
Our primary outcomes of interest 119884119904119905 are ratios of the number of new teaching licenses or
teacher preparation program completers per every 10000 individuals aged 18-to-65 in a given
state and year Because equation (6) is a grouped linear probability model that is motivated by
equation (5) from our conceptual framework the variance of the random disturbance term is
proportional to the denominator of our outcome namely the number of individuals aged 18-to-
65 To improve precision we weight all models by this denominator We test the sensitivity of
our findings to alternative weights and functional forms below and find that our results are
consistent across model specifications
The key variables of interest in (6) are the set of indicators for the years pre- and post-
policy reform The term (119910119890119886119903119905 minus 1205910) is a re-centered linear time trend for states that adopted the
focal policy reform in time 1205910 while 119868120591 is an indicator variable that equals 1 in year 120591 and 0
otherwise Thus 119910119890119886119903119905 minus 1205910 takes on a value of -1 in the year prior to the policy reform and 0 in
the first year of the reform We model relative time as a set of binary indicators for the years
prior to a policy change (-7 or more to -1) as well as post-policy change (0 to 3 or more) to
17
capture year-specific effects on the outcome of interest14 We show results from specifications
without controls as well as specifications that include the parsimonious set of covariates 119883119904119905
described above It is possible that teacher accountability reforms both directly and indirectly
affected covariates such as per-pupil expenditures teacher salaries and the composition of the
student population Adding these controls may serve to attenuate our estimates to the extent that
any effects on teacher labor supply are mediated through changes to these contexts and benefits
of the teaching profession We include them in our full models as a conservative approach to
account for changes in teaching contexts and benefits that were the result of other education
policy reforms that may have occurred around the same time as the implementation of teacher
accountability reforms
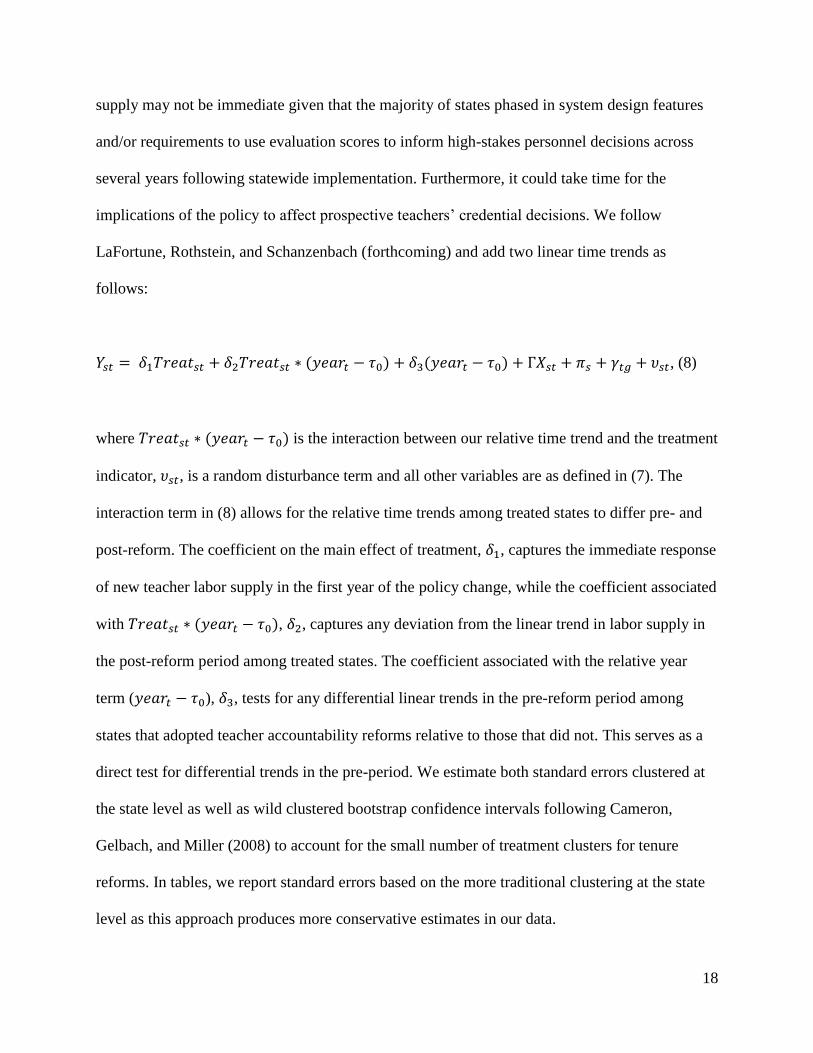
We next adopt a standard difference-in-differences (DD) model to pool estimates across
years post-reform and increase the precision of our estimates as follows
where 119879119903119890119886119905119904119905 lowast (119910119890119886119903119905 minus 1205910) is the interaction between our relative time trend and the treatment
indicator 120592119904119905 is a random disturbance term and all other variables are as defined in (7) The
interaction term in (8) allows for the relative time trends among treated states to differ pre- and
post-reform The coefficient on the main effect of treatment 1205751 captures the immediate response
of new teacher labor supply in the first year of the policy change while the coefficient associated
with 119879119903119890119886119905119904119905 lowast (119910119890119886119903119905 minus 1205910) 1205752 captures any deviation from the linear trend in labor supply in
the post-reform period among treated states The coefficient associated with the relative year
term (119910119890119886119903119905 minus 1205910) 1205753 tests for any differential linear trends in the pre-reform period among
states that adopted teacher accountability reforms relative to those that did not This serves as a
direct test for differential trends in the pre-period We estimate both standard errors clustered at
the state level as well as wild clustered bootstrap confidence intervals following Cameron
Gelbach and Miller (2008) to account for the small number of treatment clusters for tenure
reforms In tables we report standard errors based on the more traditional clustering at the state
level as this approach produces more conservative estimates in our data
19
VI Results
A Descriptive Trends in Teacher Labor Supply
National trends in the supply of potential job candidates for public teaching positions
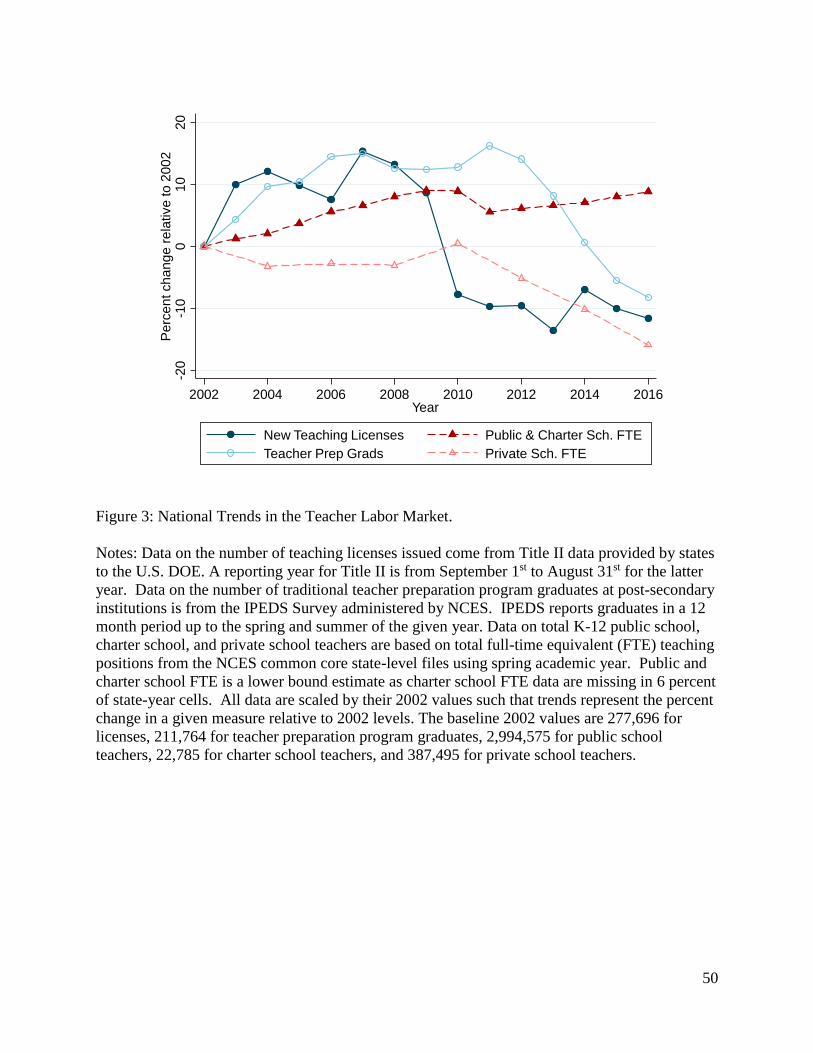
have changed substantially over the past fifteen years Figure 3 plots trends in new teacher labor
supply as measured by licenses and degree completers juxtaposed with the number of full-time
equivalent teachers (FTE) employed in publicly-funded schools (traditional and charter) and
private schools For licenses relative supply increased from 2002 to 2007 and then declined
sharply during the Great Recession The number of degree completers follows a very similar
pattern with a three- to four-year lag likely reflecting that over half of all degree completers are
in 4-year bachelorrsquos degree programs Relative to pre-recession levels in 2007 new teacher labor
supply has declined by 234 percent as measured by licensures and 202 percent as measured by
teacher preparation program graduates At the same time the size of the teacher labor market in
publicly-funded schools has increased since 2002 reaching a high in 2009 falling by
approximately 35 percentage points the following year largely due to layoffs and incentivized
early retirements under the Great Recession (Kraft 2015) and then steadily expanding through
2016 The charter sector alone has grown by over 500 percent since 2002 but remains at only 45
percent of the FTE teachers employed in publicly-funded schools
The failure of new teacher labor supply to recover even partially to pre-recession levels
stands in contrast to the steady rise in the teacher workforce in publicly-funded schools
Although a true measure of national demand for licensed teachers does not exist recent increases
in total FTE across traditional and charter schools suggest decreased demand is unlikely to be a
primary explanation for the sustained contraction The lack of recovery also cannot be accounted
20
for by an expansion of the private sector where state licenses or even formal teacher training are
not required Steep declines in the size of the private school teacher workforce over 15 percent
since 2010 suggest decreasing demand for new teachers We examine the degree to which
teacher accountability reforms enacted by states almost entirely during the post-Recession period
have played a role in the sustained contraction of the new teacher labor market
B Effect of High-Stakes Teacher Evaluation on New Teacher Labor Supply
We begin with estimates from our fully-flexible event-study model with covariates
shown in Figure 4 and reported in column 2 of Appendix Table A1 Estimates should be
interpreted as Intent-to-Treat (ITT) estimates of the effect of high-stakes reforms given the wide
variability in implementation across and within states (Kraft and Gilmour 2017) These ITT
estimates serve to answer the relevant question from a policymakerrsquos perspectivemdashwhat is the
effect of passing and implementing a state-wide high-stakes evaluation reform The parameter
estimates with associated 95 percent confidence intervals for the years pre- (hollow dot) and
post-reform (solid dot) are strongly suggestive of a negative effect of evaluation reforms on new
teacher labor supply The number of teacher licenses granted remains largely unchanged in pre-
period years and then declines steadily starting the year in which high-stakes evaluation reforms
are implemented statewide These individual point estimates become statistically significant in
the second year and suggest that the effects of the reform increase in post-reform years
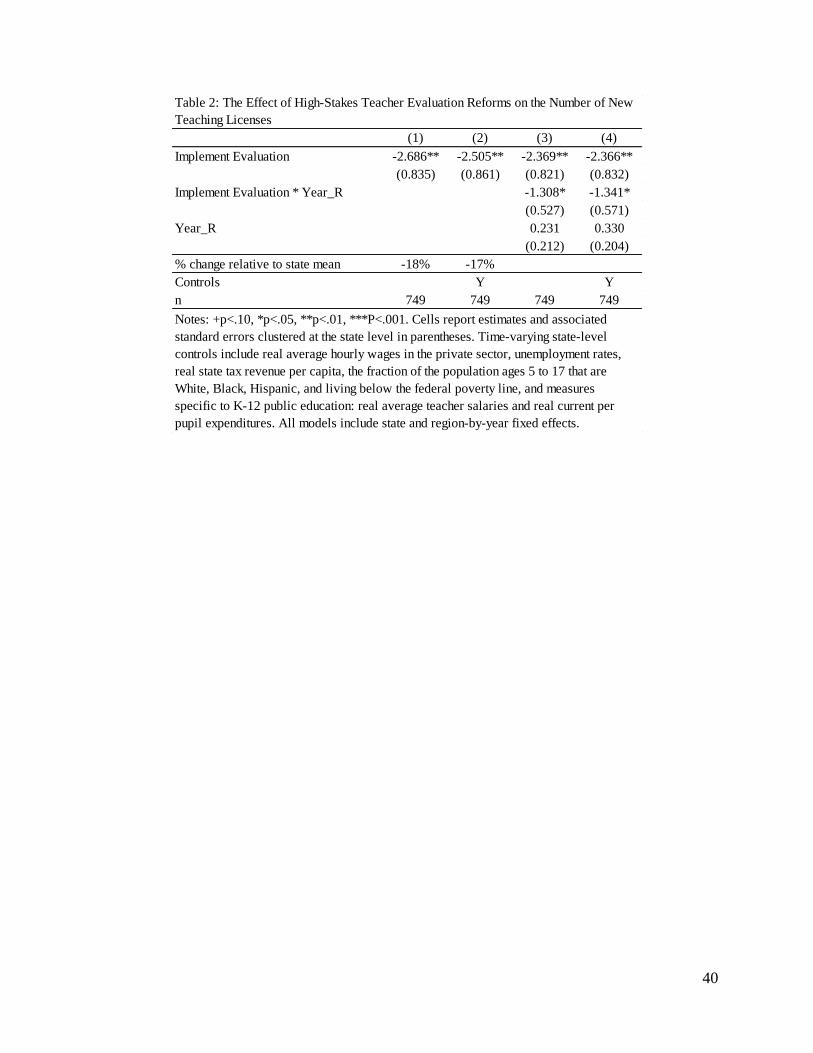
Results from our standard DD model given by (7) confirm the effect of high-stakes
evaluation reforms In Table 2 we estimate that high-stakes evaluation reforms reduced licenses
granted in a state by 251 per 10000 18-to-65 year olds on average in our specification that
includes controls This represents a 17 percent reduction in the average number of licenses
granted in the post-policy reform years among treated states relative to the average number
21
licenses granted by states across the years in our panel Estimates based on our parametric DD
specification that includes linear trends (equation (8)) also confirm the patterns suggested by our
event study analyses In column 4 of Table 2 we find a negative initial shock to new teacher
supply as well as a significant downward linear trend in supply among treated states in the post-
policy reform years of -134 licenses per 10000 Consistent with the visual evidence in the event
study we also fail to reject the null hypothesis of no differential pre-reform trends for states that
adopted evaluation reforms the coefficient on the pre-period trend variable (Year_R) is both
small in magnitude (033) and statistically insignificant For both our standard and linear DD
models comparing results between our baseline and preferred specifications illustrates that
adding our set of time-varying controls has little effect on the estimates
We next explore potential heterogeneity in the effects of evaluation reform on new
teacher labor supply One possible source of heterogeneity is differences in the strength of state
teacher unions who strongly opposed changes to the evaluation system In states with strong
unions lobbying could have led to more modest changes to teacher evaluation systems Other
potential sources of heterogeneity include differences in the degree of difficulty for dismissing
ineffective teachers prior to reforms and differences in the use of test-based evaluation measures
as part of the new teacher evaluation systems To examine these possibilities we extend the
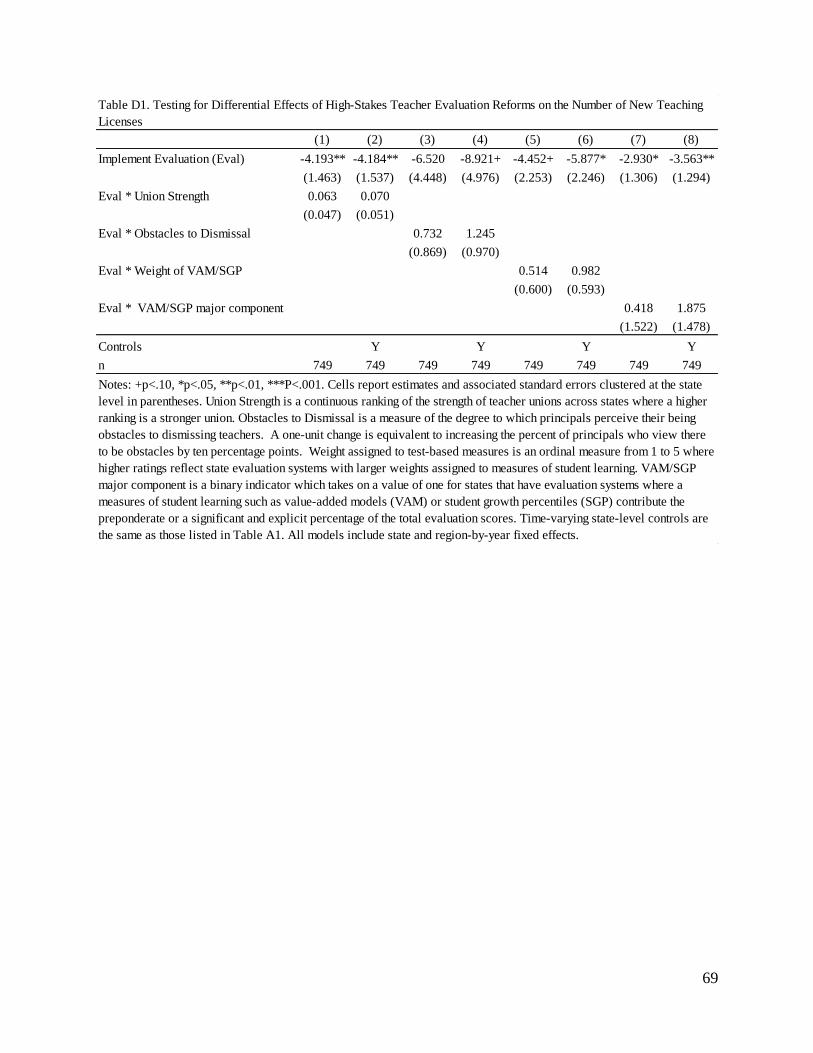
results reported in Table 2 by testing for potential moderation effects by union strength obstacles
to dismissing ineffective teachers and the degree to which evaluation reforms incorporate test-
based evaluation measures We describe the specific measures we use in Appendix D and report
our result in Appendix Table D1 Across all models we find no evidence of moderation effects
The estimated coefficients on the additional interaction terms are small in magnitude and
insignificant across all specifications These findings suggest that differences in union strength
22
pre-reform conditions and the use of test-based performance measures do not appear to be
driving our results
C Effect of Eliminating Tenure on New Teacher Labor Supply
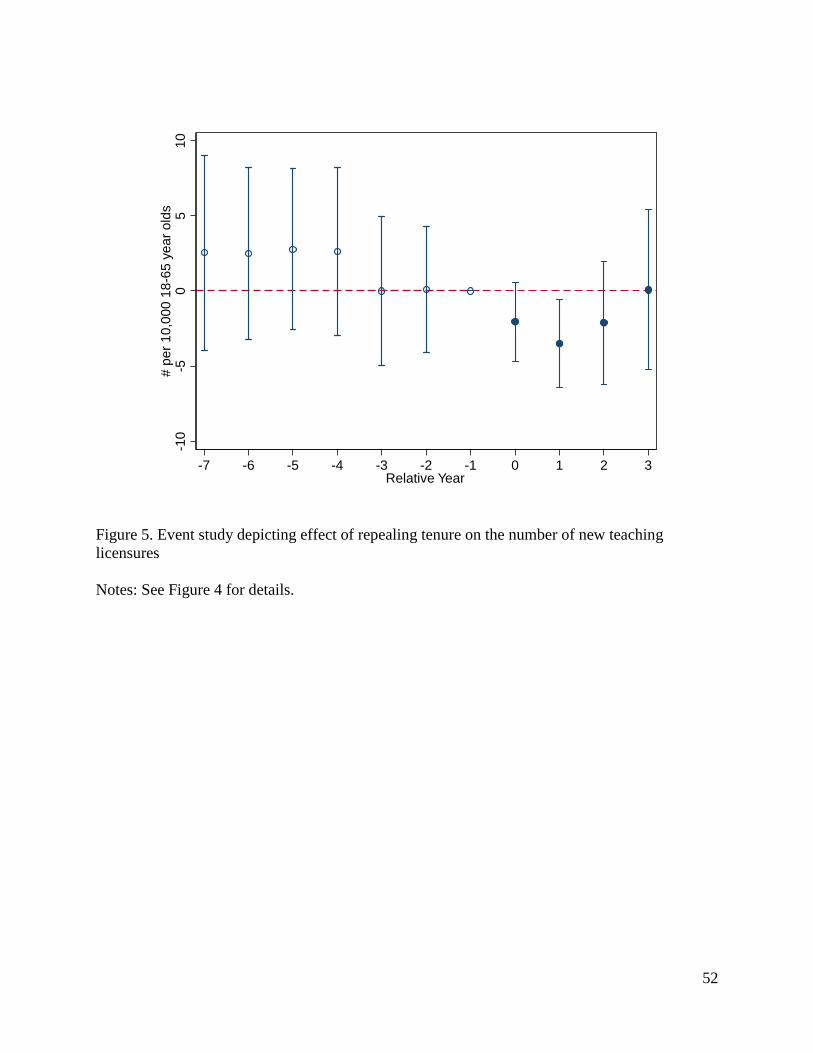
Figure 5 presents estimates of the effect of restricting or eliminating teacher tenure on the
number of teaching licenses awarded using the fully-flexible event-study estimates reported in
column 4 of Appendix Table A1 In contrast to our estimates for high-stakes evaluation reforms
these estimates can be interpreted as capturing the Average Treatment Effect (ATE) of repealing
tenure We again see that the number of teacher licenses granted remains largely unchanged in
pre-period years among the states that adopted tenure reforms In the post-period the point
estimates are uniformly negative but statistically significant only in year 2 providing suggestive
evidence of both the validity of our difference-in-differences design and the negative effect of
tenure reforms on the number of licenses granted
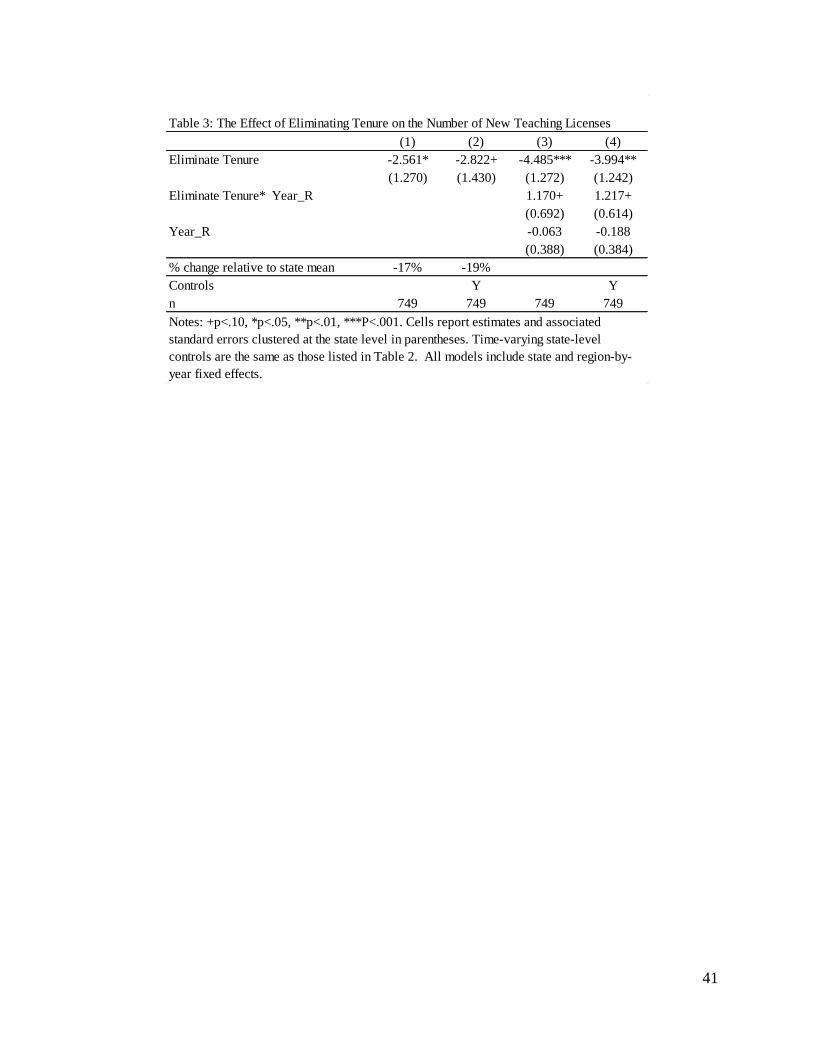
Table 3 presents estimates of the effect of eliminating tenure based on our parametric DD
specifications given by equations (7) and (8) We estimate that repealing tenure caused a
decrease of 282 licensures per 10000 18-to-65 year olds using our standard DD specification
including controls Allowing for linear trends pre- and post-reform among treated states
reinforces these findings Results from this linear DD specification suggest the impact of tenure
reforms was more immediate than the effect of high-stakes evaluation reforms but diminished
over time Importantly we once again fail to reject the null hypothesis of a pre-reform trend that
was unique to states that adopted tenure reforms The coefficient on Year_R is near zero (-019)
and statistically insignificant Comparing estimates across models with and without controls
again demonstrates the robustness of our findings
23
Given the small number of treated states we further examine the degree to which any one
state is driving our results by individually omitting each of the six states and re-estimating our
primary DD models Appendix Table A2 presents estimates across these six subsamples The
estimates are relatively stable suggesting that our results are not the product of a single outlier
Removing Florida from the sample results in the largest estimated treatment effect of tenure
reforms from our standard DD models at -406 while removing North Carolina results in the
smallest -177 which is no longer statistically significant Instead effects in the sample without
North Carolina appear in our linear DD models with a large immediate shift downward in
teacher licensures an effect that is offset over time with a positive linear trend Corresponding
linear DD estimates across the leave-one-out samples consistently show a large negative
intercept shift downward Overall these results confirm the negative relationship between tenure
reforms and new teacher labor supply but suggest the specific time dynamic of this effect may
differ across states
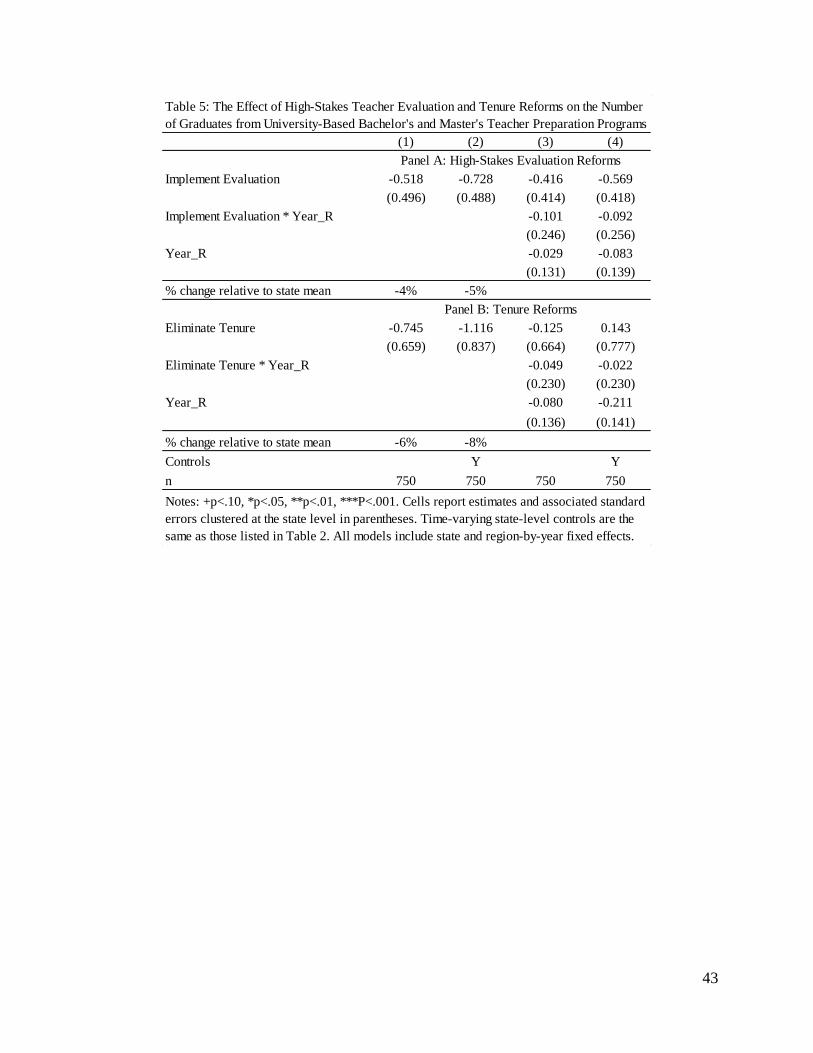
D Simultaneous Treatments
In many instances state legislatures packaged multiple teacher accountability initiatives
into a single bill or legislative session For example in Florida and Idaho legislatures eliminated
teacher tenure in 2011 the same year as the establishment of new high-stakes teacher evaluation
systems Similarly Kansas and Louisiana restricted tenure in the same year that their new high-
stakes teacher evaluation systems were first implemented statewide We examine the degree to
which each of these two reforms are independently responsible for depressing new labor supply
by estimating specifications that simultaneously account for the effect of evaluation and tenure
reforms on teacher labor supply and by restricting the analytic sample to only those states that
did not pass tenure reforms
24
In Table 4 we compare the results from our DD models where indicators for evaluation
and tenure reforms were included separately to estimates where they are modeled
simultaneously Starting with our standard DD estimates we find that the effect of high-stakes
evaluation reforms conditional on tenure reforms remains large and statistically significant Our
point estimate is slightly attenuated from -251 to -225 As a result the implied percent
reduction in the mean number of licenses granted falls from 17 percent in column 1 to 15 percent
in column 3 Point estimates for the effect of tenure conditional on evaluation reforms also fall
from -282 to -234 but are no longer statistically significant Estimates from linear DD model
with evaluation and tenure reforms modeled simultaneously (column 7) confirm the dynamic and
independent effects of both reforms The effect of evaluation is both a moderate initial
downward shift followed by a continued downward linear trend while the effect of tenure is
concentrated in an immediate downward shift in new labor supply All of these associated terms
are significant in the joint model
Evaluation and tenure reforms were not however the only education policy reforms
pursued by states during this time period Other important reforms included restricting or
Notes +plt10 plt05 plt01 Plt001 Cells report estimates and associated standard errors clustered at the state level in parentheses Time-varying state-level controls are the same as those listed in
Table 2 All models include state and region-by-year fixed effects
Panel A High-Stakes Evaluation Reforms
Panel B Tenure Reforms
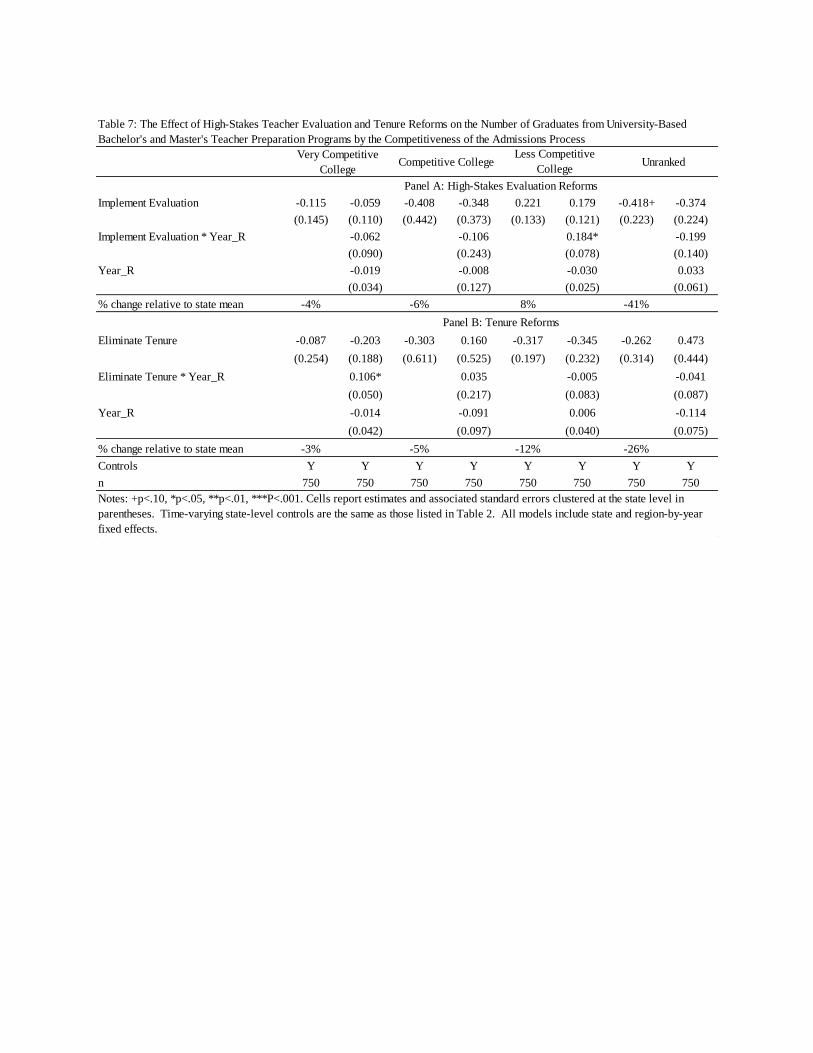
Table 6 The Effect of High-Stakes Teacher Evaluation and Tenure Reforms on the Number of Graduates from University-Based Bachelors and Masters Teacher Preparation Programs by Subject Area
Elementary English Math ScienceSocial Studies Special Education
Combined Shortage
Areas
Non-Shortage Licensure Areas Shortage Licensure Areas
Table 9 The Effect of High-Stakes Teacher Evaluation and Tenure Reforms on the Number of Graduates from University-Based Bachelors and Masters Teacher Preparation
Programs by the Competitiveness of the Admissions Process
Notes +plt10 plt05 plt01 Plt001 Cells report estimates and associated standard errors clustered at the state level in parentheses Time-varying state-level controls are
the same as those listed in Table 2 All models include state and region-by-year fixed effects
Female Male Asian Black Hispanic White
Figures
Figure 1 The timing of statewide full implementation of new high-stakes teacher evaluation
systems
Notes Years represent the fall academic year in which the new systems were first fully
implemented statewide
201620152014201320122011No Reforms
Source National Council on Teacher Quality
49
Figure 2 The timing of state legislative repeal or effective elimination of teacher tenure for new
teachers
Notes Years represent the calendar year in which a law was passed
Passed Not Enacted
201420122011
2000No Repeal Enacted
Source Authors research Reinstated in 2003
50
Figure 3 National Trends in the Teacher Labor Market
Notes Data on the number of teaching licenses issued come from Title II data provided by states
to the US DOE A reporting year for Title II is from September 1st to August 31st for the latter
year Data on the number of traditional teacher preparation program graduates at post-secondary
institutions is from the IPEDS Survey administered by NCES IPEDS reports graduates in a 12
month period up to the spring and summer of the given year Data on total K-12 public school
charter school and private school teachers are based on total full-time equivalent (FTE) teaching
positions from the NCES common core state-level files using spring academic year Public and
charter school FTE is a lower bound estimate as charter school FTE data are missing in 6 percent
of state-year cells All data are scaled by their 2002 values such that trends represent the percent
change in a given measure relative to 2002 levels The baseline 2002 values are 277696 for
licenses 211764 for teacher preparation program graduates 2994575 for public school
teachers 22785 for charter school teachers and 387495 for private school teachers
-20
-10
010
20
Pe
rce
nt ch
an
ge
re
lative
to
20
02
2002 2004 2006 2008 2010 2012 2014 2016Year
New Teaching Licenses Public amp Charter Sch FTE
Teacher Prep Grads Private Sch FTE
51
Figure 4 Event study depicting effect of evaluation reforms on the number of new teaching
licensures
Notes Point estimates for years pre- (hollow dot) and post-reform (solid dot) and corresponding
95 percent confident intervals are derived from an event study model that includes time-varying
state-level controls real average hourly wages in the private sector unemployment rates real
state tax revenue per capita the fraction of the population ages 5 to 17 that are White Black
Hispanic and living below the federal poverty line and measures specific to K-12 public
education real average teacher salaries and real current per pupil expenditures and region-by-
year fixed effects Estimates depicted in this figure are reported in Appendix Table A5
-10
-50
5
pe
r 1
00
00
18
-65
ye
ar
old
s
-7 -6 -5 -4 -3 -2 -1 0 1 2 3Relative Year
52
Figure 5 Event study depicting effect of repealing tenure on the number of new teaching
licensures
Notes See Figure 4 for details
-10
-50
510
p
er
10
00
0 1
8-6
5 y
ea
r o
lds
-7 -6 -5 -4 -3 -2 -1 0 1 2 3Relative Year
53
Figure 6 National trends in the number of university-based degree completers by subject area
Notes Data on the number of traditional teacher preparation program graduates at post-
secondary institutions that receive financial aid is from the IPEDS Survey administered by
NCES All data are scaled by their 2002 values such that trends represent the percent change in a
given measure relative to 2002 levels
-50
050
100
Pe
rce
nt ch
an
ge
re
lative
to
20
02
2002 2004 2006 2008 2010 2012 2014 2016year
Elementary English
Math Science
Social Studies Special Education
54
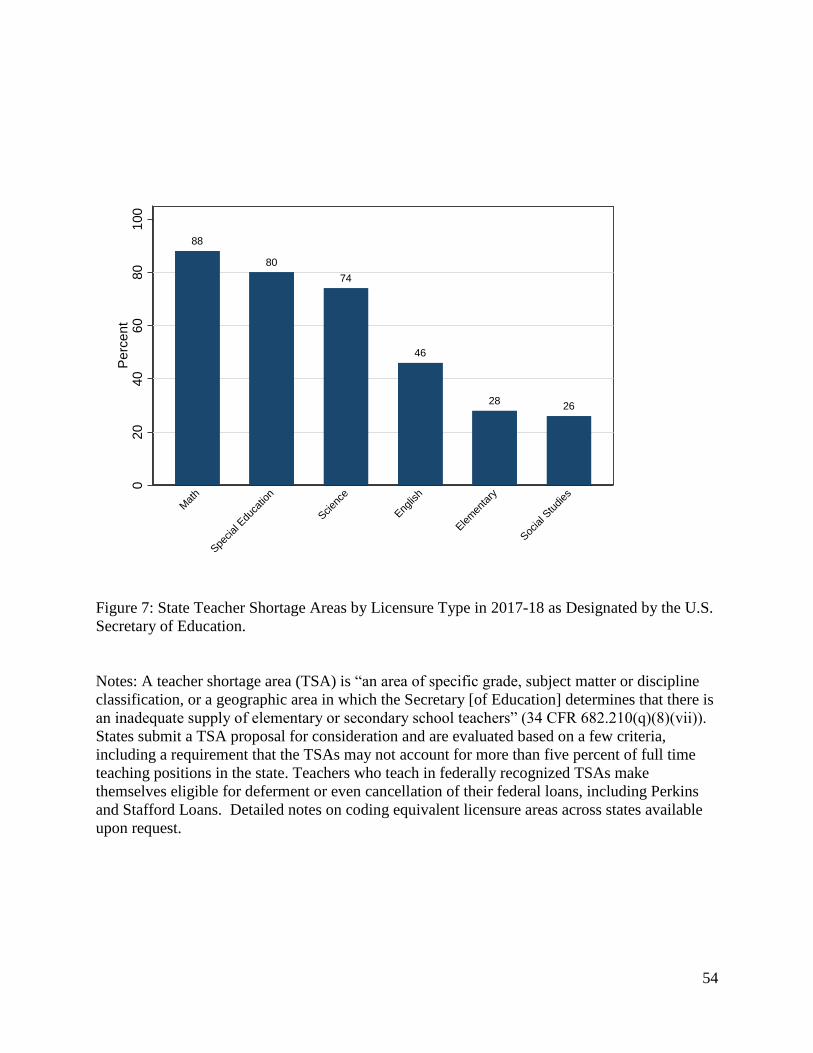
Figure 7 State Teacher Shortage Areas by Licensure Type in 2017-18 as Designated by the US
Secretary of Education
Notes A teacher shortage area (TSA) is ldquoan area of specific grade subject matter or discipline
classification or a geographic area in which the Secretary [of Education] determines that there is
an inadequate supply of elementary or secondary school teachersrdquo (34 CFR 682210(q)(8)(vii))
States submit a TSA proposal for consideration and are evaluated based on a few criteria
including a requirement that the TSAs may not account for more than five percent of full time
teaching positions in the state Teachers who teach in federally recognized TSAs make
themselves eligible for deferment or even cancellation of their federal loans including Perkins
and Stafford Loans Detailed notes on coding equivalent licensure areas across states available
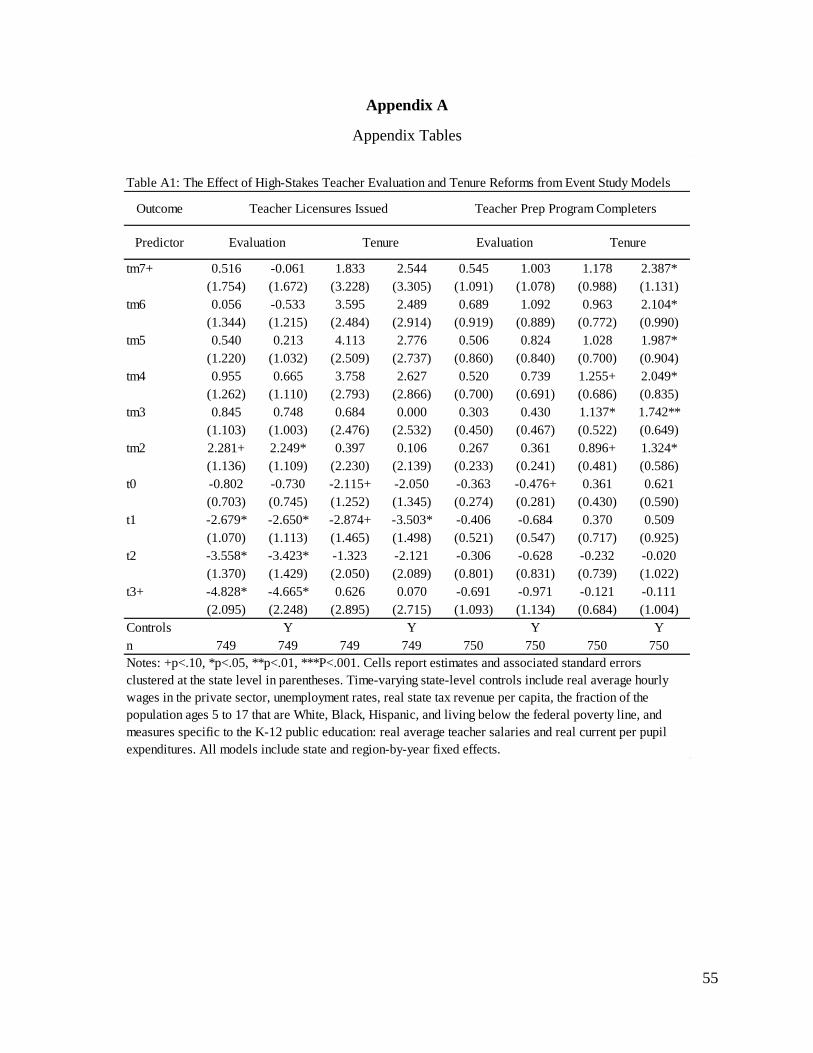
Table A2 The Effect of Eliminating Tenure on the Number of New Teaching Licenses in Models that Drop One State
Notes +plt10 plt05 plt01 Plt001 Cells report estimates and associated standard errors clustered at the state level in parentheses Time-varying state-level controls
are the same as those listed in Table A1 All models include state and region-by-year fixed effects
Without
Kansas
Without
Louisiana Without North CarolinaWithout Florida
Without
Georgia
Without
Idaho
Full Restricted Full Restricted
Implement Evaluation -2505 -2039 -2366 -1819+
(0861) (0958) (0832) (0935)
Implement Evaluation Year_R -1341 -1378
(0571) (0536)
Year_R 0330 0329
(0204) (0216)
change relative to state mean -17 -14
n 749 659 749 659
Controls Y Y Y Y
Notes +plt10 plt05 plt01 Plt001 Cells report estimates and associated standard
errors clustered at the state level in parentheses Time-varying state-level controls are the same
as those listed in Table A1 All models include state and region-by-year fixed effects
Table A3 The Effect of High-Stakes Teacher Evaluation Reforms on the Number of New
Teaching Licenses in a Restricted Estimation Sample that Excludes States that Repealed Tenure
58
Implement Evaluation 0011 0001 -0091 -0076
(0108) (0109) (0099) (0104)
Implement Evaluation Year_R 0057 0053
(0079) (0095)
Year_R 0069 0062
(0093) (0058)
change relative to state mean 0 0
Eliminate Tenure 0155 0159 0012 0041
(0101) (0245) (0080) (0153)
Eliminate Tenure Year_R 0038 0071
(0048) (0078)
Year_R 0015 0003
(0032) (0061)
change relative to state mean 6 6
Controls Y Y
n 550 550 550 550
Panel A High-Stakes Evaluation Reforms
Panel B Tenure Reforms
Notes +plt10 plt05 plt01 Plt001 Cells report estimates and associated
standard errors clustered at the state level in parentheses Time-varying state-level
controls are the same as those listed in Table A1 All models include state and
region-by-year fixed effects
Table A4 Falsification Tests with Certified Public Accountant Exam Takers
59
Implement Evaluation (Eval) -4418 -3179
(1543) (1570)
Eval Bordering Comparison States 1465
(1352)
Eliminate Tenure -2822+ -3069
(1430) (1313)
Tenure Bordering Comparison States -0375
(0911)
change relative to state mean -30 -21 -19 -21
Controls Y Y Y Y
n 550 550 749 749
Notes +plt10 plt05 plt01 Plt001 Cells report estimates and associated standard
errors clustered at the state level in parentheses Time-varying state-level controls are the
same as those listed in Table A1 All models include state and region-by-year fixed effects
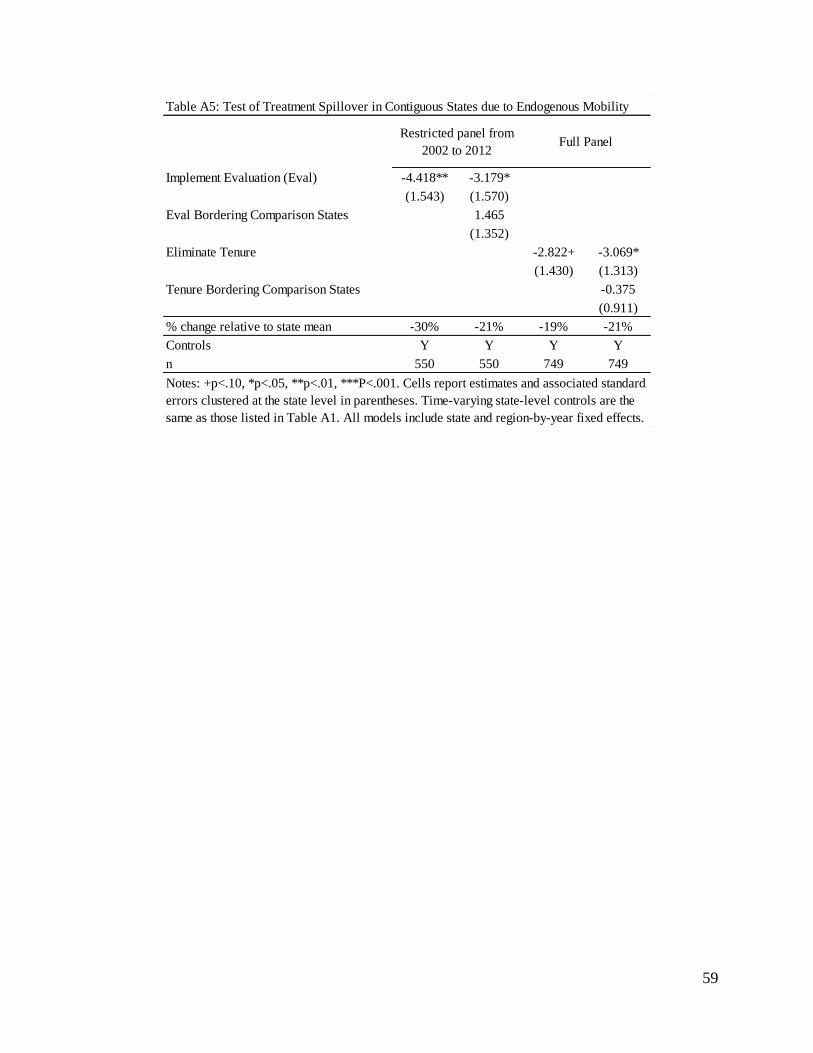
Table A5 Test of Treatment Spillover in Contiguous States due to Endogenous Mobility
Table A6 Alternative Specifications for the Effect of High-Stakes Teacher Evaluation and Tenure Reforms on the Number of New
Teaching Licenses
Panel A High-Stakes Evaluation Reforms
Panel B Tenure Reforms
Notes +plt10 plt05 plt01 Plt001 Cells report estimates and associated standard errors clustered at the state level in
parentheses Time-varying state-level controls are the same as those listed in Table A1 All models include state and region-by-year
fixed effects
61
NCES Average Salary ACS Adjusted Average Salary
Implement Evaluation -20539 10059 -44662+ -25428
(55822) (49843) (23271) (18522)
Implement Evaluation Year_R 6194 -27336
(26441) (18756)
Year_R -23924+ -8330
(12756) (9441)
change relative to state mean 0 -1
Eliminate Tenure 7476 -47473 -11848 57804
(79381) (61062) (35105) (36318)
Eliminate Tenure Year_R 62547+ 9134
(35412) (21228)
Year_R -10162 -16588
(22449) (13067)
change relative to state mean 0 0
Controls Y Y Y Y
n 750 750 600 600
Panel A High-Stakes Evaluation Reforms
Panel B Tenure Reforms
Notes +plt10 plt05 plt01 Plt001 Cells report estimates and associated standard errors
clustered at the state level in parentheses Time-varying state-level controls are the same as those listed in
Table A1 All models include state and region-by-year fixed effects
Table A7 The Effect of High-Stakes Teacher Evaluation and Tenure Reforms on Public Teacher Salaries
Appendix B
Table B1 State Legislation and Court Cases Restricting or Repealing Teacher Tenure 2002-2016
State Summary of Changes Bill(s) Case Date Passed
Filed
Date
Effective for
Tenure
Elimination
Went
into
Effect
Date Overturned How was it
Overturned
Florida
Governor Scott signed two
important tenure-related laws SB
736 required annual contracts for
new teachers for the duration of
their careers and salaries based on
evaluations HB 7087 prevented
any teacher who did not already
have tenure from receiving it
Senate Bill 736
and House Bill
7087
SB 736 March
24 2011 HB
7087 May 5
2011
July 1 2011 Yes NA NA
Georgia
Governor Barnes signed and
supported reform through House
Bill 1187 (in which the
opportunity to obtain tenure was
eliminated for teachers hired after
July 1 2000) After little
improvement Governor Barnes
was ousted and replaced with
Governor Purdue who promptly
repealed the law
House Bill
1187 (A+
Education
Reform Act of
2000)
April 25 2000 July 1 2000 Yes June 4 2003 Legislative Repeal in
Senate Bill 193
63
Idaho
SB 1108 1110 and 1194 or the
Luna Laws eliminated tenure
for new teachers reworked teacher
pay around performance and
required supplying computers to
every high school student
Opposition to these laws was swift
after the laws went into effect
voters repealed the laws by a
margin of over 50
Senate Bills
1108 1110
1194
March 1 2011 July 1 2011 Yes November 6
2012 Propositions 1 2 amp 3
Kansas
In 2014 Governor Brownback
signed HB 2506 redefining the
word teacher so that due process
procedures for public employees
did not apply Individual districts
differ on the implementation of
HB 2506
House Bill
2506 July 1 2014 July 1 2014 Yes NA NA
Louisiana
Act 1 passed in April 2012
increased the requirements for
teacher tenure To receive tenure
teachers must receive a highly-
effective Compass rating five out
of six consecutive years an
exceedingly difficult task Tenure
is immediately revoked if a teacher
ever receives an ineffective rating
House Bill 974
(Act 1) April 18 2012 July 1 2012 Yes NA
NA (Upheld by
Louisiana Supreme
Court in Oct 2014)
64
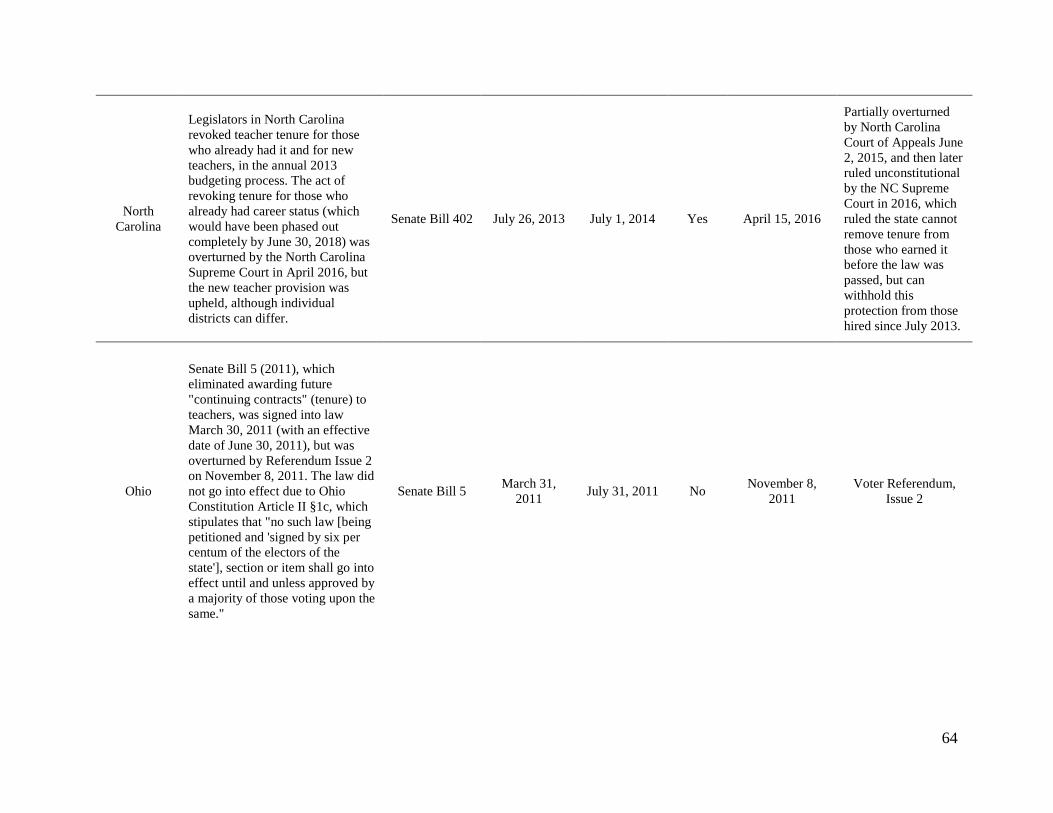
North
Carolina
Legislators in North Carolina
revoked teacher tenure for those
who already had it and for new
teachers in the annual 2013
budgeting process The act of
revoking tenure for those who
already had career status (which
would have been phased out
completely by June 30 2018) was
overturned by the North Carolina
Supreme Court in April 2016 but
the new teacher provision was
upheld although individual
districts can differ
Senate Bill 402 July 26 2013 July 1 2014 Yes April 15 2016
Partially overturned
by North Carolina
Court of Appeals June
2 2015 and then later
ruled unconstitutional
by the NC Supreme
Court in 2016 which
ruled the state cannot
remove tenure from
those who earned it
before the law was
passed but can
withhold this
protection from those
hired since July 2013
Ohio
Senate Bill 5 (2011) which
eliminated awarding future
continuing contracts (tenure) to
teachers was signed into law
March 30 2011 (with an effective
date of June 30 2011) but was
overturned by Referendum Issue 2
on November 8 2011 The law did
not go into effect due to Ohio
Constitution Article II sect1c which
stipulates that no such law [being
petitioned and signed by six per
centum of the electors of the
state] section or item shall go into
effect until and unless approved by
a majority of those voting upon the
same
Senate Bill 5 March 31
2011 July 31 2011 No
November 8
2011
Voter Referendum
Issue 2
65
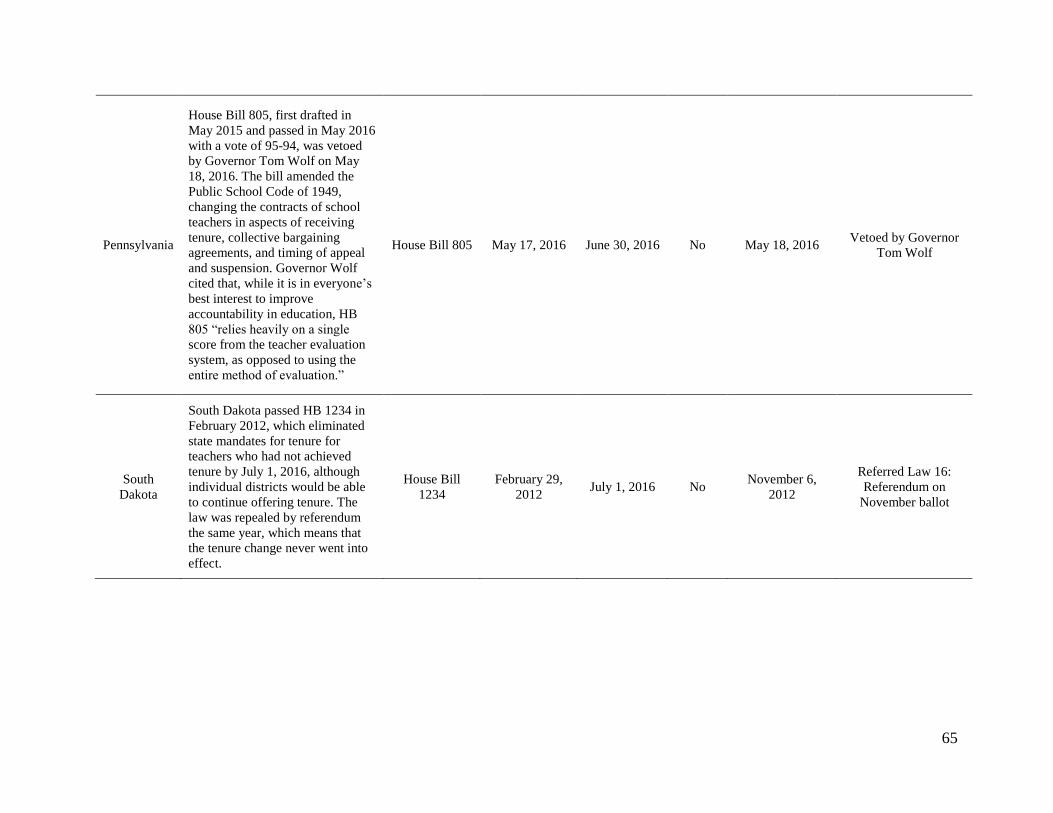
Pennsylvania
House Bill 805 first drafted in
May 2015 and passed in May 2016
with a vote of 95-94 was vetoed
by Governor Tom Wolf on May
18 2016 The bill amended the
Public School Code of 1949
changing the contracts of school
teachers in aspects of receiving
tenure collective bargaining
agreements and timing of appeal
and suspension Governor Wolf
cited that while it is in everyonersquos
best interest to improve
accountability in education HB
805 ldquorelies heavily on a single
score from the teacher evaluation
system as opposed to using the
entire method of evaluationrdquo
House Bill 805 May 17 2016 June 30 2016 No May 18 2016 Vetoed by Governor
Tom Wolf
South
Dakota
South Dakota passed HB 1234 in
February 2012 which eliminated
state mandates for tenure for
teachers who had not achieved
tenure by July 1 2016 although
individual districts would be able
to continue offering tenure The
law was repealed by referendum
the same year which means that
the tenure change never went into
effect
House Bill
1234
February 29
2012 July 1 2016 No
November 6
2012
Referred Law 16
Referendum on
November ballot
Appendix C
Identifying Graduates of Teacher Preparation Programs and by Subject Areas using CIPS
Codes
The Integrated Post-Secondary Education Data System (IPEDS) includes the results of
eleven surveys conducted annually by the US Department of Educationrsquos National Center for
Education Statistics (NCES) All institutions must submit race and ethnicity data if they receive
are applicants for or expect to be applicants for federal financial assistance as defined under the
DOErsquos regulations implementing Title VI of the Civil Rights Act of 1964 Title IX of the
Education Amendments of 1972 and the Carl D Perkins Education Act These surveys thus
capture the substantive universe of post-secondary schools colleges and universities
In this paper we use the entire ldquoCompletionsrdquo survey available for download on the
IPEDS website Each observation in the file corresponds to the completers of a particular
academic program identified by classification of instruction program (CIP) code and the award
level (eg bachelorrsquos degree masterrsquos degree etc) of that particular program for each reporting
institution
The NCES has devised a six-digit taxonomy for organizing academic programs called
CIP codes The first two digits of the code correspond to a broad area of study For instance all
majors under the two-digit CIP category ldquo13rdquo are majors within the education field These
majors include not only education programs designed to prepare individuals to be teachers but
also teaching assistants preparation programs (131501) and programs for education program
evaluators (eg Education Evaluation and Research 130601) among others The next two digits
in the CIP code cluster majors with similar instructional content within the board area of study
All majors with a 1313 CIP code sequence for example are ldquoteacher education or professional
development majors within specific subject areasrdquo within the broad field of education The final
two digits are unique to each specific major that falls within the specific subject area For
example a ldquostructural engineeringrdquo major has a 140803 CIP code (ldquo14rdquo corresponds to
engineering ldquo08rdquo correspond to civil engineering and the final ldquo03rdquo is unique to structural
engineering) NCES adds and removes CIP codes regularly We created consistent categories for
all six-digit codes across the panel using crosswalks supplied by NCES19
Based on conversations with IPEDS-reporting institutions and the IPEDS Help Desk
Staff we identify teacher preparation programs based on the following CIP codes20
Education General 130100-130101
Bilingual Multilingual and Multicultural Education 130201-120299
Curriculum and Instruction 130301
Special Education and Teaching 131000-131099
Teacher Education amp Professional Development Specific Levels and Methods 131200-
131299
Teacher Education amp Professional Development Specific Levels and Methods 131300-
131399
Teaching English or French as a Second or Foreign Language 131401-131499
19 Crosswalks can be found here httpsncesedgovipedscipcodecrosswalkaspxy=55 20 Dan Goldhaber and Roddy Theobald provided valuable guidance here as well
67
Education Other 139999
We restrict the data to include only graduates that earned either a bachelorrsquos or masterrsquos degree
and then sum these university-level counts to the state-by-year level
We identify teacher education program graduates in subject-specific areas using the
where 119904119905 is the proportion of individuals choosing teaching as their occupation
In the empirical work that follows we define 119899119904119905 as the number of 18-to-65 year olds in
state s in year 119905 which serves to scale our count outcomes by a proxy for the relative size of the
11
working-age pool of potential new entrants in the teaching profession in each state5 Defining 119899119904
in terms of the current year provides a consistent approach for scaling our outcomes of interest
and reflects that fact that prospective teachers likely make choices about where to apply for a
teaching license in the same year in which they enter the labor market While an individualrsquos
initial decision to major in education or pursue a graduate degree in education may occur
between one to four years prior to entering the labor market they can still choose to withdraw at
any point in time6
IV Data
We conduct our analyses using an original state-by-year panel that combines measures of
the number of individuals in each state planning to enter the teacher labor force measures of
state-level teacher accountability laws and time-variant state-level control variables from 2002
through 2016 Ideally we would measure new teacher labor supply as the total number of
candidates that applied for K-12 public school teaching positions for the first time Although
such a measure is unavailable at the national level data collected by the US Department of
Education (DOE) on the number of initial teacher licenses granted by states each year serves as
an advantageous proxy States are required to report these data as a condition for receiving
federal funding under Title II of the Higher Education Act7 These licensure count data include
traditional probationary licenses as well as temporary teaching licenses such as emergency and
5 State-specific data on the number of individuals between the ages of 18 and 65 comes from the US Census 6 Our results are consistent if we used lagged measures of state populations aged 18-to-65 given the high
autocorrelation of this measure within states over time 7 While states differ in the types of initial teacher licenses they issue and the requirements for these licenses there
are several elements commonly required to receive a license 1) possess a bachelorrsquos degree (often with a minimum
grade point average) 2) complete a set of required professional courses 3) pass state-specific licensure exams 4)
complete a minimum number of supervised student teaching or clinical hours and 5) pass a criminal background
check Prospective teachers must enroll in a state-approved teacher preparation program (TPP) to meet these
requirements
12
intern teaching credentials This measure is also robust to the rapid expansion of alternative
certification programs and charter schools over the panel Teachers who enter the profession via
alternative pathways such as Teach for America are still required by states to obtain temporary
licensures The vast majority of states also require teachers who work in charter schools to obtain
a state licensure8 Although licensure reciprocity agreements exist between some states
individuals seeking to teach in a new state must still acquire a state-specific initial teaching
license and will be included in our data9
We complement our licensure measure with data on the number of graduates from
university-based teacher preparation programs from the IPEDS survey We restrict our sample to
bachelorrsquos and masterrsquos degree recipients from programs in institutions of higher education
preparing students for classroom teaching10 The advantage of the IPEDS data is that it
disaggregates data across a number of subgroups thus allowing us to test for heterogeneous
effects across subject areas gender and race These data also allow us to test for differential
impacts by institutional selectivity as measured by the Barronrsquos index as well as the 25th and 75th
percentiles of freshman SAT math scores which have been shown to be predictive of teacher
effectiveness (Rockoff Jacob Kane and Staiger 2009 Jacob et al 2016)
These advantages are offset however by several limitations of this measure First
program completers may intend to teach in private schools or work outside of education We
8 Of the 42 states with charter school laws in 2016 28 states (67 percent) required that teachers obtain state licenses
while 11 states (26 percent) required the majority the teachers to be licensed (~ 50 to 75 percent of teachers) Only
three states (Arizona Alabama [which only allowed charters in 2015] and Louisiana) had no licensure requirement
for charter school teachers (Education Commission on the States 2016) 9 Evidence suggests that despite reciprocity agreements costs associated with transferring licensure are quite high
(National Association of State Directors of Teacher Education and Certification ND Barnum 2017 Sindelar
Bishop Gill Connelly and Rosenberg 2007) Thus mobility within a state is much more common than across state
lines (Goldhaber Grout Holden and Brown 2015) 10 See Appendix C for a detailed description of the classification of instructional programming (CIP) codes we used
to identify graduates of teacher preparation programs and subject areas
13
estimate that the percentage of teacher education program completers who actually go on to work
in public education ranges between 46 percent (Social Science and History) and 67 percent
(Special Needs) depending on subject type11 Second program completers may seek to teach in
a state other than the one in which they completed their degree Third this measures does not
include program completers from all institutions of higher education given that only institutions
that receive federal aid are required to report these data Finally any potential effect of teacher
accountability reforms on the choice of major for undergraduate students who constitute almost
half of all teacher preparation program completers is likely to be delayed across several years
Thus we employ IPEDS data to facilitate exploratory analyses that are not possible with license
data while recognizing that they are noisy measures of new teacher labor supply and will likely
understate any effect of state-specific accountability reforms
We draw upon two systematic reviews of teacher evaluation reforms to code the timing
of reform efforts across states (Steinberg and Donaldson 2016 NCTQ 2016) Implement
Evaluation is coded as one in the fall of the academic year in which districts across the state first
fully implemented the redesigned teacher evaluation system Figure 1 displays the timing of full
system implementation across states over time This tractable approach however cannot capture
important differences in system design features States adopted a wide range of weights they
assigned to test-score based measures of teacher performance ranging from 0 to 50 percent
Approximately half of the states also phased in requirements to use test-score based measures
across several years following statewide implementation Some states also delayed the use of
evaluation scores to inform high-stakes personnel decisions until after initial statewide
11 Calculations are based on employment data from the American Community Survey 3-year file from 2011-2013
These data include employment and earnings for individuals aged 25-64 We multiplied the national percentage of
individuals with a given major (eg elementary education) who were employed full time as an elementary or
secondary classroom teacher by the percentage of individuals with that degree who were found to be working at all
14
implementation We conduct several tests examining the effects of these differences across states
and discuss the implications of these staggered implementation patterns in more detail below
We compiled data on teacher tenure reforms from reviews of state statutes case law and
prior literature12 To capture the effect of the elimination of tenure on teacher labor supply we
created an indicator variable Eliminate Tenure which is equal to one in states and years during
which tenure did not exist and zero when tenure existed We focus our coding on the six states in
which tenure reform legislation was not overturned in the same calendar year by referendum or
veto Figure 2 depicts the timing of tenure reforms across states over time
In our preferred models we include a parsimonious set of control variables to capture
pecuniary and non-pecuniary benefits associated with teaching and other occupations namely 1)
real average teacher salaries 2) real current per-pupil expenditures 3) the fraction of the
population age 5-17 living in families at or below the federal poverty line 4) the percentage of
the population age 5-17 that is White Black or Hispanic and 5) real average hourly wages in the
private sector We also include two additional variables designed to capture differences in
economic conditions across states and years that may be correlated with the timing of adoption
of accountability reforms and the demand for teachers namely annual unemployment rates and
real state tax revenue per capita13
12 Sources include the National Council on Teacher Qualityrsquos (NCTQ) State Teacher Policy Yearbooks The
Education Commission of the Statesrsquo State Policy Database Students First State Policy Report Cards and the
Fordham Foundationrsquos (2012) report entitled How Strong are Teachersrsquo Unions A State-by-State Comparison We
resolved discrepancies between these sources using information from statesrsquo department of education websites Race
To The Top federal grant applications Lexis-Nexis searches of state and local newspapers and conversations with
academics and state Department of Education officials 13 Data on average hourly wages in the private sector was constructed using annual data from the CPS Data on state
unemployment rates is from the Bureau of Labor Statistics Data on average teacher salaries and current per-pupil
expenditures comes from the National Center for Education Statistics (NCES) while poverty racial and ethnic data
for the share of the population age 5-17 and state tax revenue data come from the US Census We link school data
to our panel using the spring year of the academic year (eg 2015 for AY 2014-15) Hourly wages teacher salaries
and current per-pupil expenditures are deflated to real 2014 dollars using the consumer price index
15
Table 1 presents the means and standard deviations of outcome variables used in our
analysis Across our 15-year panel the average annual number of licenses granted per state is 15
per 10000 adults age 18-to-65 We discuss the additional outcome variables used in exploratory
analyses below
V Empirical Framework
We estimate the effects of teacher accountability on the decision of individuals to enter
the teacher labor market using a difference-in-differences framework Our identification strategy
compares changes within treated states over time to other non-treated states in the same
geographic regions This approach relies on two key assumptions namely that the timing of
accountability reforms is as good as random and that there are no other concurrent changes in
labor market conditions or teacher policies across treated states but not untreated states
Importantly the differential timing of accountability reforms across treated states allows us to
remove any regional trends in teacher labor supply and demand that might confound our
estimates Teacher accountability reforms were not the only education policy reforms that
occurred during our panel period Some states also adopted related reforms such as reducing the
scope of collective bargaining rights passing right-to-work laws changing the length of
probationary period increasing teachersrsquo contributions to pension plans introducing new teacher
licensure exams adopting common core standards and administering new common-core aligned
tests However none of these reforms were implemented consistently in the same states and at
the same time as teacher accountability reforms In robustness tests presented below we find that
our results are largely unchanged when controlling for these additional policy reforms
16
We begin with a non-parametric event-study specification This allows us to model any
anticipatory effects of the policy in a fully flexible way as well as non-linear changes in the
post-period
119884119904119905 = sum 120582119868120591(119910119890119886119903119905 minus 1205910)3120591=minus7 + Γ119883119904119905 + 120587119904 + 120574119892119905 + 120598119904119905 (6)
where 119884119904119905 is an outcome of interest for state s in year t 120587119904 and 120574119892119905 are state and region-by-year
fixed effects respectively that account for fixed differences in the public teacher labor markets
across states and regional labor market shocks across time and 120598119904119905 is a random disturbance term
Our primary outcomes of interest 119884119904119905 are ratios of the number of new teaching licenses or
teacher preparation program completers per every 10000 individuals aged 18-to-65 in a given
state and year Because equation (6) is a grouped linear probability model that is motivated by
equation (5) from our conceptual framework the variance of the random disturbance term is
proportional to the denominator of our outcome namely the number of individuals aged 18-to-
65 To improve precision we weight all models by this denominator We test the sensitivity of
our findings to alternative weights and functional forms below and find that our results are
consistent across model specifications
The key variables of interest in (6) are the set of indicators for the years pre- and post-
policy reform The term (119910119890119886119903119905 minus 1205910) is a re-centered linear time trend for states that adopted the
focal policy reform in time 1205910 while 119868120591 is an indicator variable that equals 1 in year 120591 and 0
otherwise Thus 119910119890119886119903119905 minus 1205910 takes on a value of -1 in the year prior to the policy reform and 0 in
the first year of the reform We model relative time as a set of binary indicators for the years
prior to a policy change (-7 or more to -1) as well as post-policy change (0 to 3 or more) to
17
capture year-specific effects on the outcome of interest14 We show results from specifications
without controls as well as specifications that include the parsimonious set of covariates 119883119904119905
described above It is possible that teacher accountability reforms both directly and indirectly
affected covariates such as per-pupil expenditures teacher salaries and the composition of the
student population Adding these controls may serve to attenuate our estimates to the extent that
any effects on teacher labor supply are mediated through changes to these contexts and benefits
of the teaching profession We include them in our full models as a conservative approach to
account for changes in teaching contexts and benefits that were the result of other education
policy reforms that may have occurred around the same time as the implementation of teacher
accountability reforms
We next adopt a standard difference-in-differences (DD) model to pool estimates across
years post-reform and increase the precision of our estimates as follows
where 119879119903119890119886119905119904119905 lowast (119910119890119886119903119905 minus 1205910) is the interaction between our relative time trend and the treatment
indicator 120592119904119905 is a random disturbance term and all other variables are as defined in (7) The
interaction term in (8) allows for the relative time trends among treated states to differ pre- and
post-reform The coefficient on the main effect of treatment 1205751 captures the immediate response
of new teacher labor supply in the first year of the policy change while the coefficient associated
with 119879119903119890119886119905119904119905 lowast (119910119890119886119903119905 minus 1205910) 1205752 captures any deviation from the linear trend in labor supply in
the post-reform period among treated states The coefficient associated with the relative year
term (119910119890119886119903119905 minus 1205910) 1205753 tests for any differential linear trends in the pre-reform period among
states that adopted teacher accountability reforms relative to those that did not This serves as a
direct test for differential trends in the pre-period We estimate both standard errors clustered at
the state level as well as wild clustered bootstrap confidence intervals following Cameron
Gelbach and Miller (2008) to account for the small number of treatment clusters for tenure
reforms In tables we report standard errors based on the more traditional clustering at the state
level as this approach produces more conservative estimates in our data
19
VI Results
A Descriptive Trends in Teacher Labor Supply
National trends in the supply of potential job candidates for public teaching positions
have changed substantially over the past fifteen years Figure 3 plots trends in new teacher labor
supply as measured by licenses and degree completers juxtaposed with the number of full-time
equivalent teachers (FTE) employed in publicly-funded schools (traditional and charter) and
private schools For licenses relative supply increased from 2002 to 2007 and then declined
sharply during the Great Recession The number of degree completers follows a very similar
pattern with a three- to four-year lag likely reflecting that over half of all degree completers are
in 4-year bachelorrsquos degree programs Relative to pre-recession levels in 2007 new teacher labor
supply has declined by 234 percent as measured by licensures and 202 percent as measured by
teacher preparation program graduates At the same time the size of the teacher labor market in
publicly-funded schools has increased since 2002 reaching a high in 2009 falling by
approximately 35 percentage points the following year largely due to layoffs and incentivized
early retirements under the Great Recession (Kraft 2015) and then steadily expanding through
2016 The charter sector alone has grown by over 500 percent since 2002 but remains at only 45
percent of the FTE teachers employed in publicly-funded schools
The failure of new teacher labor supply to recover even partially to pre-recession levels
stands in contrast to the steady rise in the teacher workforce in publicly-funded schools
Although a true measure of national demand for licensed teachers does not exist recent increases
in total FTE across traditional and charter schools suggest decreased demand is unlikely to be a
primary explanation for the sustained contraction The lack of recovery also cannot be accounted
20
for by an expansion of the private sector where state licenses or even formal teacher training are
not required Steep declines in the size of the private school teacher workforce over 15 percent
since 2010 suggest decreasing demand for new teachers We examine the degree to which
teacher accountability reforms enacted by states almost entirely during the post-Recession period
have played a role in the sustained contraction of the new teacher labor market
B Effect of High-Stakes Teacher Evaluation on New Teacher Labor Supply
We begin with estimates from our fully-flexible event-study model with covariates
shown in Figure 4 and reported in column 2 of Appendix Table A1 Estimates should be
interpreted as Intent-to-Treat (ITT) estimates of the effect of high-stakes reforms given the wide
variability in implementation across and within states (Kraft and Gilmour 2017) These ITT
estimates serve to answer the relevant question from a policymakerrsquos perspectivemdashwhat is the
effect of passing and implementing a state-wide high-stakes evaluation reform The parameter
estimates with associated 95 percent confidence intervals for the years pre- (hollow dot) and
post-reform (solid dot) are strongly suggestive of a negative effect of evaluation reforms on new
teacher labor supply The number of teacher licenses granted remains largely unchanged in pre-
period years and then declines steadily starting the year in which high-stakes evaluation reforms
are implemented statewide These individual point estimates become statistically significant in
the second year and suggest that the effects of the reform increase in post-reform years
Results from our standard DD model given by (7) confirm the effect of high-stakes
evaluation reforms In Table 2 we estimate that high-stakes evaluation reforms reduced licenses
granted in a state by 251 per 10000 18-to-65 year olds on average in our specification that
includes controls This represents a 17 percent reduction in the average number of licenses
granted in the post-policy reform years among treated states relative to the average number
21
licenses granted by states across the years in our panel Estimates based on our parametric DD
specification that includes linear trends (equation (8)) also confirm the patterns suggested by our
event study analyses In column 4 of Table 2 we find a negative initial shock to new teacher
supply as well as a significant downward linear trend in supply among treated states in the post-
policy reform years of -134 licenses per 10000 Consistent with the visual evidence in the event
study we also fail to reject the null hypothesis of no differential pre-reform trends for states that
adopted evaluation reforms the coefficient on the pre-period trend variable (Year_R) is both
small in magnitude (033) and statistically insignificant For both our standard and linear DD
models comparing results between our baseline and preferred specifications illustrates that
adding our set of time-varying controls has little effect on the estimates
We next explore potential heterogeneity in the effects of evaluation reform on new
teacher labor supply One possible source of heterogeneity is differences in the strength of state
teacher unions who strongly opposed changes to the evaluation system In states with strong
unions lobbying could have led to more modest changes to teacher evaluation systems Other
potential sources of heterogeneity include differences in the degree of difficulty for dismissing
ineffective teachers prior to reforms and differences in the use of test-based evaluation measures
as part of the new teacher evaluation systems To examine these possibilities we extend the
results reported in Table 2 by testing for potential moderation effects by union strength obstacles
to dismissing ineffective teachers and the degree to which evaluation reforms incorporate test-
based evaluation measures We describe the specific measures we use in Appendix D and report
our result in Appendix Table D1 Across all models we find no evidence of moderation effects
The estimated coefficients on the additional interaction terms are small in magnitude and
insignificant across all specifications These findings suggest that differences in union strength
22
pre-reform conditions and the use of test-based performance measures do not appear to be
driving our results
C Effect of Eliminating Tenure on New Teacher Labor Supply
Figure 5 presents estimates of the effect of restricting or eliminating teacher tenure on the
number of teaching licenses awarded using the fully-flexible event-study estimates reported in
column 4 of Appendix Table A1 In contrast to our estimates for high-stakes evaluation reforms
these estimates can be interpreted as capturing the Average Treatment Effect (ATE) of repealing
tenure We again see that the number of teacher licenses granted remains largely unchanged in
pre-period years among the states that adopted tenure reforms In the post-period the point
estimates are uniformly negative but statistically significant only in year 2 providing suggestive
evidence of both the validity of our difference-in-differences design and the negative effect of
tenure reforms on the number of licenses granted
Table 3 presents estimates of the effect of eliminating tenure based on our parametric DD
specifications given by equations (7) and (8) We estimate that repealing tenure caused a
decrease of 282 licensures per 10000 18-to-65 year olds using our standard DD specification
including controls Allowing for linear trends pre- and post-reform among treated states
reinforces these findings Results from this linear DD specification suggest the impact of tenure
reforms was more immediate than the effect of high-stakes evaluation reforms but diminished
over time Importantly we once again fail to reject the null hypothesis of a pre-reform trend that
was unique to states that adopted tenure reforms The coefficient on Year_R is near zero (-019)
and statistically insignificant Comparing estimates across models with and without controls
again demonstrates the robustness of our findings
23
Given the small number of treated states we further examine the degree to which any one
state is driving our results by individually omitting each of the six states and re-estimating our
primary DD models Appendix Table A2 presents estimates across these six subsamples The
estimates are relatively stable suggesting that our results are not the product of a single outlier
Removing Florida from the sample results in the largest estimated treatment effect of tenure
reforms from our standard DD models at -406 while removing North Carolina results in the
smallest -177 which is no longer statistically significant Instead effects in the sample without
North Carolina appear in our linear DD models with a large immediate shift downward in
teacher licensures an effect that is offset over time with a positive linear trend Corresponding
linear DD estimates across the leave-one-out samples consistently show a large negative
intercept shift downward Overall these results confirm the negative relationship between tenure
reforms and new teacher labor supply but suggest the specific time dynamic of this effect may
differ across states
D Simultaneous Treatments
In many instances state legislatures packaged multiple teacher accountability initiatives
into a single bill or legislative session For example in Florida and Idaho legislatures eliminated
teacher tenure in 2011 the same year as the establishment of new high-stakes teacher evaluation
systems Similarly Kansas and Louisiana restricted tenure in the same year that their new high-
stakes teacher evaluation systems were first implemented statewide We examine the degree to
which each of these two reforms are independently responsible for depressing new labor supply
by estimating specifications that simultaneously account for the effect of evaluation and tenure
reforms on teacher labor supply and by restricting the analytic sample to only those states that
did not pass tenure reforms
24
In Table 4 we compare the results from our DD models where indicators for evaluation
and tenure reforms were included separately to estimates where they are modeled
simultaneously Starting with our standard DD estimates we find that the effect of high-stakes
evaluation reforms conditional on tenure reforms remains large and statistically significant Our
point estimate is slightly attenuated from -251 to -225 As a result the implied percent
reduction in the mean number of licenses granted falls from 17 percent in column 1 to 15 percent
in column 3 Point estimates for the effect of tenure conditional on evaluation reforms also fall
from -282 to -234 but are no longer statistically significant Estimates from linear DD model
with evaluation and tenure reforms modeled simultaneously (column 7) confirm the dynamic and
independent effects of both reforms The effect of evaluation is both a moderate initial
downward shift followed by a continued downward linear trend while the effect of tenure is
concentrated in an immediate downward shift in new labor supply All of these associated terms
are significant in the joint model
Evaluation and tenure reforms were not however the only education policy reforms
pursued by states during this time period Other important reforms included restricting or
Notes +plt10 plt05 plt01 Plt001 Cells report estimates and associated standard errors clustered at the state level in parentheses Time-varying state-level controls are the same as those listed in
Table 2 All models include state and region-by-year fixed effects
Panel A High-Stakes Evaluation Reforms
Panel B Tenure Reforms
Table 6 The Effect of High-Stakes Teacher Evaluation and Tenure Reforms on the Number of Graduates from University-Based Bachelors and Masters Teacher Preparation Programs by Subject Area
Elementary English Math ScienceSocial Studies Special Education
Combined Shortage
Areas
Non-Shortage Licensure Areas Shortage Licensure Areas
Table 9 The Effect of High-Stakes Teacher Evaluation and Tenure Reforms on the Number of Graduates from University-Based Bachelors and Masters Teacher Preparation
Programs by the Competitiveness of the Admissions Process
Notes +plt10 plt05 plt01 Plt001 Cells report estimates and associated standard errors clustered at the state level in parentheses Time-varying state-level controls are
the same as those listed in Table 2 All models include state and region-by-year fixed effects
Female Male Asian Black Hispanic White
Figures
Figure 1 The timing of statewide full implementation of new high-stakes teacher evaluation
systems
Notes Years represent the fall academic year in which the new systems were first fully
implemented statewide
201620152014201320122011No Reforms
Source National Council on Teacher Quality
49
Figure 2 The timing of state legislative repeal or effective elimination of teacher tenure for new
teachers
Notes Years represent the calendar year in which a law was passed
Passed Not Enacted
201420122011
2000No Repeal Enacted
Source Authors research Reinstated in 2003
50
Figure 3 National Trends in the Teacher Labor Market
Notes Data on the number of teaching licenses issued come from Title II data provided by states
to the US DOE A reporting year for Title II is from September 1st to August 31st for the latter
year Data on the number of traditional teacher preparation program graduates at post-secondary
institutions is from the IPEDS Survey administered by NCES IPEDS reports graduates in a 12
month period up to the spring and summer of the given year Data on total K-12 public school
charter school and private school teachers are based on total full-time equivalent (FTE) teaching
positions from the NCES common core state-level files using spring academic year Public and
charter school FTE is a lower bound estimate as charter school FTE data are missing in 6 percent
of state-year cells All data are scaled by their 2002 values such that trends represent the percent
change in a given measure relative to 2002 levels The baseline 2002 values are 277696 for
licenses 211764 for teacher preparation program graduates 2994575 for public school
teachers 22785 for charter school teachers and 387495 for private school teachers
-20
-10
010
20
Pe
rce
nt ch
an
ge
re
lative
to
20
02
2002 2004 2006 2008 2010 2012 2014 2016Year
New Teaching Licenses Public amp Charter Sch FTE
Teacher Prep Grads Private Sch FTE
51
Figure 4 Event study depicting effect of evaluation reforms on the number of new teaching
licensures
Notes Point estimates for years pre- (hollow dot) and post-reform (solid dot) and corresponding
95 percent confident intervals are derived from an event study model that includes time-varying
state-level controls real average hourly wages in the private sector unemployment rates real
state tax revenue per capita the fraction of the population ages 5 to 17 that are White Black
Hispanic and living below the federal poverty line and measures specific to K-12 public
education real average teacher salaries and real current per pupil expenditures and region-by-
year fixed effects Estimates depicted in this figure are reported in Appendix Table A5
-10
-50
5
pe
r 1
00
00
18
-65
ye
ar
old
s
-7 -6 -5 -4 -3 -2 -1 0 1 2 3Relative Year
52
Figure 5 Event study depicting effect of repealing tenure on the number of new teaching
licensures
Notes See Figure 4 for details
-10
-50
510
p
er
10
00
0 1
8-6
5 y
ea
r o
lds
-7 -6 -5 -4 -3 -2 -1 0 1 2 3Relative Year
53
Figure 6 National trends in the number of university-based degree completers by subject area
Notes Data on the number of traditional teacher preparation program graduates at post-
secondary institutions that receive financial aid is from the IPEDS Survey administered by
NCES All data are scaled by their 2002 values such that trends represent the percent change in a
given measure relative to 2002 levels
-50
050
100
Pe
rce
nt ch
an
ge
re
lative
to
20
02
2002 2004 2006 2008 2010 2012 2014 2016year
Elementary English
Math Science
Social Studies Special Education
54
Figure 7 State Teacher Shortage Areas by Licensure Type in 2017-18 as Designated by the US
Secretary of Education
Notes A teacher shortage area (TSA) is ldquoan area of specific grade subject matter or discipline
classification or a geographic area in which the Secretary [of Education] determines that there is
an inadequate supply of elementary or secondary school teachersrdquo (34 CFR 682210(q)(8)(vii))
States submit a TSA proposal for consideration and are evaluated based on a few criteria
including a requirement that the TSAs may not account for more than five percent of full time
teaching positions in the state Teachers who teach in federally recognized TSAs make
themselves eligible for deferment or even cancellation of their federal loans including Perkins
and Stafford Loans Detailed notes on coding equivalent licensure areas across states available
Table A2 The Effect of Eliminating Tenure on the Number of New Teaching Licenses in Models that Drop One State
Notes +plt10 plt05 plt01 Plt001 Cells report estimates and associated standard errors clustered at the state level in parentheses Time-varying state-level controls
are the same as those listed in Table A1 All models include state and region-by-year fixed effects
Without
Kansas
Without
Louisiana Without North CarolinaWithout Florida
Without
Georgia
Without
Idaho
Full Restricted Full Restricted
Implement Evaluation -2505 -2039 -2366 -1819+
(0861) (0958) (0832) (0935)
Implement Evaluation Year_R -1341 -1378
(0571) (0536)
Year_R 0330 0329
(0204) (0216)
change relative to state mean -17 -14
n 749 659 749 659
Controls Y Y Y Y
Notes +plt10 plt05 plt01 Plt001 Cells report estimates and associated standard
errors clustered at the state level in parentheses Time-varying state-level controls are the same
as those listed in Table A1 All models include state and region-by-year fixed effects
Table A3 The Effect of High-Stakes Teacher Evaluation Reforms on the Number of New
Teaching Licenses in a Restricted Estimation Sample that Excludes States that Repealed Tenure
58
Implement Evaluation 0011 0001 -0091 -0076
(0108) (0109) (0099) (0104)
Implement Evaluation Year_R 0057 0053
(0079) (0095)
Year_R 0069 0062
(0093) (0058)
change relative to state mean 0 0
Eliminate Tenure 0155 0159 0012 0041
(0101) (0245) (0080) (0153)
Eliminate Tenure Year_R 0038 0071
(0048) (0078)
Year_R 0015 0003
(0032) (0061)
change relative to state mean 6 6
Controls Y Y
n 550 550 550 550
Panel A High-Stakes Evaluation Reforms
Panel B Tenure Reforms
Notes +plt10 plt05 plt01 Plt001 Cells report estimates and associated
standard errors clustered at the state level in parentheses Time-varying state-level
controls are the same as those listed in Table A1 All models include state and
region-by-year fixed effects
Table A4 Falsification Tests with Certified Public Accountant Exam Takers
59
Implement Evaluation (Eval) -4418 -3179
(1543) (1570)
Eval Bordering Comparison States 1465
(1352)
Eliminate Tenure -2822+ -3069
(1430) (1313)
Tenure Bordering Comparison States -0375
(0911)
change relative to state mean -30 -21 -19 -21
Controls Y Y Y Y
n 550 550 749 749
Notes +plt10 plt05 plt01 Plt001 Cells report estimates and associated standard
errors clustered at the state level in parentheses Time-varying state-level controls are the
same as those listed in Table A1 All models include state and region-by-year fixed effects
Table A5 Test of Treatment Spillover in Contiguous States due to Endogenous Mobility
Table A6 Alternative Specifications for the Effect of High-Stakes Teacher Evaluation and Tenure Reforms on the Number of New
Teaching Licenses
Panel A High-Stakes Evaluation Reforms
Panel B Tenure Reforms
Notes +plt10 plt05 plt01 Plt001 Cells report estimates and associated standard errors clustered at the state level in
parentheses Time-varying state-level controls are the same as those listed in Table A1 All models include state and region-by-year
fixed effects
61
NCES Average Salary ACS Adjusted Average Salary
Implement Evaluation -20539 10059 -44662+ -25428
(55822) (49843) (23271) (18522)
Implement Evaluation Year_R 6194 -27336
(26441) (18756)
Year_R -23924+ -8330
(12756) (9441)
change relative to state mean 0 -1
Eliminate Tenure 7476 -47473 -11848 57804
(79381) (61062) (35105) (36318)
Eliminate Tenure Year_R 62547+ 9134
(35412) (21228)
Year_R -10162 -16588
(22449) (13067)
change relative to state mean 0 0
Controls Y Y Y Y
n 750 750 600 600
Panel A High-Stakes Evaluation Reforms
Panel B Tenure Reforms
Notes +plt10 plt05 plt01 Plt001 Cells report estimates and associated standard errors
clustered at the state level in parentheses Time-varying state-level controls are the same as those listed in
Table A1 All models include state and region-by-year fixed effects
Table A7 The Effect of High-Stakes Teacher Evaluation and Tenure Reforms on Public Teacher Salaries
Appendix B
Table B1 State Legislation and Court Cases Restricting or Repealing Teacher Tenure 2002-2016
State Summary of Changes Bill(s) Case Date Passed
Filed
Date
Effective for
Tenure
Elimination
Went
into
Effect
Date Overturned How was it
Overturned
Florida
Governor Scott signed two
important tenure-related laws SB
736 required annual contracts for
new teachers for the duration of
their careers and salaries based on
evaluations HB 7087 prevented
any teacher who did not already
have tenure from receiving it
Senate Bill 736
and House Bill
7087
SB 736 March
24 2011 HB
7087 May 5
2011
July 1 2011 Yes NA NA
Georgia
Governor Barnes signed and
supported reform through House
Bill 1187 (in which the
opportunity to obtain tenure was
eliminated for teachers hired after
July 1 2000) After little
improvement Governor Barnes
was ousted and replaced with
Governor Purdue who promptly
repealed the law
House Bill
1187 (A+
Education
Reform Act of
2000)
April 25 2000 July 1 2000 Yes June 4 2003 Legislative Repeal in
Senate Bill 193
63
Idaho
SB 1108 1110 and 1194 or the
Luna Laws eliminated tenure
for new teachers reworked teacher
pay around performance and
required supplying computers to
every high school student
Opposition to these laws was swift
after the laws went into effect
voters repealed the laws by a
margin of over 50
Senate Bills
1108 1110
1194
March 1 2011 July 1 2011 Yes November 6
2012 Propositions 1 2 amp 3
Kansas
In 2014 Governor Brownback
signed HB 2506 redefining the
word teacher so that due process
procedures for public employees
did not apply Individual districts
differ on the implementation of
HB 2506
House Bill
2506 July 1 2014 July 1 2014 Yes NA NA
Louisiana
Act 1 passed in April 2012
increased the requirements for
teacher tenure To receive tenure
teachers must receive a highly-
effective Compass rating five out
of six consecutive years an
exceedingly difficult task Tenure
is immediately revoked if a teacher
ever receives an ineffective rating
House Bill 974
(Act 1) April 18 2012 July 1 2012 Yes NA
NA (Upheld by
Louisiana Supreme
Court in Oct 2014)
64
North
Carolina
Legislators in North Carolina
revoked teacher tenure for those
who already had it and for new
teachers in the annual 2013
budgeting process The act of
revoking tenure for those who
already had career status (which
would have been phased out
completely by June 30 2018) was
overturned by the North Carolina
Supreme Court in April 2016 but
the new teacher provision was
upheld although individual
districts can differ
Senate Bill 402 July 26 2013 July 1 2014 Yes April 15 2016
Partially overturned
by North Carolina
Court of Appeals June
2 2015 and then later
ruled unconstitutional
by the NC Supreme
Court in 2016 which
ruled the state cannot
remove tenure from
those who earned it
before the law was
passed but can
withhold this
protection from those
hired since July 2013
Ohio
Senate Bill 5 (2011) which
eliminated awarding future
continuing contracts (tenure) to
teachers was signed into law
March 30 2011 (with an effective
date of June 30 2011) but was
overturned by Referendum Issue 2
on November 8 2011 The law did
not go into effect due to Ohio
Constitution Article II sect1c which
stipulates that no such law [being
petitioned and signed by six per
centum of the electors of the
state] section or item shall go into
effect until and unless approved by
a majority of those voting upon the
same
Senate Bill 5 March 31
2011 July 31 2011 No
November 8
2011
Voter Referendum
Issue 2
65
Pennsylvania
House Bill 805 first drafted in
May 2015 and passed in May 2016
with a vote of 95-94 was vetoed
by Governor Tom Wolf on May
18 2016 The bill amended the
Public School Code of 1949
changing the contracts of school
teachers in aspects of receiving
tenure collective bargaining
agreements and timing of appeal
and suspension Governor Wolf
cited that while it is in everyonersquos
best interest to improve
accountability in education HB
805 ldquorelies heavily on a single
score from the teacher evaluation
system as opposed to using the
entire method of evaluationrdquo
House Bill 805 May 17 2016 June 30 2016 No May 18 2016 Vetoed by Governor
Tom Wolf
South
Dakota
South Dakota passed HB 1234 in
February 2012 which eliminated
state mandates for tenure for
teachers who had not achieved
tenure by July 1 2016 although
individual districts would be able
to continue offering tenure The
law was repealed by referendum
the same year which means that
the tenure change never went into
effect
House Bill
1234
February 29
2012 July 1 2016 No
November 6
2012
Referred Law 16
Referendum on
November ballot
Appendix C
Identifying Graduates of Teacher Preparation Programs and by Subject Areas using CIPS
Codes
The Integrated Post-Secondary Education Data System (IPEDS) includes the results of
eleven surveys conducted annually by the US Department of Educationrsquos National Center for
Education Statistics (NCES) All institutions must submit race and ethnicity data if they receive
are applicants for or expect to be applicants for federal financial assistance as defined under the
DOErsquos regulations implementing Title VI of the Civil Rights Act of 1964 Title IX of the
Education Amendments of 1972 and the Carl D Perkins Education Act These surveys thus
capture the substantive universe of post-secondary schools colleges and universities
In this paper we use the entire ldquoCompletionsrdquo survey available for download on the
IPEDS website Each observation in the file corresponds to the completers of a particular
academic program identified by classification of instruction program (CIP) code and the award
level (eg bachelorrsquos degree masterrsquos degree etc) of that particular program for each reporting
institution
The NCES has devised a six-digit taxonomy for organizing academic programs called
CIP codes The first two digits of the code correspond to a broad area of study For instance all
majors under the two-digit CIP category ldquo13rdquo are majors within the education field These
majors include not only education programs designed to prepare individuals to be teachers but
also teaching assistants preparation programs (131501) and programs for education program
evaluators (eg Education Evaluation and Research 130601) among others The next two digits
in the CIP code cluster majors with similar instructional content within the board area of study
All majors with a 1313 CIP code sequence for example are ldquoteacher education or professional
development majors within specific subject areasrdquo within the broad field of education The final
two digits are unique to each specific major that falls within the specific subject area For
example a ldquostructural engineeringrdquo major has a 140803 CIP code (ldquo14rdquo corresponds to
engineering ldquo08rdquo correspond to civil engineering and the final ldquo03rdquo is unique to structural
engineering) NCES adds and removes CIP codes regularly We created consistent categories for
all six-digit codes across the panel using crosswalks supplied by NCES19
Based on conversations with IPEDS-reporting institutions and the IPEDS Help Desk
Staff we identify teacher preparation programs based on the following CIP codes20
Education General 130100-130101
Bilingual Multilingual and Multicultural Education 130201-120299
Curriculum and Instruction 130301
Special Education and Teaching 131000-131099
Teacher Education amp Professional Development Specific Levels and Methods 131200-
131299
Teacher Education amp Professional Development Specific Levels and Methods 131300-
131399
Teaching English or French as a Second or Foreign Language 131401-131499
19 Crosswalks can be found here httpsncesedgovipedscipcodecrosswalkaspxy=55 20 Dan Goldhaber and Roddy Theobald provided valuable guidance here as well
67
Education Other 139999
We restrict the data to include only graduates that earned either a bachelorrsquos or masterrsquos degree
and then sum these university-level counts to the state-by-year level
We identify teacher education program graduates in subject-specific areas using the