Page 1
Press Release from the Atlas Copco Group
Atlas Copco Group Center
Atlas Copco AB Visitors address: Telephone: +46 8 743 8000 A Public Company (publ)
SE-105 23 Stockholm Sickla Industriväg 19 www.atlascopcogroup.com Reg. No: 556014-2720
Sweden Nacka Reg. Office Nacka
January 26, 2018
Atlas Copco Interim report on Q4 and full-year summary 2017 (unaudited)
Strong end to a record year The figures presented in this report refer to continuing operations unless otherwise stated
Orders increased 10% to MSEK 30 372 (27 617), organic growth of 14%
Revenues increased 8% to MSEK 30 865 (28 495), organic growth of 11%
Adjusted operating profit, excluding items affecting comparability, was MSEK 6 640 (5 849),
corresponding to a margin of 21.5% (20.5)
Reported operating profit increased 8% to MSEK 6 233 (5 785), corresponding to a margin of 20.2%
(20.3)
Profit before tax amounted to MSEK 5 946 (5 618)
Basic earnings per share were SEK 3.49 (3.49)
Operating cash flow at MSEK 5 500 (6 537), including discontinued operations
The Board proposes a distribution to shareholders of SEK 15.00 per share through
Annual dividend for 2017 of SEK 7.00 (6.80) per share
An extra distribution of SEK 8.00 per share through mandatory redemption of shares
Road Construction Equipment division divested
Preparations for split and proposed distribution of Epiroc progressed according to plan
MSEK 2017 2016 2017 2016
Orders received 30 372 27 617 10% 123 431 102 812 20%
Revenues 30 865 28 495 8% 116 421 101 356 15%
Operating profit 6 233 5 785 8% 24 200 19 798 22%
– as a percentage of revenues 20.2 20.3 20.8 19.5
Profit before tax 5 946 5 618 6% 23 129 18 805 23%
– as a percentage of revenues 19.3 19.7 19.9 18.6
Profit for the period from
continuing operations 4 243 4 254 0% 16 762 13 785 22%
Profit/loss for the period from
discontinued operations -55 -1 793 -69 -1 837
Profit for the period 4 188 2 461 70% 16 693 11 948 40%
Basic earnings per share, SEK 3.44 2.01 13.73 9.81
- of which continuing operations 3.49 3.49 13.79 11.32
Diluted earnings per share, SEK 3.40 2.01 13.63 9.79
- of which continuing operations 3.45 3.48 13.68 11.30
Return on capital employed, % 30 27
October - December January - December
Near-term demand outlook The overall demand for the Group is expected to remain at current high level.
Previous near-term demand outlook (published October 18, 2017):
The overall demand for the Group is expected to remain at current high level.
Page 2
Atlas Copco – Q4 2017 2 (21)
Atlas Copco Group – Summary of full-year 2017 Orders and revenues
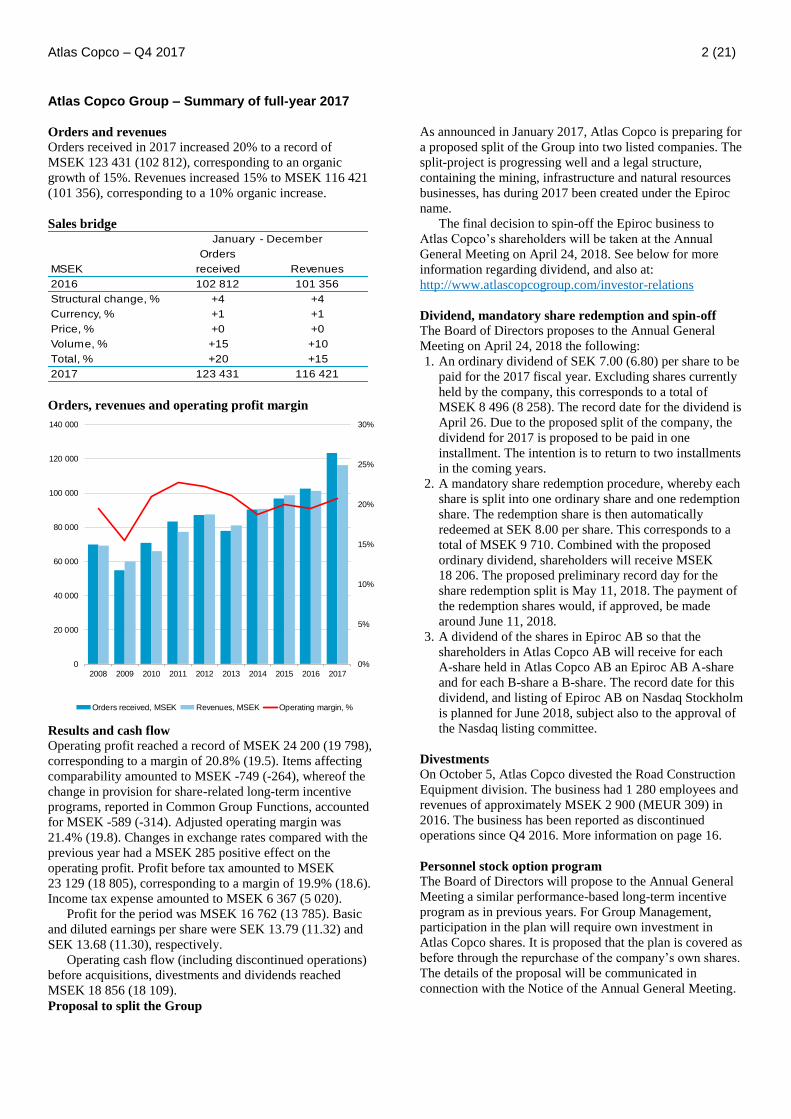
Orders received in 2017 increased 20% to a record of
MSEK 123 431 (102 812), corresponding to an organic
growth of 15%. Revenues increased 15% to MSEK 116 421
(101 356), corresponding to a 10% organic increase.
Sales bridge
Orders
MSEK received Revenues
2016 102 812 101 356
Structural change, % +4 +4
Currency, % +1 +1
Price, % +0 +0
Volume, % +15 +10
Total, % +20 +15
2017 123 431 116 421
January - December
Orders, revenues and operating profit margin
0%
5%
10%
15%
20%
25%
30%
0
20 000
40 000
60 000
80 000
100 000
120 000
140 000
2008 2009 2010 2011 2012 2013 2014 2015 2016 2017
Orders received, MSEK Revenues, MSEK Operating margin, %
Results and cash flow
Operating profit reached a record of MSEK 24 200 (19 798),
corresponding to a margin of 20.8% (19.5). Items affecting
comparability amounted to MSEK -749 (-264), whereof the
change in provision for share-related long-term incentive
programs, reported in Common Group Functions, accounted
for MSEK -589 (-314). Adjusted operating margin was
21.4% (19.8). Changes in exchange rates compared with the
previous year had a MSEK 285 positive effect on the
operating profit. Profit before tax amounted to MSEK
23 129 (18 805), corresponding to a margin of 19.9% (18.6).
Income tax expense amounted to MSEK 6 367 (5 020).
Profit for the period was MSEK 16 762 (13 785). Basic
and diluted earnings per share were SEK 13.79 (11.32) and
SEK 13.68 (11.30), respectively.
Operating cash flow (including discontinued operations)
before acquisitions, divestments and dividends reached
MSEK 18 856 (18 109).
Proposal to split the Group
As announced in January 2017, Atlas Copco is preparing for
a proposed split of the Group into two listed companies. The
split-project is progressing well and a legal structure,
containing the mining, infrastructure and natural resources
businesses, has during 2017 been created under the Epiroc
name.
The final decision to spin-off the Epiroc business to
Atlas Copco’s shareholders will be taken at the Annual
General Meeting on April 24, 2018. See below for more
information regarding dividend, and also at:
http://www.atlascopcogroup.com/investor-relations
Dividend, mandatory share redemption and spin-off The Board of Directors proposes to the Annual General
Meeting on April 24, 2018 the following:
1. An ordinary dividend of SEK 7.00 (6.80) per share to be
paid for the 2017 fiscal year. Excluding shares currently
held by the company, this corresponds to a total of
MSEK 8 496 (8 258). The record date for the dividend is
April 26. Due to the proposed split of the company, the
dividend for 2017 is proposed to be paid in one
installment. The intention is to return to two installments
in the coming years.
2. A mandatory share redemption procedure, whereby each
share is split into one ordinary share and one redemption
share. The redemption share is then automatically
redeemed at SEK 8.00 per share. This corresponds to a
total of MSEK 9 710. Combined with the proposed
ordinary dividend, shareholders will receive MSEK
18 206. The proposed preliminary record day for the
share redemption split is May 11, 2018. The payment of
the redemption shares would, if approved, be made
around June 11, 2018.
3. A dividend of the shares in Epiroc AB so that the
shareholders in Atlas Copco AB will receive for each
A-share held in Atlas Copco AB an Epiroc AB A-share
and for each B-share a B-share. The record date for this
dividend, and listing of Epiroc AB on Nasdaq Stockholm
is planned for June 2018, subject also to the approval of
the Nasdaq listing committee.
Divestments
On October 5, Atlas Copco divested the Road Construction
Equipment division. The business had 1 280 employees and
revenues of approximately MSEK 2 900 (MEUR 309) in
2016. The business has been reported as discontinued
operations since Q4 2016. More information on page 16.
Personnel stock option program
The Board of Directors will propose to the Annual General
Meeting a similar performance-based long-term incentive
program as in previous years. For Group Management,
participation in the plan will require own investment in
Atlas Copco shares. It is proposed that the plan is covered as
before through the repurchase of the company’s own shares.
The details of the proposal will be communicated in
connection with the Notice of the Annual General Meeting.
Page 3
Atlas Copco – Q4 2017 3 (21)
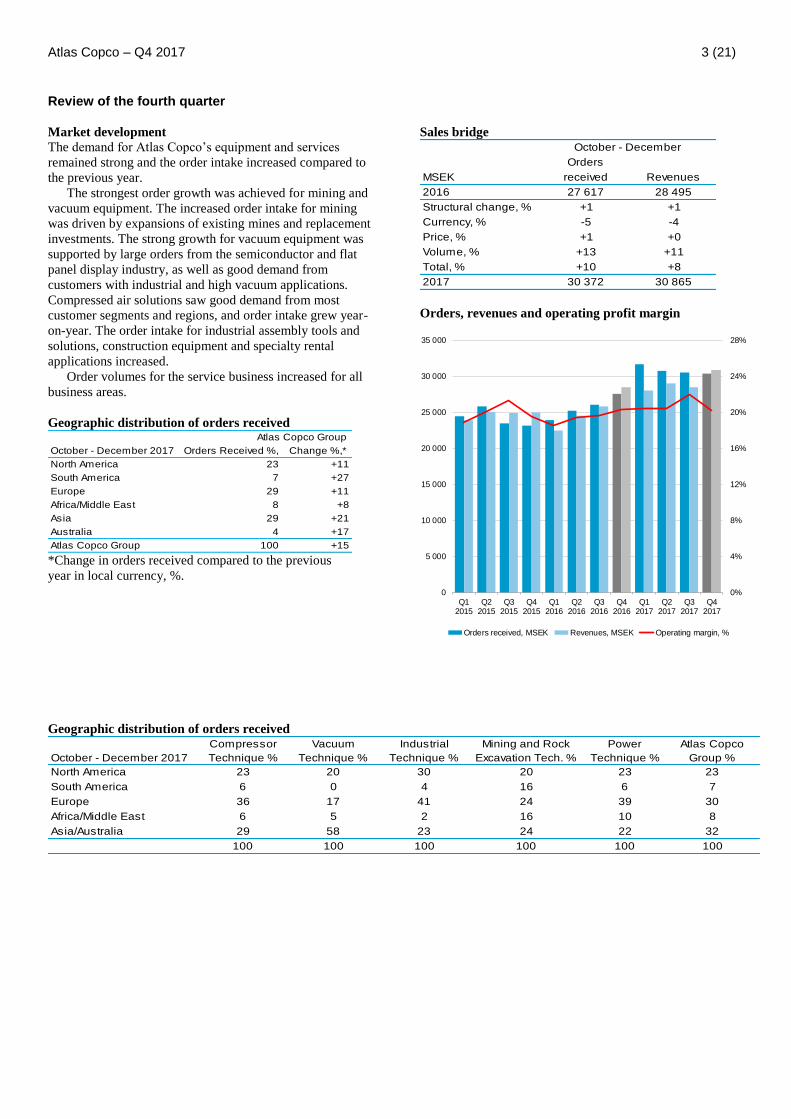
Review of the fourth quarter Market development
The demand for Atlas Copco’s equipment and services
remained strong and the order intake increased compared to
the previous year.
The strongest order growth was achieved for mining and
vacuum equipment. The increased order intake for mining
was driven by expansions of existing mines and replacement
investments. The strong growth for vacuum equipment was
supported by large orders from the semiconductor and flat
panel display industry, as well as good demand from
customers with industrial and high vacuum applications.
Compressed air solutions saw good demand from most
customer segments and regions, and order intake grew year-
on-year. The order intake for industrial assembly tools and
solutions, construction equipment and specialty rental
applications increased.
Order volumes for the service business increased for all
business areas.
Geographic distribution of orders received
October - December 2017 Orders Received %, Change %,*
North America 23 +11
South America 7 +27
Europe 29 +11
Africa/Middle East 8 +8
Asia 29 +21
Australia 4 +17
Atlas Copco Group 100 +15
Atlas Copco Group
*Change in orders received compared to the previous
year in local currency, %.
Sales bridge
Orders
MSEK received Revenues
2016 27 617 28 495
Structural change, % +1 +1
Currency, % -5 -4
Price, % +1 +0
Volume, % +13 +11
Total, % +10 +8
2017 30 372 30 865
October - December
Orders, revenues and operating profit margin
0%
4%
8%
12%
16%
20%
24%
28%
0
5 000
10 000
15 000
20 000
25 000
30 000
35 000
Q12015
Q22015
Q32015
Q42015
Q12016
Q22016
Q32016
Q42016
Q12017
Q22017
Q32017
Q42017
Orders received, MSEK Revenues, MSEK Operating margin, %
Geographic distribution of orders received Compressor Vacuum Industrial Mining and Rock Power Atlas Copco
October - December 2017 Technique % Technique % Technique % Excavation Tech. % Technique % Group %
North America 23 20 30 20 23 23
South America 6 0 4 16 6 7
Europe 36 17 41 24 39 30
Africa/Middle East 6 5 2 16 10 8
Asia/Australia 29 58 23 24 22 32
100 100 100 100 100 100
Page 4
Atlas Copco – Q4 2017 4 (21)
Revenues, profits and returns
Revenues increased 8% to MSEK 30 865 (28 495),
corresponding to an 11% organic increase. The currency
translation effect was -4%.
The operating profit increased 8% to MSEK 6 233
(5 785) and includes items affecting comparability of MSEK
-407 (-64). The MSEK -407 consist of MSEK -177 (-114)
from a change in provision for share-related long-term
incentive programs, and MSEK -200 for costs associated
with the proposed split of the Group, both items reported in
Common Group Functions, and a MSEK -30 restructuring
cost in the Power Technique business area. The adjusted
operating profit of MSEK 6 640 (5 849), corresponds to a
margin of 21.5% (20.5). The net currency effect compared
to the previous year was negative at MSEK -515, mainly
due to a weaker USD.
Net financial items were MSEK -287 (-167). Interest net
was MSEK -242 (-200). Other financial items were MSEK
-45 (+33).
Profit before tax amounted to MSEK 5 946 (5 618),
corresponding to a margin of 19.3% (19.7).
Corporate income tax amounted to MSEK 1 703 (1 364),
corresponding to an effective tax rate of 28.6%. This
includes tax expense in Q4 2017 related to the legal
restructurings in connection with the preparations of the
Epiroc split of MSEK 330 and non-recurring positive effects
of MSEK 170. At the end of 2017, both Belgium and the
United States have announced major corporate income tax
reforms, which are expected to decrease the Group’s yearly
effective tax rate by 2-3 percentage points.
Profit for the period was MSEK 4 243 (4 254). Basic and
diluted earnings per share were SEK 3.49 (3.49) and SEK
3.45 (3.48), respectively.
The return on capital employed during the last 12
months was 30% (27). Return on equity was 30% (24). The
Group uses a weighted average cost of capital (WACC) of
8.0% as an investment and overall performance benchmark.
Operating cash flow and investments
(including discontinued operations)
In total, operating cash flow reached MSEK 5 500 (6 537).
See page 15.
The main deviations, compared to the previous year
were: Paid taxes, which increased MSEK 557; cash flows
from financial items (adjusted for cash flows from currency
hedges of loans), which affected the comparison with Q4
2016 negatively with MSEK 226; and net investments in
rental equipment, property, plant and equipment, which
increased by MSEK 291.
Operating cash surplus, working capital and other
operating cash flow items had only minor deviations versus
previous year.
Divestment of financial assets
Atlas Copco has sold a portfolio of financing contracts,
related to customer financing. The value of the portfolio
amounted to MSEK 737.
Net indebtedness
The Group’s net indebtedness, adjusted for the fair value of
interest rate swaps, amounted to MSEK 2 466 (14 829), of
which MSEK 3 034 (3 907) was attributable to post-
employment benefits. The Group has an average maturity of
4.7 years on interest-bearing liabilities. The net
debt/EBITDA ratio was 0.1 (0.6). The net debt/equity ratio
was 4% (28).
Acquisition and divestment of own shares
During the quarter, 554 562 A shares, net, were acquired
and 86 500 B shares, net, were divested for a total net value
of MSEK 181. These transactions are in accordance with
mandates granted by the Annual General Meeting and relate
to the Group’s long-term incentive programs.
Employees On December 31, 2017, the number of employees was
47 599 (44 695). The number of consultants/external
workforce was 4 216 (3 300). For comparable units, the total
workforce increased by 3 511 from December 31, 2016.
Revenues and operating profit – bridge
Volume, price, One-time items Share-based
MSEK Q4 2017 mix and other Currency Acquisitions LTI programs* Q4 2016
Atlas Copco Group
Revenues 30 865 3 310 -1 170 230 - 28 495
Operating profit 6 233 1 296 -515 -270 -63 5 785
20.2% 39.2% 20.3% *LTI=Long Term Incentive
Page 5
Atlas Copco – Q4 2017 5 (21)
Compressor Technique
MSEK 2017 2016 2017 2016
Orders received 10 128 9 577 6% 40 772 36 515 12%
Revenues 10 305 9 803 5% 38 768 36 356 7%
Operating profit 2 398 2 143 12% 8 960 8 115 10%
– as a percentage of revenues 23.3 21.9 23.1 22.3
Return on capital employed, % 80 69
October - December January - December
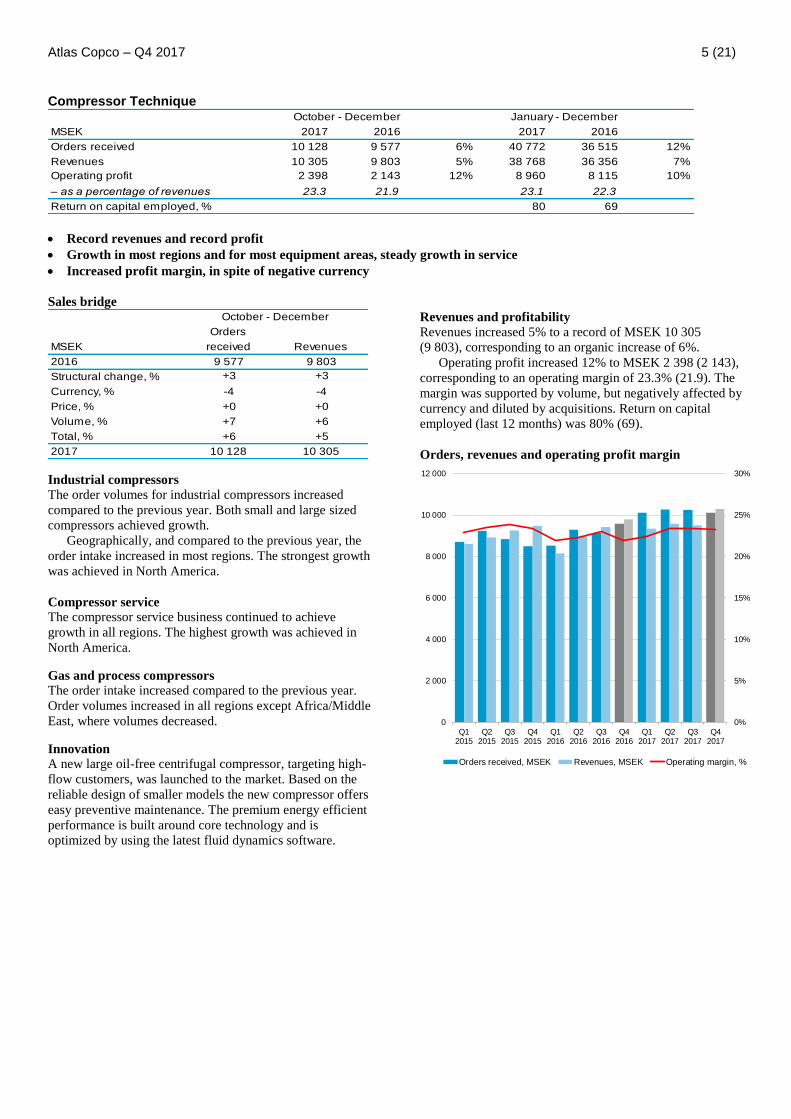
Record revenues and record profit
Growth in most regions and for most equipment areas, steady growth in service
Increased profit margin, in spite of negative currency
Sales bridge
Orders
MSEK received Revenues
2016 9 577 9 803
Structural change, % +3 +3
Currency, % -4 -4
Price, % +0 +0
Volume, % +7 +6
Total, % +6 +5
2017 10 128 10 305
October - December
Industrial compressors
The order volumes for industrial compressors increased
compared to the previous year. Both small and large sized
compressors achieved growth.
Geographically, and compared to the previous year, the
order intake increased in most regions. The strongest growth
was achieved in North America.
Compressor service
The compressor service business continued to achieve
growth in all regions. The highest growth was achieved in
North America.
Gas and process compressors
The order intake increased compared to the previous year.
Order volumes increased in all regions except Africa/Middle
East, where volumes decreased.
Innovation
A new large oil-free centrifugal compressor, targeting high-
flow customers, was launched to the market. Based on the
reliable design of smaller models the new compressor offers
easy preventive maintenance. The premium energy efficient
performance is built around core technology and is
optimized by using the latest fluid dynamics software.
Revenues and profitability
Revenues increased 5% to a record of MSEK 10 305
(9 803), corresponding to an organic increase of 6%.
Operating profit increased 12% to MSEK 2 398 (2 143),
corresponding to an operating margin of 23.3% (21.9). The
margin was supported by volume, but negatively affected by
currency and diluted by acquisitions. Return on capital
employed (last 12 months) was 80% (69).
Orders, revenues and operating profit margin
0%
5%
10%
15%
20%
25%
30%
0
2 000
4 000
6 000
8 000
10 000
12 000
Q12015
Q22015
Q32015
Q42015
Q12016
Q22016
Q32016
Q42016
Q12017
Q22017
Q32017
Q42017
Orders received, MSEK Revenues, MSEK Operating margin, %
Page 6
Atlas Copco – Q4 2017 6 (21)
Vacuum Technique
MSEK 2017 2016 2017 2016
Orders received 5 674 4 407 29% 21 890 14 021 56%
Revenues 5 236 4 635 13% 19 582 13 635 44%
Operating profit 1 352 1 131 20% 4 956 3 060 62%
– as a percentage of revenues 25.8 24.4 25.3 22.4
Return on capital employed, % 25 19
October - December January - December
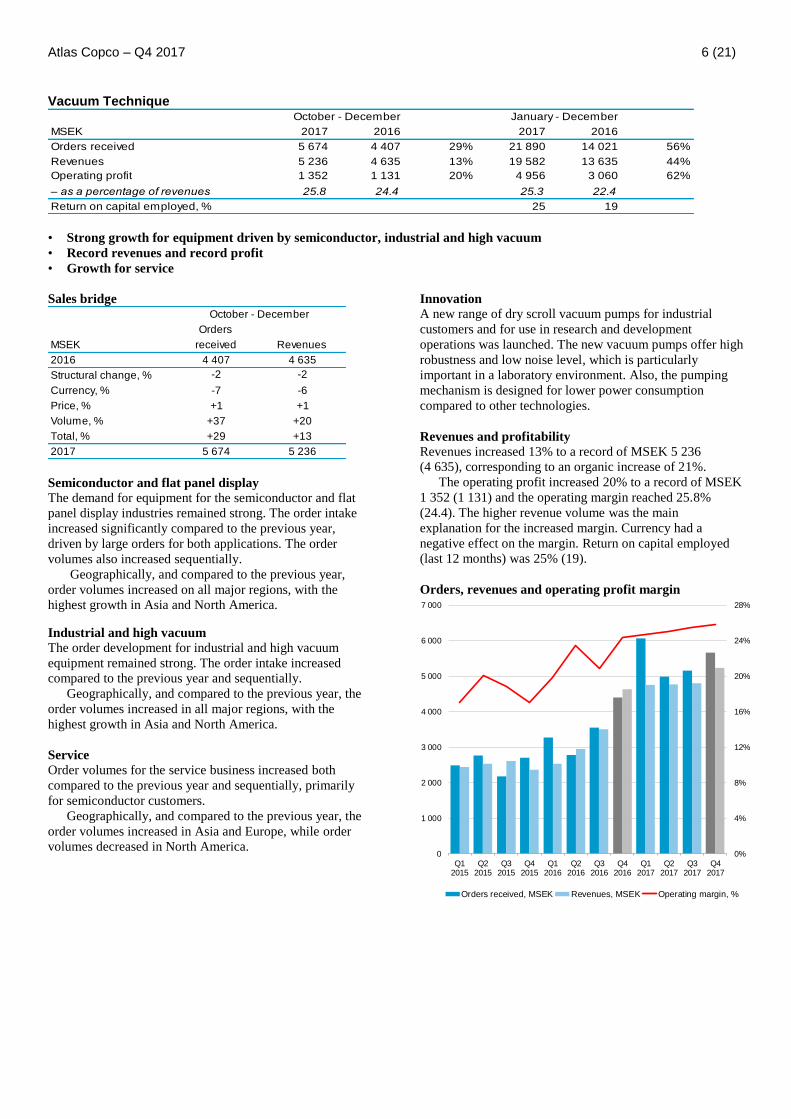
• Strong growth for equipment driven by semiconductor, industrial and high vacuum
• Record revenues and record profit
• Growth for service
Sales bridge
Orders
MSEK received Revenues
2016 4 407 4 635
Structural change, % -2 -2
Currency, % -7 -6
Price, % +1 +1
Volume, % +37 +20
Total, % +29 +13
2017 5 674 5 236
October - December
Semiconductor and flat panel display The demand for equipment for the semiconductor and flat
panel display industries remained strong. The order intake
increased significantly compared to the previous year,
driven by large orders for both applications. The order
volumes also increased sequentially.
Geographically, and compared to the previous year,
order volumes increased on all major regions, with the
highest growth in Asia and North America.
Industrial and high vacuum The order development for industrial and high vacuum
equipment remained strong. The order intake increased
compared to the previous year and sequentially.
Geographically, and compared to the previous year, the
order volumes increased in all major regions, with the
highest growth in Asia and North America.
Service Order volumes for the service business increased both
compared to the previous year and sequentially, primarily
for semiconductor customers.
Geographically, and compared to the previous year, the
order volumes increased in Asia and Europe, while order
volumes decreased in North America.
Innovation A new range of dry scroll vacuum pumps for industrial
customers and for use in research and development
operations was launched. The new vacuum pumps offer high
robustness and low noise level, which is particularly
important in a laboratory environment. Also, the pumping
mechanism is designed for lower power consumption
compared to other technologies.
Revenues and profitability
Revenues increased 13% to a record of MSEK 5 236
(4 635), corresponding to an organic increase of 21%.
The operating profit increased 20% to a record of MSEK
1 352 (1 131) and the operating margin reached 25.8%
(24.4). The higher revenue volume was the main
explanation for the increased margin. Currency had a
negative effect on the margin. Return on capital employed
(last 12 months) was 25% (19).
Orders, revenues and operating profit margin
0%
4%
8%
12%
16%
20%
24%
28%
0
1 000
2 000
3 000
4 000
5 000
6 000
7 000
Q12015
Q22015
Q32015
Q42015
Q12016
Q22016
Q32016
Q42016
Q12017
Q22017
Q32017
Q42017
Orders received, MSEK Revenues, MSEK Operating margin, %
Page 7
Atlas Copco – Q4 2017 7 (21)
Industrial Technique
MSEK 2017 2016 2017 2016
Orders received 4 027 3 897 3% 16 651 15 112 10%
Revenues 4 182 4 137 1% 16 377 15 017 9%
Operating profit 967 997 -3% 4 175 3 430 22%
– as a percentage of revenues 23.1 24.1 25.5 22.8
Return on capital employed, % 43 34
October - December January - December
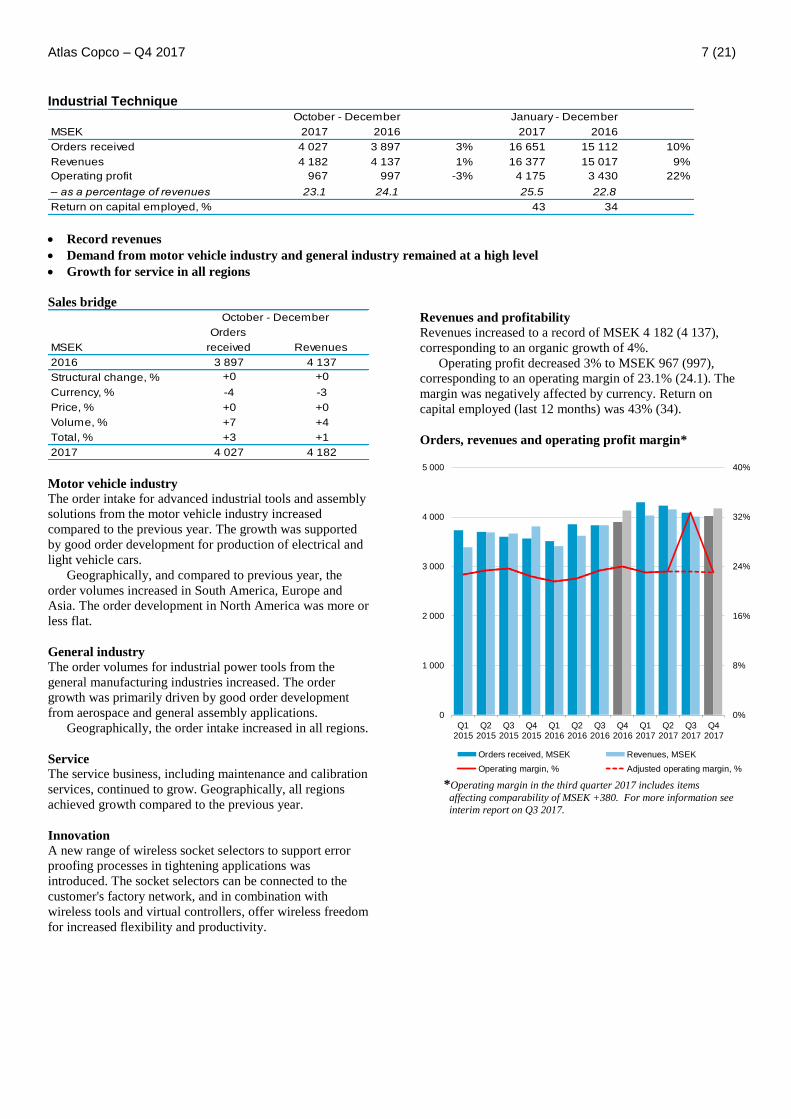
Record revenues
Demand from motor vehicle industry and general industry remained at a high level
Growth for service in all regions
Sales bridge
Orders
MSEK received Revenues
2016 3 897 4 137
Structural change, % +0 +0
Currency, % -4 -3
Price, % +0 +0
Volume, % +7 +4
Total, % +3 +1
2017 4 027 4 182
October - December
Motor vehicle industry
The order intake for advanced industrial tools and assembly
solutions from the motor vehicle industry increased
compared to the previous year. The growth was supported
by good order development for production of electrical and
light vehicle cars.
Geographically, and compared to previous year, the
order volumes increased in South America, Europe and
Asia. The order development in North America was more or
less flat.
General industry
The order volumes for industrial power tools from the
general manufacturing industries increased. The order
growth was primarily driven by good order development
from aerospace and general assembly applications.
Geographically, the order intake increased in all regions.
Service
The service business, including maintenance and calibration
services, continued to grow. Geographically, all regions
achieved growth compared to the previous year.
Innovation A new range of wireless socket selectors to support error
proofing processes in tightening applications was
introduced. The socket selectors can be connected to the
customer's factory network, and in combination with
wireless tools and virtual controllers, offer wireless freedom
for increased flexibility and productivity.
Revenues and profitability
Revenues increased to a record of MSEK 4 182 (4 137),
corresponding to an organic growth of 4%.
Operating profit decreased 3% to MSEK 967 (997),
corresponding to an operating margin of 23.1% (24.1). The
margin was negatively affected by currency. Return on
capital employed (last 12 months) was 43% (34).
Orders, revenues and operating profit margin*
0%
8%
16%
24%
32%
40%
0
1 000
2 000
3 000
4 000
5 000
Q12015
Q22015
Q32015
Q42015
Q12016
Q22016
Q32016
Q42016
Q12017
Q22017
Q32017
Q42017
Orders received, MSEK Revenues, MSEK
Operating margin, % Adjusted operating margin, % *Operating margin in the third quarter 2017 includes items
affecting comparability of MSEK +380. For more information see
interim report on Q3 2017.
Page 8
Atlas Copco – Q4 2017 8 (21)
Mining and Rock Excavation Technique
MSEK 2017 2016 2017 2016
Orders received 7 539 6 799 11% 31 473 25 565 23%
Revenues 8 011 6 971 15% 29 166 25 043 16%
Operating profit 1 629 1 395 17% 5 844 4 465 31%
– as a percentage of revenues 20.3 20.0 20.0 17.8
Return on capital employed, % 43 32
October - December January - December
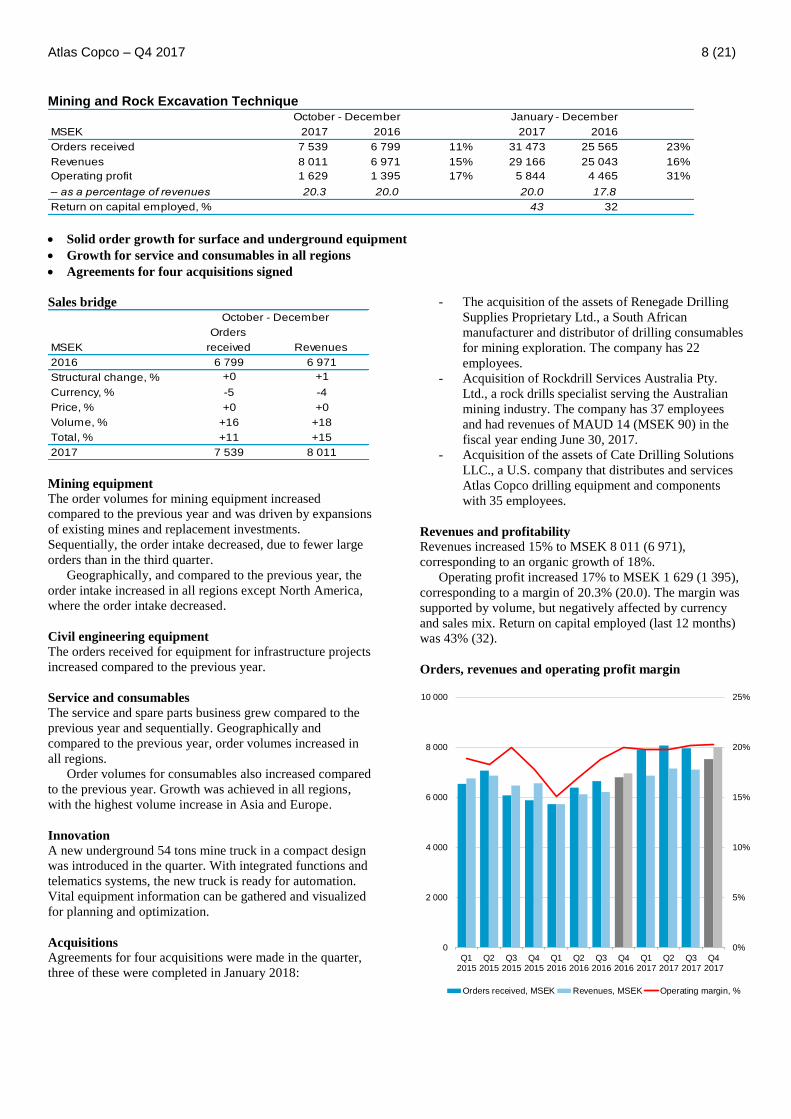
Solid order growth for surface and underground equipment
Growth for service and consumables in all regions
Agreements for four acquisitions signed
Sales bridge
Orders
MSEK received Revenues
2016 6 799 6 971
Structural change, % +0 +1
Currency, % -5 -4
Price, % +0 +0
Volume, % +16 +18
Total, % +11 +15
2017 7 539 8 011
October - December
Mining equipment
The order volumes for mining equipment increased
compared to the previous year and was driven by expansions
of existing mines and replacement investments.
Sequentially, the order intake decreased, due to fewer large
orders than in the third quarter.
Geographically, and compared to the previous year, the
order intake increased in all regions except North America,
where the order intake decreased.
Civil engineering equipment The orders received for equipment for infrastructure projects
increased compared to the previous year.
Service and consumables
The service and spare parts business grew compared to the
previous year and sequentially. Geographically and
compared to the previous year, order volumes increased in
all regions.
Order volumes for consumables also increased compared
to the previous year. Growth was achieved in all regions,
with the highest volume increase in Asia and Europe.
Innovation A new underground 54 tons mine truck in a compact design
was introduced in the quarter. With integrated functions and
telematics systems, the new truck is ready for automation.
Vital equipment information can be gathered and visualized
for planning and optimization.
Acquisitions Agreements for four acquisitions were made in the quarter,
three of these were completed in January 2018:
- The acquisition of the assets of Renegade Drilling
Supplies Proprietary Ltd., a South African
manufacturer and distributor of drilling consumables
for mining exploration. The company has 22
employees.
- Acquisition of Rockdrill Services Australia Pty.
Ltd., a rock drills specialist serving the Australian
mining industry. The company has 37 employees
and had revenues of MAUD 14 (MSEK 90) in the
fiscal year ending June 30, 2017.
- Acquisition of the assets of Cate Drilling Solutions
LLC., a U.S. company that distributes and services
Atlas Copco drilling equipment and components
with 35 employees.
Revenues and profitability
Revenues increased 15% to MSEK 8 011 (6 971),
corresponding to an organic growth of 18%.
Operating profit increased 17% to MSEK 1 629 (1 395),
corresponding to a margin of 20.3% (20.0). The margin was
supported by volume, but negatively affected by currency
and sales mix. Return on capital employed (last 12 months)
was 43% (32).
Orders, revenues and operating profit margin
0%
5%
10%
15%
20%
25%
0
2 000
4 000
6 000
8 000
10 000
Q12015
Q22015
Q32015
Q42015
Q12016
Q22016
Q32016
Q42016
Q12017
Q22017
Q32017
Q42017
Orders received, MSEK Revenues, MSEK Operating margin, %
Page 9
Atlas Copco – Q4 2017 9 (21)
Power Technique
MSEK 2017 2016 2017 2016
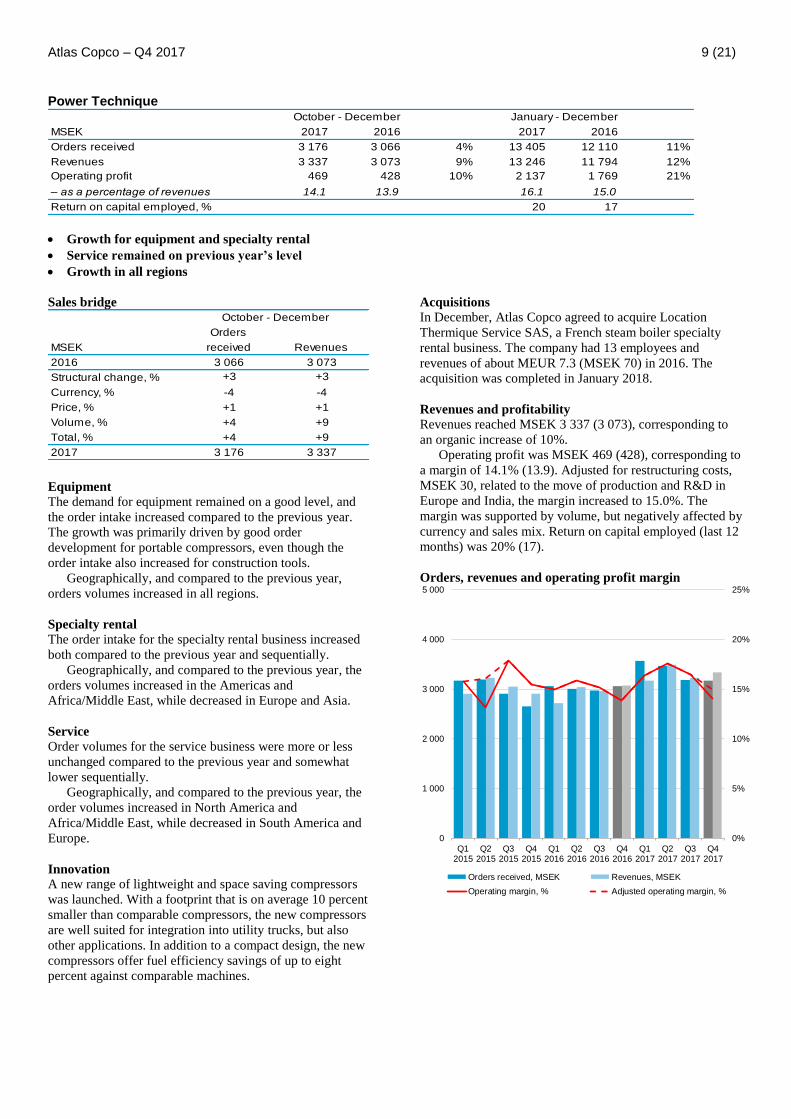
Orders received 3 176 3 066 4% 13 405 12 110 11%
Revenues 3 337 3 073 9% 13 246 11 794 12%
Operating profit 469 428 10% 2 137 1 769 21%
– as a percentage of revenues 14.1 13.9 16.1 15.0
Return on capital employed, % 20 17
October - December January - December
Growth for equipment and specialty rental
Service remained on previous year’s level
Growth in all regions
Sales bridge
Orders
MSEK received Revenues
2016 3 066 3 073
Structural change, % +3 +3
Currency, % -4 -4
Price, % +1 +1
Volume, % +4 +9
Total, % +4 +9
2017 3 176 3 337
October - December
Equipment
The demand for equipment remained on a good level, and
the order intake increased compared to the previous year.
The growth was primarily driven by good order
development for portable compressors, even though the
order intake also increased for construction tools.
Geographically, and compared to the previous year,
orders volumes increased in all regions.
Specialty rental
The order intake for the specialty rental business increased
both compared to the previous year and sequentially.
Geographically, and compared to the previous year, the
orders volumes increased in the Americas and
Africa/Middle East, while decreased in Europe and Asia.
Service
Order volumes for the service business were more or less
unchanged compared to the previous year and somewhat
lower sequentially.
Geographically, and compared to the previous year, the
order volumes increased in North America and
Africa/Middle East, while decreased in South America and
Europe.
Innovation
A new range of lightweight and space saving compressors
was launched. With a footprint that is on average 10 percent
smaller than comparable compressors, the new compressors
are well suited for integration into utility trucks, but also
other applications. In addition to a compact design, the new
compressors offer fuel efficiency savings of up to eight
percent against comparable machines.
Acquisitions
In December, Atlas Copco agreed to acquire Location
Thermique Service SAS, a French steam boiler specialty
rental business. The company had 13 employees and
revenues of about MEUR 7.3 (MSEK 70) in 2016. The
acquisition was completed in January 2018.
Revenues and profitability
Revenues reached MSEK 3 337 (3 073), corresponding to
an organic increase of 10%.
Operating profit was MSEK 469 (428), corresponding to
a margin of 14.1% (13.9). Adjusted for restructuring costs,
MSEK 30, related to the move of production and R&D in
Europe and India, the margin increased to 15.0%. The
margin was supported by volume, but negatively affected by
currency and sales mix. Return on capital employed (last 12
months) was 20% (17).
Orders, revenues and operating profit margin
0%
5%
10%
15%
20%
25%
0
1 000
2 000
3 000
4 000
5 000
Q12015
Q22015
Q32015
Q42015
Q12016
Q22016
Q32016
Q42016
Q12017
Q22017
Q32017
Q42017
Orders received, MSEK Revenues, MSEK
Operating margin, % Adjusted operating margin, %
Page 10
Atlas Copco – Q4 2017 10 (21)
Accounting principles
The consolidated accounts of the Atlas Copco Group are prepared
in accordance with International Financial Reporting Standards
(IFRS). The description of the accounting principles and
definitions are found in the annual report 2016. The interim report
is prepared in accordance with IAS 34 Interim Financial Reporting. Non-IFRS measures are also presented in the report since they are
considered to be important supplemental measures of the
company´s performance. For further information on how these
measures have been calculated, please visit:
http://www.atlascopcogroup.com/investor-relations
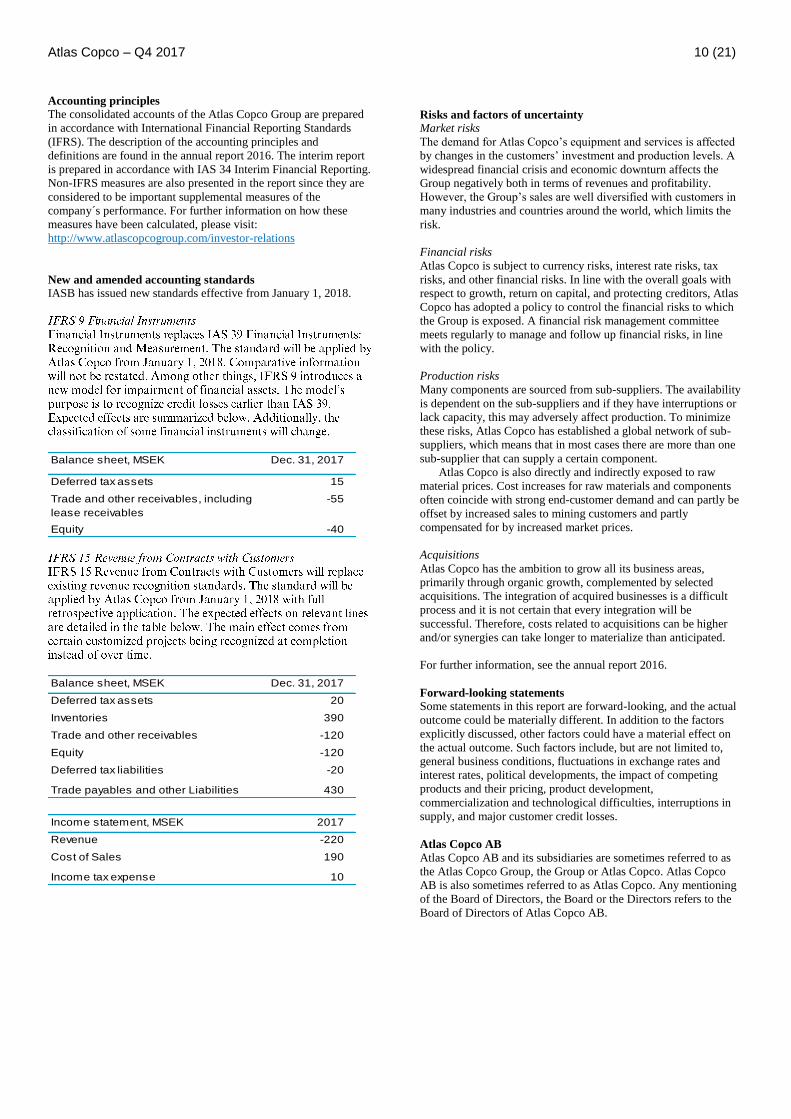
New and amended accounting standards
IASB has issued new standards effective from January 1, 2018.
Balance sheet, MSEK Dec. 31, 2017
Deferred tax assets 15
Trade and other receivables, including
lease receivables
-55
Equity -40
Balance sheet, MSEK Dec. 31, 2017
Deferred tax assets 20
Inventories 390
Trade and other receivables -120
Equity -120
Deferred tax liabilities -20
Trade payables and other Liabilities 430
Income statement, MSEK 2017
Revenue -220
Cost of Sales 190
Income tax expense 10
Risks and factors of uncertainty
Market risks
The demand for Atlas Copco’s equipment and services is affected
by changes in the customers’ investment and production levels. A
widespread financial crisis and economic downturn affects the
Group negatively both in terms of revenues and profitability.
However, the Group’s sales are well diversified with customers in
many industries and countries around the world, which limits the
risk.
Financial risks
Atlas Copco is subject to currency risks, interest rate risks, tax
risks, and other financial risks. In line with the overall goals with
respect to growth, return on capital, and protecting creditors, Atlas
Copco has adopted a policy to control the financial risks to which
the Group is exposed. A financial risk management committee
meets regularly to manage and follow up financial risks, in line
with the policy.
Production risks
Many components are sourced from sub-suppliers. The availability
is dependent on the sub-suppliers and if they have interruptions or
lack capacity, this may adversely affect production. To minimize
these risks, Atlas Copco has established a global network of sub-
suppliers, which means that in most cases there are more than one
sub-supplier that can supply a certain component.
Atlas Copco is also directly and indirectly exposed to raw
material prices. Cost increases for raw materials and components
often coincide with strong end-customer demand and can partly be
offset by increased sales to mining customers and partly
compensated for by increased market prices.
Acquisitions
Atlas Copco has the ambition to grow all its business areas,
primarily through organic growth, complemented by selected
acquisitions. The integration of acquired businesses is a difficult
process and it is not certain that every integration will be
successful. Therefore, costs related to acquisitions can be higher
and/or synergies can take longer to materialize than anticipated.
For further information, see the annual report 2016.
Forward-looking statements
Some statements in this report are forward-looking, and the actual
outcome could be materially different. In addition to the factors
explicitly discussed, other factors could have a material effect on
the actual outcome. Such factors include, but are not limited to,
general business conditions, fluctuations in exchange rates and
interest rates, political developments, the impact of competing
products and their pricing, product development,
commercialization and technological difficulties, interruptions in
supply, and major customer credit losses.
Atlas Copco AB
Atlas Copco AB and its subsidiaries are sometimes referred to as
the Atlas Copco Group, the Group or Atlas Copco. Atlas Copco
AB is also sometimes referred to as Atlas Copco. Any mentioning
of the Board of Directors, the Board or the Directors refers to the
Board of Directors of Atlas Copco AB.
Page 11
Atlas Copco – Q4 2017 11 (21)
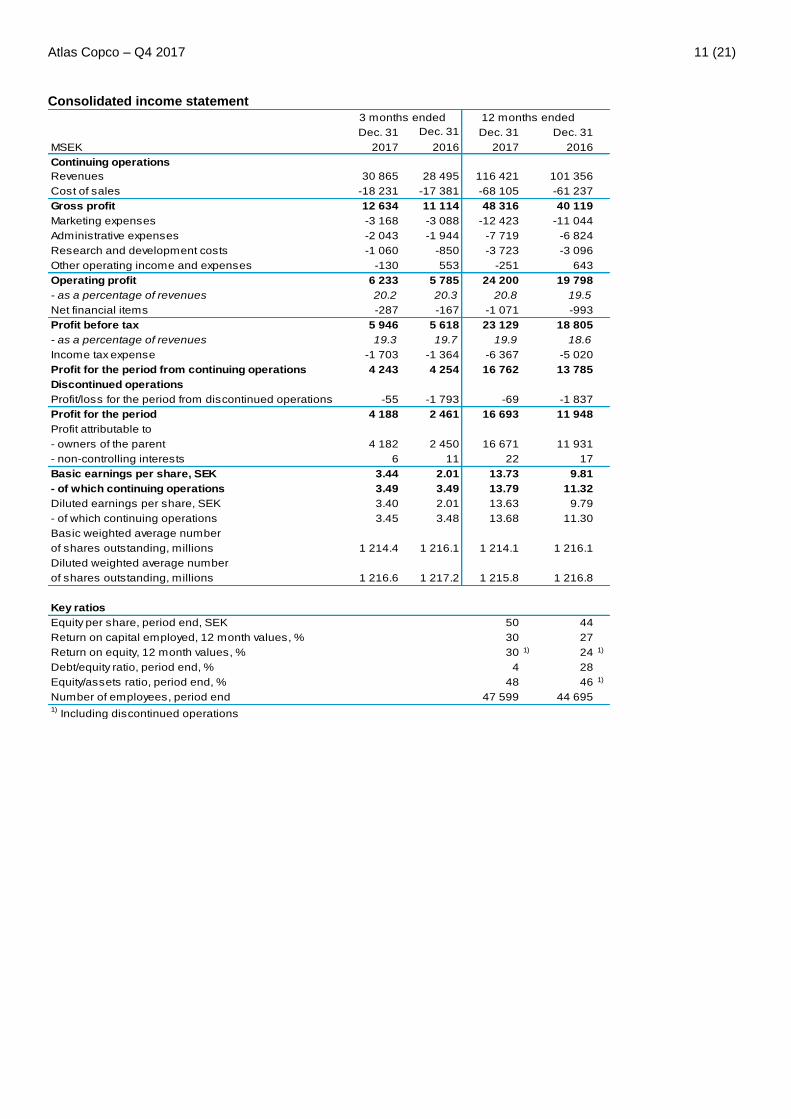
Consolidated income statement
Dec. 31 Dec. 31 Dec. 31 Dec. 31
MSEK 2017 2016 2017 2016
Continuing operations
Revenues 30 865 28 495 116 421 101 356
Cost of sales -18 231 -17 381 -68 105 -61 237
Gross profit 12 634 11 114 48 316 40 119
Marketing expenses -3 168 -3 088 -12 423 -11 044
Administrative expenses -2 043 -1 944 -7 719 -6 824
Research and development costs -1 060 -850 -3 723 -3 096
Other operating income and expenses -130 553 -251 643
Operating profit 6 233 5 785 24 200 19 798
- as a percentage of revenues 20.2 20.3 20.8 19.5
Net financial items -287 -167 -1 071 -993
Profit before tax 5 946 5 618 23 129 18 805
- as a percentage of revenues 19.3 19.7 19.9 18.6
Income tax expense -1 703 -1 364 -6 367 -5 020
Profit for the period from continuing operations 4 243 4 254 16 762 13 785
Discontinued operations
Profit/loss for the period from discontinued operations -55 -1 793 -69 -1 837
Profit for the period 4 188 2 461 16 693 11 948
Profit attributable to
- owners of the parent 4 182 2 450 16 671 11 931
- non-controlling interests 6 11 22 17
Basic earnings per share, SEK 3.44 2.01 13.73 9.81
- of which continuing operations 3.49 3.49 13.79 11.32
Diluted earnings per share, SEK 3.40 2.01 13.63 9.79
- of which continuing operations 3.45 3.48 13.68 11.30
Basic weighted average number
of shares outstanding, millions 1 214.4 1 216.1 1 214.1 1 216.1
Diluted weighted average number
of shares outstanding, millions 1 216.6 1 217.2 1 215.8 1 216.8
Key ratios
Equity per share, period end, SEK 50 44
Return on capital employed, 12 month values, % 30 27
Return on equity, 12 month values, % 30 1) 24 1)
Debt/equity ratio, period end, % 4 28
Equity/assets ratio, period end, % 48 46 1)
Number of employees, period end 47 599 44 6951)
Including discontinued operations
12 months ended3 months ended
Page 12
Atlas Copco – Q4 2017 12 (21)
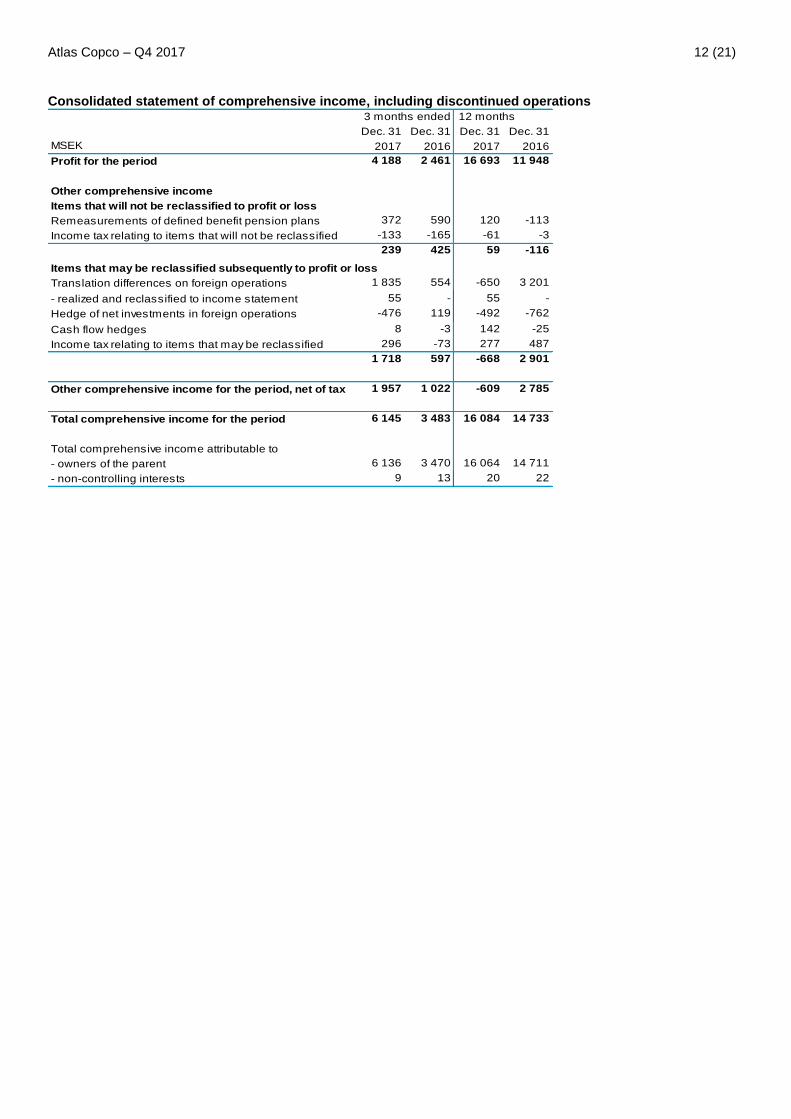
Consolidated statement of comprehensive income, including discontinued operations
Dec. 31 Dec. 31 Dec. 31 Dec. 31
MSEK 2017 2016 2017 2016
Profit for the period 4 188 2 461 16 693 11 948
Other comprehensive income
Items that will not be reclassified to profit or loss
Remeasurements of defined benefit pension plans 372 590 120 -113
Income tax relating to items that will not be reclassified -133 -165 -61 -3
239 425 59 -116
Items that may be reclassified subsequently to profit or loss
Translation differences on foreign operations 1 835 554 -650 3 201
- realized and reclassified to income statement 55 - 55 -
Hedge of net investments in foreign operations -476 119 -492 -762
Cash flow hedges 8 -3 142 -25
Income tax relating to items that may be reclassified 296 -73 277 487
1 718 597 -668 2 901
Other comprehensive income for the period, net of tax 1 957 1 022 -609 2 785
Total comprehensive income for the period 6 145 3 483 16 084 14 733
Total comprehensive income attributable to
- owners of the parent 6 136 3 470 16 064 14 711
- non-controlling interests 9 13 20 22
3 months ended 12 months
Page 13
Atlas Copco – Q4 2017 13 (21)
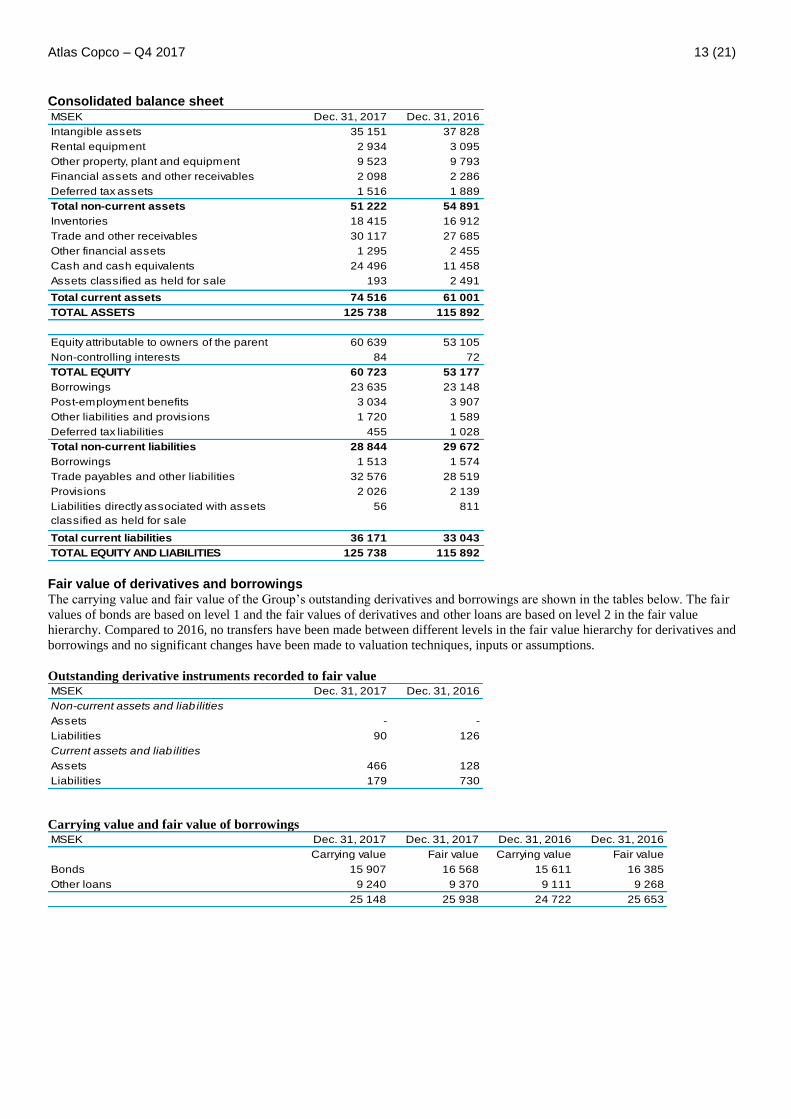
Consolidated balance sheet MSEK Dec. 31, 2017 Dec. 31, 2016
Intangible assets 35 151 37 828
Rental equipment 2 934 3 095
Other property, plant and equipment 9 523 9 793
Financial assets and other receivables 2 098 2 286
Deferred tax assets 1 516 1 889
Total non-current assets 51 222 54 891
Inventories 18 415 16 912
Trade and other receivables 30 117 27 685
Other financial assets 1 295 2 455
Cash and cash equivalents 24 496 11 458
Assets classified as held for sale 193 2 491
Total current assets 74 516 61 001
TOTAL ASSETS 125 738 115 892
Equity attributable to owners of the parent 60 639 53 105
Non-controlling interests 84 72
TOTAL EQUITY 60 723 53 177
Borrowings 23 635 23 148
Post-employment benefits 3 034 3 907
Other liabilities and provisions 1 720 1 589
Deferred tax liabilities 455 1 028
Total non-current liabilities 28 844 29 672
Borrowings 1 513 1 574
Trade payables and other liabilities 32 576 28 519
Provisions 2 026 2 139
Liabilities directly associated with assets
classified as held for sale
56 811
Total current liabilities 36 171 33 043
TOTAL EQUITY AND LIABILITIES 125 738 115 892 Fair value of derivatives and borrowings The carrying value and fair value of the Group’s outstanding derivatives and borrowings are shown in the tables below. The fair
values of bonds are based on level 1 and the fair values of derivatives and other loans are based on level 2 in the fair value
hierarchy. Compared to 2016, no transfers have been made between different levels in the fair value hierarchy for derivatives and
borrowings and no significant changes have been made to valuation techniques, inputs or assumptions.
Outstanding derivative instruments recorded to fair value MSEK Dec. 31, 2017 Dec. 31, 2016
Non-current assets and liab ilities
Assets - -
Liabilities 90 126
Current assets and liab ilities
Assets 466 128
Liabilities 179 730
Carrying value and fair value of borrowings MSEK Dec. 31, 2017 Dec. 31, 2017 Dec. 31, 2016 Dec. 31, 2016
Carrying value Fair value Carrying value Fair value
Bonds 15 907 16 568 15 611 16 385
Other loans 9 240 9 370 9 111 9 268
25 148 25 938 24 722 25 653
Page 14
Atlas Copco – Q4 2017 14 (21)
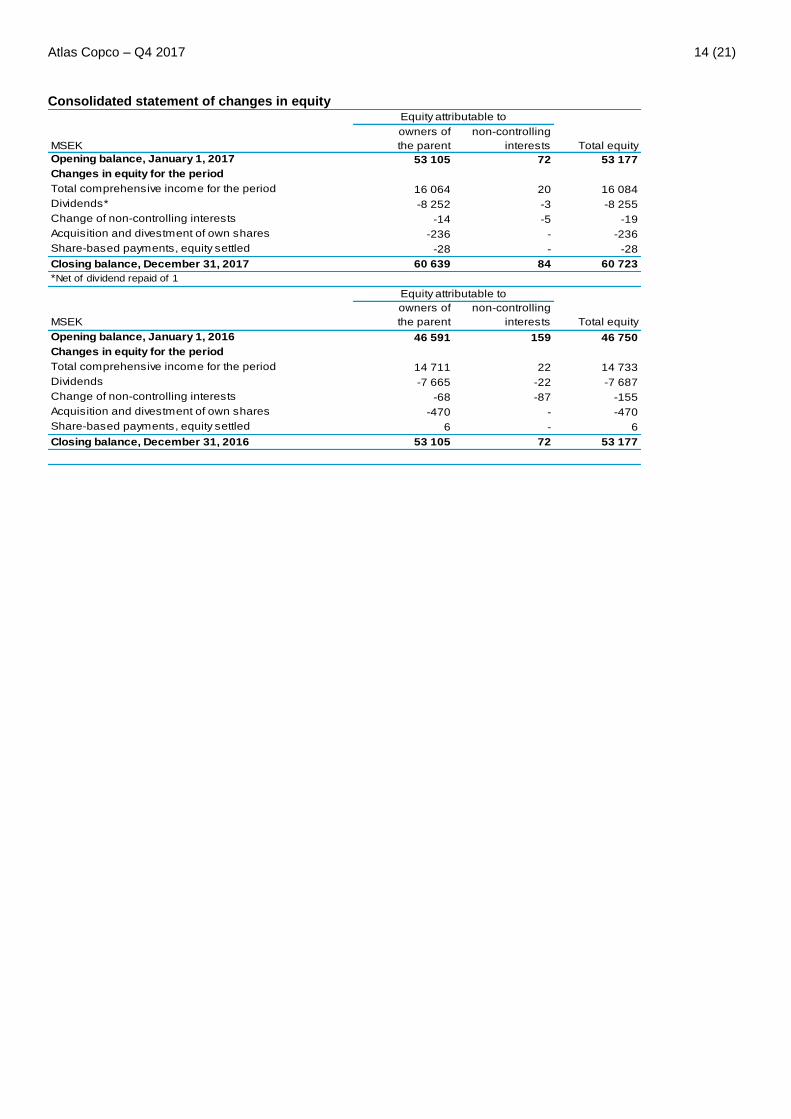
Consolidated statement of changes in equity
MSEK
owners of
the parent
non-controlling
interests Total equity
Opening balance, January 1, 2017 53 105 72 53 177
Changes in equity for the period
Total comprehensive income for the period 16 064 20 16 084
Dividends* -8 252 -3 -8 255
Change of non-controlling interests -14 -5 -19
Acquisition and divestment of own shares -236 - -236
Share-based payments, equity settled -28 - -28
Closing balance, December 31, 2017 60 639 84 60 723
*Net of dividend repaid of 1
MSEK
owners of
the parent
non-controlling
interests Total equity
Opening balance, January 1, 2016 46 591 159 46 750
Changes in equity for the period
Total comprehensive income for the period 14 711 22 14 733
Dividends -7 665 -22 -7 687
Change of non-controlling interests -68 -87 -155
Acquisition and divestment of own shares -470 - -470
Share-based payments, equity settled 6 - 6
Closing balance, December 31, 2016 53 105 72 53 177
Equity attributable to
Equity attributable to
Page 15
Atlas Copco – Q4 2017 15 (21)
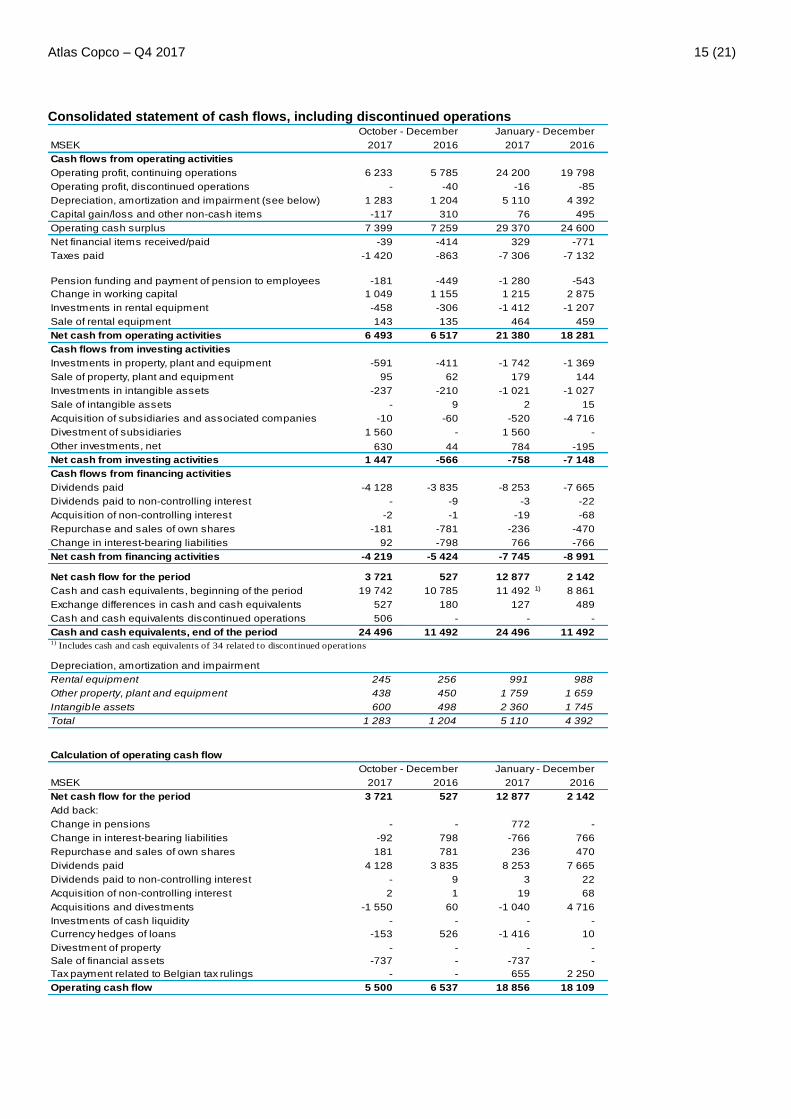
Consolidated statement of cash flows, including discontinued operations
MSEK 2017 2016 2017 2016
Cash flows from operating activities
Operating profit, continuing operations 6 233 5 785 24 200 19 798
Operating profit, discontinued operations - -40 -16 -85
Depreciation, amortization and impairment (see below) 1 283 1 204 5 110 4 392
Capital gain/loss and other non-cash items -117 310 76 495
Operating cash surplus 7 399 7 259 29 370 24 600
Net financial items received/paid -39 -414 329 -771
Taxes paid -1 420 -863 -7 306 -7 132
Pension funding and payment of pension to employees -181 -449 -1 280 -543
Change in working capital 1 049 1 155 1 215 2 875
Investments in rental equipment -458 -306 -1 412 -1 207
Sale of rental equipment 143 135 464 459
Net cash from operating activities 6 493 6 517 21 380 18 281
Cash flows from investing activities
Investments in property, plant and equipment -591 -411 -1 742 -1 369
Sale of property, plant and equipment 95 62 179 144
Investments in intangible assets -237 -210 -1 021 -1 027
Sale of intangible assets - 9 2 15
Acquisition of subsidiaries and associated companies -10 -60 -520 -4 716
Divestment of subsidiaries 1 560 - 1 560 -
Other investments, net 630 44 784 -195
Net cash from investing activities 1 447 -566 -758 -7 148
Cash flows from financing activities
Dividends paid -4 128 -3 835 -8 253 -7 665
Dividends paid to non-controlling interest - -9 -3 -22
Acquisition of non-controlling interest -2 -1 -19 -68
Repurchase and sales of own shares -181 -781 -236 -470
Change in interest-bearing liabilities 92 -798 766 -766
Net cash from financing activities -4 219 -5 424 -7 745 -8 991
Net cash flow for the period 3 721 527 12 877 2 142
Cash and cash equivalents, beginning of the period 19 742 10 785 11 492 1) 8 861
Exchange differences in cash and cash equivalents 527 180 127 489
Cash and cash equivalents discontinued operations 506 - - -
Cash and cash equivalents, end of the period 24 496 11 492 24 496 11 4921)
Includes cash and cash equivalents of 34 related to discontinued operations
Depreciation, amortization and impairment
Rental equipment 245 256 991 988
Other property, plant and equipment 438 450 1 759 1 659
Intangib le assets 600 498 2 360 1 745
Total 1 283 1 204 5 110 4 392
Calculation of operating cash flow
MSEK 2017 2016 2017 2016
Net cash flow for the period 3 721 527 12 877 2 142
Add back:
Change in pensions - - 772 -
Change in interest-bearing liabilities -92 798 -766 766
Repurchase and sales of own shares 181 781 236 470
Dividends paid 4 128 3 835 8 253 7 665
Dividends paid to non-controlling interest - 9 3 22
Acquisition of non-controlling interest 2 1 19 68
Acquisitions and divestments -1 550 60 -1 040 4 716
Investments of cash liquidity - - - -
Currency hedges of loans -153 526 -1 416 10
Divestment of property - - - -
Sale of financial assets -737 - -737 -
Tax payment related to Belgian tax rulings - - 655 2 250
Operating cash flow 5 500 6 537 18 856 18 109
October - December January - December
October - December January - December
Page 16
Atlas Copco – Q4 2017 16 (21)
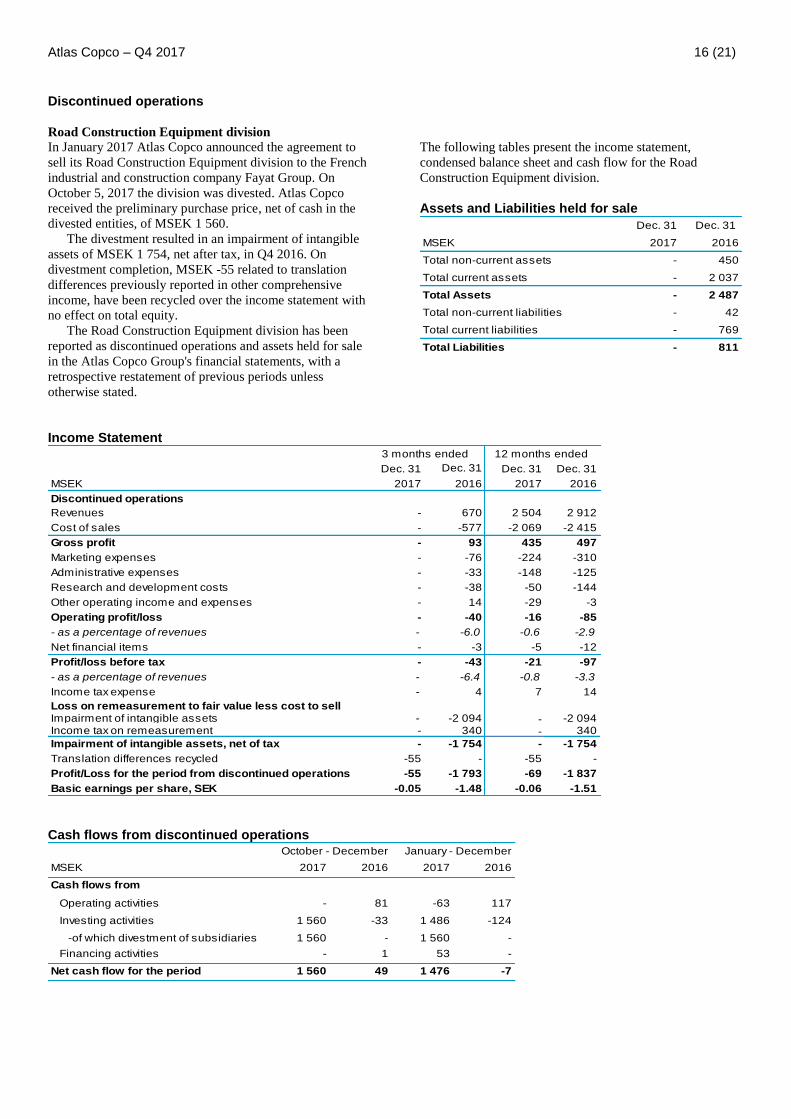
Discontinued operations
Road Construction Equipment division
In January 2017 Atlas Copco announced the agreement to
sell its Road Construction Equipment division to the French
industrial and construction company Fayat Group. On
October 5, 2017 the division was divested. Atlas Copco
received the preliminary purchase price, net of cash in the
divested entities, of MSEK 1 560.
The divestment resulted in an impairment of intangible
assets of MSEK 1 754, net after tax, in Q4 2016. On
divestment completion, MSEK -55 related to translation
differences previously reported in other comprehensive
income, have been recycled over the income statement with
no effect on total equity.
The Road Construction Equipment division has been
reported as discontinued operations and assets held for sale
in the Atlas Copco Group's financial statements, with a
retrospective restatement of previous periods unless
otherwise stated.
The following tables present the income statement,
condensed balance sheet and cash flow for the Road
Construction Equipment division.
Assets and Liabilities held for sale
Dec. 31 Dec. 31
MSEK 2017 2016
Total non-current assets - 450
Total current assets - 2 037
Total Assets - 2 487
Total non-current liabilities - 42
Total current liabilities - 769
Total Liabilities - 811
Income Statement
Dec. 31 Dec. 31 Dec. 31 Dec. 31
MSEK 2017 2016 2017 2016
Discontinued operations
Revenues - 670 2 504 2 912
Cost of sales - -577 -2 069 -2 415
Gross profit - 93 435 497
Marketing expenses - -76 -224 -310
Administrative expenses - -33 -148 -125
Research and development costs - -38 -50 -144
Other operating income and expenses - 14 -29 -3
Operating profit/loss - -40 -16 -85
- as a percentage of revenues - -6.0 -0.6 -2.9
Net financial items - -3 -5 -12
Profit/loss before tax - -43 -21 -97
- as a percentage of revenues - -6.4 -0.8 -3.3
Income tax expense - 4 7 14
Loss on remeasurement to fair value less cost to sellImpairment of intangible assets - -2 094 - -2 094Income tax on remeasurement - 340 - 340
Impairment of intangible assets, net of tax - -1 754 - -1 754
Translation differences recycled -55 - -55 -
Profit/Loss for the period from discontinued operations -55 -1 793 -69 -1 837
Basic earnings per share, SEK -0.05 -1.48 -0.06 -1.51
3 months ended 12 months ended
Cash flows from discontinued operations
MSEK 2017 2016 2017 2016
Cash flows from
Operating activities - 81 -63 117
Investing activities 1 560 -33 1 486 -124
-of which divestment of subsidiaries 1 560 - 1 560 -
Financing activities - 1 53 -
Net cash flow for the period 1 560 49 1 476 -7
October - December January - December
Page 17
Atlas Copco – Q4 2017 17 (21)
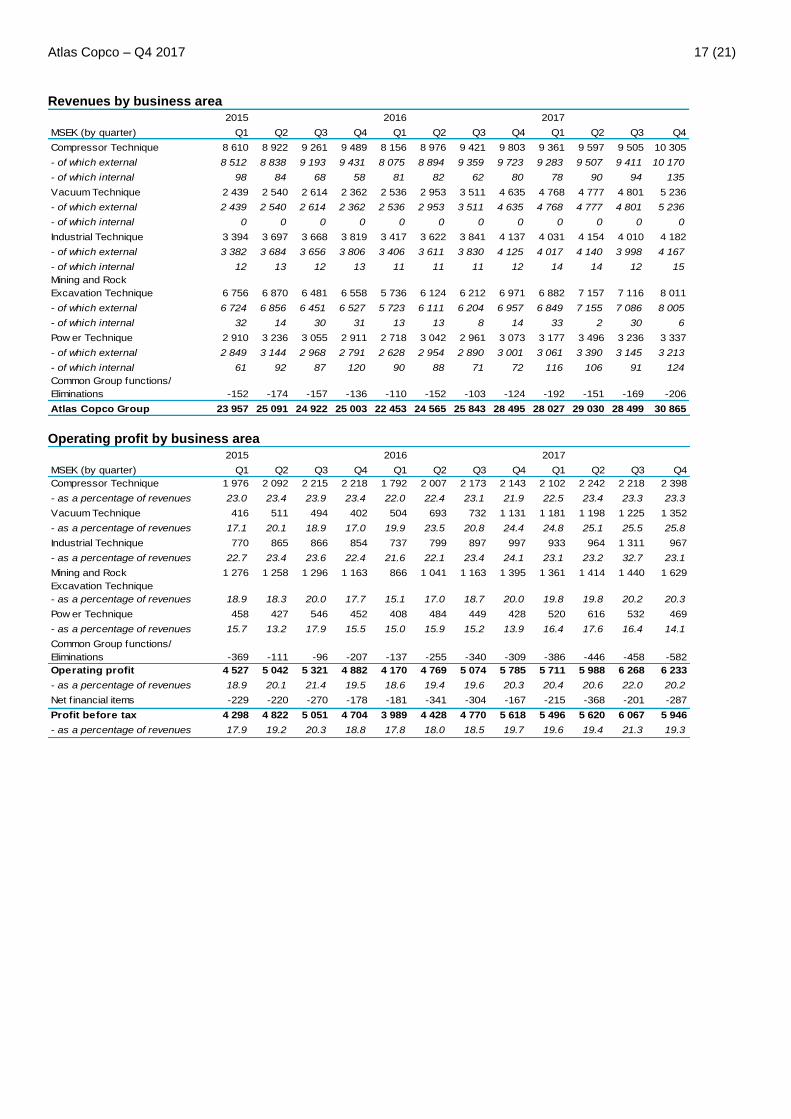
Revenues by business area 2015 2016 2017
MSEK (by quarter) Q1 Q2 Q3 Q4 Q1 Q2 Q3 Q4 Q1 Q2 Q3 Q4
Compressor Technique 8 610 8 922 9 261 9 489 8 156 8 976 9 421 9 803 9 361 9 597 9 505 10 305
- of which external 8 512 8 838 9 193 9 431 8 075 8 894 9 359 9 723 9 283 9 507 9 411 10 170
- of which internal 98 84 68 58 81 82 62 80 78 90 94 135
Vacuum Technique 2 439 2 540 2 614 2 362 2 536 2 953 3 511 4 635 4 768 4 777 4 801 5 236
- of which external 2 439 2 540 2 614 2 362 2 536 2 953 3 511 4 635 4 768 4 777 4 801 5 236
- of which internal 0 0 0 0 0 0 0 0 0 0 0 0
Industrial Technique 3 394 3 697 3 668 3 819 3 417 3 622 3 841 4 137 4 031 4 154 4 010 4 182
- of which external 3 382 3 684 3 656 3 806 3 406 3 611 3 830 4 125 4 017 4 140 3 998 4 167
- of which internal 12 13 12 13 11 11 11 12 14 14 12 15
Mining and Rock
Excavation Technique 6 756 6 870 6 481 6 558 5 736 6 124 6 212 6 971 6 882 7 157 7 116 8 011
- of which external 6 724 6 856 6 451 6 527 5 723 6 111 6 204 6 957 6 849 7 155 7 086 8 005
- of which internal 32 14 30 31 13 13 8 14 33 2 30 6
Pow er Technique 2 910 3 236 3 055 2 911 2 718 3 042 2 961 3 073 3 177 3 496 3 236 3 337
- of which external 2 849 3 144 2 968 2 791 2 628 2 954 2 890 3 001 3 061 3 390 3 145 3 213
- of which internal 61 92 87 120 90 88 71 72 116 106 91 124
Common Group functions/
Eliminations -152 -174 -157 -136 -110 -152 -103 -124 -192 -151 -169 -206
Atlas Copco Group 23 957 25 091 24 922 25 003 22 453 24 565 25 843 28 495 28 027 29 030 28 499 30 865 Operating profit by business area
2015 2016 2017
MSEK (by quarter) Q1 Q2 Q3 Q4 Q1 Q2 Q3 Q4 Q1 Q2 Q3 Q4
Compressor Technique 1 976 2 092 2 215 2 218 1 792 2 007 2 173 2 143 2 102 2 242 2 218 2 398
- as a percentage of revenues 23.0 23.4 23.9 23.4 22.0 22.4 23.1 21.9 22.5 23.4 23.3 23.3
Vacuum Technique 416 511 494 402 504 693 732 1 131 1 181 1 198 1 225 1 352
- as a percentage of revenues 17.1 20.1 18.9 17.0 19.9 23.5 20.8 24.4 24.8 25.1 25.5 25.8
Industrial Technique 770 865 866 854 737 799 897 997 933 964 1 311 967
- as a percentage of revenues 22.7 23.4 23.6 22.4 21.6 22.1 23.4 24.1 23.1 23.2 32.7 23.1
Mining and Rock
Excavation Technique
1 276 1 258 1 296 1 163 866 1 041 1 163 1 395 1 361 1 414 1 440 1 629
- as a percentage of revenues 18.9 18.3 20.0 17.7 15.1 17.0 18.7 20.0 19.8 19.8 20.2 20.3
Pow er Technique 458 427 546 452 408 484 449 428 520 616 532 469
- as a percentage of revenues 15.7 13.2 17.9 15.5 15.0 15.9 15.2 13.9 16.4 17.6 16.4 14.1
Common Group functions/
Eliminations -369 -111 -96 -207 -137 -255 -340 -309 -386 -446 -458 -582
Operating profit 4 527 5 042 5 321 4 882 4 170 4 769 5 074 5 785 5 711 5 988 6 268 6 233
- as a percentage of revenues 18.9 20.1 21.4 19.5 18.6 19.4 19.6 20.3 20.4 20.6 22.0 20.2
Net f inancial items -229 -220 -270 -178 -181 -341 -304 -167 -215 -368 -201 -287
Profit before tax 4 298 4 822 5 051 4 704 3 989 4 428 4 770 5 618 5 496 5 620 6 067 5 946
- as a percentage of revenues 17.9 19.2 20.3 18.8 17.8 18.0 18.5 19.7 19.6 19.4 21.3 19.3
Page 18
Atlas Copco – Q4 2017 18 (21)
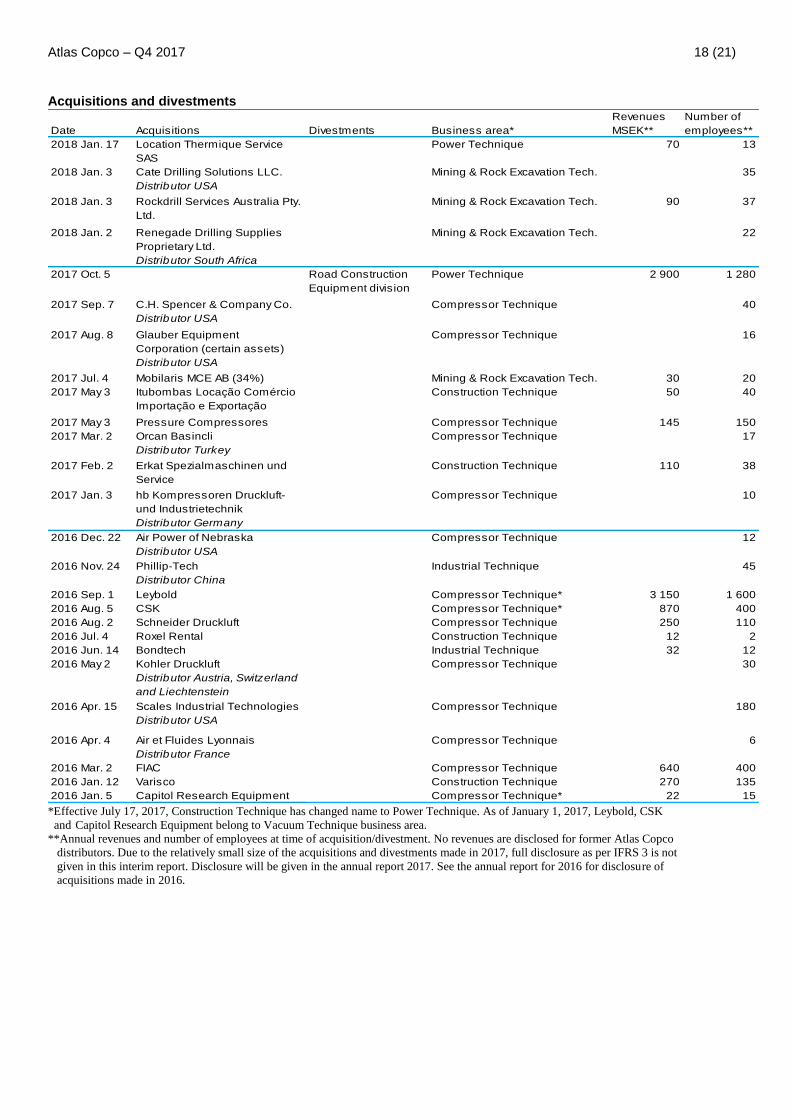
Acquisitions and divestments Revenues Number of
Date Acquisitions Divestments Business area* MSEK** employees**
2018 Jan. 17 Location Thermique Service
SAS
Power Technique 70 13
2018 Jan. 3 Cate Drilling Solutions LLC.
Distributor USA
Mining & Rock Excavation Tech. 35
2018 Jan. 3 Rockdrill Services Australia Pty.
Ltd.
Mining & Rock Excavation Tech. 90 37
2018 Jan. 2 Renegade Drilling Supplies
Proprietary Ltd.
Distributor South Africa
Mining & Rock Excavation Tech. 22
2017 Oct. 5 Road Construction
Equipment division
Power Technique 2 900 1 280
2017 Sep. 7 C.H. Spencer & Company Co.
Distributor USA
Compressor Technique 40
2017 Aug. 8 Glauber Equipment
Corporation (certain assets)
Distributor USA
Compressor Technique 16
2017 Jul. 4 Mobilaris MCE AB (34%) Mining & Rock Excavation Tech. 30 20
2017 May 3 Itubombas Locação Comércio
Importação e Exportação
Construction Technique 50 40
2017 May 3 Pressure Compressores Compressor Technique 145 150
2017 Mar. 2 Orcan Basincli
Distributor Turkey
Compressor Technique 17
2017 Feb. 2 Erkat Spezialmaschinen und
Service
Construction Technique 110 38
2017 Jan. 3 hb Kompressoren Druckluft-
und Industrietechnik
Distributor Germany
Compressor Technique 10
2016 Dec. 22 Air Power of Nebraska
Distributor USA
Compressor Technique 12
2016 Nov. 24 Phillip-Tech
Distributor China
Industrial Technique 45
2016 Sep. 1 Leybold Compressor Technique* 3 150 1 600
2016 Aug. 5 CSK Compressor Technique* 870 400
2016 Aug. 2 Schneider Druckluft Compressor Technique 250 110
2016 Jul. 4 Roxel Rental Construction Technique 12 2
2016 Jun. 14 Bondtech Industrial Technique 32 12
2016 May 2 Kohler Druckluft
Distributor Austria, Switzerland
and Liechtenstein
Compressor Technique 30
2016 Apr. 15 Scales Industrial Technologies
Distributor USA
Compressor Technique 180
2016 Apr. 4 Air et Fluides Lyonnais
Distributor France
Compressor Technique 6
2016 Mar. 2 FIAC Compressor Technique 640 400
2016 Jan. 12 Varisco Construction Technique 270 135
2016 Jan. 5 Capitol Research Equipment Compressor Technique* 22 15
*Effective July 17, 2017, Construction Technique has changed name to Power Technique. As of January 1, 2017, Leybold, CSK
and Capitol Research Equipment belong to Vacuum Technique business area.
**Annual revenues and number of employees at time of acquisition/divestment. No revenues are disclosed for former Atlas Copco
distributors. Due to the relatively small size of the acquisitions and divestments made in 2017, full disclosure as per IFRS 3 is not
given in this interim report. Disclosure will be given in the annual report 2017. See the annual report for 2016 for disclosure of
acquisitions made in 2016.
Page 19
Atlas Copco – Q4 2017 19 (21)
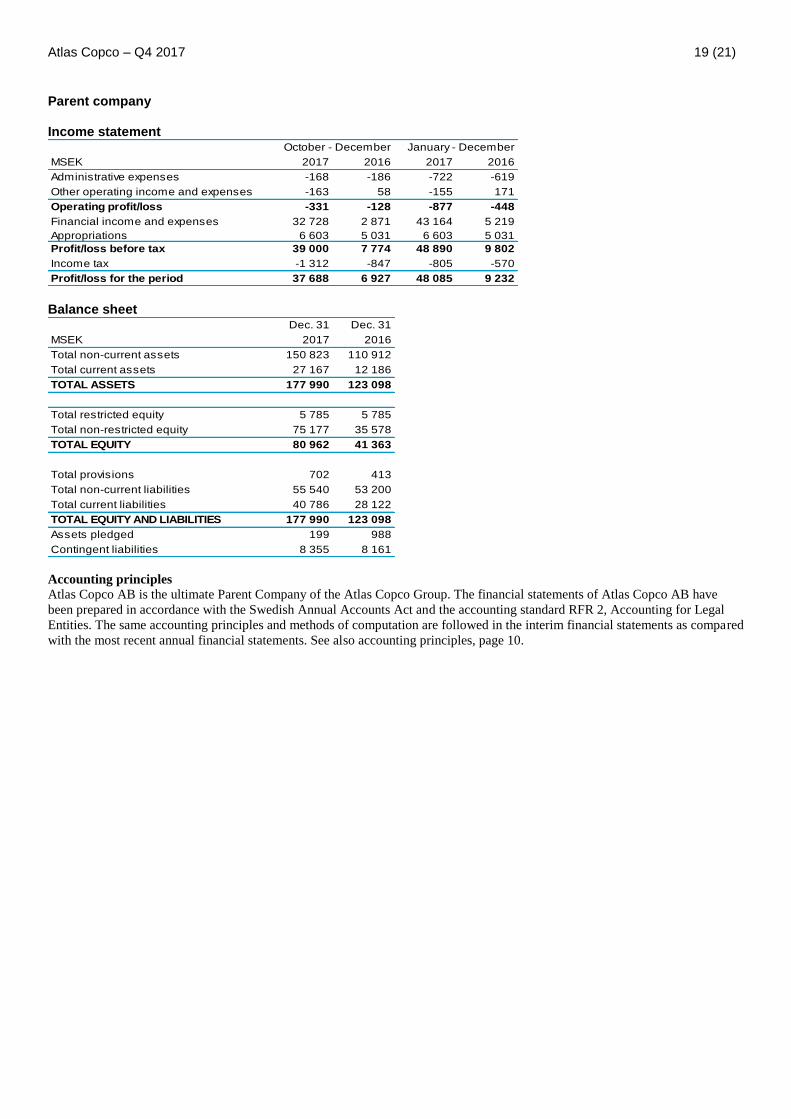
Parent company Income statement
MSEK 2017 2016 2017 2016
Administrative expenses -168 -186 -722 -619
Other operating income and expenses -163 58 -155 171
Operating profit/loss -331 -128 -877 -448
Financial income and expenses 32 728 2 871 43 164 5 219
Appropriations 6 603 5 031 6 603 5 031
Profit/loss before tax 39 000 7 774 48 890 9 802
Income tax -1 312 -847 -805 -570
Profit/loss for the period 37 688 6 927 48 085 9 232
October - December January - December
Balance sheet
Dec. 31 Dec. 31
MSEK 2017 2016
Total non-current assets 150 823 110 912
Total current assets 27 167 12 186
TOTAL ASSETS 177 990 123 098
Total restricted equity 5 785 5 785
Total non-restricted equity 75 177 35 578
TOTAL EQUITY 80 962 41 363
Total provisions 702 413
Total non-current liabilities 55 540 53 200
Total current liabilities 40 786 28 122
TOTAL EQUITY AND LIABILITIES 177 990 123 098
Assets pledged 199 988
Contingent liabilities 8 355 8 161
Accounting principles
Atlas Copco AB is the ultimate Parent Company of the Atlas Copco Group. The financial statements of Atlas Copco AB have
been prepared in accordance with the Swedish Annual Accounts Act and the accounting standard RFR 2, Accounting for Legal
Entities. The same accounting principles and methods of computation are followed in the interim financial statements as compared
with the most recent annual financial statements. See also accounting principles, page 10.
Page 20
Atlas Copco – Q4 2017 20 (21)
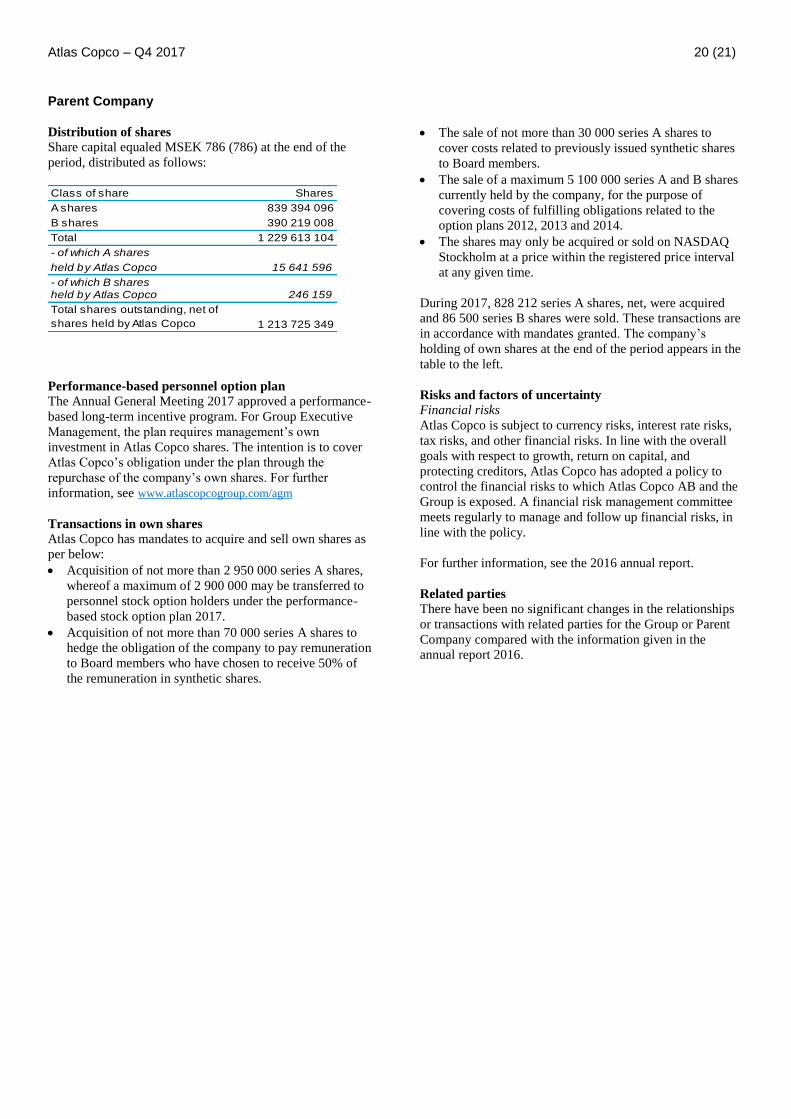
Parent Company Distribution of shares
Share capital equaled MSEK 786 (786) at the end of the
period, distributed as follows:
Class of share Shares
A shares 839 394 096
B shares 390 219 008
Total 1 229 613 104
- of which A shares
held by Atlas Copco 15 641 596
- of which B shares held by Atlas Copco 246 159
1 213 725 349
Total shares outstanding, net of
shares held by Atlas Copco
Performance-based personnel option plan
The Annual General Meeting 2017 approved a performance-
based long-term incentive program. For Group Executive
Management, the plan requires management’s own
investment in Atlas Copco shares. The intention is to cover
Atlas Copco’s obligation under the plan through the
repurchase of the company’s own shares. For further
information, see www.atlascopcogroup.com/agm
Transactions in own shares
Atlas Copco has mandates to acquire and sell own shares as
per below:
Acquisition of not more than 2 950 000 series A shares,
whereof a maximum of 2 900 000 may be transferred to
personnel stock option holders under the performance-
based stock option plan 2017.
Acquisition of not more than 70 000 series A shares to
hedge the obligation of the company to pay remuneration
to Board members who have chosen to receive 50% of
the remuneration in synthetic shares.
The sale of not more than 30 000 series A shares to
cover costs related to previously issued synthetic shares
to Board members.
The sale of a maximum 5 100 000 series A and B shares
currently held by the company, for the purpose of
covering costs of fulfilling obligations related to the
option plans 2012, 2013 and 2014.
The shares may only be acquired or sold on NASDAQ
Stockholm at a price within the registered price interval
at any given time.
During 2017, 828 212 series A shares, net, were acquired
and 86 500 series B shares were sold. These transactions are
in accordance with mandates granted. The company’s
holding of own shares at the end of the period appears in the
table to the left.
Risks and factors of uncertainty
Financial risks
Atlas Copco is subject to currency risks, interest rate risks,
tax risks, and other financial risks. In line with the overall
goals with respect to growth, return on capital, and
protecting creditors, Atlas Copco has adopted a policy to
control the financial risks to which Atlas Copco AB and the
Group is exposed. A financial risk management committee
meets regularly to manage and follow up financial risks, in
line with the policy.
For further information, see the 2016 annual report.
Related parties
There have been no significant changes in the relationships
or transactions with related parties for the Group or Parent
Company compared with the information given in the
annual report 2016.
Page 21
Atlas Copco – Q4 2017 21 (21)
This is Atlas Copco Atlas Copco is a world-leading provider of sustainable productivity
solutions. The Group serves customers with innovative
compressors, vacuum solutions and air treatment systems,
construction and mining equipment, power tools and assembly
systems. Atlas Copco develops products and service focused on
productivity, energy efficiency, safety and ergonomics. The
company was founded in 1873, is based in Stockholm, Sweden,
and has a global reach spanning about 180 countries. In 2017,
Atlas Copco had revenues of BSEK 116 (BEUR 12) and more than
45 000 employees.
Business areas
Atlas Copco has five business areas. The business areas are
responsible for developing their respective operations by
implementing and following up on strategies and objectives to
achieve sustainable, profitable growth.
The Compressor Technique business area provides compressed
air solutions; industrial compressors, gas and process compressors
and expanders, air and gas treatment equipment and air
management systems. The business area has a global service
network and innovates for sustainable productivity in the
manufacturing, oil and gas, and process industries. Principal
product development and manufacturing units are located in
Belgium, the United States, China, India, Germany and Italy.
The Vacuum Technique business area provides vacuum products,
exhaust management systems, valves and related products. The
main markets served are semiconductor and scientific as well as a
wide range of industrial segments including chemical process
industries, food packaging and paper handling. The business area
has a global service network and innovates for sustainable
productivity in order to further improve its customers’
performance. Principal product development and manufacturing
units are located in the United Kingdom, Czech Republic,
Germany, South Korea, China and Japan.
The Industrial Technique business area provides industrial power
tools and systems, industrial assembly solutions, quality assurance
products, software and service through a global network. The
business area innovates for sustainable productivity for customers
in the automotive and general industries, maintenance and vehicle
service. Principal product development and manufacturing units
are located in Sweden, Germany, Hungary, the United States,
United Kingdom, France and Japan.
The Mining and Rock Excavation Technique business area
provides equipment for drilling and rock excavation, a complete
range of related consumables and service through a global network.
The business area innovates for sustainable productivity in surface
and underground mining, infrastructure, civil works, well drilling
and geotechnical applications. Principal product development and
manufacturing units are located in Sweden, the United States,
Canada, China and India.
The Power Technique business area provides air, power and flow
solutions through products such as mobile compressors, pumps,
light towers and generators, along with a number of
complementary products. It also offers specialty rental and
provides services through a dedicated, global network. Power
Technique innovates for sustainable productivity across multiple
industries, including construction, manufacturing, oil and gas and
exploration drilling. The business area is headquartered in
Belgium. Principal product development and manufacturing units
are located in Europe, Asia, South America and North America.
Vision, mission and strategy
The Atlas Copco Group’s vision is to become and remain First in
Mind—First in Choice® of its customers and other principal
stakeholders. The mission is to achieve sustainable, profitable
growth. Sustainability plays an important role in Atlas Copco’s
vision and it is an integral aspect of the Group’s mission. An
integrated sustainability strategy, backed by ambitious goals, helps
the company deliver greater value to all its stakeholders in a way
that is economically, environmentally and socially responsible.
For further information
• Analysts and investors
Daniel Althoff, Vice President Investor Relations
Phone: +46 8 743 95 97 or +46 768 99 95 97
[email protected]
• Media
Ola Kinnander, Media Relations Manager
Phone: +46 8 743 80 60 or +46 70 347 24 55
[email protected]
Conference call for the fourth-quarter 2017
A presentation for investors, analysts and media will be held on
January 26, 2018 at 3.00 PM CET.
The dial-in numbers are:
• Sweden: +46 8 566 426 62
• UK: +44 20 300 898 02
• US: +1 855 753 2235
The conference call will be broadcasted live via the Internet. Please
visit our website for link and presentation material:
http://www.atlascopcogroup.com/investor-relations
The webcast and a recorded audio presentation will be
available on our homepage following the call.
Annual General Meeting 2018
The Annual General Meeting for Atlas Copco AB will be held
April 24, 2018 at 4 PM CEST in Aula Medica, Nobels väg 6,
Solna, Sweden.
First-quarter report 2018
The Q1 2018 report will be published on April 25, 2018.
(Silent period starts March 27, 2018)
Second-quarter report 2018
The Q2 2018 report will be published on July 20, 2018.
(Silent period starts June 21, 2018)
Third-quarter report 2018
The Q3 2018 report will be published on October 19, 2018.
(Silent period starts September 20, 2018)
Fourth-quarter report 2018
The Q4 2018 report will be published on January 28, 2019.
(Silent period starts December 31, 2018)
This information is information that Atlas Copco AB is obliged to make public pursuant to the EU Market Abuse Regulation and the Securities Markets Act. The information was submitted for publication, through the agency of the contact person set out above, at 12.00 CET on January 26, 2018.