70
System and Development Charge Workshop Board of Directors Bend Metro Park & Recreation District January 29, 2019 www.bendparksandrec.org

System and Development Charge Workshop
Board of Directors
Bend Metro Park & Recreation District
January 29, 2019
www.bendparksandrec.org
Our Vision To be a leader in building a community connected to nature, active lifestyles and one another. Our Mission To strengthen community vitality and foster healthy, enriched lifestyles by providing exceptional park and recreation services. We Value
Excellence by striving to set the standard for quality programs, parks and services through leadership, vision, innovation and dedication to our work. Environmental Sustainability by helping to protect, maintain and preserve our natural and developed resources. Fiscal Accountability by responsibly and efficiently managing the financial health of the District today and for generations to come. Inclusiveness by reducing physical, social and financial barriers to our programs, facilities and services. Partnerships by fostering an atmosphere of cooperation, trust and resourcefulness with our patrons, coworkers and other organizations. Customers by interacting with people in a responsive, considerate and efficient manner. Safety by promoting a safe and healthy environment for all who work and play in our parks, facilities and programs. Staff by honoring the diverse contributions of each employee and volunteer, and recognizing them as essential to accomplishing our mission.
District Office l Don Horton, Executive Director
799 SW Columbia St., Bend, Oregon 97702 | www.bendparksandrec.org | (541) 389-7275

Board of Directors – Special Call Meeting
SDC Workshop – January 29, 2019 Bend Park and Recreation District Office – Conference Rm A
Agenda Workshop: 5:00 – 8:00 p.m.
1) System and Development Charge (SDC) Methodology Update – Deb Galardi, Galardi Rothstein Group
Accessible Meeting/Alternate Format Notification This meeting location is accessible. Sign and other language interpreter service, assistive listening devices, materials in alternate format or other accommodations are available upon advance request. Please contact the Executive Assistant no later than 24 hours in advance of the meeting at [email protected] or 541-706-6151. Providing at least 2 business days’ notice prior to the meeting will help ensure availability
1
BOARD AGENDA COMMUNICATION
AGENDA DATE: January 29, 2019 SUBJECT: System Development Charge (SDC) Methodology
Update STAFF RESOURCE: Michelle Healy, Planning & Park Services Director Lindsey Lombard, Administrative Services Director Sarah Bodo, Park Planner GUEST PRESENTER: Deb Galardi, Galardi Rothstein Group PREVIOUS BOARD ACTION: Discussion on November 6, 2018 ACTION PROPOSED: None
STRATEGIC PLAN: Theme: Financial Stewardship Objective: Invest in the Future Initiative: Maintain the District’s Systems Development Charge
(SDC) program to ensure adequate funding for future facility needs to meet population growth.
BACKGROUND At the November 6, 2018 Board meeting, staff presented information on the initial progress of the SDC methodology update, including the project timeline, outreach plan and initial outreach summary. Since then, the project team has completed additional outreach and began analysis. The January 29 work session will be an opportunity for the Board to review the analysis, discuss options with the project team and provide direction on several policy decisions. Stakeholder Outreach Through three stakeholder meetings, additional one-on-one meetings, and emails, the project team gathered stakeholder feedback to be considered. The attached Stakeholder Engagement Report, meeting summaries and comment log contain details on participants and comments (see attachment 4). Additionally, SDC information is available on the BPRD website: http://www.bendparksandrec.org/about/sdc/ Analysis and Policy Direction The consultant, Deb Galardi, a principal with Galardi Rothstein Group developed three technical memos which address the initial goals of the SDC update and stakeholder comments (see attachments 1 through 3). The technical memos build upon each other, and should be reviewed in order. Options presented have implications for equity, administrative feasibility and defensibility.
2

• Technical Memo 1—Potential Nonresidential SDC. Currently, the District only assesses SDCs on residential development; this includes transient residents such as hotel room and dormitory occupants. The technical memo identifies the following for the Board’s consideration: how to estimate nonresidential use of park facilities, park facility types to include in a nonresidential assessment, and potential categories of nonresidential development.
• Technical Memo 2—Residential SDC Assessment Options. Currently, the District has three
SDC rates, one for single family units (including duplexes, mobile homes, and townhomes), multifamily units, and guest rooms (including hotel rooms, Accessory Dwelling Units (ADUs), dormitories, and senior living units). This technical memo identifies the following options for the Board’s consideration: whether to tier the SDC rate based on dwelling unit size for single family and multifamily units and which size measurement to use (number of bedrooms or square feet) for assessment.
• Technical Memo 3—Parks Level of Service (LOS), Preliminary Unit Costs and SDCs. This
memo presents the existing and planned future LOS for the SDC planning period (through 2028), and the implications for the calculation of reimbursement and improvement SDC cost basis. Two options are provided for how growth costs may be allocated across different types of development: Option 1: Residential development and overnight visitors only, and Option 2: Option 1 plus nonresidential development.
The three memos provide options in response to project goals and stakeholder comments. The goals addressed are:
• Determine whether a nonresidential SDC would be appropriate to equitably distribute the cost of new park facilities serving growth.
• Include indoor and outdoor facility acquisition and development costs in the cost base. • Establish new SDC rates consistent with current rates in recognition of balancing community
needs with local affordability concerns. Please note that additional project goals—addressing whether to exclude affordable housing units from SDCs, coordination with the City and County on administrative issues, and considering deferral or loan options—will not be part of the January 29 agenda, but instead will be addressed in the future. Project Timeline The goal is to complete the project by the end of May 2019. This timeline helps the District in planning for future project development and also provides the development community more certainty around future SDC fees and procedures. A general timeline of the SDC methodology project is as follows:
• October 2018-April 2019: Research, stakeholder conversations, and analysis • February 2019: 90-day written notice public hearing (as required by Oregon Revised
Statutes (ORS)) • March 2019: Draft report and 60-day public review (as required by ORS) • May 21, 2019: Public hearing and methodology adoption pending Board approval • July 2019: Expected implementation
3
BUDGETARY IMPACT The SDC methodology has impacts on future SDC fee revenues and the funding available for SDC eligible projects in the District’s adopted Capital Improvement Plan and in the newly adopted Comprehensive Plan. STAFF RECOMMENDATION None MOTION None ATTACHMENTS Please review the 3 technical memos in order as they build upon each other.
1. Technical Memo 1—Potential Nonresidential SDC Methodology 2. Technical Memo 2—Residential SDC Assessment Options 3. Technical Memo 3—Parks LOS and Preliminary Unit Costs and SDCs 4. Stakeholder Engagement Summary Report and Attachments
4
1
TECHNICAL MEMORANDUM #1
PREPARED FOR: Michelle Healy and Sarah Bodo, Bend Park and Recreation District
PREPARED BY: Deb Galardi, Galardi Rothstein Group
SUBJECT: Potential Nonresidential SDC Methodology
DATE: January 23, 2019
Introduction The Bend Park and Recreation District (District or BPRD) last updated its System Development Charges (SDCs) in 2009, following adoption of various planning documents in 2005 (Parks, Recreation and Green Spaces Comprehensive Plan) and 2008 (Neighborhood Parks Plan and Trails Master Plan). In July 2018, the District completed the Bend Park & Recreation District Comprehensive Plan (Comprehensive Plan), and now is considering changes to the Parks SDC methodology to bring it into alignment with the new Comprehensive Plan and current policy framework. This memorandum addresses one of the key methodological issues to be addressed in the SDC update: the evaluation of an SDC for nonresidential land uses. The District’s current SDC is assessed to residential development and guest lodging facilities only.
This memorandum outlines approaches to nonresidential parks SDCs currently used in the industry, and applies the recommended approach to preliminary data specific to BPRD. The following issues are addressed:
1. Residential equivalency basis
2. Park types, and
3. SDC assessment basis
Each issue is discussed below, followed by a preliminary recommendation.
1. Equivalency Basis Inclusion of nonresidential development in a parks SDC methodology is common practice in Oregon and throughout the country. Nonresidential development creates demand for parks through employees (living inside or outside the District) that use parks in conjunction with commuting, lunch or other breaks during the workday, company picnics, or other activities, and through overnight visitors that come to the area to recreate or otherwise participate in park-related activities in conjunction with their visit.
While the general nexus between nonresidential development and park system capacity needs is broadly accepted, specific assumptions of how much park usage may be attributable to nonresidential development relative to residential development vary across jurisdictions, and often reflect local policy considerations. The impact on parks from employees and visitors relative to residents is referred to as the “residential equivalency.” For example, the District’s current methodology assumes that a visitor
5

Nonresidential SDC Memorandum
2
staying overnight in a commercial lodging facility has an equivalency of 1.0 – meaning that each visitor has the same potential impact on the park system during their visit as a resident.
An assumed equivalency of 1.0 for overnight visitors is consistent with some other agencies in Oregon (for example Hood River and Eugene). However, most jurisdictions assume that the residential equivalency for employees is less than 1.0, and generally not more than 0.5 for parks SDC development purposes1. The two most common methods for establishing residential equivalencies are: 1) actual use, and 2) hours of opportunity models. Each is discussed below.
1.1 Actual Use The “actual use” model bases the nonresidential parks SDC on surveys or reservation systems, which provide data on the proportionate use of parks by residents to employees or visitors associated with nonresidential development. Examples of this approach can be found in California, Oregon, Arizona, and British Columbia. Intercept Surveys Actual use models most commonly utilize the results of “intercept” surveys, where in-person interviews are conducted within parks to determine what portion of park use relates to residents vs. nonresidential employees or visitors. In Oregon, the most comprehensive intercept survey for parks SDC purposes was conducted in 2004 by the City of Eugene2. The survey included a wide range of park types (e.g., neighborhood, natural area, community, and linear parks), and included interviews of people accessing the parks by bike and other travel modes. The results of the survey indicated a clear statistical relationship between nonresidential land uses and park usage ranging from 13.6 percent to 31.1 percent of total park usage, depending on which factors were considered:
• Upper end of range: attribute nonresidential origins and destinations to nonresidential development. 31.1 percent of survey respondents cited work or a commercial establishment as an origin, destination, or both of their park visit, or entailed an overnight stay at a commercial establishment.
• Lower end of range: attribute usage where proximity to nonresidential development was a primary factor. 13.6 percent of respondents cited work or a commercial establishment as a factor in their visit to the park.
With feedback from a citizen advisory committee, the City of Eugene established that the nonresidential park use share should be at the lower end of the survey range. Specifically, the portion of park use attributable to nonresidential development was assumed to be 16.4 percent, and was used to determine an “equivalent population” of park users which when divided into the City’s existing number of employees, yielded an equivalency per employee of 0.36. The results of Eugene’s survey were in-line with surveys in other states which indicate an equivalency range per employee of 0.2 (City of Phoenix, Arizona) to 0.5 (e.g., cities of Redwood City and Glendale, California).
Reservation Data A comprehensive survey process can be time-consuming and expensive; therefore, some jurisdictions utilize local park reservation system data in order to establish proportionate use between residential and nonresidential development. A number of communities in Oregon have relied on park reservation
1 A parks impact fee study conducted for the City of Santa Monica in 2013 found the range of equivalency factors for employees to be between 0.2 and 0.5 2 City of Eugene Parks and Recreation Facilities’ User Survey (Quantec, September 3, 2004).
6

Nonresidential SDC Memorandum
3
system data to establish a nonresidential nexus for purposes of establishing SDCs (e.g., Wilsonville, Lebanon, and Hillsboro.) A disadvantage of the latter approach is that data is generally limited to larger parks only, given that reservations are primarily tracked for community or regional parks. Application of this approach by the City of Wilsonville resulted in a residential equivalency of approximately 0.20 per employee.
1.2 Hours of Opportunity The “hours of opportunity” model establishes estimated park usage based on the number of hours different types of users have available during the day to visit parks. It assumes that employees – both resident and nonresident – have the opportunity to utilize parks during the weekdays for a limited time (generally right before or after work, and during breaks). In comparison, residents are assumed to have potential use of parks during non-work or school hours (for employed adults or school age children), or throughout the day (in the case of residents who are unemployed or otherwise not in the work force). Nonresident employees are generally assumed to have the lowest potential park use opportunity due to the need to travel from outside the service area.
This type of model may be applied rather simplistically – with a fixed number of hours per week assumed available for park use year-round for non-workers and workers inside or outside the area – or, based on a more complex set of assumptions about park use by season and user category. Examples of the more simplistic model application include:
• City of Gladstone, OR which assumes 40 hours a week (8 hours/day X 5 days) potential park use for all employees (inside and outside the area), compared to 112 hours assumed for non-workers and 72 hours for working adults (an average of 92 hours between the two non-employee groups). Based on these assumptions and the relative population of workers vs. non-workers, the city’s residential equivalency per employee is 0.43 (40 hours available employees/92 hours average non-employees)3.
• City of Belmont, TX which assumes only 10 hours per week of park use per employee, relative to 112 hours for residents, so an equivalency of slightly less than 0.1.
Typical detailed assumptions for a seasonally-adjusted hours of opportunity model are provided in Table A-1 (in the Appendix). This model and the specific assumptions shown in Table A-1 are used in a number of cities and park districts in Oregon, including the cities of Portland, Woodburn, and Tigard, and Tualatin Hills and North Clackamas parks and recreation districts. The resulting residential equivalency from this approach varies based on the demographics of the specific service area, and whether the nonresidential development impact includes both workers living inside the service district and outside (as in the case of Portland and Woodburn), or just outside the area (as in the case of Tigard and Tualatin Hills). The residential equivalency in these examples typically ranges from about 0.1 to 0.2.
2. Park Types Park SDC methodologies vary in terms of which park types are charged to nonresidential developments. Some communities exclude nonresidential developments entirely from parks SDCs, while others include all or a portion of park types. Examples of communities that include all parks types are the cities of Eugene, Portland, and Wilsonville. For those communities that exclude a subset of parks from the fees of nonresidential development, neighborhood parks are the most commonly excluded, as their location or planning basis may be more focused on residential development. For communities (like Eugene) that
3 City of Gladstone Parks System Development Charge Methodology Report, FCS Group (March 2018).
7
Nonresidential SDC Memorandum
4
base nonresidential SDCs on actual use, as estimated by intercept surveys, the nonresidential SDCs tend to include all park types, as actual use may be attributable to nonresidential development.
3. Assessment Basis Parks SDCs are assessed based on the number of people associated with a particular development; in the case of nonresidential parks SDCs, people are measured by employees or overnight visitors (in the case of commercial lodging facilities). Oregon SDC law prohibits assessment of SDCs based on the actual number of employees hired by a business as of a specific date, or addition of employees that do not otherwise require new construction or new use of an existing structure (Oregon Revised Statute 223.301). Therefore, nonresidential parks SDCs are generally assessed based on building square footage, and standard employee density assumptions (number of employees per 1000 square feet) for different types of construction.
Approaches to land use groupings vary by jurisdiction, as do data sources for employee density assumptions. For example, in Davis, California, the City uses two nonresidential categories, with 3.08 persons per 1000 square feet in commercial land uses, and 0.80 persons per 1000 square feet in industrial land uses. Phoenix, Arizona has three nonresidential categories, with 2.5 persons per 1000 square feet in retail land uses, 3.3 persons per 1000 square feet for office land uses, and 1.7 persons per 1000 square feet in industrial land uses. Other communities, including Woodburn, Tualatin, Oregon City, and North Clackamas, base their land use categories on the Portland Metro “Employment Density Study” (from 1999) which includes more than 20 land use categories.
Preliminary Recommendations In selecting approaches to development of parks SDC for nonresidential development, the District will need to balance various considerations, including equity, administrative feasibility, and defensibility. The following preliminary recommendations are provided for the District’s consideration:
1 Equivalency basis – Apply the hours of opportunity model for employees (specifically, using the more conservative seasonally-weighted hourly assumptions, and applied only to outside-District employees). A model based on actual use may be the most defensible and equitable when supported by local data; however, conducting a comprehensive usage survey is time-consuming and expensive. The hours of opportunity approach is the most common approach used currently in Oregon, in part because of limited data needs (i.e., information on population and employment that is readily available from the United States Census Bureau). Limiting the assumed nonresidential impact to outside-District employees reduces the overall nonresidential equivalency and eliminates the perception that inside District employees are being double-charged as both residents and employees (a concern raised early on by stakeholders.)
Preliminary application of this model to the District’s population and employment data (see Appendix Tables A-2 and A-3) results in an equivalency of 0.126, which is on the lower range of typical equivalencies overall (0.1-0.5), but well within the typical range of agencies that apply this more conservative approach (0.1-0.2).
In addition, it is recommended that the District continue to use an equivalency of 1.0 for overnight visitors in commercial lodging facilities, which is consistent with other tourist type communities (like Hood River).
2 Park types -- Include all types of parks. Given the proximity of many neighborhood parks to nonresidential land uses in the District’s service area, there is not a compelling reason to exclude any park types from nonresidential assessment. Coupled with the recommendation to use the most
8

Nonresidential SDC Memorandum
5
conservative equivalency basis, inclusion of all park types in the nonresidential SDC cost balances equity and affordability considerations.
3 Assessment basis – Limit the number of nonresidential categories to 3-5, drawing on employee density assumptions from recent economic development planning data in Oregon. Having a more detailed list of development types generally adds administrative complexity, without necessarily improving overall equity.
Table 1 provides an illustration of potential SDCs for nonresidential development based on the District’s current SDC of $3,206 per person, a residential equivalency of 0.126, and employee density assumptions from a recent Portland Metro Urban Growth Report4. As shown in Table 1, based on the current SDC per person, the nonresidential SDCs would range from $218 to $1,152 per 1,000 sq. ft. of building area. The District’s current single family residential SDC per dwelling unit is $7,949.
Table 1 BPRD SDC Analysis Sample Nonresidential SDC per 1,000 sq. ft.1
Category Employees/
1,000 sq. ft. 2 SDC/ 1,000
sq. ft.
Office 2.9 $1,152 Retail 2.0 $806 Industrial/Institutional 1.7 $672 Warehousing 0.5 $218
1Based on current SDC of $3,206 per person and residential equivalency of 0.126 2 Metro Urban Growth Report Appendix 6 (Rev. 10/2015) based on outer ring (lowest) densities
4 Based on outer ring (the lowest of 3) densities, which includes cities of Hillsboro, Gresham, and Wilsonville, and other outer portions of Clackamas, Multnomah and Washington counties. Excludes Portland Central City and inner ring areas like cities of Beaverton, Lake Oswego and Milwaukie which likely have higher densities than BPRD’s service area. By comparison, the employee density figures for inner ring areas are assumed to range from 0.8 (warehousing) to 3.33 (office).
9
6
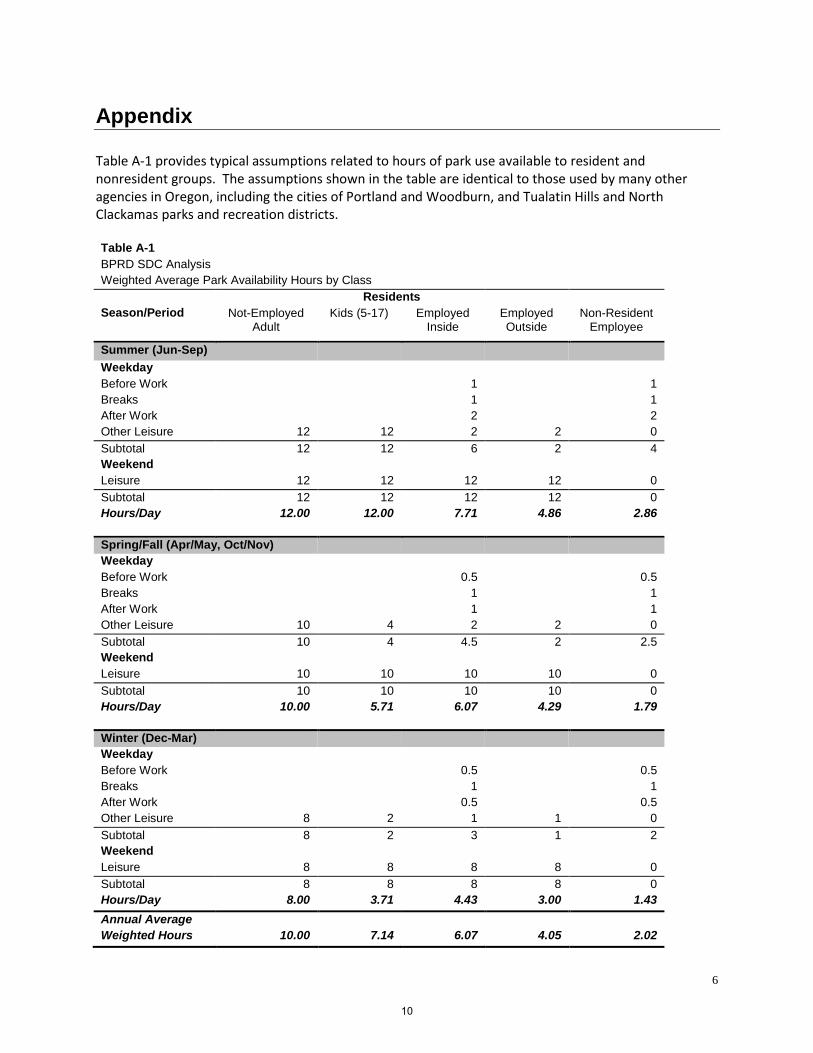
Appendix Table A-1 provides typical assumptions related to hours of park use available to resident and nonresident groups. The assumptions shown in the table are identical to those used by many other agencies in Oregon, including the cities of Portland and Woodburn, and Tualatin Hills and North Clackamas parks and recreation districts. Table A-1 BPRD SDC Analysis Weighted Average Park Availability Hours by Class
Residents Season/Period Not-Employed
Adult Kids (5-17) Employed
Inside Employed Outside
Non-Resident Employee
Summer (Jun-Sep) Weekday Before Work 1 1 Breaks 1 1 After Work 2 2 Other Leisure 12 12 2 2 0 Subtotal 12 12 6 2 4 Weekend Leisure 12 12 12 12 0 Subtotal 12 12 12 12 0 Hours/Day 12.00 12.00 7.71 4.86 2.86
Spring/Fall (Apr/May, Oct/Nov) Weekday Before Work 0.5 0.5 Breaks 1 1 After Work 1 1 Other Leisure 10 4 2 2 0 Subtotal 10 4 4.5 2 2.5 Weekend Leisure 10 10 10 10 0 Subtotal 10 10 10 10 0 Hours/Day 10.00 5.71 6.07 4.29 1.79
Winter (Dec-Mar) Weekday Before Work 0.5 0.5 Breaks 1 1 After Work 0.5 0.5 Other Leisure 8 2 1 1 0 Subtotal 8 2 3 1 2 Weekend Leisure 8 8 8 8 0 Subtotal 8 8 8 8 0 Hours/Day 8.00 3.71 4.43 3.00 1.43 Annual Average Weighted Hours 10.00 7.14 6.07 4.05 2.02
10

Nonresidential SDC Memorandum
7
Preliminary Application of Hours of Opportunity Model to BPRD Demographic Data5 Tables A-2 provides the demographic data used to determine the seasonally-weighted average number of hours available for park use per person per day for residents (7.22) and nonresident employees (2.02). Table A-2 BPRD SDC Analysis Estimation of Potential Park Use
Avg. Hours Person Category Persons1 Per person/day2 Hours/Day Residents Kids (5-17) 13,600 7.14 97,110 Non-Employed Adults 24,801 10.00 247,985 Employed Adults Work In City 24,974 6.07 151,592 Work out of City 12,274 4.05 49,676 Subtotal 75,649 7.223
546,363
Nonresidents Employed Adults 22,076 2.02 44,668 1U.S. Census 2015 DP03, DP05, and On the Map Inflow Outflow analysis 2 From Table A-1 3 Weighted average calculated by dividing the total resident person hours/day by the total residents
Tables A-3 shows the calculation of the residential equivalency per employee based on the assumptions in Table A-1 and A-2, and the portion of employees that work in the area, but live outside (47 percent). The residential equivalency of 0.126 is the product of the nonresident employee usage factor (0.28) and the outside area employee factor (0.47). Table A-3 BPRD SDC Analysis Residential Equivalency per Employee
Category Value Factor Average Hours/person/day Resident weighted average 7.22 Nonresident employee 2.02 0.28 Employees working in BPRD Area 1 Living inside area 24,974 Living outside area 22,076 0.47 Total 47,050
Residential Equivalency per Employee (0.28 X 0.47) = 0.126 1U.S. Census 2015 On the Map Inflow Outflow analysis
5 The data contained in this appendix were produced by computer spreadsheets where numbers extend beyond the decimal places shown in these tables, so slight variations exist due to rounding.
11
TECHNICAL MEMORANDUM #2
PREPARED FOR: Michelle Healy and Sarah Bodo, Bend Park and Recreation District
PREPARED BY: Deb Galardi, Galardi Rothstein Group
SUBJECT: Residential SDC Assessment Options
DATE: January 23, 2019
Introduction The Bend Park and Recreation District (District or BPRD) last updated its System Development Charges (SDCs) in 2009. In July 2018, the District completed the Bend Park & Recreation District Comprehensive Plan (Comprehensive Plan), and now is considering changes to the Parks SDC methodology to bring it into alignment with the new Comprehensive Plan and current policy framework. This memorandum addresses one of the key methodological issues to be addressed in the SDC update: SDC assessment options for residential land uses. The District’s current SDC is assessed uniformly to each dwelling unit of a particular type (i.e., single family, multifamily, group housing).
This memorandum outlines approaches to scaling fees for single family and multifamily dwelling units based on average household size as a potential means of enhancing the equity and, in some cases, the affordability of the SDCs. A summary of results follows, and the Appendix provides more detail on the analytical methods and data sources used.
Summary of Results Local, regional, and national data were analyzed, and the results show that the typical household size (i.e., people per dwelling unit) varies by the size of the housing unit (in either bedrooms or square footage), and the type of unit (single-family versus multifamily households). For this analysis, “local” data refers to information for the City of Bend, Oregon, and/or Deschutes County, depending on the dataset. The “single family” analysis was conducted specifically on data for single family detached units, while multifamily reflects analysis for structures with two or more attached units1.
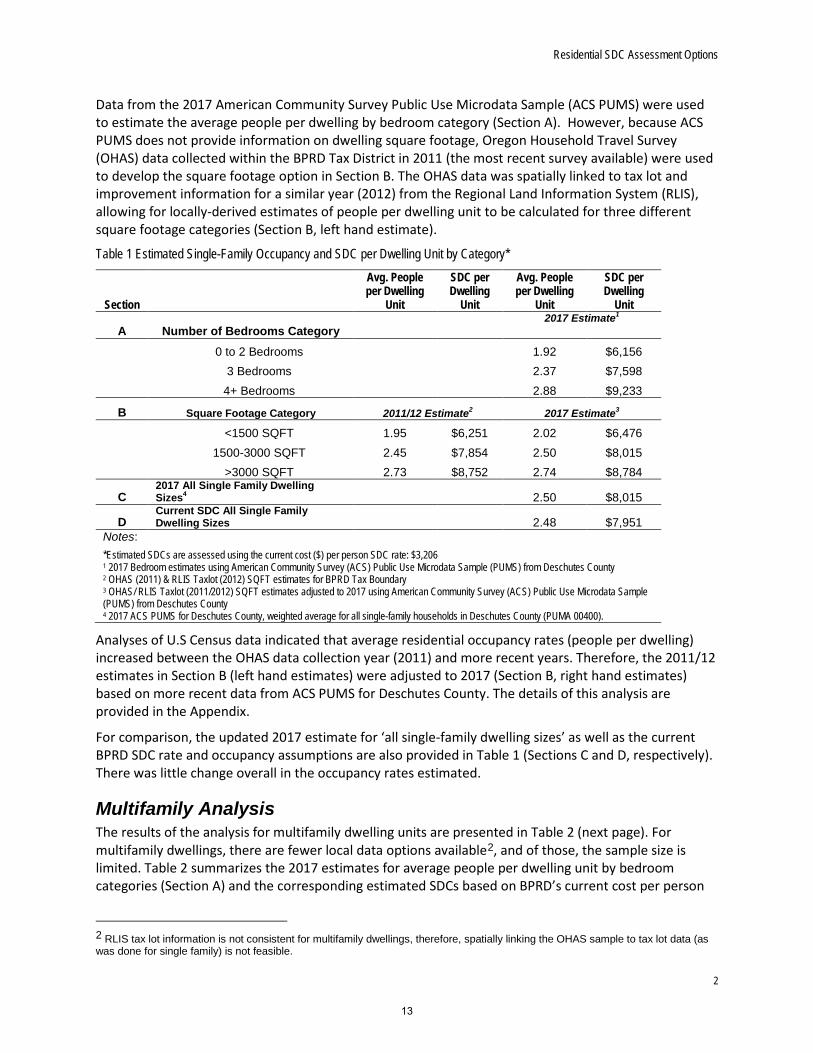
Single-Family Analysis The results of the analysis for single-family dwelling units are presented in Table 1 (next page). Specifically, two scaling options are presented (number of bedrooms in Section A, and square footage in Section B), which are compared to the current uniform rate structure (based on updated 2017 occupancy data in Section C, and 2009 SDC methodology occupancy data in Section D). To illustrate the potential impacts of each option, BPRD’s current SDC rate of $3,206 per person is applied to the average occupancy rates in each category.
1 The District’s current single family class includes duplexes; however, analysis of current data suggests that duplex occupancy is more similar to other multifamily units. Mobile homes are still considered to be part of single family for SDC purposes.
12
Residential SDC Assessment Options
2
Data from the 2017 American Community Survey Public Use Microdata Sample (ACS PUMS) were used to estimate the average people per dwelling by bedroom category (Section A). However, because ACS PUMS does not provide information on dwelling square footage, Oregon Household Travel Survey (OHAS) data collected within the BPRD Tax District in 2011 (the most recent survey available) were used to develop the square footage option in Section B. The OHAS data was spatially linked to tax lot and improvement information for a similar year (2012) from the Regional Land Information System (RLIS), allowing for locally-derived estimates of people per dwelling unit to be calculated for three different square footage categories (Section B, left hand estimate).
Table 1 Estimated Single-Family Occupancy and SDC per Dwelling Unit by Category*
Section
Avg. People per Dwelling
Unit
SDC per Dwelling
Unit
Avg. People per Dwelling
Unit
SDC per Dwelling
Unit
A Number of Bedrooms Category 2017 Estimate1
0 to 2 Bedrooms 1.92 $6,156 3 Bedrooms 2.37 $7,598 4+ Bedrooms 2.88 $9,233
B Square Footage Category 2011/12 Estimate2 2017 Estimate3
<1500 SQFT 1.95 $6,251 2.02 $6,476 1500-3000 SQFT 2.45 $7,854 2.50 $8,015 >3000 SQFT 2.73 $8,752 2.74 $8,784
C 2017 All Single Family Dwelling Sizes4 2.50 $8,015
D Current SDC All Single Family Dwelling Sizes 2.48 $7,951
Notes: *Estimated SDCs are assessed using the current cost ($) per person SDC rate: $3,206 1 2017 Bedroom estimates using American Community Survey (ACS) Public Use Microdata Sample (PUMS) from Deschutes County 2 OHAS (2011) & RLIS Taxlot (2012) SQFT estimates for BPRD Tax Boundary 3 OHAS/ RLIS Taxlot (2011/2012) SQFT estimates adjusted to 2017 using American Community Survey (ACS) Public Use Microdata Sample (PUMS) from Deschutes County 4 2017 ACS PUMS for Deschutes County, weighted average for all single-family households in Deschutes County (PUMA 00400).
Analyses of U.S Census data indicated that average residential occupancy rates (people per dwelling) increased between the OHAS data collection year (2011) and more recent years. Therefore, the 2011/12 estimates in Section B (left hand estimates) were adjusted to 2017 (Section B, right hand estimates) based on more recent data from ACS PUMS for Deschutes County. The details of this analysis are provided in the Appendix.
For comparison, the updated 2017 estimate for ‘all single-family dwelling sizes’ as well as the current BPRD SDC rate and occupancy assumptions are also provided in Table 1 (Sections C and D, respectively). There was little change overall in the occupancy rates estimated.
Multifamily Analysis The results of the analysis for multifamily dwelling units are presented in Table 2 (next page). For multifamily dwellings, there are fewer local data options available2, and of those, the sample size is limited. Table 2 summarizes the 2017 estimates for average people per dwelling unit by bedroom categories (Section A) and the corresponding estimated SDCs based on BPRD’s current cost per person
2 RLIS tax lot information is not consistent for multifamily dwellings, therefore, spatially linking the OHAS sample to tax lot data (as was done for single family) is not feasible.
13

Residential SDC Assessment Options
3
rate. These data were calculated from the ACS PUMS 2017 Deschutes County sample (left hand side) and an aggregated Deschutes & Lane County sample (right hand side) to provide a more robust sample size.
Because of limitations with the RLIS data, a multifamily square footage option (section B in Table 2) was developed using the ‘per bedroom’ estimates from Section A (Deschutes County alone, and combined Deschutes and Lane County), and bedroom and square footage data from the 2017 American Housing Survey (AHS) Pacific Region3. More detail on this analysis is included in the Appendix. Table 2 Estimated Multifamily Occupancy and SDC per Dwelling Unit by Category1
Deschutes County5 Deschutes & Lane County5
Avg. People per Dwelling Unit
SDC per Dwelling Unit
Avg. People per Dwelling
Unit SDC per
Dwelling Unit A Number of Bedrooms Category (2017)2
0 Bedrooms *1.00 $3,206 1.08 $3,462 1 Bedroom *1.13 $3,623 1.19 $3,815 2 Bedrooms 1.70 $5,450 1.93 $6,188 3+ Bedrooms *2.00 $6,412 2.50 $8,015
B Square Footage Category (2017)3
<750 SQFT 1.22 $3,911 1.32 $4,232 750-1000 SQFT 1.50 $4,809 1.67 $5,354 1000-1500 SQFT 1.71 $5,482 1.99 $6,380 >1500 SQFT 1.72 $5,514 2.02 $6,476
C 2017 All Multifamily Dwelling Sizes4 1.70 $5,450 1.75 $5,611
D Current SDC All Multifamily Dwelling Sizes 2.32 $7,438
Notes: 1Current SDC per person: $3,206 per person 2 2017 Estimate from American Community Survey Public Use Microdata Sample (ACS PUMS) for Deschutes County 3 2017 Estimate from the ACS PUMS weighted by the distribution of households across bedrooms by square footage category using the 2017 American Housing Survey, Pacific region 4 2017 ACS PUMS for Deschutes County, weighted average for all multifamily households 5 Deschutes (PUMA 00400); Lane (PUMA 00703, 00704, 00705). * Small sample size.
For comparison, the updated 2017 estimate for ‘all multifamily dwelling sizes’ as well as the current BPRD SDC rate and occupancy assumptions are also provided in Table 2 (Sections C and D, respectively). Unlike the single-family data, the 2017 multifamily occupancy rates (for both Deschutes County alone, and for Deschutes and Lane County combined) show a significant decline from the occupancy rates reported in the current SDC methodology.
Considerations In selecting among approaches for assessment of parks SDC for residential development, the District will need to balance various considerations, including equity, administrative feasibility, and defensibility. The analysis summarized in Tables 1 and 2, along with data compiled for over a dozen metropolitan areas across the country (presented in Appendix, Table A-11) support the general notion that household size
3 A limitation of AHS data is that it cannot be disaggregated into specific zones or urban context designations (urban, suburban, rural, etc.).
14

Residential SDC Assessment Options
4
increases with the size of the dwelling unit (as measured by either bedrooms or square footage). And, since parks SDCs are assessed based on number of people, a scaled residential fee structure – with higher fees for larger dwellings -- may enhance the overall equity of the SDC methodology.
In determining which specific set of occupancy assumptions are most defensible for assessing SDCs by dwelling size for BPRD’s service area, it is important to consider both the data collection area, as well as the sample size; a small sample based on local data may be less defensible than a more robust sample that includes information from other areas, assuming reasonably consistent development density characteristics. All of the options presented in Table 1 are supported by local data with reasonable sample sizes. However, the local data limits the ability to further disaggregate within the categories provided, due to more limited sample sizes. If BPRD desires a more refined classification system, additional data (from outside the local area) would need to be considered.4
As discussed previously, available local data for multifamily is significantly more limited, such that reliance on local data alone is not recommended. To overcome the data limitations, Table 2 provides an aggregated Deschutes/Lane county option for both bedrooms and square footage. The results of the aggregated bedroom option align reasonably well with the “Not in Metropolitan Area” results in Table A-11 of the Appendix (a way to further ground-truth the assumptions). A further complication with the multifamily analysis is the need to use broader “Pacific Region” data in developing a link between bedroom occupancy data and a system based on square footage. With the decline in the average overall household occupancy rate for multifamily dwellings (compared to the current SDC methodology), the District should consider the relative merits of a scaled approach compared to continuing with a uniform assessment basis.
In terms of administration, all of the options presented will require more detailed information collected up-front in the permit review and assessment process. Clarity around definitions of space (e.g., what constitutes a bedroom) may also be required, depending on the approach selected. Other administrative procedures (e.g., whether to charge for additions to the original home construction) would also need to be determined. The District will need to weigh the burden of these additional administrative requirements with the perceived benefit that such a system might bring in terms of equity, and alignment with housing affordability objectives. In any of the options evaluated, consideration will need to be given to classification of other types of housing units, like group housing and accessory dwelling units.
4 For example, data from the 2017 American Housing Survey for observations “Not in a Metropolitan Area” could be used to consider additional size categories. As indicated in Table A-11 of the Appendix, data in the “Not in a Metropolitan Area” category allows for differentiation between very small homes (e.g., less than 1,000 or 750 square feet, and other homes in the <1,500 square feet category).
15

Residential SDC Assessment Options
5
Appendix This appendix provides more detail on the analysis and data sources used to develop options for scaling residential SDCs based on the number of occupants for different size categories and type of housing.
Single-Family Analysis
People per Dwelling by Number of Bedrooms The 2017 American Community Survey Public Use Microdata Sample (PUMS) for Deschutes County provides both the people per dwelling unit and the number of bedrooms for each dwelling. The average rates derived from the PUMS sample are provided in Table A-1 below.
Table A-1 Average People per Dwelling Unit by Number of Bedrooms for Single-Family Detached Units
Bedrooms per Dwelling Unit
Average People per Dwelling Unit Sample Size
0 to 2 1.92 62 3 2.37 249 4+ 2.88 107 Source: ACS PUMS (2017), Deschutes County
People per Dwelling by Square Footage By geocoding and spatially linking the 2011 Oregon Household Activity Survey (OHAS) with the 2012 taxlot and improvement information data, an estimate of people per dwelling unit by size of dwelling (square footage) for single-family units can be obtained specific to the Bend Park & Recreation District (BPRD) tax boundary. The 559 observations were then categorized into square footage (SQFT) categories and the average people per dwelling unit calculated (see Table A-2 below). In this iterative process, we begin with more disaggregate square footage categories and then aggregate based on sample size (aiming for greater than 30 observations per category) and similarities in average rate. In the beginning of analyses, both the “<1500 SQFT” and “1500-3000 SQFT” categories were disaggregated, but with similar rates (+/- 0.03 people per dwelling unit), these categories were then aggregated to simplify the interpretation and administration of a tiered schedule.
Table A-2 Average People per Dwelling Unit by Square Footage of Dwelling Unit for Single-Family Units in BPRD Tax Boundary
Square Footage Category
Average People per Dwelling Unit Sample Size
<1500 SQFT 1.95 134 1500-3000 SQFT 2.45 351 >3000 SQFT 2.73 74 Source: OHAS (2011) spatially linked with taxlot data (2012) Area: BPRD Tax Boundary
Household Size Changes Since 2011 With the perceived shift in household size, we explore how the average household size may have shifted over the past several years. In an analysis of the American Community Survey (ACS) 5-year estimates,
16
Residential SDC Assessment Options
6
the average household size for all owned/rented housing units (single family and multifamily combined) appears to have increased by approximately 0.12 people per dwelling (see Table A-3).
Table A-3 Change in Population, Housing Units, and Average Household Size (2010 to 2017) for the City of Bend
ACS Source 2010 2017 Change
A Total Population B01003 74,327 87,167 12,840 B Population in Housing Units (owned or rented) B25008 73,628 86,539 12,911 C Proportion of Population not in Housing Units calculated [ (A-B)/A ] 0.9% 0.7% -0.2% D Occupied Housing Units (owned or rented) S2501 31,596 35,311 3,715 E Total Housing Units (owned or rented) DP04 35,610 38,970 3,360 F Proportion of Housing Units Occupied calculated [ D/E ] 88.7% 90.6% 1.9% G Average Household Size calculated [ B/D ] 2.33 2.45 0.12 Sources: All sources are American Community Survey (ACS) 5-Year Estimates Area: City of Bend
It is likely that the change in people per dwelling may vary by both dwelling size (square footage or bedrooms), or housing type (single-family, multifamily, etc.), but the ACS does not disaggregate this information. To explore these differences, we examined the ACS PUMS which provides household-level information for a sample of households in the Deschutes County region broken out by dwelling type (single-family and multifamily). The single-family detached data collected nearest to the 2011 OHAS survey (2012) and most recently (in 2017) include a 357 observation and a 418 observation sample, respectively. However, the PUMS provides dwelling unit size in number of bedrooms (not SQFT).
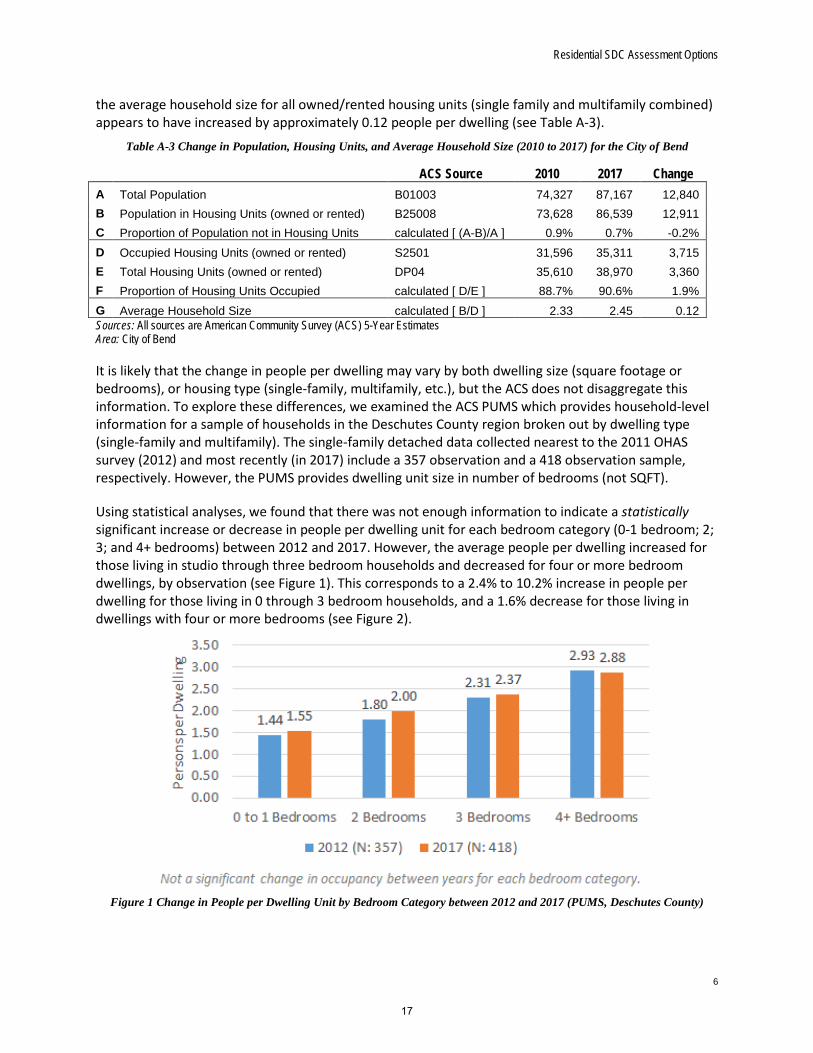
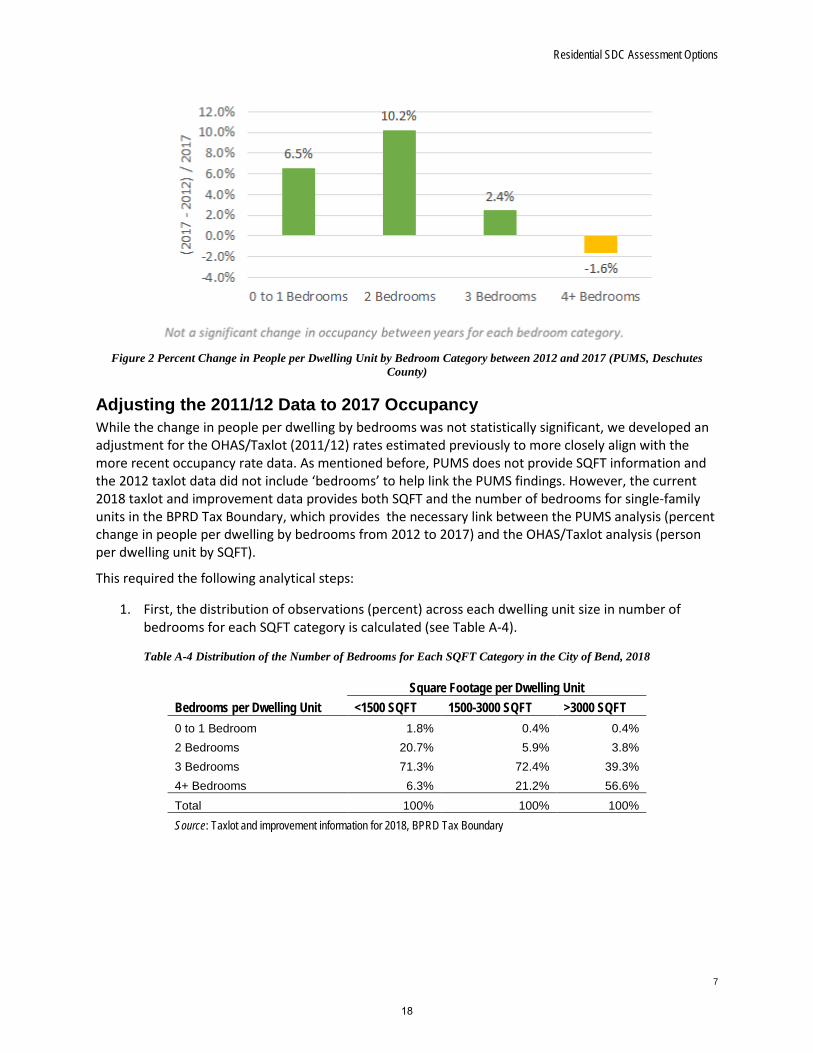
Using statistical analyses, we found that there was not enough information to indicate a statistically significant increase or decrease in people per dwelling unit for each bedroom category (0-1 bedroom; 2; 3; and 4+ bedrooms) between 2012 and 2017. However, the average people per dwelling increased for those living in studio through three bedroom households and decreased for four or more bedroom dwellings, by observation (see Figure 1). This corresponds to a 2.4% to 10.2% increase in people per dwelling for those living in 0 through 3 bedroom households, and a 1.6% decrease for those living in dwellings with four or more bedrooms (see Figure 2).
Figure 1 Change in People per Dwelling Unit by Bedroom Category between 2012 and 2017 (PUMS, Deschutes County)
17
Residential SDC Assessment Options
7
Figure 2 Percent Change in People per Dwelling Unit by Bedroom Category between 2012 and 2017 (PUMS, Deschutes
County)
Adjusting the 2011/12 Data to 2017 Occupancy While the change in people per dwelling by bedrooms was not statistically significant, we developed an adjustment for the OHAS/Taxlot (2011/12) rates estimated previously to more closely align with the more recent occupancy rate data. As mentioned before, PUMS does not provide SQFT information and the 2012 taxlot data did not include ‘bedrooms’ to help link the PUMS findings. However, the current 2018 taxlot and improvement data provides both SQFT and the number of bedrooms for single-family units in the BPRD Tax Boundary, which provides the necessary link between the PUMS analysis (percent change in people per dwelling by bedrooms from 2012 to 2017) and the OHAS/Taxlot analysis (person per dwelling unit by SQFT).
This required the following analytical steps:
1. First, the distribution of observations (percent) across each dwelling unit size in number of bedrooms for each SQFT category is calculated (see Table A-4).
Table A-4 Distribution of the Number of Bedrooms for Each SQFT Category in the City of Bend, 2018
Square Footage per Dwelling Unit
Bedrooms per Dwelling Unit <1500 SQFT 1500-3000 SQFT >3000 SQFT 0 to 1 Bedroom 1.8% 0.4% 0.4% 2 Bedrooms 20.7% 5.9% 3.8% 3 Bedrooms 71.3% 72.4% 39.3% 4+ Bedrooms 6.3% 21.2% 56.6% Total 100% 100% 100%
Source: Taxlot and improvement information for 2018, BPRD Tax Boundary
18

Residential SDC Assessment Options
8
2. Then, the percent distribution within each SQFT category is applied as a weight to the percent difference for each bedroom category calculated using PUMS (shown in both Table A-4 and Figure 2). To do this, the distributions are multiplied by the corresponding PUMS ‘percent change by bedroom category’ estimate and then summed up to derive an estimated ‘percent change’ for each SQFT category (see Table A-5).
Table A-5 Percent Change in People per Dwelling Unit by Bedroom Category between 2012 and 2017
Percent Difference from 2012 to 2017
0 to 1 Bedroom 6.5% 2 Bedrooms 10.2% 3 Bedrooms 2.4% 4+ Bedrooms -1.6% Source: ACS PUMS (2012 versus 2017) in Deschutes County Percent Difference = (2017 - 2012) / 2017
3. Finally, the ‘percent change’ for each SQFT category can be applied by OHAS/Taxlot estimates for people per dwelling unit in 2011/12 (see Table A-2, repeated in Table A-6), resulting in an adjusted estimate for people per dwelling unit for each SQFT size category (Table A-7).
Table A-6 Estimated Percent Change from 2012 to 2017 in People per Dwelling Unit by SQFT Category
Square Footage per Dwelling Unit <1500 SQFT 1500-3000 SQFT >3000 SQFT
3.8% 2.0% 0.4% Sources: ACS PUMS (2012 versus 2017) in Deschutes County; Taxlot and improvement information for 2018, BPRD Tax Boundary
Table A-7 People per Dwelling Unit: (A) OHAS/Taxlot (2011/12) Estimate; (B) 2011/12 Estimate Adjusted to 2017
Square Footage per Dwelling Unit
Option
<1500 SQFT 1500-3000 SQFT >3000 SQFT A OHAS/Taxlot (2011/12) Estimate 1.95 2.45 2.73
Source: OHAS (2011) & Taxlot (2012) in BPRD Tax Boundary B Estimate Adjusted to 2017 2.02 2.50 2.74
Sources: OHAS (2011) & Taxlot (2012) for BPRD Tax Boundary; ACS PUMS (2012 versus 2017) in Deschutes County; Taxlot and improvement information for 2018, BPRD Tax Boundary
Multifamily Analysis
People per Dwelling by Bedrooms Similarly, we can explore the average number of people per dwelling by the number of bedrooms in the ACS PUMS (2017) for multifamily observations. However, the Deschutes County sample for 3+ and 0 bedroom apartments is small (N~64) and should be used with caution. For comparison, the Deschutes
19

Residential SDC Assessment Options
9
County PUMA (00400) was aggregated with the Lane County PUMAs (00703, 00704, and 00705)5. These aggregated rates are also provided in Table A-8.
Table A-8 Average Number of People by Bedrooms for Multifamily Units
Deschutes County (PUMA 00400)
Deschutes & Lane Counties (PUMAs 00400, 00703, 00704, & 00705)
Bedrooms per Dwelling Unit
Average People per Dwelling Unit Sample Size (N) Average People
per Dwelling Unit Sample Size (N)
0 1.00 °3 1.08 38 1 1.13 °23 1.19 145 2 1.70 37 1.93 177
3+ 2.00 °1 2.50 36 Source: ACS PUMS (2017), buildings with 2+ apartments ° Note a small sample size.
People per Dwelling by Square Footage There is not currently a simple and locally-derived way to establish a relationship between people per dwelling and square footage for multifamily housing. Spatially linking the OHAS sample with taxlot (e.g., SQFT) information does not provide consistent multifamily information, and the 2017 PUMS dataset does not provide dwelling size information by square footage. The 2017 American Housing Survey (AHS) collects both SQFT and bedrooms to estimate the housing size that enables us to establish a link between the SQFT and Bedrooms estimates, but the AHS cannot be disaggregated into specific zones or urban context designations (urban, suburban, rural, etc.).
The local rates estimated per bedroom category (Table A-8) are adjusted using the distribution of households across bedroom size categories for each square footage category from the 2017 AHS sample of Pacific region multifamily households (see Table A-9).
Table A-9 Distribution of Households across Bedrooms per Dwelling for each Square Footage Category
Bedrooms per Dwelling
Square Footage per Dwelling Unit <750 SQFT 750-1000 SQFT 1000-1500 SQFT >1500 SQFT
0 14.7% 0.7% 0.1% 0.5% 1 67.1% 36.3% 9.3% 16.5% 2 16.7% 59.8% 68.3% 45.1%
3+ 1.4% 3.2% 22.3% 37.9% All 100% 100% 100% 100%
Source: 2017 American Housing Survey Area: Pacific Region Finally, the people per dwelling by bedroom rates (Table A-8) were weighted by the distribution of households across bedroom categories for each square footage category (Table A-9), and the product was summed for each square footage category resulting in an average people per dwelling rate for each
5 Census PUMA Reference: https://www2.census.gov/geo/maps/dc10map/PUMA_RefMap/st41_or/puma4100705/DC10PUMA4100705_000.pdf
20

Residential SDC Assessment Options
10
square footage category (see Table A-10)6. This process was completed for both Deschutes County rates and the aggregated Deschutes and Lane County rates.
Table A-20 Estimated Average People per Dwelling by Square Footage Category
PUMS Sample Regions Square Footage per Dwelling Unit
<750 SQFT 750-1000 SQFT 1000-1500 SQFT >1500 SQFT Deschutes County Only 1.22 1.50 1.71 1.72 Deschutes and Lane Counties 1.32 1.67 1.99 2.02
Source: 2017 American Community Survey Public Use Microdata Sample (PUMS) from Table 10; 2017 American Housing Survey, Pacific Region.
Comparisons with Other Communities For comparisons purposes, the average people per dwelling by dwelling size (bedroom and square footage categories) were computed for all regions collected in the 2017 AHS including both single-family and multifamily dwellings (Table A-11). The bedroom and square footage categories were aggregated for parity with the local rates presented previously, but the smaller bedroom categories (0-1 and 2 bedroom single-family dwellings; 0 and 1 bedroom multifamily dwellings) were aggregated again due to small sample sizes. Most of the regions listed in Table A-11 are major metropolitan areas; however, the data set also includes a “Not in Metropolitan Area” which is likely a better comparator for the District.
6 For example, the estimated people per dwelling rate ‘<750 SQFT’ category using Deschutes County estimates only was calculated as (0 bedrooms) 1.00 * 0.147 + (1 bedroom) 1.13 * 0.671 + (2 bedrooms) 1.70 * 0.167 + (3+ bedrooms) 2.00 * 0.014 = 1.22 people per dwelling for dwellings less than 750 SQFT.
21

Table A-11 People per Dwelling by Bedroom Size and Square Footage Size of Dwelling Across Metropolitan Areas and Housing Types (AHS 2017) Single-Family Dwellings Multifamily Dwellings
Metropolitan Area Bedroom in the Dwelling
Square Footage of Dwelling Bedroom in the Dwelling
Square Footage of Dwelling
0-21 3+ <1000 1000-1500
1500-3000 >3000 0-12 2 3+ <750 750-
1000 >10003
Atlanta-Sandy Springs-Roswell, GA 1.79 2.92 1.83 2.50 2.85 3.12 1.22 2.22 3.30 1.39 1.58 2.37 Boston-Cambridge-Newton, MA-NH 1.98 2.96 1.82 2.59 2.88 3.11 1.30 2.11 3.25 1.51 1.96 2.44 Chicago-Naperville-Elgin, IL-IN-WI 2.02 3.10 2.23 2.71 3.04 3.45 1.38 2.07 3.02 1.58 1.94 2.21 Dallas-Fort Worth-Arlington, TX 2.25 2.91 2.78 2.70 2.79 3.16 1.38 2.33 3.42 1.47 1.86 2.47 Detroit-Warren-Dearborn, MI 1.79 2.78 2.21 2.45 2.79 3.15 1.23 1.93 2.31 1.44 1.48 1.99 Houston-The Woodlands-Sugar Land, TX 2.19 2.96 2.37 2.71 2.84 3.20 1.57 2.71 3.88 1.87 2.06 2.65 Los Angeles-Long Beach-Anaheim, CA 2.49 3.30 2.78 3.14 3.08 3.17 1.80 2.70 3.14 1.90 2.26 2.43 Miami-Fort Lauderdale-West Palm Beach, FL 2.16 3.06 2.31 2.70 2.99 3.21 1.43 2.17 3.12 1.71 1.90 2.20 New York-Newark-Jersey City, NY-NJ-PA 2.21 2.97 2.31 2.45 2.92 3.05 1.56 2.38 3.71 1.88 2.29 2.55 Philadelphia-Camden-Wilmington, PA-NJ-DE-MD 1.90 2.96 2.51 2.57 2.87 3.31 1.37 2.15 3.10 1.48 1.91 2.37 Phoenix-Mesa-Scottsdale, AZ 1.95 2.97 2.65 2.57 2.75 3.40 1.43 2.32 3.50 1.72 2.18 2.20 Riverside-San Bernardino-Ontario, CA 2.28 3.19 2.84 2.86 3.11 3.40 1.58 2.65 3.93 1.94 2.54 2.79 San Francisco-Oakland-Hayward, CA 2.40 3.14 2.80 2.82 3.04 3.25 1.56 2.44 3.43 1.66 2.15 2.56 Seattle-Tacoma-Bellevue, WA 1.98 2.96 2.06 2.44 2.88 3.33 1.41 2.33 3.25 1.51 2.08 2.43 Washington-Arlington-Alexandria, DC-VA-MD-WV 2.03 3.00 2.51 2.74 2.90 3.21 1.43 2.47 3.56 1.67 1.95 2.30 All other metropolitan areas 1.92 2.77 2.11 2.42 2.69 3.12 1.30 2.15 3.08 1.56 1.97 2.25 Not in a metropolitan area 1.94 2.64 2.06 2.43 2.58 2.72 1.19 1.92 3.07 1.40 1.90 2.14 Overall 1.98 2.81 2.174 2.49 2.73 3.10 1.40 2.23 3.24 1.62 2.01 2.32 Source: 2017 American Housing Survey (AHS), weighted average people per dwelling rates 1 0, 1, and 2 bedroom dwellings were aggregated due to small sample sizes. 2 0 and 1 bedroom dwellings were aggregated due to small sample sizes. 3 Categories above 1000 SQFT were aggregated due to small sample sizes. 4 The sample size for any one metropolitan region is too small to break out the single-family observations into smaller categories; however, the estimate for <750 SQFT dwellings was calculated to be 2.04 people per dwelling for all metropolitan areas (e.g., “overall”) and 1.95 people per dwelling for locations “not in a metropolitan area”.
22

1
TECHNICAL MEMORANDUM #3
PREPARED FOR: Michelle Healy and Sarah Bodo, Bend Park and Recreation District
PREPARED BY: Deb Galardi, Galardi Rothstein Group
SUBJECT: Parks LOS and Preliminary Unit Costs and SDCs
DATE: January 23, 2019
Introduction The Bend Park and Recreation District (District or BPRD) last updated its System Development Charges (SDCs) in 2009. In July 2018, the District completed the Bend Park & Recreation District Comprehensive Plan (Comprehensive Plan), and is now considering changes to the Parks SDC methodology to bring it into alignment with the new Comprehensive Plan and current policy framework. This memorandum addresses one of the key methodological issues to be addressed in the SDC update: the evaluation of parks levels of service (LOS) based on the District’s existing inventory and preliminary SDC Project List.
This memorandum presents the existing and planned future LOS for the SDC planning period (through 2028), and the implications for the calculation of reimbursement and improvement SDC cost bases. In addition, two options are provided for how growth costs may be allocated across different types of development:
1. Option 1: Residential development and overnight visitors only, and
2. Option 2: Option 1 plus nonresidential development
Note: The calculations contained in this memorandum were produced by computer spreadsheets where numbers extend beyond the decimal places shown in the tables presented, so slight variations exist due to rounding; however, these variations are not material.
Level of Service The District – through adoption of the Comprehensive Plan -- is planning for acquisition and development of the parks system consistent with the community’s desired LOS. As identified in the Comprehensive Plan, LOS targets include both access goals (neighborhood/community parks within ½ mile walking distance of all residents) and park quantity goals (e.g. acres per thousand population). Both goals are considered in development of the specific projects to be included on the SDC Project List. However, for purposes of determining growth’s share of Project List costs, the SDC methodology focuses on the planned LOS for a particular park or facility as defined by the equation below:
LOSPlannedServedPopulationFuture
QPlannedQExisting=
+
23

2
Where:
Q = quantity (acres of parks, miles of trails, or area of facilities), and Future Population Served = projected 2028 population or “equivalent population”
Population and Equivalent Population Park capacity is measured in terms of people served –resident population and nonresident visitors and employees. Table 1 provides population, visitor room population, and employment data derived from recent planning documents and other data sources. For purposes of the SDC analysis, “Visitor Room Population” is the number of traveler accommodation rooms multiplied by 1.82 occupants per room (2.5 people adjusted for an average occupancy rate of 72.9 percent). Table 1 BPRD SDC Analysis Population, Employment, and Visitor Room Data
Item 2018 2028 Growth Population1 90,137 113,004 22,867 Visitor Room Population2 5,480 6,504 1,023 Employment3 48,902 58,035 9,133 1 From BPRD Comprehensive Plan 2 2018 number of rooms (3,007) from Visit Bend X average occupants per room (1.82) where occupants per room based on 2.5 persons and occupancy rate of 72.9% (RRC Associates) 3 Estimated from 2015 US Census data and 2040 Forecast; net of traveler accommodation employment
The concept of equivalent population is used to recognize different utilization levels of parks by the general population (to estimate residential development capacity needs) and employees and overnight visitors (to estimate nonresidential and overnight accommodation development needs, respectively). Consistent with the current methodology and other Oregon communities, overnight visitors are assumed to equal residents in terms of potential for park use (while visiting the District), so the assumed equivalency factor is 1.0, as shown in Table 2. However, for employees the equivalency factor is significantly less than residents (0.126 as shown in Table 2), owing to the limited number of hours available outside of work for park use. These assumptions are consistent with national survey data related to nonresidential use of parks, which generally establish nonresidential equivalency factors between 0.1 and 0.5 per employee1. Table 2 BPRD SDC Analysis Equivalent Population
Growth1 Equivalency Residential (2018-2028) Factors Equivalents2
Population 22,867 1.00 22,867 Visitor Room Population 1,023 1.00 1,023 Employment2 9,133 0.126 1,148 Total 33,023 25,039 1 See Table 1 2 See Technical Memorandum #1 Potential Nonresidential SDC Methodology
1 See Technical Memorandum #1 Potential Nonresidential Parks SDC Methodology for more information on how the equivalency factor for employees is calculated.
24

3
Current and Future LOS The Comprehensive Plan identifies the following park classifications which are included in the SDC analysis:
• Neighborhood & Community Parks • Regional Parks • Trails • Indoor Recreation Facilities
Table 3 summarizes existing park quantities for each classification for purposes of determining the existing LOS. The LOS for parks is based on acreage, while recreation trails and facilities are based on miles and square feet (SQ FT), respectively. The Comprehensive Plan also identifies planned projects designed to maintain (in the case of neighborhood & community parks) or enhance (in the case of recreation trails and facilities), the future LOS for all park users (existing and future). The planned development quantities shown in Table 3 are based on the District’s draft 10-year project list. Table 3 BPRD SDC Analysis Summary of Existing and Planned Parks and Facilities1 Existing Planned Total Unit Developed Development Future Type Type Units Units1 Units Parks Acres Neighborhood & Community 717 174 891 Regional 1,144 0.0 1,144 Recreation Trails Miles 69.8 22.9 92.7 Indoor Recreation Facilities2 SQ FT 130,901 37,603 168,504 1 Based on Preliminary 10-Year SDC Project List 2 Includes Juniper Swim and Fitness Center, Senior Center, and The Pavilion
Table 4 shows the existing and future LOS by park type based on both population (residents only) and equivalent population (combination of residents, employees, and visitors). The future LOS for neighborhood and community parks is generally consistent with the District’s target of 7.85 (based on population), as is the future LOS for regional parks which declines slightly (to 10.1), reflecting current available capacity. Table 4 BPRD SDC Analysis Existing and Planned Levels of Service (Units per 1,000)
Population1 Equivalent Population2
Unit (Units/1,000) (Units/ 1,000) Type Type Existing Future Existing Future Parks Acres Neighborhood & Community 8.00 7.88 7.0 7.0 Regional 12.70 10.10 11.2 9.0 Recreation Trails Miles 0.77 0.82 0.686 0.731 Indoor Recreation Facilities SQ FT 1,452 1,491 1,286 1,329 1 Existing and total future park quantities (Table 3) divided by 2018 and 2028 population per 1,000 (From Table 1) 2 Existing park quantities (Table 3) divided by equivalent population (from information in Tables 1 & 2.
25
4
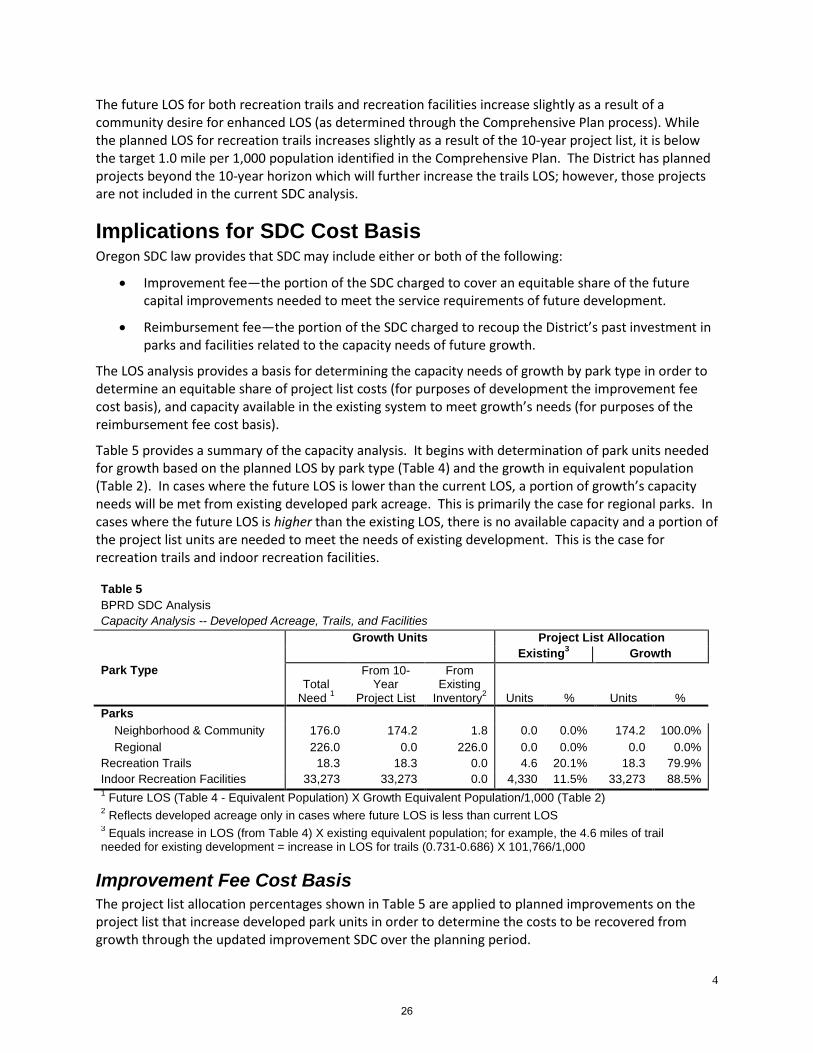
The future LOS for both recreation trails and recreation facilities increase slightly as a result of a community desire for enhanced LOS (as determined through the Comprehensive Plan process). While the planned LOS for recreation trails increases slightly as a result of the 10-year project list, it is below the target 1.0 mile per 1,000 population identified in the Comprehensive Plan. The District has planned projects beyond the 10-year horizon which will further increase the trails LOS; however, those projects are not included in the current SDC analysis.
Implications for SDC Cost Basis Oregon SDC law provides that SDC may include either or both of the following:
• Improvement fee—the portion of the SDC charged to cover an equitable share of the future capital improvements needed to meet the service requirements of future development.
• Reimbursement fee—the portion of the SDC charged to recoup the District’s past investment in parks and facilities related to the capacity needs of future growth.
The LOS analysis provides a basis for determining the capacity needs of growth by park type in order to determine an equitable share of project list costs (for purposes of development the improvement fee cost basis), and capacity available in the existing system to meet growth’s needs (for purposes of the reimbursement fee cost basis).
Table 5 provides a summary of the capacity analysis. It begins with determination of park units needed for growth based on the planned LOS by park type (Table 4) and the growth in equivalent population (Table 2). In cases where the future LOS is lower than the current LOS, a portion of growth’s capacity needs will be met from existing developed park acreage. This is primarily the case for regional parks. In cases where the future LOS is higher than the existing LOS, there is no available capacity and a portion of the project list units are needed to meet the needs of existing development. This is the case for recreation trails and indoor recreation facilities.
Table 5 BPRD SDC Analysis Capacity Analysis -- Developed Acreage, Trails, and Facilities
Growth Units Project List Allocation Existing3 Growth
Park Type Total
Need 1
From 10-Year
Project List
From Existing
Inventory2 Units % Units % Parks Neighborhood & Community 176.0 174.2 1.8 0.0 0.0% 174.2 100.0% Regional 226.0 0.0 226.0 0.0 0.0% 0.0 0.0% Recreation Trails 18.3 18.3 0.0 4.6 20.1% 18.3 79.9% Indoor Recreation Facilities 33,273 33,273 0.0 4,330 11.5% 33,273 88.5% 1 Future LOS (Table 4 - Equivalent Population) X Growth Equivalent Population/1,000 (Table 2) 2 Reflects developed acreage only in cases where future LOS is less than current LOS 3 Equals increase in LOS (from Table 4) X existing equivalent population; for example, the 4.6 miles of trail needed for existing development = increase in LOS for trails (0.731-0.686) X 101,766/1,000
Improvement Fee Cost Basis The project list allocation percentages shown in Table 5 are applied to planned improvements on the project list that increase developed park units in order to determine the costs to be recovered from growth through the updated improvement SDC over the planning period.
26

5
SDC Project List Table 6 provides a summary of the 10-year SDC project list based on the recently adopted Comprehensive Plan2. Improvement SDCs may be used to fund projects that enhance the level of performance at existing facilities (through new or expanded amenities or higher level of development, access improvements, etc.), or provide new facilities. The majority of costs (about 85 percent) are related to new park and facilities costs associated with achieving the planned LOS for each park type identified previously. For purposes of the SDC update, the new improvement fee cost basis is limited to the costs of new parks and facilities only which are needed to meet the needs of future development specifically; available SDC funds (collected from what is now existing development) will be used to fund capacity improvements at existing parks, as well as the portion of new trail and recreation facility costs associated with existing development needs. Table 6 BPRD SDC Analysis Project List Summary
Project Types Net Project
Costs1 New SDC $ Existing SDC $
New Park/Facilities Community Parks $24,745,666 $24,745,666 $0 Neighborhood Park $47,044,914 $47,044,914 $0 Recreation Facilities2 $14,428,529 $12,766,966 $1,661,563 Trails $5,966,623 $4,765,482 $1,201,141 Subtotal $92,185,732 $89,323,028 $2,862,704 Capacity Improvements at Existing Parks New or expanded amenities & access $9,325,206 $9,325,206 Improved level of performance/development $6,492,418 $6,492,418 Subtotal $15,817,624 $0 $15,817,624 Total $108,003,356 $89,323,028 $18,680,328 1 Net of budgeted fiscal year 2019 or prior funds and asset management and renovation project costs 2 Net of General Fund reserves for Larkspur Center ($12 million)
Preliminary Cost Basis Table 7 shows the development of the improvement fee cost basis for new park and facilities costs by park type from Table 6. The SDC share by park type is based on the LOS analysis presented in Table 5. The total cost basis is about $89.3 million.
2 The SDC Project List excludes asset management and other non-capacity enhancing projects.
27

6
Table 7 BPRD SDC Analysis Preliminary Cost Basis (Improvement Fee)
Type New Parks/ Facilities $1
Neighborhood Parks $47,044,914 SDC Share % 100% SDC $ $47,044,914 Community Parks $24,745,666 SDC Share % 100% SDC $ $24,745,666 Regional Parks $0.00 Recreation Trails $5,966,623 SDC Share % 79.9% SDC $ $4,765,482 Indoor Recreation Facilities $14,428,529 SDC Share % 88.5% SDC $ $12,766,966 All Parks Total $92,185,732 SDC $ $89,323,028 1From Table 6
Reimbursement Fee Cost Basis While growth capacity needs will primarily be met through future acquisition and development, there are a couple of notable exceptions: 1) prior acquisition of community park land that will be developed by the District during the 10-year planning period in order to meet part of growth’s capacity needs for community parks, and 2) existing regional parks. The preliminary reimbursement fee cost basis for these two components is shown in Table 8. Table 8 BPRD SDC Analysis Preliminary Reimbursement Fee Cost Basis
Growth Units Growth Costs
Park Type Existing
Acreage1 Acquisition
Cost
Less Outstanding
Bond Principal SDC Cost
Basis
Community2 75 $3,788,100 $3,019,996 $768,103 Regional3 226 $6,484,904 $2,583,745 $3,901,159 Total $10,273,004 $5,603,742 $4,669,262 1 Prior acquisition of Community park acreage that will be developed during the 10-year period (includes 37 acres Alpenglow, 31 acres High Desert, 2 acres Goodrich, and 5 acres Pine Nursery) ; Regional park acreage from Table 5 (Growth Units from Existing Inventory) 2 Includes purchase cost of Alpenglow and Pine Nursery; High Desert obtained through land swap, so not include in reimbursement cost basis 3 Includes purchase cost of Riley Ranch (181 acres) and Shevlin Commons (43 acres)
28

7
The District previously acquired acreage at Alpenglow Park (37 acres), Pine Nursery (5 acres), Goodrich (2 acres) and High Desert Park (31 acres), all of which will be used to meet the capacity needs of future growth. For purposes of the reimbursement fee cost basis, the acquisition cost of Alpenglow Park and the 5 acre portion of Pine Nursery is included, as High Desert park was acquired through a land swap. Because Alpenglow was funded through a District bond, the portion of the outstanding bond principal associated with the purchase is deducted from the total acquisition cost, as the remaining bond costs will be paid through taxes.
For Regional Parks, the cost basis includes recent acquisition costs for Riley Ranch and Shevlin Commons which total 224 acres. Much of other existing regional park land was donated. A portion of Riley Ranch was bond funded, so an adjustment is made to deduct outstanding bond principal from the cost basis. As shown in Table 8, the total reimbursement cost basis is about $4.7 million.
Preliminary Unit Costs The unit cost calculations begin with allocation of the growth costs between residential and nonresidential development. For SDC development purposes, park costs are allocated to residential and nonresidential development based on each group’s share of future equivalent population. As shown in Table 2, total growth in equivalent population is estimated to be 25,039, including 22,867 new residents (91 percent), 1,023 visitor room population (4%), and 1,148 nonresidential (employee) equivalents (5 percent). For purposes of developing unit costs, two options are presented: 1) allocation to all development types (including nonresidential), and 2) population and overnight visitors only.
The improvement and reimbursement cost bases are allocated accordingly to all development types (Option 1) in Table 9. Table 9 BPRD SDC Analysis SDC Unit Cost Calculation: Option 1 All Development Types
Growth Net1
Growth $ Units $/Unit $/Unit
Improvement Fee Residential $81,575,339 22,867 $3,567 Visitor Rooms $3,651,153 1,023 $3,567 Employees $4,096,536 9,133 $449 Total $89,323,028
Reimbursement Fee Residential $4,264,260 22,867 $186 Visitor Rooms $190,860 1,023 $186 Employees $214,142 9,133 $23 Total $4,669,262 Total Residential $3,754 $3,703 Visitor Rooms $3,754 $3,703 Employees $472 $465.63 1 Net of outstanding bond credit ($50.63 per equivalent person)
Table 10 (following page) shows the preliminary unit costs for Option 2.
29

8
Table 10 BPRD SDC Analysis SDC Unit Cost Calculation: Option 2 Population and Overnight Visitors Only
Growth Net1
Growth $ Units $/Unit $/Unit
Improvement Fee Growth Costs Residential $85,704,419 22,867 $3,748 Overnight Visitors $3,835,963 1,023 $3,748 Employees $0 9,133 $0 Total $89,540,382 Reimbursement Fee Growth Costs Residential $4,469,228 22,867 $195 Overnight Visitors $200,034 1,023 $195 Employees $0 9,133 $0 Total $4,669,262 Total Residential $3,943 $3,890 Overnight Visitors $3,943 $3,890 1 Net of outstanding bond credit ($53.77 per equivalent person)
The growth units for each development type are measured by people; in the case of residential growth units are equal to resident population, and in the case of travel accommodations and nonresidential the unit of measure is visitor rooms and employees, respectively. The growth in units (from Table 1) are divided into the respective share of growth costs to determine the cost per unit for improvement and reimbursement fee purposes.
As discussed previously, the District issued bonds to pay for a limited number of park improvements. The portion of outstanding bond funds associated with community and regional parks were deducted directly from the reimbursement fee cost basis. However, the District also funded a portion of existing indoor recreation facilities (the Pavilion) with bond funds; since the preliminary SDCs include indoor facility costs associated with future growth, a credit is provided against the total SDCs for the portion of outstanding bond principal associated with existing indoor recreation facility investments. The credit is calculated as the present value of future bond principal costs per equivalent population.
Preliminary SDCs SDCs are assessed to different development types based on average dwelling or room occupancy data, and employee densities (employees per thousand square feet of building area). Census data were used to establish average occupancy data for residential dwelling types and sizes3. The SDC for each development type is determined by multiplying the net cost per unit (from either Table 9 or 10), by the number of people per unit for each development type. The updated SDCs are compared to current SDCs adjusted for estimated inflation through July 2019, in order to provide a more direct comparison with the updated figures. However, the preliminary SDCs presented in Tables 11 (Option 1) and Table 12 (Option 2) on the following pages are net of a compliance or other administrative charge which will be determined for the final SDC analysis. 3 See Technical Memorandum #2: Residential SDC Assessment Options for detailed calculations.
30

9
Table 11 BPRD SDC Analysis Preliminary SDCs: Option 1 All Development Types
Development Type Updated
SDC1
Existing SDC
Inflated2 %
Change Residential ($/dwelling unit) Persons Single-Family (Avg.) 2.50 $9,258 $8,513 9% Bedrooms Category
0 to 2 Bedrooms 1.92 $7,110 $8,513 -16% 3 Bedrooms 2.37 $8,777 $8,513 3% 4+ Bedrooms 2.88 $10,665 $8,513 25%
SQ FT Category 1500 or less 2.02 $7,481 $8,513 -12% 1501-3000 2.50 $9,258 $8,513 9% over 3000 2.74 $10,147 $8,513 19%
Multifamily (Avg.) 1.70 $6,295 $7,964 -21% Bedrooms Category
0 Bedroom 1.08 $3,999 $7,964 -50% 1 Bedroom 1.19 $4,407 $7,964 -45% 2 Bedrooms 1.93 $7,147 $7,964 -10% 3+ Bedrooms 2.50 $9,258 $7,964 16%
SQ FT Category <750 SQFT 1.32 $4,888 $7,964 -39% 750-1000 SQFT 1.67 $6,184 $7,964 -22% 1000-1500 SQFT 1.99 $7,369 $7,964 -7% >1500 SQFT 2.02 $7,481 $7,964 -6%
Nonresidential Traveler Accommodation ($/room) 1.8 $6,749 $3,433 97%
Other Nonresidential ($/1,000 SQ FT) employees/1,000 SQ FT
Office 2.9 $1,330 na na Retail 2.0 $931 na na Industrial/Institutional 1.7 $776 na na Warehousing 0.5 $252 na na
1Preliminary SDC; does not include compliance or administrative costs 2Current SDC adjusted for July 1, 2019 inflation estimate
31

10
Table 12 BPRD SDC Analysis Preliminary SDCs: Option 2 Population and Overnight Visitors Only
Development Type
Updated
SDC1
Existing SDC
Inflated2 %
Change Residential ($/dwelling unit) Persons Single-Family (Avg.) 2.50 $9,724 $8,513 14% Bedrooms Category
0 to 2 Bedrooms 1.92 $7,468 $8,513 -12% 3 Bedrooms 2.37 $9,218 $8,513 8% 4+ Bedrooms 2.88 $11,202 $8,513 32%
SQ FT Category 1500 or less 2.02 $7,857 $8,513 -8% 1501-3000 2.50 $9,724 $8,513 14% over 3000 2.74 $10,658 $8,513 25%
Multifamily (Avg.) 1.70 $6,612 $7,964 -17% Bedrooms Category
0 Bedroom 1.08 $4,201 $7,964 -47% 1 Bedroom 1.19 $4,629 $7,964 -42% 2 Bedrooms 1.93 $7,507 $7,964 -6% 3+ Bedrooms 2.50 $9,724 $7,964 22%
SQ FT Category <750 SQFT 1.32 $5,134 $7,964 -36% 750-1000 SQFT 1.67 $6,496 $7,964 -18% 1000-1500 SQFT 1.99 $7,740 $7,964 -3% >1500 SQFT 2.02 $7,857 $7,964 -1%
Nonresidential Traveler Accommodation ($/room) 1.8 $7,089 $3,433 107%
1Preliminary SDC; does not include compliance or administrative costs 2Current SDC adjusted for July 1, 2019 inflation estimate
The most significant increase with the updated SDCs is for overnight visitor rooms. The current SDC methodology assumed 1.0 occupant per room; however, more recent data for the Bend area shows an average occupants per room of 2.5 persons, which when adjusted for the average occupancy rate (72.3%) is 1.8. Average SDCs for multifamily decrease significantly due to updated data on persons per dwelling unit. The rates for residential dwellings in Option 2 increase about 5 percentage points more than Option 1. The primary drivers of the increase in the updated SDCs are: 1) inclusion of indoor recreation facilities (which is about $510 per person or $1,274 per residential dwelling), and inclusion of a reimbursement fee for existing neighborhood and community park land that has been acquired for future development (about $466 per residential dwelling).
32

Parks System Development Charge (SDC)
Methodology Update
Stakeholder Engagement Report
Prepared by:
Kearns & West
For:
Bend Park &Recreation District
January 2019
33

BPRD Parks SDC Stakeholder Engagement Report Page 1
I. Introduction
System development charges (SDCs) are fees paid by developers to help fund the purchase of land and
construction of new parks, trails and recreation facilities to serve population growth. Bend Park and
Recreation District is undergoing a process to update its SDCs. As part of the process, the District is
engaging local developers and realtors, the affordable housing community, business representatives,
and other interested parties as it updates the methodology, to ensure that the update takes into
account a range of needs and concerns.
This outreach builds on the community input gathered during the two-year process to develop the new
comprehensive plan that was adopted by the District’s Board of Directors in July 2018. The new
comprehensive plan reflects the community’s park and recreation needs and preferences for the next
ten years and is the basis for the SDC project list that will accompany the new SDC methodology report
and resulting fees.
II. Overview of Public Engagement Activities
Between October 2018 and January 2019, the District held three meetings with residential and
commercial developers, affordable housing groups, realtors, builders, local agency representatives,
economists, and other interested parties to get feedback on the SDC update process. The District also
met individually with various groups and interested parties to gain further input and collected input via
email.
The stakeholder meetings included:
Meeting #1 –October 24, 2018
Introductory meeting to orient interested parties to the SDC update and hear preliminary feedback on a
range of issues including projects to be funded by SDCs, a potential nonresidential SDC, options for
supporting affordable housing goals, and administrative changes. Residential developers, homebuilders,
affordable housing groups, and agency representatives attended and provided input that the project
team is considering in the SDC update.
Meeting #2 –December 6, 2018
Meeting to review and seek input on the same information and issues as the October 24 introductory
meeting, with an expanded group of stakeholders to include commercial realtors and builders.
Multifamily developers were also invited but did not attend. The purpose of the meeting was to broaden
feedback for consideration in the SDC update process. The meeting asked for input on a range of issues,
with a specific focus on the potential nonresidential SDC option.
Meeting #3 –January 16, 2019
Meeting to share and discuss a preliminary analysis of options that address potential tiered residential
SDC by home size, potential nonresidential SDC, and project list. This meeting was a follow up to the first
two stakeholder meetings. BPRD sought feedback on the preliminary analysis and potential SDC options
in advance of presentation at the BPRD District Board meeting on January 29, 2019.
34
BPRD Parks SDC Stakeholder Engagement Report Page 2
Individual Meetings and Email Comments
In addition to the large-group discussion meetings, BPRD met with several individuals from affordable
housing groups and the development communities and received many emails from interested parties. A
log of comments from individual meetings and emails received is included as an attachment to this
report.
III. Key Themes from Stakeholder Meetings and Comments
Several key themes emerged from the various stakeholder engagement activities. Key comments are
included below. It is important to note that the stakeholder process was structured to gather input
primarily from the developer community. Due to the nuanced and technical nature of the SDC update,
as well as the extensive public input on the recently adopted Comprehensive Plan, broad public
outreach was not conducted, and the general public may have different points of view than the key
themes listed below.
Full stakeholder meeting summaries and a log of additional comments are included as an attachment to
this report.
Overall Comments on Parks SDCs and the Update Process
• It is important to ensure that SDC fees support Bend’s high quality of life and competitive
market. Participants recognize that Bend is a great place to live, and that community members
value the parks and recreational opportunities. Efforts to improve parks should be balanced
with the need to ensure affordable housing, including reasonable costs for starter homes and
workforce housing. Fees should not be so high as to discourage developers and employers from
moving into Bend due to increased cost of development or concern that employees may not be
able to afford home purchases. Some noted that Bend has some of the highest parks SDCs.
• The update process should focus on equitably distributing the cost of parks development.
While participants recognize that residents, employees, and out-of-District populations all use
parks, it is important to spread parks development costs across all users. This means that
developers should not be the only ones to shoulder the cost to develop parks; residents and
others should pay into the system as well through tax revenues and other sources.
• Some advocated for reducing the project list or otherwise reducing the SDC to decrease the
cost to developers and to make homes more affordable in Bend. Some noted that many other
factors play into making it expensive to build in Bend, such as increasing land cost, and these
other factors have a larger impact on a developer’s choice than do increased SDC fees.
• In any changes to SDCs, it will be important to coordinate with the City of Bend to ensure
consistency between Parks and City (transportation, water, and sewer) SDCs and
administrative efficiency.
35

BPRD Parks SDC Stakeholder Engagement Report Page 3
Level of Service Targets and Changes to SDC-Eligible Project Types
• Participants discussed the benefits and drawbacks of including indoor facilities as SDC-eligible
and noted that building an indoor facility is more expensive than developing a park. They
suggested using a mix of funds to build indoor facilities, not just SDCs.
• Some concern was expressed over how the level of service (LOS) targets were developed.
Participants recognized Bend’s unique recreational opportunities and community desire for
parks but were concerned about continual increases in LOS targets that would put a
corresponding greater burden on developers to fund parks projects to meet those targets. Some
suggested that if residents have an interest in higher levels of service, they should be asked to
pay for some park development through bonds and taxes. This concern was made in comparison
to previous LOS targets including the 2005 and 2012 Comprehensive Plans, rather than the
existing LOS included in the 2018 Comprehensive Plan.
Potential Nonresidential SDC
• Participants agreed that visitors and out-of-District employees have some level of impact on the
parks system; the question is how to fairly capture and assess their impact. There was concern
that a nonresidential SDC would double-charge some developments and in-District employees,
and many expressed that the nonresidential SDC should be assessed in a way that captures out-
of-District employees and visitors only.
• There was concern that the nonresidential SDC could add more complexity to SDC
administration, and this added complexity might not be worth the benefit of a relatively small
reduction in the residential SDC.
• There was concern about the accuracy of using “hours of opportunity” rather than actual user
count data on parks use by employees. Participants recognized the amount of labor required in
gathering actual use data but continued to have questions about the model.
Affordable Housing
• Overall, there was acknowledgement of the need to support both government-supported
Affordable Housing and housing that is affordable – i.e., housing that is affordable for first time
homebuyers and middle-class workers. There was support for SDC changes to support middle-
market home purchases, as well as SDC methodology changes to support Affordable Housing
programs.
• Several suggested clear definitions for what constitutes “affordable housing” and “Affordable
Housing.”
• Affordable Housing participants support an SDC exemption for Affordable Housing projects.
Other helpful strategies might be to defer collection of the SDC to sometime after occupancy, or
36
BPRD Parks SDC Stakeholder Engagement Report Page 4
a partial SDC exemption. Financing options are not as beneficial within the Affordable Housing
model.
Residential SDC Assessment Options
• Overall, participants support the District moving forward with a scaled residential SDC. They are
supportive of scaling based on square footage, whereby smaller houses pay less SDCs and
bigger houses pay more SDCs, rather than by number of bedrooms. They noted that scaling
based on number of bedrooms leads to gaming of the system. Scaling based on square footage
might be easier to administer than scaling based on number of bedrooms.
• Some noted that scaling SDCs could also help incentivize smaller homes and higher density,
which aligns with the City’s urban growth goals.
• Overall, participants support a similar square footage basis scaling for multifamily housing.
• Participants were interested in consideration of a regression analysis and including a coefficient
for square footage (i.e. SDC calculated per square foot) vs. a tiered system.
Administrative Issues
• Overall, single-family home builders and developers indicated that they do not have concerns
around time of payment of SDCs and do not have a strong desire for deferrals. On the other
hand, deferrals or incremental payment options would be beneficial for multifamily housing
developers.
• Some participants were interested in continuing to offer a discount or credit to developers that
build park facilities and amenities.
• An affordable housing participant noted that deferrals or financing support are not an effective
way to support affordable housing projects because of the way these projects are funded;
instead, exemptions or discounts for Affordable Housing developments would be helpful.
37

BPRD Parks SDC Stakeholder Engagement Report Page 5
IV. Attachments
1. Stakeholder Meeting #1 – Agenda
2. Stakeholder Meeting #1 – Meeting Summary
3. Stakeholder Meeting #2 – Agenda
4. Stakeholder Meeting #2 – Meeting Summary
5. Stakeholder Meeting #3 – Agenda
6. Stakeholder Meeting #3 – Meeting Summary
7. Additional Stakeholder Outreach Comment Log
38

Agenda BPRD System Development Charge (SDC) Methodology Update Stakeholder Introductory Meeting Wednesday, October 24, 2018, 1:30 p.m. – 3:30 p.m. Bend Park & Recreation District Office 799 SW Columbia St., Bend, OR 97702 Purpose of Meeting
• Provide information about BPRD’s SDC methodology update process • Engage community members and seek feedback on key issues • Identify additional issues for consideration in the SDC update
Agenda Items 1:30 p.m. Welcome and Introductions
Project team and participant introductions Review meeting purpose and agenda
Michelle Healy, BPRD
Sylvia Ciborowski, Kearns & West
All
1:40 p.m. Project Background and Key Issues Brief introduction of key issues that may be considered as part of the update process
Michelle Healy
1:50 p.m. Overview of SDC Methodology Update Project Review the SDC update purpose, schedule, and public engagement process
Deb Galardi, Galardi Rothstein Group
2:00 p.m. Group Discussion on Key Issues Brief presentation on key issues and topics that the SDC update may address, including:
1. Changes to SDC-eligible project types and level of service (LOS) targets in the context of the Comprehensive Plan
2. Affordable housing: ways the BPRD SDC could align with community affordable housing, and potential limitations
3. Potential nonresidential SDC: basis and how it could be assessed
4. Administrative issues: how SDCS are administered today, and options for changes in timing of collection, deferrals, etc.
Deb Galardi
Sylvia Ciborowski
3:00 p.m. Group Discussion on Additional Issues or Topics Discuss any additional topics or issues that participants would like to see addressed as part of the SDC update process
Deb Galardi
Sylvia Ciborowski
3:25 p.m. Next Steps and Action Items Discuss next steps and meeting outcomes
Sylvia Ciborowski
Michelle Healy
SDC information and the update process is at: www.bendparksandrec.org/about/sdc/
39
BPRD SDC Stakeholder Meeting 10-24-18 Summary - Final Report Page 1
Meeting Summary Parks System Development Charge (SDC) Methodology Update Stakeholder Introductory Meeting Wednesday, October 24, 2018, 1:30 p.m. – 3:30 p.m.
Bend Park & Recreation District Office
799 SW Columbia St., Bend, OR 97702
Purpose of Meeting
• Provide information about the Parks SDC methodology update process
• Engage community members and seek feedback on key issues
• Identify additional issues for consideration in the SDC update
Welcome and Introductions
Michelle Healy, Bend Parks & Recreation District (BPRD), welcomed participants and thanked them for
their engagement. She explained that the main objective of the Parks System Development Charge
(SDC) Methodology Update is to consider funding needs in the context of the recently completed
Comprehensive Plan, and then to evaluate how best to spread costs across different development types
based on system impacts.
Sylvia Ciborowski, Kearns & West, introduced herself as meeting facilitator and reviewed the agenda
and purpose of this meeting. She explained that the group is gathered as a sounding board to provide
feedback and will continue to be engaged as the process moves forward.
Meeting participants introduced themselves.
Project Background and Key Issues
Michelle gave a brief introduction on the update. She noted that policy and ordinance suggest that BPRD
conduct regular updates and last the update was completed in 2009. The Bend community has grown
tremendously since then.
The SDC update will consider a number of components, and four key issues proposed for discussion with
stakeholders today include:
1. Changes to SDC-eligible project types and level of service (LOS) targets in the context of the
Comprehensive Plan
2. Affordable housing: ways the park SDC could align with community affordable housing goals
and potential limitations
40
BPRD SDC Stakeholder Meeting 10-24-18 Summary - Final Report Page 2
3. Potential nonresidential SDC: basis and how it could be assessed
4. Administrative issues: how SDCS are administered today, and options for changes in timing of
collection, deferrals, etc.
Many of these issues were raised during the recent Comprehensive Planning process and in other
forums as issues that could be addressed in conjunction with an SDC update.
Overview of SDC Methodology Update Project
Deb Galardi, Galardi Rothstein Group, presented a high-level overview of the methodology update and
provided context for the four key issues.
Sylvia provided an overview of the stakeholder engagement process. Two stakeholder meetings are
planned (October 2018 and January 2019), and additional conversations will occur as needed to
understand concerns and gather input.
Group Discussion on the Four Key Issues Deb presented a PowerPoint presentation to provide greater context around the four key issues, and
participants discussed and asked questions. Key themes from their questions and discussion are
included below.
1. Changes to SDC-eligible project types and level of service (LOS) targets
• Participants asked about the current LOS targets, and how they compare to previous targets.
Staff noted that in the past, community and neighborhood parks were counted separately. The
LOS for neighborhood parks was reduced; it was realized how difficult it was to provide a
neighborhood park for everyone within ½ mile walking distance, and that community parks
serve the same purpose if you live within a ½ mile.
• Participants were interested in providing reimbursements for park lands already purchased or
otherwise acquired.
• Participants expressed concern that there is not a legal limit to LOS, and that the LOS could be
increased indefinitely based on community desires. It would be useful to compare the LOS in
Bend to that of comparable cities.
• Participants discussed whether it would be appropriate to use SDC revenues to build recreation
facilities. They noted that indoor facilities (such as an indoor pool), should avoid competing with
private indoor facilities. Many housing communities have built neighborhood pools and
community centers. BPRD staff agreed that the intent is not to compete with the private
market, and in fact year-round indoor swimming facilities are very expensive and the private
market usually does not provide them.
• Participants asked how BPRD will work with developers in UGB expansion areas to meet open
space requirements. BPRD staff responded that open space requirements do exist for master
41

BPRD SDC Stakeholder Meeting 10-24-18 Summary - Final Report Page 3
planned areas; if those lands can be donated to BPRD, it could help bring down the overall SDC
fee because donations help reduce project costs.
• Participants suggested that the SDC project list should correlate to areas of Bend that have a
deficit of park infrastructure. The SDC project list should be a subset of projects from the
Comprehensive Plan project list.
• Participants suggest focusing on the less expensive projects first.
• Participants expressed a desire for a fair funding strategy, in which park projects are not solely
funded by fees on builders and developers.
• Participants had questions about which projects are intended to be built with bond revenue;
which are built with SDC revenues; and whether there is any resulting offset for SDCs. BPRD staff
noted that the Larkspur community center will be partially funded by savings and partially
funded by SDC revenues. BPRD will look at other funding sources and how they may reduce SDC
fees. Staff added that BPRD has implemented two bonds in 100 years; bond revenues are
typically used to fund projects that cannot be funded through SDCs.
2. Affordable Housing
• Participants had questions about whether individual affordable housing projects can be
exempted from SDCs. It is likely that categories of development can be exempted, but not
individual projects.
• Affordable housing participants suggested that the best way to support affordable housing
projects is by exempting these projects from SDC fees, or offering a heavy discount, rather than
by offering deferral of fees. Some participants were concerned that if affordable housing
projects are offered a credit, this may result in a greater SDC share for market-rate developers
and builders. BPRD staff noted that affordable housing developments make up a very small
share of the SDC revenue source.
• Participants suggested offering an SDC credit to multifamily developers that offer community
rooms, playgrounds and other facilities, since these offerings likely reduce the impact on SDC-
funded parks projects.
• Overall, participants agreed with assessing SDCs based on square footage of homes. They noted
that a flat SDC rate incentivizes larger homes. Some noted that an SDC based on square footage
is more effective than one based on number of bedrooms; because an SDC based on the
number of bedrooms leads to creative ways to categorize rooms as dens, offices, studies, etc. so
that they are not counted as bedrooms. City and County representatives agreed that the “by
bedroom” model can lead to administrative difficulties.
• Participants recognized the need to support both affordable housing and housing that is
affordable – i.e., housing that is affordable for first time homebuyers and middle-class workers.
They suggested developing a clear definition for affordable housing, perhaps using the City’s
definition of 80% AMI for consistency. HUD also defines affordable housing and has specific
criteria for meeting affordability. Currently, SDC fees are very high for middle market housing,
42
BPRD SDC Stakeholder Meeting 10-24-18 Summary - Final Report Page 4
and participants suggest a credit to homeowners or some other adjustment in fees for this
housing type.
• A participant suggested matching up realistic SDC revenue and then assessing how to address
housing affordability.
• Participants noted that it seems that, overall, SDC fees have increased greatly over the past few
years, as compared to inflation.
• Participants agreed that it is important for BPRD and the SDC update to help address housing
affordability issues, along with other federal, state, city, and local agencies.
• There was some support for financing mechanisms that provide for flexibility in payment types,
payment over time, or other deferral schemes.
• Participants supported methods to support middle-market homes. They noted that currently,
the SDC fee for a $1 million home is the same as for a $500,000 home.
3. Potential nonresidential SDC
• Overall, participants support consideration of a nonresidential SDC. They have interest in
understanding the proposal for how the nonresidential SDC would be assessed, and on what
basis.
• Many supported an exemption for schools. There was some concern that such an exemption
would place a larger burden on other nonresidential categories.
• Some expressed concern that a nonresidential SDC seems like double-charging, since it is on top
of the residential SDC. BPRD staff responded that nonresidential units would be charged a
fraction of residential, and the intent is to capture visitors and out-of-Bend employees.
• Participants suggested that the nonresidential SDC should only be assessed on initial
construction, not on remodels or additions.
• Participants noted that the nonresidential SDC should be assessed differently for different types
of commercial developments depending on how many employees that type of development
would typically have. BPRD staff agreed and clarified that the nonresidential SDC would be
based on class of use.
• Participants agreed that visitors have an impact on the parks system; and the question is how to
fairly capture their impact and assess appropriately.
• An agency representative recommended using the ITE rate-trip generation model as a basis for
assessing SDCs. Others had concern that this model is suburban in nature and does not fit the
Bend community well. Additionally, number of trips does not seem like an appropriate nexus to
parks.
• Participants asked whether the nonresidential SDC would reduce the residential SDC, and by
how much. BPRD noted that this will be determined later in the process.
• Participants support using square footage as a basis for assessing the nonresidential SDC.
4. Administrative Issues
43

BPRD SDC Stakeholder Meeting 10-24-18 Summary - Final Report Page 5
• An affordable housing participant noted that deferrals or financing support are not an effective
way to support affordable housing projects because of the way these projects are funded;
instead, exemptions or discounts would be helpful.
• A participant suggested looking at the South Hillsboro model that allows homeowners to pay
SDCs over time and interest-free, rather than as a part of the home price. Affordable housing
participants added that while this model might be helpful for market rate housing, it would not
be helpful for affordable housing projects.
• In general, single-family home builders and developers do not have concerns around time of
payment and do not have a strong desire for deferrals. It may be that multi-family home
builders would be more interested in deferrals or incremental payment options.
• A participant suggested a discount or credit to developers that build park facilities and amenities
as part of their housing projects, such as trails, parks, HOA amenities, etc. These facilities reduce
burden on SDC-funded parks.
• A participant suggested that condominiums should be assessed at the multifamily SDC rate,
rather than the single-family home rate that is currently used. It would be helpful if the SDC
update process could provide better clarity on different categories of housing.
Next Steps and Action Items
Staff noted that it will be important to engage additional stakeholders and asked for suggestions on who
to engage. Participants provided the following suggestions:
• Chamber of Commerce
• Sunwest Builders
• Skanska
• Killian Pacific Commercial Real Estate Development
• Real estate developers and brokers
Michelle thanked participants for their time and participation at the meeting.
44

BPRD SDC Stakeholder Meeting 10-24-18 Summary - Final Report Page 6
Meeting Attendance The following individuals participated in the meeting:
Participants
• Ana Bozich – Pahlisch Homes
• Geoff Harris – Hayden Homes
• Jade Mayer – Brooks Resources
• Jim Yozamp – PacWest Homes
• John Gilbert – Pacific Crest Affordable
Housing
• Karna Gustafson – Oregon Home
Builders Association/Central Oregon
Builders Association
• Keith Wooden – Housing Works
• Paul Taylor – Bryant Lovlien & Jarvis
• Peter Russell – Deschutes County
• Ron White – Tennant Development
• Russell Grayson – City of Bend
• Scott Rohrer – Habitat for Humanity
• Tyler Neese – Central Oregon
Association of Realtors
BPRD Staff and Consultant Team
• Don Horton – Bend Park and Recreation
District
• Julie Brown – Bend Park and Recreation
District
• Lindsey Lombard – Bend Park and
Recreation District
• Michelle Healy – Bend Park and
Recreation District
• Sarah Bodo – Bend Park and Recreation
District
• Deb Galardi – Galardi Rothstein Group
• Sylvia Ciborowski – Kearns & West
Additional Comments Shared with BPRD Following the Meeting Following the meeting, BPRD received two follow up emails with additional recommendations.
• Suggestion to involve economist Damon Runberg, Compass Commercial, and Fratzke.
• Suggestion to scale fees by size and by cost, for the lower 25% or so of the new home market,
since home prices are pretty well related to the ability to pay for the home. This would help
support housing affordability.
• For nonresidential development, suggestion to exempt certain facilities, like neighborhood
parks.
• Another idea would be to only assess an SDC if the facility would be within walking distance to a
BPRD facility.
• Agreed that a percentage of the residential rate seems appropriate for nonresidential
development, and suggested census commuting data as a source.
• Suggestion to collect demographic data on park facility use by affordable housing residents to
determine whether the data supports a reduced SDC rate for affordable housing.
45

Agenda BPRD System Development Charge (SDC) Methodology Update Stakeholder Introductory Meeting Thursday, December 6, 2018, 3:00 p.m. – 5:00 p.m. Bend Park & Recreation District Office 799 SW Columbia St., Bend, OR 97702 Purpose of Meeting
• Provide information about BPRD’s SDC methodology update process • Engage community members and seek feedback on key issues, with a focus on discussion of a
potential nonresidential SDC • Identify additional issues for consideration in the SDC update
Agenda Items 3:00 p.m. Welcome and Introductions
Project team and participant introductions Review meeting purpose and agenda
Michelle Healy, BPRD
Sylvia Ciborowski, Kearns & West
All
3:10 p.m. Project Background and Key Issues Brief introduction of key issues that may be considered as part of the update process
Michelle Healy
3:20 p.m. Overview of SDC Methodology Update Project Review the SDC update purpose, schedule, and public engagement process
Deb Galardi, Galardi Rothstein Group
3:30 p.m. Group Discussion on Key Issues Brief presentation on key issues and topics that the SDC update may address, including:
1. Changes to SDC-eligible project types 2. Potential nonresidential SDC: basis and how it could be
assessed 3. Affordable housing: ways the BPRD SDC could align with
community affordable housing goals, and potential limitations 4. Administrative issues: how SDCS are administered today, and
options for changes in timing of collection, deferrals, etc.
Deb Galardi
Sylvia Ciborowski
4:30 p.m. Group Discussion on Additional Issues or Topics Discuss any additional topics or issues that participants would like to see addressed as part of the SDC update process
Deb Galardi
Sylvia Ciborowski
4:55 p.m. Next Steps and Action Items Discuss next steps and meeting outcomes
Sylvia Ciborowski
Michelle Healy
SDC information and the update process is at: www.bendparksandrec.org/about/sdc/ 46

BPRD SDC Stakeholder Meeting 12.6.18 Summary Page 1
Meeting Summary Park System Development Charge (SDC) Methodology Update Stakeholder Introductory Meeting Thursday, December 6, 2018, 3:00 p.m. – 5:00 p.m. Bend Park & Recreation District Office 799 SW Columbia St., Bend, OR 97702
Purpose of Meeting
• Provide information about the park SDC methodology update process • Engage community members and seek feedback on key issues, with a focus on discussion of a
potential nonresidential SDC • Identify additional issues for consideration in the SDC update
Welcome and Introductions
Michelle Healy and Sarah Bodo, Bend Parks & Recreation District (BPRD), welcomed participants and thanked them for their engagement. Sarah explained that the main objective of the Parks System Development Charge (SDC) Methodology Update is to consider funding needs in the context of the recently completed Comprehensive Plan, and then to evaluate how best to spread costs across different development types based on system impacts.
Sylvia Ciborowski, Kearns & West, introduced herself as meeting facilitator and reviewed the agenda and purpose of this meeting. She explained that the group is gathered as a sounding board to provide feedback and will continue to be engaged as the process moves forward.
Meeting participants introduced themselves.
Project Background and Key Issues
Sarah gave a brief introduction on the update. She noted that policy and ordinance suggest that BPRD conduct regular updates and the last update was completed in 2009. The Bend community has grown tremendously since then.
The SDC update will consider a number of components, and four key issues proposed for discussion with stakeholders today include:
1. Changes to SDC-eligible project types in the context of the Comprehensive Plan
47
BPRD SDC Stakeholder Meeting 12.6.18 Summary Page 2
2. Affordable housing: ways the park SDC could align with community affordable housing goals and potential limitations
3. Potential nonresidential SDC: basis and how it could be assessed 4. Administrative issues: how SDCS are administered today, and options for changes in timing of
collection, deferrals, etc.
Many of these issues were raised during the recent Comprehensive Planning process and in other forums as issues that could be addressed in conjunction with an SDC update.
Overview of SDC Methodology Update Project
Deb Galardi, Galardi Rothstein Group, presented a high-level overview of the methodology update and provided context for the four key issues.
Sylvia provided an overview of the stakeholder engagement process. Three stakeholder meetings are planned (October 2018, December 2018, and January 2019), and additional conversations will occur as needed to understand concerns and gather input.
Group Discussion on the Four Key Issues
Deb presented a PowerPoint presentation to provide greater context around the four key issues, and participants discussed and asked questions. Key themes from their questions and discussion are included below.
1. Changes to SDC-eligible project types
• Participants asked about the definition of a park and whether it includes indoor facilities. Deb Galardi replied that most communities do include indoor facilities in their project lists for SDCs.
• Participants asked clarifying questions around how the program measures to what extent parks and indoor facilities are used by existing residents versus new residents.
• Participants shared that including indoor facilities as SDC-eligible is a good approach. • Participants noted that an indoor facility is more expensive than a park to develop and
suggested using a mix of funds for indoor facilities, not just SDCs. • Participants asked whether there is a current deficiency in funding for parks from SDC sources.
The project team responded that this SDC update process will determine whether the SDC is sufficient. The team made some clarifying points about how past parks and indoor facility projects were paid for using a mix of general funds and SDC funding.
• Participants expressed concern about passing too high a fee on to new developers. Developers then pass that cost on to commercial lease-holders and to homeowners, which leads to affordability concerns.
48

BPRD SDC Stakeholder Meeting 12.6.18 Summary Page 3
2. Potential Nonresidential SDC
• Overall, participants wanted to be assured that there would be no “double dipping” on residents who work in the district. The non-residential SDC should be assessed in a way that captures out-of-district employees and visitors only.
• Participants asked if there is any data on actual park usage by non-residents, rather than the theoretical hours of opportunity data proposed. Staff replied that Eugene conducted intercept surveys to gather actual park use data, and the data showed that actual nonresidential park use was higher than estimated nonresidential park use that was developed using theoretical data and a nonresidential equivalency calculation. Gathering actual data is very cost and labor intensive, so it is common to use an estimated nonresidential equivalency factor.
• A participant expressed that the proposed 0.14 equivalency for the BPRD SDC seems too high. There is concern about increasing the cost of employment by adding too high of an SDC to commercial buildings, noting that it might make Bend a less desirable place to work and play.
• Participants asked how and what part of parks non-residents use, referencing Eugene’s study that found usage throughout all park types. Some noted that Eugene is a lot like Bend with the type of parks it has.
• Participants asked if SDCs are charged when a development changes to a different use, such as when an ADU changes from a long-term to short-term rental. Staff replied that this does not occur.
• A participant noted that it is more equitable to use property taxes to pay for parks because it distributes the cost evenly, rather than putting a higher burden on developers.
• Participants questioned the assumptions around how much out-of-district employees use Bend parks. For example, many if not most of Bend’s out-of-district employees travel from Redmond. Redmond has its own parks system and it is likely that those employees use Redmond parks, not Bend parks.
• One participant suggested that the SDC project team determine what the current shortfall is in SDC revenue, and then determine whether a nonresidential SDC is needed to fill the funding gap.
• Overall, participants wanted to ensure that any nonresidential SDC be equitably assessed, so that it does not create too much of a burden on developers and considers impacts on housing affordability and the cost of employment. Any SDC increases will ultimately be passed on to the end user (i.e., homebuyers and businesses).
3. Affordable Housing
• Participants supported the idea of assessing the SDC based on expected number of bedrooms. A participant suggested tiering the SDCs based on number of bedrooms vs. square feet to better reflect the number of people in the home. Staff noted that when number of bedrooms is used as the basis for assessing SDCS, buildings and developers often find creative ways to re-characterize rooms so that they do not count as bedrooms, for example, but identifying them as studies or dens.
49

BPRD SDC Stakeholder Meeting 12.6.18 Summary Page 4
• Some participants questioned whether there is a nexus between size of house and number of people that live in the home.
• Overall, participants supported using a progressive approach to offset other regressive parts of charges in the park system. They would support a square-footage basis for assessing SDCs on residential units.
4. Administrative Issues
• A participant noted that it would be helpful to delay SDC collection to the certificate of occupancy (by around 6-18 months), to delay payment of interest.
• Participants suggested that homebuyers be provided with two different costs: the cost of the home separate from the SDC. This way, the homebuyer could pay the SDC over time with potentially a different interest rate. Under this suggested approach, the builder would not have to finance the SDC during construction. BPRD could then borrow money off future SDC income streams. A participant noted that this would create a higher SDC because BPRD will then be paying off debt service.
• Participants agreed that deferring SDC payments on multi-family housing developments is helpful.
• A participant noted that the only way to truly guarantee housing price for affordable housing is through deed restriction.
• Participants discussed whether there is away to smooth out volatility in revenue stream.
Next Steps and Action Items
Staff noted that it will be important to engage developers, lenders, and smaller homeowners as the SDC update process moves forward. They asked participants for suggestions on other stakeholders to reach out to.
Staff thanked participants for their engagement and noted that the next stakeholder meeting will be held on January 16, 2019.
50
BPRD SDC Stakeholder Meeting 12.6.18 Summary Page 5
Meeting Attendance
The following individuals participated in the meeting:
Participants
• Steve Buettner – Sunwest Builders • Karna Gustafson – Oregon Home
Builders Association • Josh Lehner – Oregon Office of
Economic Analysis • Jay Lyons – Compass Commercial Real
Estate Services • Lynne McConnell – City of Bend • Damon Runberg – Oregon Employment
Department • Jennifer Stevens – Bend Chamber of
Commerce
BPRD Staff and Consultant Team
• Don Horton – Bend Park and Recreation District
• Julie Brown – Bend Park and Recreation District
• Lindsey Lombard – Bend Park and Recreation District
• Michelle Healy – Bend Park and Recreation District
• Sarah Bodo – Bend Park and Recreation District
• Betsy Tucker, Bend Park and Recreation District
• Sylvia Ciborowski – Kearns & West • Deb Galardi – Galardi Rothstein Group
51

Agenda BPRD System Development Charge (SDC) Methodology Update Stakeholder Meeting on Issue Analysis Wednesday, January 16, 2019, 1:00 p.m. – 3:00 p.m. Bend Senior Center 1600 SE Reed Market Rd, Bend, OR 97702
Purpose of Meeting • Share the preliminary analysis of SDC options including residential Parks SDC assessment options
and a potential nonresidential Parks SDC. • Engage community members and seek feedback on the preliminary analysis of options for the
Parks SDC update.
Agenda Items 1:00 p.m. Welcome and Introductions
• Project team and participant introductions • Review meeting purpose and agenda • Review timeline
Michelle Healy, BPRD
Sylvia Ciborowski, Kearns & West
1:10 p.m. Progress since Introductory Stakeholder Meetings • Review progress on the SDC public engagement process • Review preliminary Project List and LOS analysis
Michelle Healy, BPRD
Deb Galardi, Galardi Rothstein Group
1:30 p.m. Potential Nonresidential Parks SDC • Overview and discussion of the model, analysis and the
preliminary assumptions regarding a nonresidential Parks SDC
Deb Galardi
Sylvia Ciborowski
2:00 p.m. Residential Parks SDC Assessment Options • Presentation and discussion of approaches to scaling fees for
single-family and multi-family residential developments based on average household size
Deb Galardi
Sylvia Ciborowski
2:30 p.m. Final Reflections • Discuss final reflections and comments on the SDC update
options
Sylvia Ciborowski
2:50 p.m. Next Steps and Meeting Outcomes • Discuss next steps and meeting outcomes
Sylvia Ciborowski
Michelle Healy
SDC information and the update process is at: www.bendparksandrec.org/about/sdc/ 52

DRAFT_BPRD SDC Stakeholder Meeting 1.16.19 Summary - draft as of 1-23-19 Page 1
DRAFT Meeting Summary
Park System Development Charge (SDC) Methodology Update
Stakeholder Meeting on Issue Analysis
Wednesday, January 16, 2019, 1:00 p.m. – 3:00 p.m.
Bend Senior Center
1600 SE Reed Market Rd, Bend, OR 97702
Purpose of Meeting
• Share the analysis of SDC options including residential Parks SDC assessment options and a
potential nonresidential Parks SDC.
• Engage community members and seek feedback on the analysis of options for the Parks SDC
update.
Welcome and Introductions
Michelle Healy, Bend Park & Recreation District (BPRD), welcomed participants and thanked them for
their engagement.
Sylvia Ciborowski, Kearns & West, introduced herself as meeting facilitator and asked meeting
participants to introduce themselves.
Sylvia reviewed the agenda and the purpose of this meeting. She noted that in past meetings,
stakeholders were provided with an introduction to the SDC update and discussed the following four key
issues:
1) Level of service (LOS) and changes to SDC-eligible project types in the context of the Comprehensive
Plan
2) Ways the Parks SDC could align with community affordable housing goals
3) A potential nonresidential SDC
4) Administrative issues.
The team has conducted analysis, gathered data, and considered stakeholder feedback on these issues
to develop a number of options for the SDC update. Today, the team will present options on two topics
in particular—a potential nonresidential SDC and scaling options for the residential SDC—and seek
feedback on these topics prior to the January 29 BPRD Board meeting.
53

DRAFT_BPRD SDC Stakeholder Meeting 1.16.19 Summary - draft as of 1-23-19 Page 2
Update on Progress since Introductory Stakeholder Meetings
Deb Galardi, Galardi Rothstein Group, reminded participants of the timeline for the process, which
includes a January 29 work session with the BPRD Board of Directors. The team has conducted the
majority of the preliminary technical analysis and has some options to present today. In the coming
month, the team will refine the options and analysis and then will draft the SDC Methodology Report. A
sixty-day comment period of the report will be available prior to the final Public Hearing set for May 21,
2019.
Sarah Bodo, BPRD, provided the progress and timeline of public engagement, which includes:
• October 24, 2018 – Stakeholder introductory meeting on SDCs
• November 6 – Board meeting to provide update on SDC process
• December 6, 2018 – Second stakeholder introductory meeting on SDCs
• Ongoing – Individual meetings with stakeholders to provide more context and to gather
feedback
• January 16, 2019 – Stakeholder meeting to present findings and issue analysis
• January 29, 2019 – Board meeting/work session
Deb Galardi provided an update on the SDC methodology and SDC project list. The presentation
included:
• Progress on methodology, including development of a cost basis, cost per equivalent
population, and SDC calculation
• Note that all calculations presented today are preliminary, as additional analysis needs to be
completed, compliance costs and bond credits need to be factored in, and there are several
policy decisions that can impact the final calculations
• Summary of the SDC project list and estimated costs to build projects
• Existing and future levels of service, and implications of the level service for the SDC cost basis
• Preliminary improvement SDC cost basis and preliminary reimbursement SDC cost basis
Discussion on Methodology and Cost Basis
Participants asked clarifying questions and made comments regarding the methodology and cost basis,
including:
• A participant asked for an example of improved level of performance/development, and Deb
indicated that Big Sky Park development is an existing park where additional acreage is being
developed so is included in this category on the SDC project list.
• A participant asked how developer reimbursements are factored in (i.e., developer oversizing
reimbursement and instances when the District reimburses developers for directly providing
park capacity improvements).
• Participants asked clarifying questions regarding the LOS targets for neighborhood and
community parks. Staff replied that the current LOS goal in the Comprehensive Plan is 7.85,
which represents a combination of LOS for community and neighborhood parks following
54

DRAFT_BPRD SDC Stakeholder Meeting 1.16.19 Summary - draft as of 1-23-19 Page 3
completion of all of the improvements identified in the Comprehensive Plan. The current actual
LOS (8.0) is slightly higher than the LOS goal; the preliminary 10-year SDC project list results in a
future planned LOS of 7.88, consistent with the target. Without park improvements there will be
a reduction in LOS as population growth occurs (by the end of the 10-year timeframe).
• A participant asked whether there is a standard LOS in the industry. Staff replied there is no
standard; instead, LOS is community-based and depends on how much the community values
park facilities.
• A participant asked whether projected population growth factors in UGB expansion and staff
replied that it does. The participant noted that Woodside Ranch is not within the District
boundary, yet all its residents enjoy District parks without paying into the system. It seems those
out-of-District users should be asked to pay, rather than asking for increased fees for those
within the District.
• A participant asked about District park utilization rates. The staff responded that there is some
sense of utilization rates from recreation surveys, park system reservation data, and trail
counters. Bend appears to have high levels of use of parks and trails, and anecdotal information
would be helpful in providing baseline justification. Participants are interested in seeing how the
use of Bend parks compares to other communities.
• A participant asked how and whether the parks project costs are being considered in
coordination with the operating budget and how property taxes are used to fund parks. Staff
responded that the SDC project list does not include cost of asset management or replacement
projects. Property tax revenues are used to cover maintenance. Some facilities also have
reserves already built up; for example, $11 million has already been saved by BPRD for the
future Larkspur Center.
• A member asked whether BPRD is seeing economies of scale; for example, with additional parks
do administrative costs grow at a less rapid pace? Staff responded that there are some
economies of scale, however new park facilities increase operational costs.
• Participants asked how the Comprehensive Plan public process sought input from the public
regarding the public’s level of desire to put more funding into the parks system. They asked
whether the public was asked to weigh or prioritize parks against other important needs such as
housing affordability, and whether any cost estimates were provided for parks projects for the
public to reflect on. The staff responded that the District has conducted perception surveys to
understand how much people value parks compared to other public services, such as libraries,
streets, police, etc., and the outcomes showed that people value parks highly. There were not
costs associated with specific parks as part of the Comprehensive Plan public process; the
questions asked were bigger picture questions around perceptions on Bend’s densification and
growth.
• A participant asked what the SDC cost basis was for the prior SDC update. The staff responded
that they would need to find that information.
• Some participants suggested reducing the Parks SDC project list in order to reduce the cost
basis. The staff responded that they are trying to update the SDC methodology so that it more
equitably spreads the SDC. The intent is not to try to increase the SDC.
• A participant asked whether the BPRD Parks SDC methodology is consistent with other similar
markets, how it compares with other communities, and whether it keeps Bend a competitive
market to attract developers. The staff responded that the current and updated methodologies
55

DRAFT_BPRD SDC Stakeholder Meeting 1.16.19 Summary - draft as of 1-23-19 Page 4
are consistent with industry standard approaches. Key methodology changes being considered
in this update (i.e., whether to include indoor facilities as part of the Parks SDC project list,
whether to include a nonresidential fee that would be a conservative estimate of a worker’s
opportunity to use parks in Bend, and whether to scale the residential SDC based on occupancy
ranges) are also consistent with parks SDC methodology trends in other communities.
Potential Nonresidential Parks SDC
Deb presented the analysis and findings regarding a potential nonresidential component for the Parks
SDC. She noted that there is an accepted nexus between nonresidential development and park capacity
needs. Other jurisdictions tend to use an equivalency model based on hours of opportunity that
employees have to use parks. She presented a proposed equivalency of 0.126 for a potential
nonresidential Parks SDC for BPRD. She noted that this figure is seasonally adjusted to take into account
that people are more likely to use parks in warmer summer months, and it includes outside District
employees only. This proposed equivalency is on the low end of what is used in other jurisdictions, in
response to preliminary feedback from stakeholders at prior meetings.
She presented calculations on how a nonresidential SDC would impact the residential SDC. She noted
that if the District were to adopt a nonresidential SDC, this would lower the combined SDC for
residential developments by about $150 per person.
Deb then presented sample nonresidential SDC calculations for various development types. She noted
that different development types would be placed into categories based on how many employees are
typical for that kind of development. For example, an office tends to have more employees per square
foot than an industrial development, so the SDC fee for an industrial development would be lower than
for an office building of similar size.
Discussion on Potential Non-Residential SDC
Sylvia invited participants to ask questions and provide comments regarding a potential non-residential
SDC. Questions posed for discussion included:
• What are your thoughts on including a nonresidential SDC?
• Any reflections on the analysis, its outcomes, or the recommendation?
Key themes from the discussion are included below.
• A participant noted that it would be helpful to see the total SDC cost to developers, rather than
looking at just the Parks SDC, and that it would also be helpful to compare the total SDC cost in
Bend to that of other Central Oregon communities. The staff responded that they can work with
City staff to develop a total SDC amount, including parks, transportation, water and sewer SDCS,
and see how that compares to similar communities.
• A participant expressed concern about basing the nonresidential SDC on zones and adding
complexity to the SDC calculation. Staff responded that BPRD would work with the City to
56

DRAFT_BPRD SDC Stakeholder Meeting 1.16.19 Summary - draft as of 1-23-19 Page 5
simplify the nonresidential SDC categories and keep them consistent, while still providing equity
for different commercial development types.
• A participant asked whether the LOS would decrease if a nonresidential component has been
factored in. Staff responded that the current LOS calculation does not capture parks users who
live outside the District; although when BPRD calculated the LOS, they recognized that there is
impact from visitors and nonresident employment.
• Damon Runberg pointed out that the nonresidential SDC categories used in the analysis were
based on the Metro Urban Growth Report. Damon said that he can provide Bend-specific data
around average number of employees for the various nonresidential development types, to
make the nonresidential SDC calculation more in line with local commercial use.
• Staff indicated that there are only about 1,000 additional residents of the District vs. the City of
Bend.
• Damon Runberg offered to provide more specific data on Bend employees that reside outside of
the District and within the District.
• A participant noted that the nonresidential SDC only slightly lowers the residential SDC (by
approximately $150/person) and has a nominal impact on housing prices; it may not be worth
making the SDC more complex for a small difference. The relative benefit may not be worth the
added complexity.
• A participant questioned the accuracy of using “hours of opportunity” rather than real data on
parks use by employees. The participant asked whether the data takes into account that parks
are more heavily used on weekends and in summer months, the differences in use based on a
commercial development’s proximity to parks, and whether employees really use the parks very
much. The staff responded that the “hours of opportunity” model does take into account
various nuanced factors, and that the residential SDC component is also based on “hours of
opportunity” which is a standard model used in Oregon. The City of Eugene conducted a study
to assess real parks use by employees and found a higher level of usage than the models predict.
• A participant asked if since the proposed nonresidential methodology adds in employees that
live outside of Bend but work and use parks in Bend—does it also subtract those that live in
Bend but work and use parks outside of Bend? Staff responded that inside District residents
that work outside the area are assumed to have fewer hours available for BPRD park use and
this is factored into the calculations.
• A participant noted that there are many homes/developers that did not pay an SDC because
they were built before the SDC program, and there is an equity concern around having new
developers shoulder more of the burden of paying for parks. Staff noted that there was a fee
paid prior to the SDC program, and that the current SDC payments seek to address parks needed
for new populations and future growth.
• Some participants advocated for reducing the $93 million project list and putting out a bond
measure to pay for some park projects and expressed that asking taxpayers to vote and chip in
to pay for parks would be an equitable way to fund parks.
• A participant asked if developers can still get credits for trails or parks that the developer builds.
Staff noted that credits are available if the project built is on the SDC project list.
• Some participants expressed concern that the nonresidential SDC seems like double-charging.
57

DRAFT_BPRD SDC Stakeholder Meeting 1.16.19 Summary - draft as of 1-23-19 Page 6
• A participant supported the nonresidential SDC as a way to more equitably spread park
development costs to non-resident employees who might use parks on lunch breaks and for
other reasons.
Residential SDC Assessment Options
Deb presented various options to scale the residential SDC based on dwelling size to improve equity and
address some affordability concerns. She added that the SDC will also seek to address income-qualified
Affordable Housing, but those discussions are still ongoing and not part of today’s agenda.
She noted that at the October and December stakeholder meetings, stakeholders expressed an interest
in analyzing options to scale the residential SDC based on dwelling size.
Deb presented various scaling options and the preliminary SDC calculation for those options. The SDC
can be scaled based on number of bedrooms, or by square footage. Under both of these options, the
SDC cost would be lower for residences with fewer people per dwelling unit, and higher for residences
with more people per dwelling unit. These scaling options can be applied to both single family and
multifamily residences. The preliminary calculations developed and presented today are based on data
and collaboration with two professors who are experts at statistical analysis, and the various data
sources that support the analysis (i.e., census data, tax lot information from the Assessor’s office, and a
number of other surveys). The proposed square footage tiers do not further break up smaller homes
into tiny homes or ADUs because the data sample size was too small to be statistically valid for the
District’s service area. However, there is national data on the typical people per dwelling unit in these
smaller development types. Deb added that all of the scaling options would require additional
administration.
Discussion on Residential SDC Assessment Options
Sylvia invited participants to ask questions and provide comments regarding a residential SDC
assessment options. Questions posed for discussion included:
• What are your thoughts on tiering/scaling the SDC based on average household size?
o Single family? Multifamily?
o Is it more appropriate to use the square footage or bedroom basis for scaling the SDC?
Key themes from their questions and discussion are included below.
• A participant noted that scaling based on square footage might be easier to administer than
scaling based on number of bedrooms.
• A participant suggested scaling in a way that makes starter and workforce housing as affordable
as possible; it would be best to scale with the largest gap so that smaller homes are assessed a
smaller SDC.
• A participant reiterated that even with scaling, the SDC on workforce housing seems too high,
that SDCs are increasing quickly, and the District should consider reducing the project list to
reduce the cost basis as well as putting park development costs out for a bond. Staff added that
58
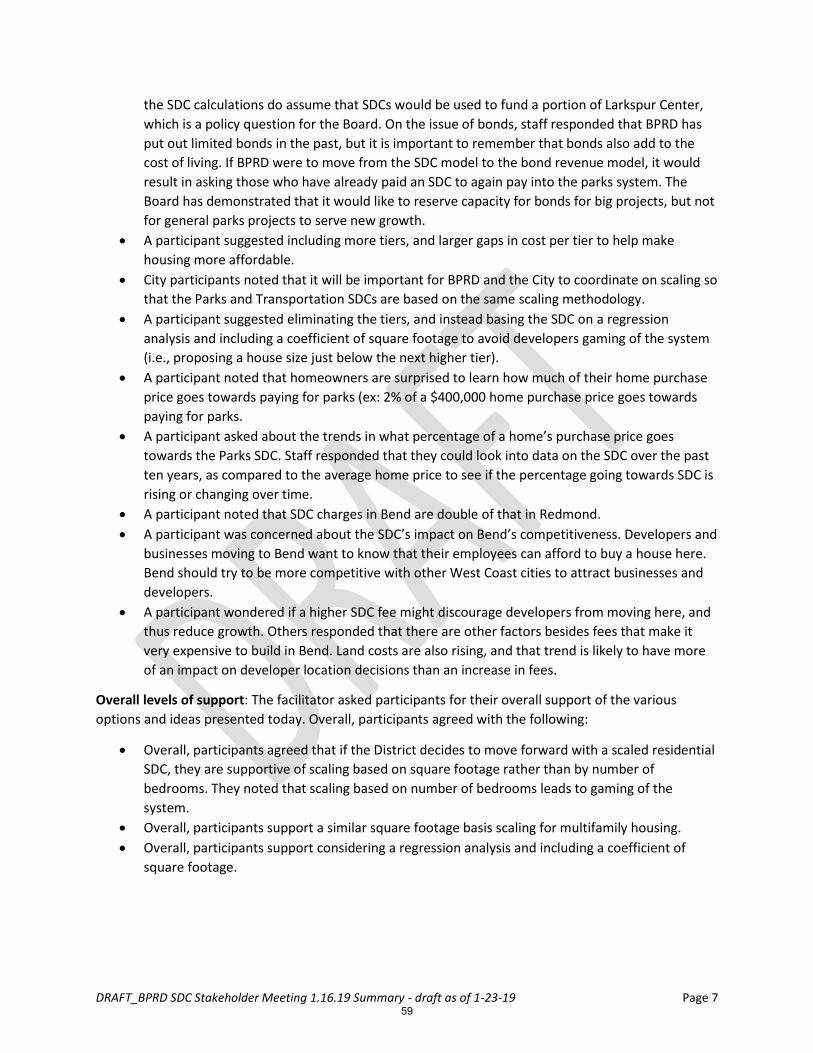
DRAFT_BPRD SDC Stakeholder Meeting 1.16.19 Summary - draft as of 1-23-19 Page 7
the SDC calculations do assume that SDCs would be used to fund a portion of Larkspur Center,
which is a policy question for the Board. On the issue of bonds, staff responded that BPRD has
put out limited bonds in the past, but it is important to remember that bonds also add to the
cost of living. If BPRD were to move from the SDC model to the bond revenue model, it would
result in asking those who have already paid an SDC to again pay into the parks system. The
Board has demonstrated that it would like to reserve capacity for bonds for big projects, but not
for general parks projects to serve new growth.
• A participant suggested including more tiers, and larger gaps in cost per tier to help make
housing more affordable.
• City participants noted that it will be important for BPRD and the City to coordinate on scaling so
that the Parks and Transportation SDCs are based on the same scaling methodology.
• A participant suggested eliminating the tiers, and instead basing the SDC on a regression
analysis and including a coefficient of square footage to avoid developers gaming of the system
(i.e., proposing a house size just below the next higher tier).
• A participant noted that homeowners are surprised to learn how much of their home purchase
price goes towards paying for parks (ex: 2% of a $400,000 home purchase price goes towards
paying for parks.
• A participant asked about the trends in what percentage of a home’s purchase price goes
towards the Parks SDC. Staff responded that they could look into data on the SDC over the past
ten years, as compared to the average home price to see if the percentage going towards SDC is
rising or changing over time.
• A participant noted that SDC charges in Bend are double of that in Redmond.
• A participant was concerned about the SDC’s impact on Bend’s competitiveness. Developers and
businesses moving to Bend want to know that their employees can afford to buy a house here.
Bend should try to be more competitive with other West Coast cities to attract businesses and
developers.
• A participant wondered if a higher SDC fee might discourage developers from moving here, and
thus reduce growth. Others responded that there are other factors besides fees that make it
very expensive to build in Bend. Land costs are also rising, and that trend is likely to have more
of an impact on developer location decisions than an increase in fees.
Overall levels of support: The facilitator asked participants for their overall support of the various
options and ideas presented today. Overall, participants agreed with the following:
• Overall, participants agreed that if the District decides to move forward with a scaled residential
SDC, they are supportive of scaling based on square footage rather than by number of
bedrooms. They noted that scaling based on number of bedrooms leads to gaming of the
system.
• Overall, participants support a similar square footage basis scaling for multifamily housing.
• Overall, participants support considering a regression analysis and including a coefficient of
square footage.
59

DRAFT_BPRD SDC Stakeholder Meeting 1.16.19 Summary - draft as of 1-23-19 Page 8
Next Steps and Action Items
Staff thanked participants for their engagement. Michelle reviewed the next steps in the process,
including a final review of the technical analysis and development of compliance costs and credits. The
BPRD will continue to conduct individual outreach and will provide an update to the Board at the
January 29, 2019 meeting.
Michelle encouraged participants to provide additional comments if they think of anything after this
meeting and thanked them for their honest and direct feedback that will help inform the process.
Action Items
Next steps and actions for the BPRD team to take include:
• Find out what the SDC cost basis was for the prior SDC update.
• Work with Shannon Levine to develop a total SDC amount, including parks, transportation,
water and sewer SDCS, and see how that compares to similar communities.
Nonresidential SDC Analysis:
• Work with the City to simplify the nonresidential SDC categories and keep them consistent,
while still providing equity for different commercial development types.
• Work with Damon Runberg to gather Bend-specific data around average number of employees
for the various nonresidential development types in order to make the nonresidential SDC
calculation more in line with local commercial use.
• Work with Damon Runberg and Josh Lehner to refine the assumptions on the number of outside
District employees.
Residential Scaling Options Analysis:
• Coordinate with the City on scaling so that the Parks and Transportation SDCs are based on the
same scaling methodology.
• Consider a regression analysis and including a coefficient for square footage.
• Look into data on the SDC over the past ten years, as compared to the average home price, to
evaluate if the percentage going towards SDC is rising or changing over time.
60
DRAFT_BPRD SDC Stakeholder Meeting 1.16.19 Summary - draft as of 1-23-19 Page 9
Meeting Attendance
The following individuals participated in the meeting:
Participants
1. Kip Barrett – Economic Development for
Central Oregon
2. Anna Bozich – Pahlisch Homes
3. David Brant – Housing Works
4. Gina Dahl – City of Bend
5. John Gilbert – Pacific Crest Affordable
Housing
6. Karna Gustafson – Oregon Home Builders
Association
7. Russell Grayson – City of Bend
8. Meghan Hall – Brooks Resources
9. Geoff Harris – Hayden Homes
10. Dan Kemp – Compass Commercial Real
Estate Services
11. Brent Landels – The Cascadia Group
12. Josh Lehner – Oregon Office of Economic
Analysis
13. Shannon Levine – City of Bend
14. Jennifer Limoges – NAI Cascade
15. Lynne McConnell – City of Bend
16. Tyler Neese – Central Oregon Association of
Realtors
17. Scott Rohrer – Habitat for Humanity
18. Damon Runberg – Oregon Employment
Department
19. Peter Russell – Deschutes County
20. Bill Smith – William Smith Properties
21. Todd Taylor – Taylor NW
22. Ron White – Tennant Development
BPRD Staff and Consultant Team
1. Don Horton – Bend Park and Recreation
District
2. Michelle Healy – Bend Park and Recreation
District
3. Julie Brown – Bend Park and Recreation
District
4. Sarah Bodo – Bend Park and Recreation
District
5. Betsy Tucker, Bend Park and Recreation
District
6. Paul Taylor – Bryant Lovlien & Jarvis
7. Deb Galardi – Galardi Rothstein Group
8. Sylvia Ciborowski – Kearns & West
61
BPRD Parks SDC Update - Additional Stakeholder Outreach and Comments Log Page 1 of 7
BPRD Parks System Development Charge (SDC) Update –
Additional Stakeholder Outreach and
Comments Log
In addition to large-group meetings with stakeholders, the BPRD team also received comments via email
and through individual stakeholder outreach. Those comments are included in the tables below.
1. Meeting with Evergreen Housing
Attendees: Andrew Brand and Hans Christiansen, Evergreen Housing; Michelle Healy, Sarah Bodo,
BPRD
Name and Organization Date
Comments and Notes
Andrew Brand and Hans Christiansen, Evergreen Housing
11-19-18 Bend has the highest park SDC Evergreen Housing
encountered. It gets passed onto homeowners and renters,
causes a supply problem. They are not anti-SDC.
Evergreen Housing would support a nonresidential fee if
housing SDC were reduced.
Evergreen Housing supports housing affordability measures.
Deed restrictions in perpetuity do not make sense for
developers other than affordable housing developers. It was
suggested to reduce deed restrictions to 12-15 years or some
other period which would pencil out for developers. It was
suggested to compare the NPV of the savings to the loss in
housing value. Evergreen HD has looked at the City’s
affordable housing incentives, and they are not adequate to
make building affordable housing interesting to a market rate
developer.
Evergreen Housing supports graduated fee based on unit size.
62

BPRD Parks SDC Update - Additional Stakeholder Outreach and Comments Log Page 2 of 7
2. Meeting with Housing Works
Attendees: Keith Wooden, Housing Works; Michelle Healy, Sarah Bodo, BPRD
Name and Organization Date
Comments and Notes
Keith Wooden, Housing Works
11-26-18 Supports SDC exemption.
Recommends tying deed restrictions with federal and state
restrictions of 30+years verses 5 years with the city. The issue
is where BPRD’s place in line would be.
3. Meeting with Habitat for Humanity
Attendees: Scott Roeher, Habitat for Humanity; Michelle Healy and Sarah Bodo, BPRD
Name and Organization Date
Comments and Notes
Scott Roeher, Habitat for Humanity
11-27-19 For Habitat for Humanity, there is no benefit to delaying
collection to occupancy.
There is no benefit to financing SDCs as there is a max
payment of 1/3.
Supports SDC exemption or partial exemption.
4. Email Comments
Name and Organization Date
Comments and Notes
Tyler Neese, Government Affairs Director, Central Oregon Association of Realtors
12-27-19 I’m planning to attend the Jan 16 meeting and if o.k., I’d like to also ask a couple of our members to join – one in the commercial space and the other a residential broker. I wanted to chime in on your previous thread as well – we’re also in agreement with Jade’s points regarding level of service, SDCs for non-residential construction, an affordable housing exemption, and the need to define “affordable housing” (big A vs. little a, what percentage of AMI, etc.) and a graduated system for determining SDCs. Scaling SDCs could also help incentivize smaller homes and higher density, which aligns with the city’s obligations per its UGB expansion plan.
63
BPRD Parks SDC Update - Additional Stakeholder Outreach and Comments Log Page 3 of 7
We also have concerns with the concept of new commercial SDCs to offset the affordable housing exemption. As SDCs are already being assessed for multi-family, we would want to understand what this looks like and the justification. Thank you for bringing everyone to the table on this important topic and including us in the process for input.
Jade Mayer, VP & Chief Financial Officer, Brooks Resources Group
11-16-18 After further internal discussions at Brooks Resources, we have the following thoughts/input:
1. The level of service for district improvements should remain the same as it currently is. Regardless of the moving parts, attempting to sell the general public on the need to increase the level of service seems like a difficult mountain to climb.
2. SDCs should NOT be collected on non-residential construction. Attempting to collect for people that live outside of bend but work in bend will further complicate an already complicated system, with little benefit. Park SDCs are collected on “guest rooms” already, which means tourists are being charged their share.
3. SDCs should be eliminated for appropriate affordable housing. However, as there are different types of “affordable” housing, more thought should be given as to what constitutes affordable housing.
4. SDCs should be calculated on a graduated basis, based on square footage, whereby smaller houses pay less SDCs and bigger houses pay more SDCs. Utilizing square feet eliminates administrative confusion, will help in providing more housing with smaller footprints and should help increase affordability.
John N. Gilbert, III Pacific Crest Affordable Housing
11-16-18 I have reviewed Jade's comments below with key members of Pacific Crest Affordable Housing, and we are in complete agreement on all four topics.
Lynne McConnel, Affordable Housing Manager, City of Bend
11-05-18 Typically, state and federal funding requires longer terms. The current SDC ordinance was not intended to require only 5 years, but a last-minute update by Council that was intended to be a 5-year review period for the ordinance as a whole ended up being interpreted this way. We have had a bunch of interest from traditional builders who hear about the limited deed restriction and want to know more about building affordable homes. All of our other subsidies and policy tools require a longer restriction—typically from 50 years to
64

BPRD Parks SDC Update - Additional Stakeholder Outreach and Comments Log Page 4 of 7
permanent. We have quite a bit of flexibility in using the restrictions, and typically evaluate what makes sense to the project and the balance of subsidy to restriction, so that one doesn’t significantly outweigh the others. Habitat uses deed restrictions. We fund nearly every Habitat home in some way, and we also deed restrict them. However, Habitat uses a shared equity model, which allows their homeowners to eventually share any profits from the later sale. I believe there are times when the home owner has been in the home so long that they outlive the deed restriction, but I haven’t yet dealt with that.
Ron White, Tennant Developments
10-25-18
I think it is pretty easy to pay attention to ends of any spectrum and miss the middle ground. I am thinking of affordability of housing in this case. John Gilbert pointed out that there is a difference between Affordable housing and housing affordability. The Pacwest builder mentioned that the $35,000 in fees are currently the same for a $400,000 home or a $1,000,000 home. The point I want to make is some of the best outcomes for our community would be if the market could help with providing housing affordability without having to be Affordable housing (governmentally supported). To this, and Russ Grayson will not like this suggestion, along with scaling fees by size, it would be great if there was a way to scale by cost as well. We all recognize the regressive nature of a fixed amount of an SDC fee, not associated with the cost home or the income of the owner. For the most part, home prices are pretty well related to the ability of an owner to pay for the home. My suggestion is to search for a legal and simple way to do some scaling of SDCs, especially for the lower 25% of the new home market. While size is a factor it is not absolute. We have a broad range of 1,200 square foot home prices in Bend. Habitat is building small homes because they must. Some folks are just choosing smaller, but expensive homes for lifestyle. Second, you asked for suggestions as to who might be added to the stakeholder meeting, and I will suggest our local economist, Damon Runberg. He may have some perspective on the economics of our area we are not considering. Also, a commercial broker like Jay Lyons of Compass Commercial or Brian Fratzke of Fratzke could be valuable additions.
Peter Russell Senior Transportation
10-25-18 In my 25 years of planning, I’ve either been involved with development or application of SDCs for about half of that time.
65
BPRD Parks SDC Update - Additional Stakeholder Outreach and Comments Log Page 5 of 7
Planner, Deschutes County Community Development
If BPRD decides to pursue non-residential SDCs and the concept meets some pushback, you could try threading the needle in the approach presented below. As I understand it, the rationale for SDCs on non-residential land uses is that this would capture those folks who don’t live in Bend or BPRD boundaries, but use BPRD facilities. Such folks could be commuters from Redmond, Sisters, La Pine, or other Central Oregon origins. The existing BPRD SDC for hotels and motels already captures out of town visitors. Base the non-residential (commercial and industrial uses) SDC on BPRD facilities that would most likely see use by non-residents, rather than all BPRD facilities. For discussion purposes, base the non-resident SDC on the capital costs for just trails and not neighborhood parks under the premise a worker might go for a lunch hour walk or run on a trail, but probably won’t be using a neighborhood park, for example. Again, this is just a quick wing shot with admittedly no in-depth analysis, but does illustrate the general idea. The end result is you still have a non-residential SDC, but it is lower as not all BPRD capital projects are included in the base amount. Otherwise, you’re looking at one of two options, in my mind. One, you keep all the BPRD identified projects in the pool, which could lower the total SDC, but the non-residential portion might be artificially high. Two, you could further refine the concept I’ve described by looking at a non-residential land use’s proximity to a BPRD facility and set a distance where the non-residential SDC would be applicable. Say if a BPRD facility is within a quarter-mile of the property, as that’s often considered acceptable walking distance, the non-residential SDC is assessed. Beyond a quarter-mile, the non-residential SDC is not assessed. The drawback is some staffer somewhere is going to have provide that analysis. I think the 1< nonresidential equivalency approach you presented has a lot of merit. You could look at Census data for commuting to help get a sense of whether the rate should 0.5 or 0.2 or some other number. While the ITE considers the trip generation rate of a detached single-family house the same regardless of size of the home, I would point out the ITE has categories for multifamily home for low rise, mid-rise, and high-rise; off-campus student apartment; mid-rise residential with 1st floor
66
BPRD Parks SDC Update - Additional Stakeholder Outreach and Comments Log Page 6 of 7
commercial; high-rise residential with 1st floor commercial; mobile home park; senior adult housing attached, senior adult housing detached; congregate care facility; assisted living; continuing care retirement community; recreational homes (think destination resorts); timeshares; and residential planned unit development. In other words, the ITE offers BPRD staff a nationally recognized data source that is also used by both local jurisdictions (City of Bend and Deschutes County) when assessing potential traffic. It’s not perfect, but the ITE has more hits than misses and spares BPRD from having to reinvent the wheel. Finally, my “sitting on the sidelines I have no dog in this fight” view of SDCs and affordable housing. The Board of County Commissioners has a waiver process for County fees, which involves some limited paperwork and an appearance before the Board. BPRD could create a similar process if you don’t already have one. A better idea, to me, is to get data that passes the laugh test regarding user demographics for affordable housing residents in terms of household size, number of vehicles, use of alternate modes, patronage of BPRD facilities, etc. Then see if that data then supports a reduced SDC rate of X% for affordable housing projects. This is kind of similar to why the County only charges 81% of our SDC rate when reviewing single-family homes due to the number of second homes in Deschutes County.
Peter Russell Senior Transportation Planner, Deschutes County Community Development
10-25-18 Here are some thoughts regarding County SDCs and how BPRD might apply them. The County only has a
transportation SDC. I’ve attached a copy of the most recent SDC resolution to cure any latent
insomnia.
1. Our base SDC is $4,240 per p.m. peak hour trip. Due to the number of second homes in Deschutes County, the Census showed only 81% of homes are fulltime residences, therefore for single-family homes we charge an SDC of $3,434, which cleverly enough is 81% of $4,240. We’ve had a Countywide transportation SDC since 2008 and we’ve used the 81% rate since the 2013 revisions, if I remember correctly.
2. We have an option of a 10-year payment plan, which
67

BPRD Parks SDC Update - Additional Stakeholder Outreach and Comments Log Page 7 of 7
requires Board approval. Most folks don’t use it as the County becomes a first-place lien holder. Payments are made twice a year and we charge interest based on 30-years fixed rate mortgage rate reference.
3. We charge SDCs on all land uses (commercial, industrial, retail, etc.) on the premise that goods and services for County residents at some point travel over County roads.
4. There is an appeal process for SDCs, which goes first to the Road Dept. Director and then his decision can be appealed to the Board, which occurs at a public hearing. We’ve had maybe two or three in a decade.
5. We normally use the Institute of Traffic Engineers (ITE) Trip Generation Manual to set SDCs, but in novel instances we have worked with the applicant on a local trip rate if the use or an analogous use is not in the ITE Trip Gen Manual.
6. Our SDC is indexed to construction cost index published in the Engineering News Record out of Seattle and changes every July 1.
7. Personally, I wouldn’t modify SDCs for affordable housing, but If you want to go that route, I’d reference American Community Survey data on commuting patterns and tie it to either patronage of modes other than single occupant vehicles or number of vehicle-less households. The idea is use of transit, bike, walk, telecommute can reduce need for modernization projects. More myth than fact, but it’s the best I’ve got.
8. If a use is abandoned for more than two consecutive years, we can charge an SDC when the site redevelops. The exception is if the use was extinguished due to a natural disaster, in which case the time period is ten years. I’ve maybe two or three of these in a decade. Otherwise, the SDC runs with the land and once paid the obligation is done.
9. If the new use produces the same or fewer trips than the previous land use, we don’t charge an SDC.
10. For uses with a lot of tenant turnover (think strip mall, business park, airport) we don’t charge an SDC per tenant, but only charge an SDC if there’s a physical expansion of the use.
68


