25
January - September 2006 Conference Call Georg Denoke, CFO October 31, 2006
January - September 2006Conference Call
Georg Denoke, CFOOctober 31, 2006
07/11/2006 2
Contents
06 The Linde Group
09 Gas & Engineering
11 Linde Gas
18 Linde Engineering
21 KION Group
07/11/2006 3
Disclaimer
This investor presentation has been prepared independently by Linde AG (“Linde”). The presentation contains statements which address such key issues as Linde’s growth strategy, future financial results, market positions, and product development. Such statements should be carefully considered, and it should be understood that many factors could cause forecast and actual results to differ from these statements. These factors include, but are not limited to price fluctuations, currency fluctuations, developments in raw material and personnel costs, physical and environmental risks, legal and legislative issues, fiscal, and other regulatory measures. Stated competitive positions are based on management estimates supported by information provided by specialised external agencies.
07/11/2006 4
Changes in accounting policy
Linde AG adopted the mandatory IFRIC 4 „Determining whether an arrangement contains a lease“ for the first time in January 1st, 2006.
Due to the respectively required change in accounting policy, thecomparative figures have been restated („restated“).
07/11/2006 5
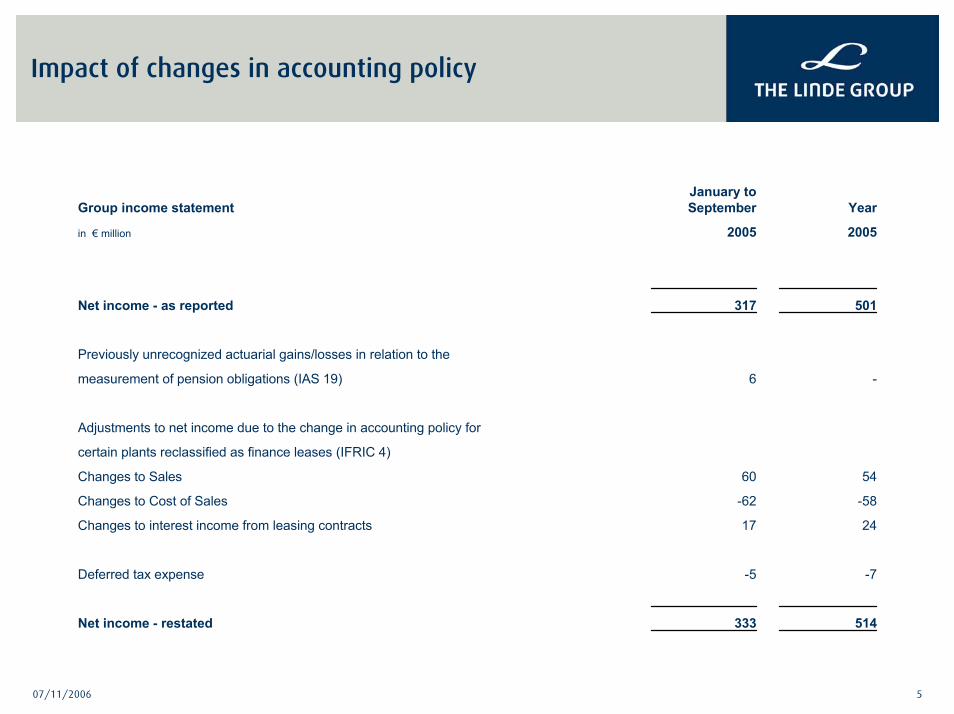
Impact of changes in accounting policy
514333Net income - restated
-7-5Deferred tax expense
2417Changes to interest income from leasing contracts
-58-62Changes to Cost of Sales
5460Changes to Sales
certain plants reclassified as finance leases (IFRIC 4)
Adjustments to net income due to the change in accounting policy for
-6measurement of pension obligations (IAS 19)
Previously unrecognized actuarial gains/losses in relation to the
501317Net income - as reported
20052005in € million
YearJanuary to September Group income statement
07/11/2006 6
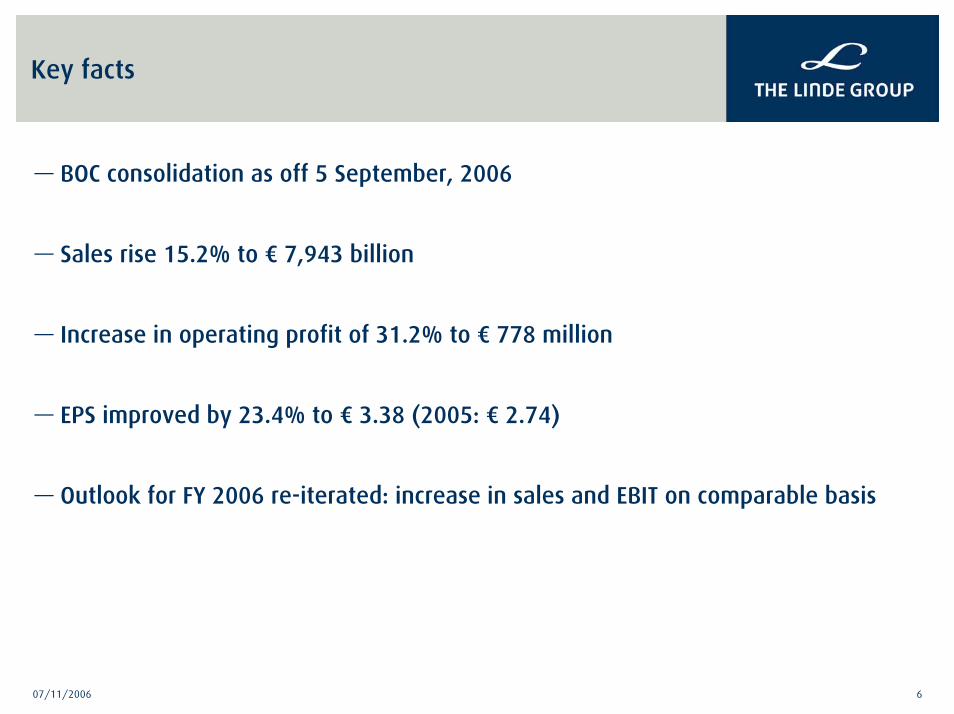
Key facts
— BOC consolidation as off 5 September, 2006
— Sales rise 15.2% to € 7,943 billion
— Increase in operating profit of 31.2% to € 778 million
— EPS improved by 23.4% to € 3.38 (2005: € 2.74)
— Outlook for FY 2006 re-iterated: increase in sales and EBIT on comparable basis
07/11/2006 7
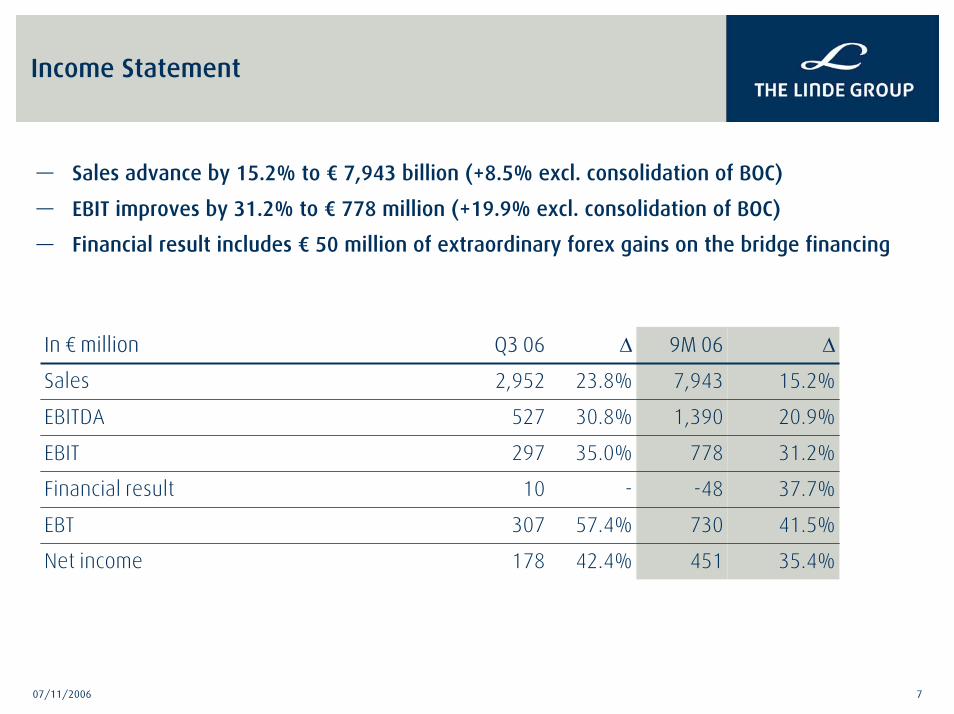
Income Statement
— Sales advance by 15.2% to € 7,943 billion (+8.5% excl. consolidation of BOC)
— EBIT improves by 31.2% to € 778 million (+19.9% excl. consolidation of BOC)
— Financial result includes € 50 million of extraordinary forex gains on the bridge financing
178
307
10
297
527
2,952
Q3 06
42.4%
57.4%
-
35.0%
30.8%
23.8%
∆
31.2%778EBIT
20.9%1,390EBITDA
35.4%451Net income
41.5%730EBT
37.7%-48Financial result
15.2%7,943Sales
∆9M 06In € million
07/11/2006 8
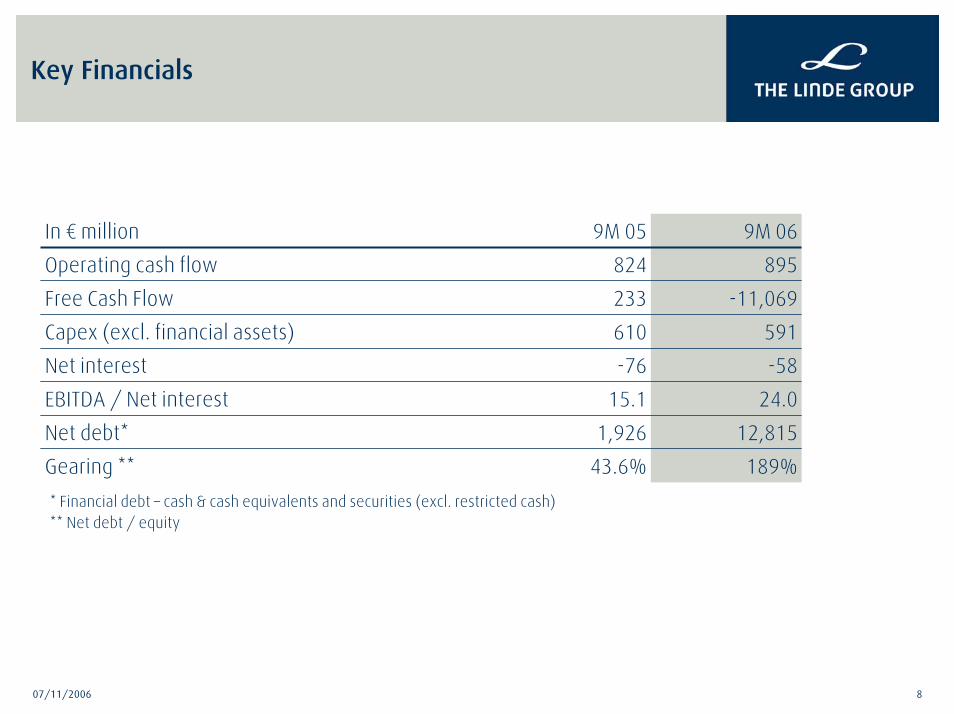
Key Financials
-11,069233Free Cash Flow
591610Capex (excl. financial assets)
189%43.6%Gearing **
12,8151,926Net debt*
24.015.1EBITDA / Net interest
-58-76Net interest
895824Operating cash flow
9M 069M 05In € million
* Financial debt – cash & cash equivalents and securities (excl. restricted cash)** Net debt / equity

Gas & Engineering
07/11/2006 10
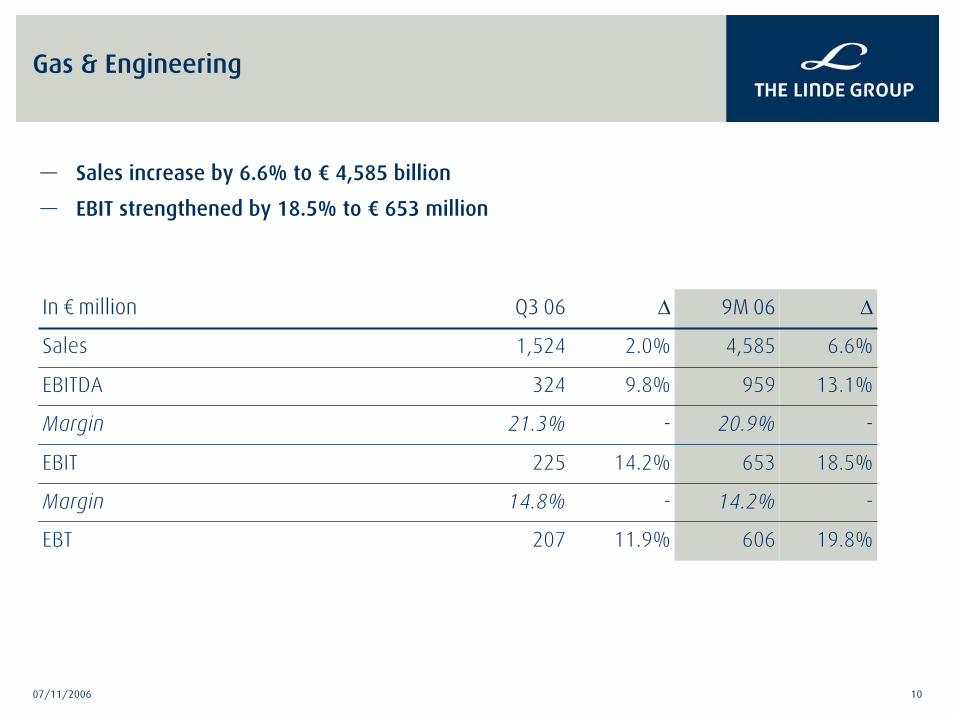
Gas & Engineering
— Sales increase by 6.6% to € 4,585 billion
— EBIT strengthened by 18.5% to € 653 million
207
14.8%
225
21.3%
324
1,524
Q3 06
11.9%
-
14.2%
-
9.8%
2.0%
∆
18.5%653EBIT
-20.9%Margin
13.1%959EBITDA
19.8%606EBT
-14.2%Margin
6.6%4,585Sales
∆9M 06In € million
07/11/2006 11
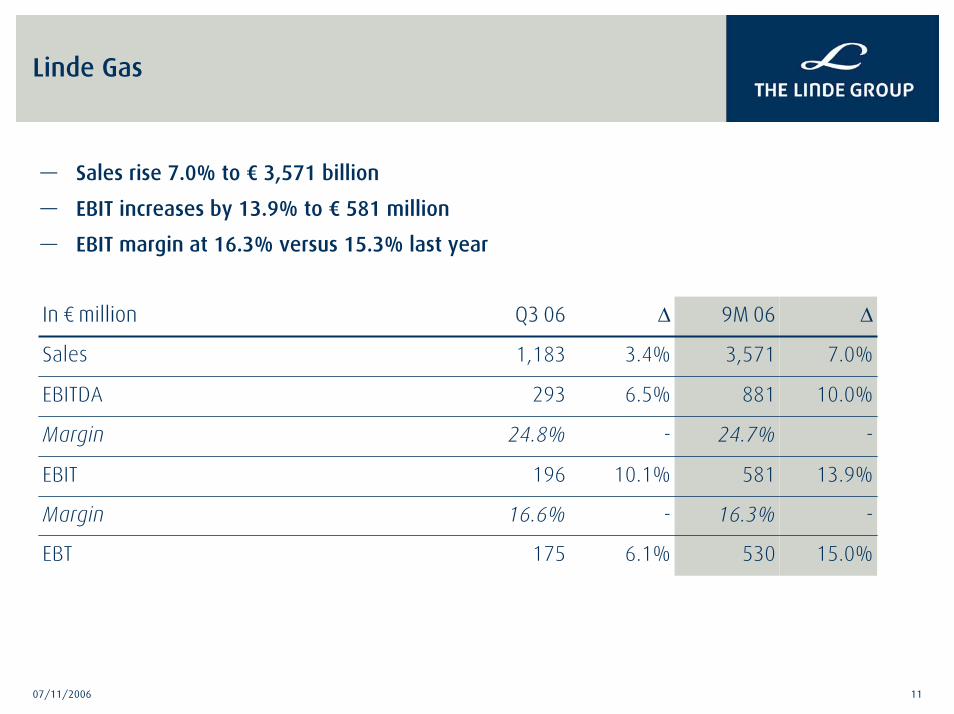
Linde Gas
— Sales rise 7.0% to € 3,571 billion
— EBIT increases by 13.9% to € 581 million
— EBIT margin at 16.3% versus 15.3% last year
175
16.6%
196
24.8%
293
1,183
Q3 06
6.1%
-
10.1%
-
6.5%
3.4%
∆
13.9%581EBIT
-24.7%Margin
10.0%881EBITDA
15.0%530EBT
-16.3%Margin
7.0%3,571Sales
∆9M 06In € million
07/11/2006 12
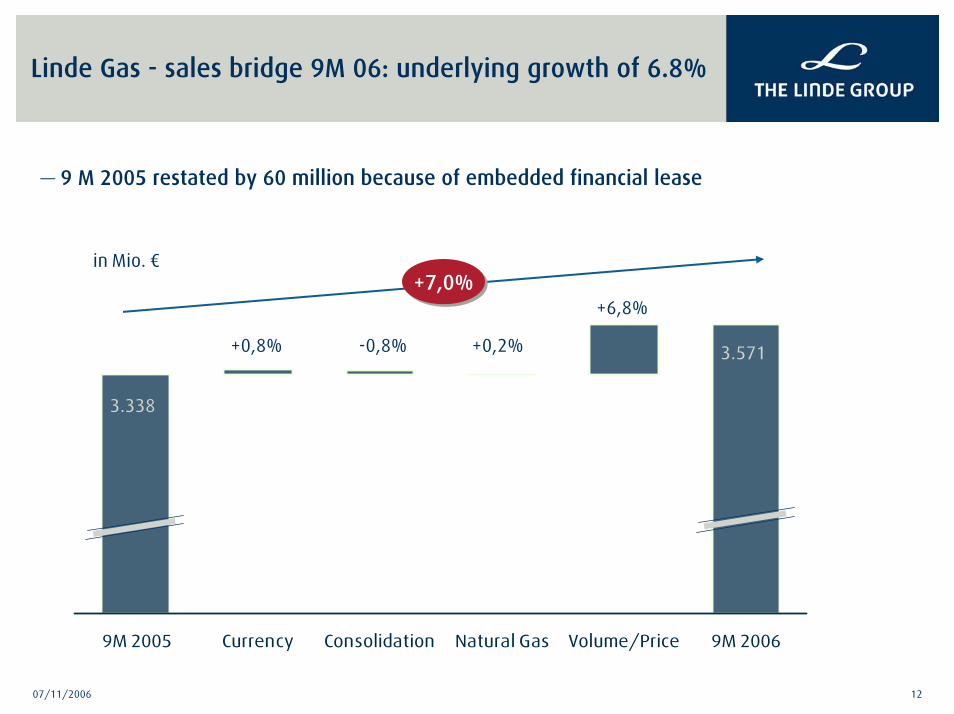
Linde Gas - sales bridge 9M 06: underlying growth of 6.8%
— 9 M 2005 restated by 60 million because of embedded financial lease
in Mio. €
+0,2%
+6,8%
+0,8%
9M 2005 Currency Consolidation Natural Gas Volume/Price 9M 2006
3.571
3.338
-0,8%
+7,0%+7,0%
07/11/2006 13
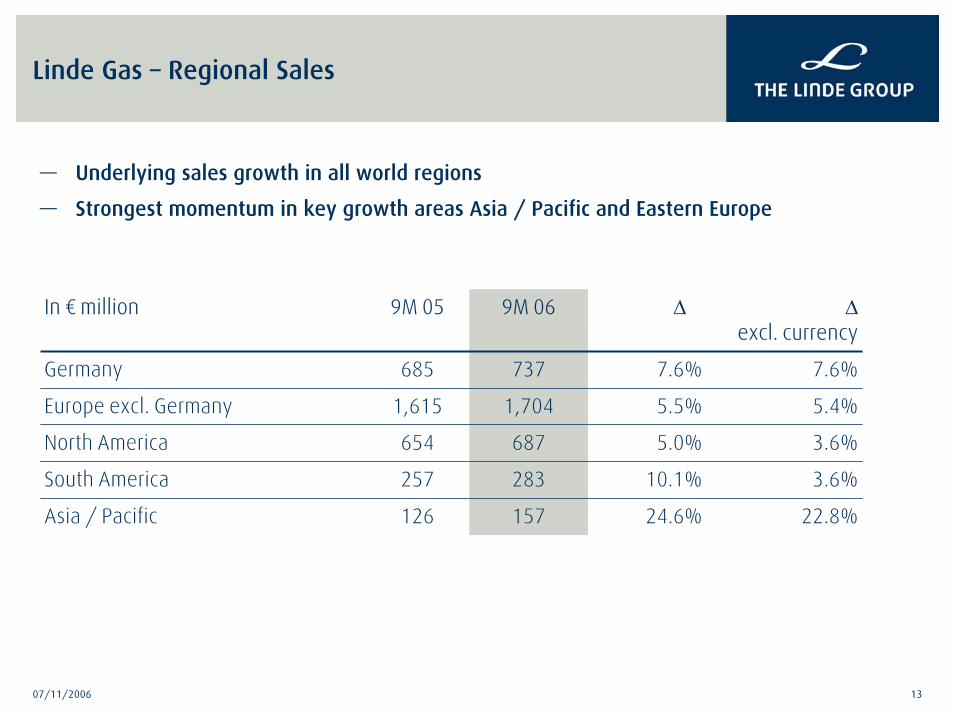
Linde Gas – Regional Sales
— Underlying sales growth in all world regions
— Strongest momentum in key growth areas Asia / Pacific and Eastern Europe
126
257
654
1,615
685
9M 05
157
283
687
1,704
737
9M 06
22.8%24.6%Asia / Pacific
3.6%10.1%South America
3.6%5.0%North America
5.4%5.5%Europe excl. Germany
7.6%7.6%Germany
∆excl. currency
∆In € million
07/11/2006 14
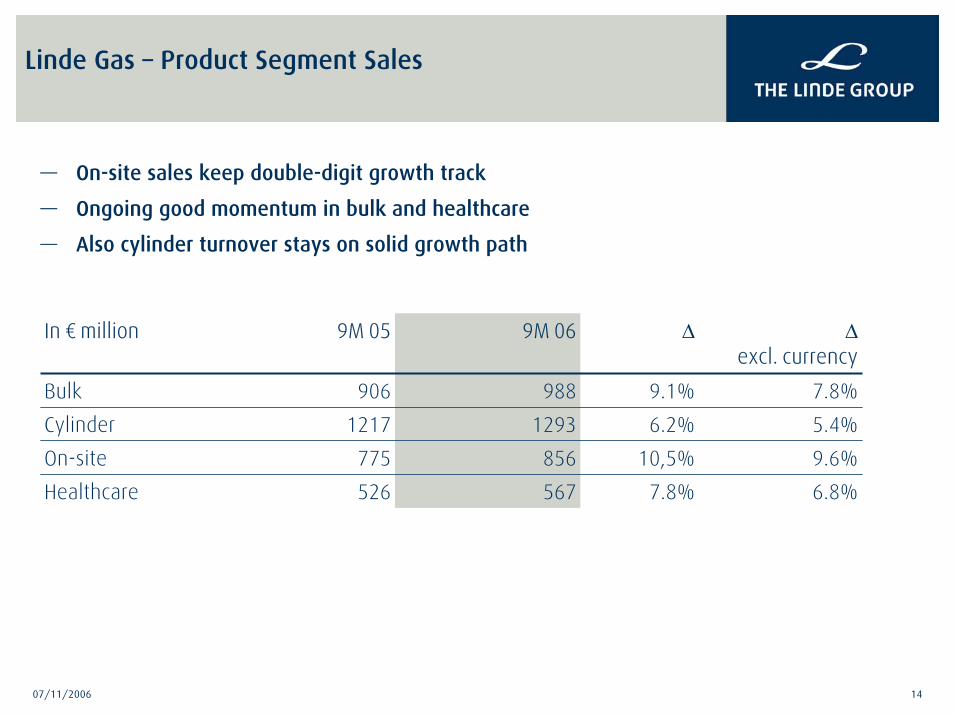
Linde Gas – Product Segment Sales
— On-site sales keep double-digit growth track
— Ongoing good momentum in bulk and healthcare
— Also cylinder turnover stays on solid growth path
526
775
1217
906
9M 05
567
856
1293
988
9M 06
6.8%7.8%Healthcare
9.6%10,5%On-site
5.4%6.2%Cylinder
7.8%9.1%Bulk
∆excl. currency
∆In € million
07/11/2006 15
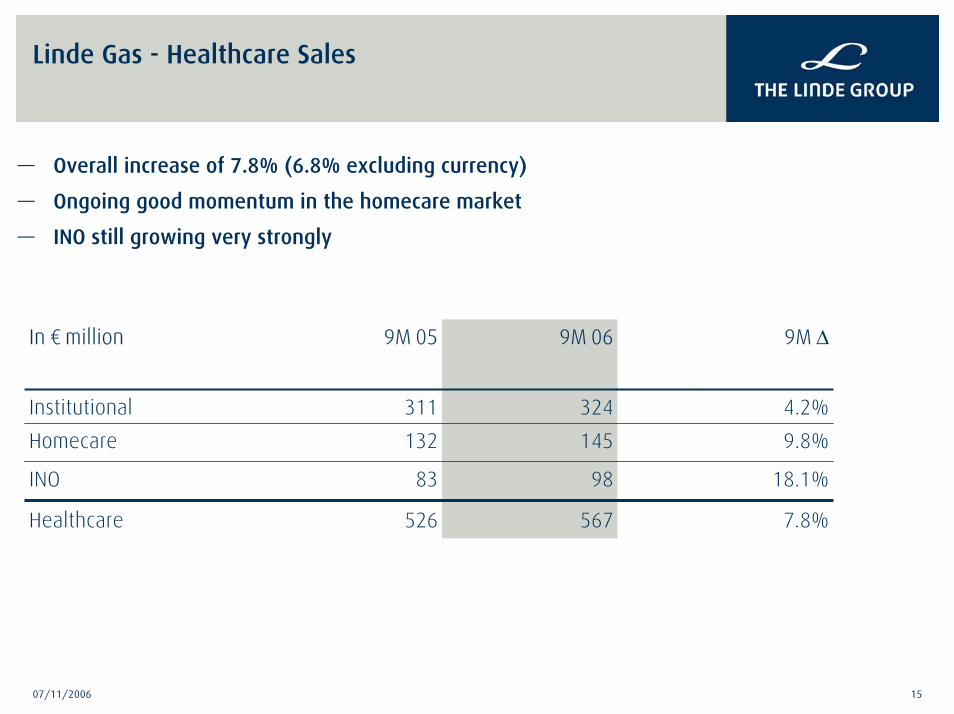
Linde Gas - Healthcare Sales
— Overall increase of 7.8% (6.8% excluding currency)
— Ongoing good momentum in the homecare market
— INO still growing very strongly
18.1%9883INO
526
132
311
9M 05
7.8%567Healthcare
9.8%145Homecare
4.2%324Institutional
9M ∆9M 06In € million
07/11/2006 16
Linde Gas – stable, profitable growth
— Underlying sales growth at attractive 6.8% in the first 9 months 2006
— Strong contribution from growth regions Asia and Eastern Europe
— All product segments support the growth track
— Ongoing strong momentum in On-site
— Linde Gas is at the leading edge in terms of profitability
— Improvement of 1% leads to strong 16,3% EBIT margin after 9 months
— Combined margins will be lower initially
— Positive margin trend to be driven by integration synergies and GAP program
— Integration with BOC fully at work
— Board changes have been followed by assignments down the pyramid
— 29 integration teams allow specialists to work on the ground
— Quickest wins in purchasing and head-office functions
Outlook for FY 2006 unchanged: — Increase in sales and EBIT
07/11/2006 17
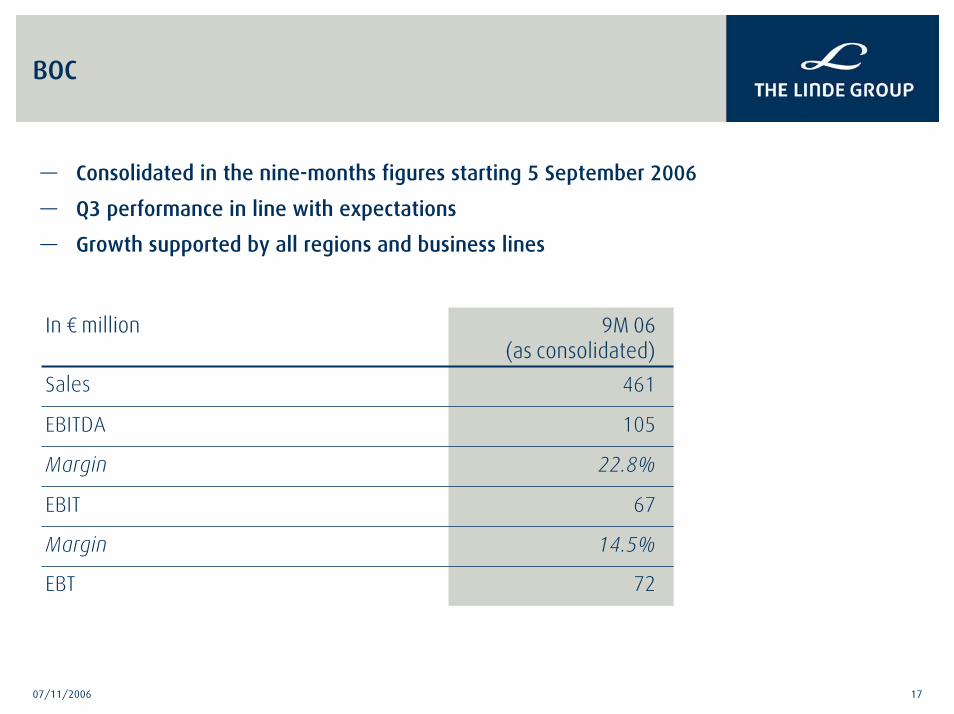
BOC
— Consolidated in the nine-months figures starting 5 September 2006
— Q3 performance in line with expectations
— Growth supported by all regions and business lines
67EBIT
22.8%Margin
105EBITDA
72EBT
14.5%Margin
461Sales
9M 06(as consolidated)
In € million
07/11/2006 18
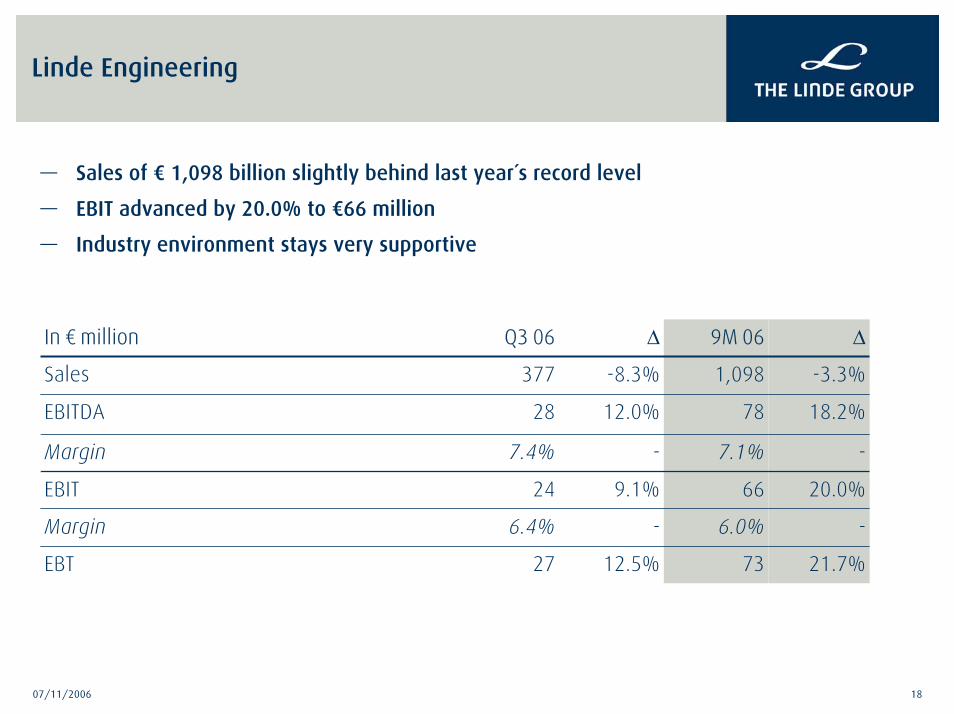
Linde Engineering
— Sales of € 1,098 billion slightly behind last year´s record level
— EBIT advanced by 20.0% to €66 million
— Industry environment stays very supportive
12.5%
-
9.1%
-
12.0%
-8.3%
∆
27
6.4%
24
7.4%
28
377
Q3 06
20.0%66EBIT
-7.1%Margin
18.2%78EBITDA
21.7%73EBT
-6.0%Margin
-3.3%1,098Sales
∆9M 06In € million
07/11/2006 19
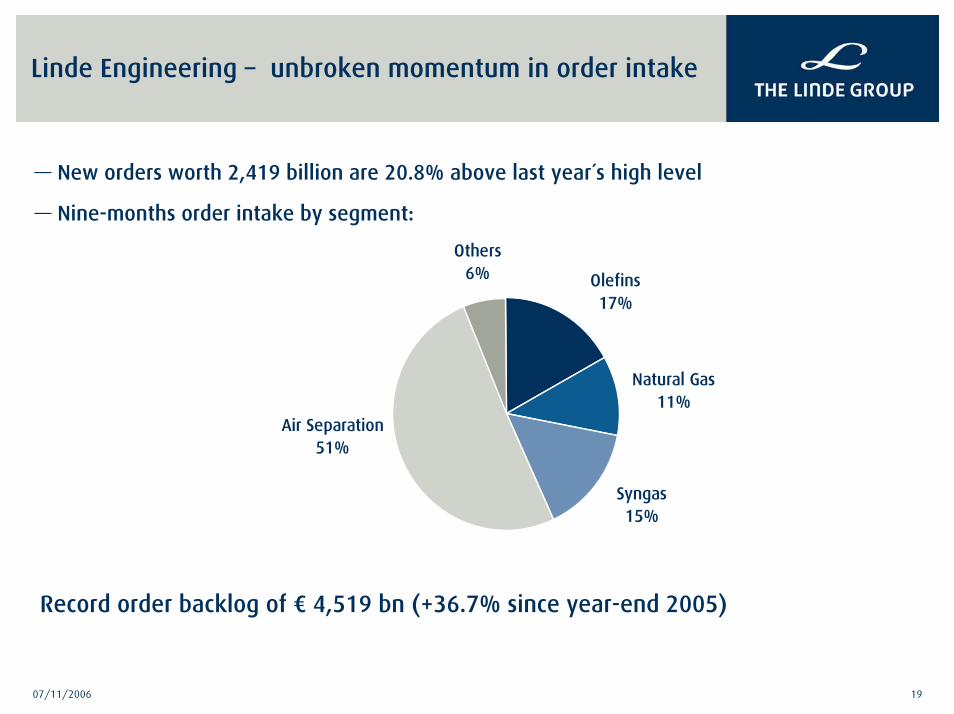
Linde Engineering – unbroken momentum in order intake
— New orders worth 2,419 billion are 20.8% above last year´s high level
— Nine-months order intake by segment:
Record order backlog of € 4,519 bn (+36.7% since year-end 2005)
Others6%
Air Separation51%
Syngas15%
Natural Gas11%
Olefins17%
07/11/2006 20
Linde Engineering – strong demand accross all end markets
— Major order for GTL in Qatar reflects broad market potential in the energy sector
— Strong fundamentals in the industrial gas market feed the order pipeline in airseparation and syngas / hydrogen
— Two more orders for LNG (Wesfarmers, Australia) and LPG (Petrom S.A., Romania) showgradual development of these markets and attractiveness of our technology solutions
— Ongoing demand for new capacities from Asian, Middle East and Russian petrochemicalsin the Olefin segment
Outlook for FY 2006 unchanged:— Sales and EBIT above last year
KION Group
07/11/2006 22
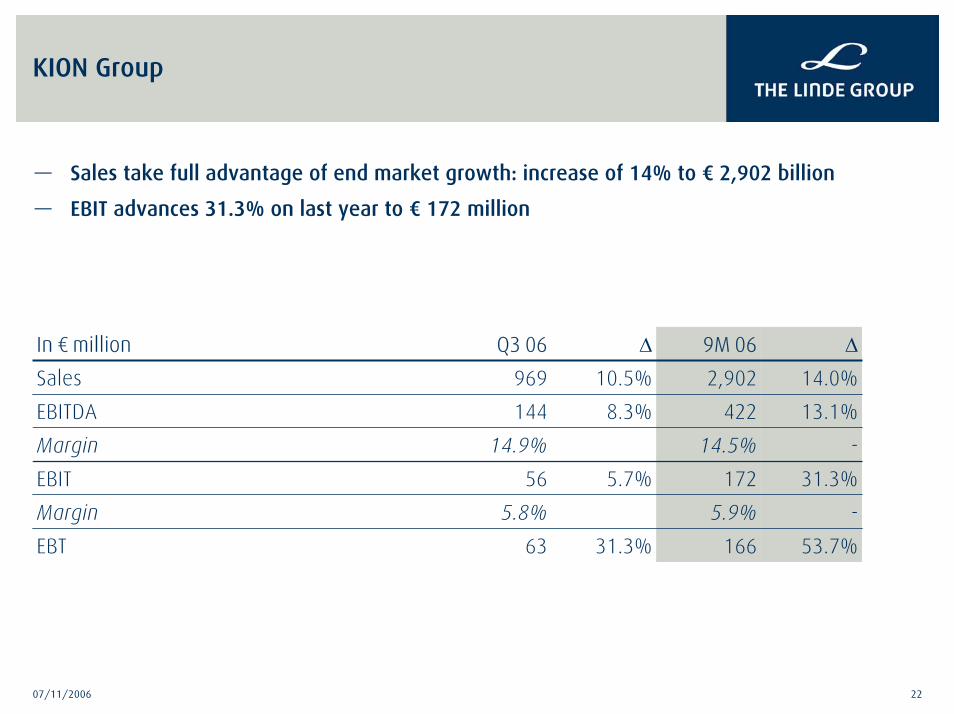
KION Group
— Sales take full advantage of end market growth: increase of 14% to € 2,902 billion
— EBIT advances 31.3% on last year to € 172 million
31.3%
5.7%
8.3%
10.5%
∆
63
5.8%
56
14.9%
144
969
Q3 06
31.3%172EBIT
-14.5%Margin
13.1%422EBITDA
53.7%166EBT
-5.9%Margin
14.0%2,902Sales
∆9M 06In € million
07/11/2006 23
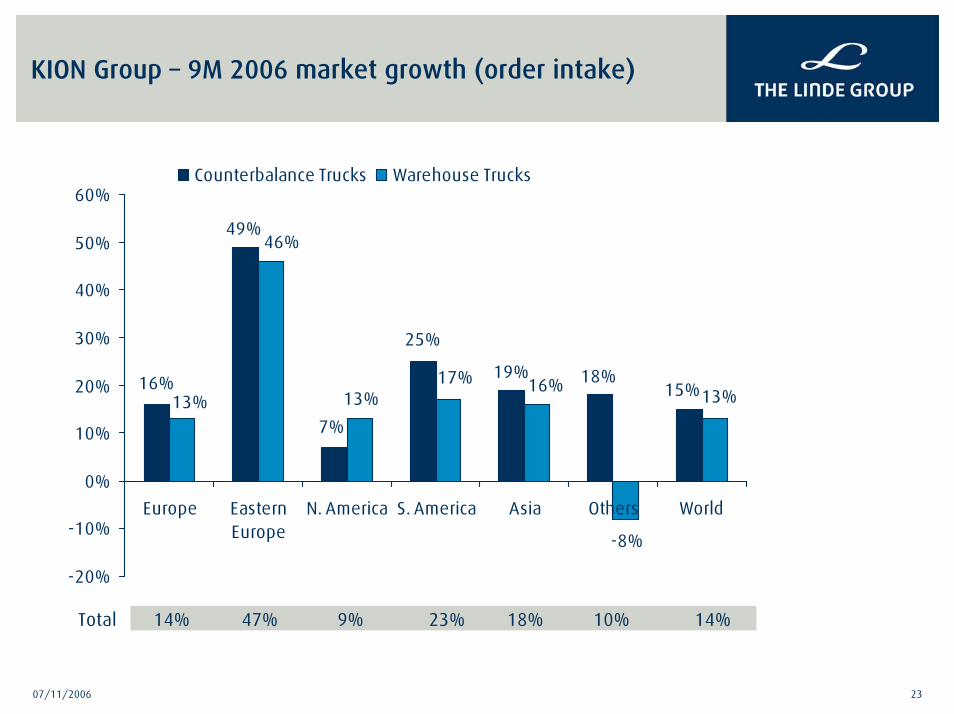
KION Group – 9M 2006 market growth (order intake)
19% 18%
49%
15%16%
7%
25%
13%17% 16%
13%13%
46%
-8%
-20%
-10%
0%
10%
20%
30%
40%
50%
60%
Europe EasternEurope
N. America S. America Asia Others World
Counterbalance Trucks Warehouse Trucks
14% 47% 9% 23% 18% 10% 14%Total
07/11/2006 24
KION Group: Operating performance on solid growth track
— Strong end markets leveraged into double-digit sales growth
— Growth in global order intake of 14% supported by all world regions
— Asia (China) and Eastern Europe show again the strongest underlying increase
— Strong industry fundamentals based on build-up of logistics infrastructure in response to globalising product flow
— No reason to expect any fundamental change in this positive market environment
— Underlying profitability trend remains on track
— Exceptional one-off costs related to the dual track disposal process
— Performance culture and GO program keep organisation focused on efficiency
— Underlying positive margin trend towards 16% ROCE target in 2007 intact
Outlook for FY 2006 unchanged:— Increase in sales and significant improvement of operating profit (EBIT)
Thank you for your attention.


