JAPAN INTERNATIONAL COOPERATION AGENCY (JICA) NATIONAL ECONOMIC AND DEVELOPMENT AUTHORITY (NEDA) ROADMAP FOR TRANSPORT INFRASTRUCTURE DEVELOPMENT FOR METRO MANILA AND ITS SURROUNDING AREAS (REGION III & REGION IV-A) FINAL REPORT TECHNICAL REPORT NO. 2 TRANSPORT DEMAND ANALYSIS March 2014 ALMEC CORPORATION
Transcript
JAPAN INTERNATIONAL COOPERATION AGENCY (JICA) NATIONAL ECONOMIC AND DEVELOPMENT AUTHORITY (NEDA)
ROADMAP FOR TRANSPORT INFRASTRUCTURE DEVELOPMENT FOR METRO MANILA AND ITS SURROUNDING AREAS
(REGION III & REGION IV-A)
FINAL REPORT
TECHNICAL REPORT NO. 2
TRANSPORT DEMAND ANALYSIS
March 2014
ALMEC CORPORATION
i
TABLE OF CONTENTS
1 INTRODUCTION
2 DEMAND FORECAST METHODOLOGY
2.1 Broad Approach ............................................................................................................. 2-1 2.2 Study Area Traffic Zone System .................................................................................... 2-3 2.3 Development of the Study Area Base Year (2012) Travel Demand O/D Tables ........... 2-4 2.4 Base Year(2012)Traffic Model Networks ....................................................................... 2-5 2.5 Validation of the Base Year (2012) O/D Tables ............................................................. 2-9
3 CHARACTERISTICS OF EXISTING TRAVEL DEMAND
3.1 Characteristics of Road Traffic Demand and Existing Network Performance ............... 3-1 3.2 Characteristics of Railways in MM ................................................................................. 3-6 3.3 Philippine National Railways (PNR) .............................................................................. 3-7 3.4 Metro Manila Urban Mass Transit Lines ........................................................................ 3-8 3.5 Metro Manila Urban Mass Transit Lines – Capacity Constraints ................................ 3-10 3.6 Traffic Management and Demand Management in Mega Manila ................................3-11
5.1 Development of 2030 ‘Do-maximum’ Highway/ Rail Networks ..................................... 5-1 5.2 Highway Network ........................................................................................................... 5-2 5.3 Railway Network ............................................................................................................ 5-5 5.4 Proposed Do-maximum Network Performance ............................................................. 5-7 5.5 Proposed Short Term 2016 Network Performance ...................................................... 5-10
ANNEXES
Annex A: Study Area Zone System ............................................................................................ A-1 Annex B: Vehicle Operating Cost and Value of Time ................................................................ C-1
ii
LIST OF TABLES
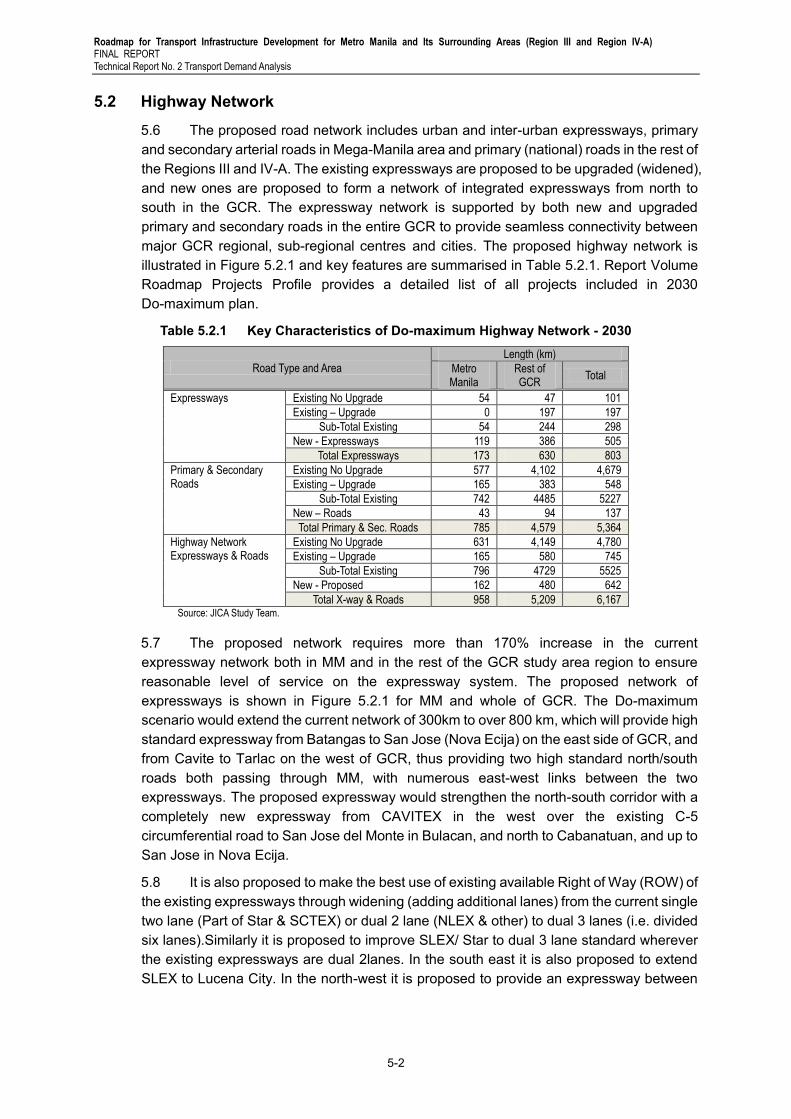
Table 2.2.1 Study Traffic Zone System and its Compatibility with Other Projects ........................... 2-3 Table 2.3.1 Formation of Initial 2012 O/D Tables – Sources of O/D Trips ....................................... 2-4 Table 2.4.1 Key Characteristics of the Study Area Traffic Model Network ...................................... 2-5 Table 2.4.2 Road Network Capacities and Maximum Speed .......................................................... 2-6 Table 2.4.3 Assignment Model Parameters – 2012 Road Transport 2012 ..................................... 2-6 Table 2.4.4 Assignment Model Parameters 2012 - Railways .......................................................... 2-7 Table 2.5.1 Road Network Capacities and Maximum Speed .......................................................... 2-9 Table 2.5.2 Comparison of Observed and Modeled Patronage on MM Railways ......................... 2-10 Table 2.5.3 Summary of 2012 Inter-Zonal Trips by Study Area Regions ...................................... 2-10 Table 3.1.1 Travel Demand in the Study Area – Inter-Zonal Trips ................................................... 3-1 Table 3.1.2 Summary of Road Traffic Volume and Network Performance ...................................... 3-2 Table 3.1.3 Summary of Road Traffic Volume and Network Performance ...................................... 3-4 Table 3.2.1 Characteristics of Travel Demand by Railways in MM ................................................. 3-6 Table 4.2.1 Growth in Travel Demand by Mode of Travel (Inter-zonal Trips ‘000) .......................... 4-1 Table 4.2.2 Summary of Growth in Travel (Trip-ends) by Region ................................................... 4-2 Table 4.3.1 Assignment Model Parameters 2030 ........................................................................... 4-4 Table 4.3.2 Comparison of 2030 Do-Nothing and 2012 Assignments – Metro Manila .................... 4-5 Table 4.3.3 Comparison of 2012 and 2030 Traffic Impacts of Do-Nothing, in Mega Manila (Excluding MM) ................................................................................... 4-6 Table 4.3.4 Comparison of 2012 and 2030 Traffic Impacts Do-Nothing, Mega Manila ................... 4-7 Table 4.3.5 Comparison of 2012 and 2030 Traffic Impacts of Do-Nothing, in Rest of Regions III and IV-A .................................................................................................. 4-7 Table 4.3.6 Comparison of 2012 and 2030 Traffic Impacts of Do-Nothing, in GCR ........................ 4-8 Table 5.2.1 Key Characteristics of Do-maximum Highway Network - 2030 .................................... 5-2 Table 5.3.1 2030 Do-maximum Proposed Railway Network – Key Characteristics ........................ 5-6 Table 5.4.1 2030 Do-Maximum Network Performance – Metro Manila Area .................................. 5-7 Table 5.4.2 2030 Do-Maximum Network Performance – GCR Study Area ..................................... 5-9 Table 5.5.1 Highway, Expressway, Other Roads, Railways Short Term Projects ......................... 5-10 Table 5.5.2 Short Term (ST) Plan Performance – GCR Study Area .............................................. 5-11
iii
LIST OF FIGURES
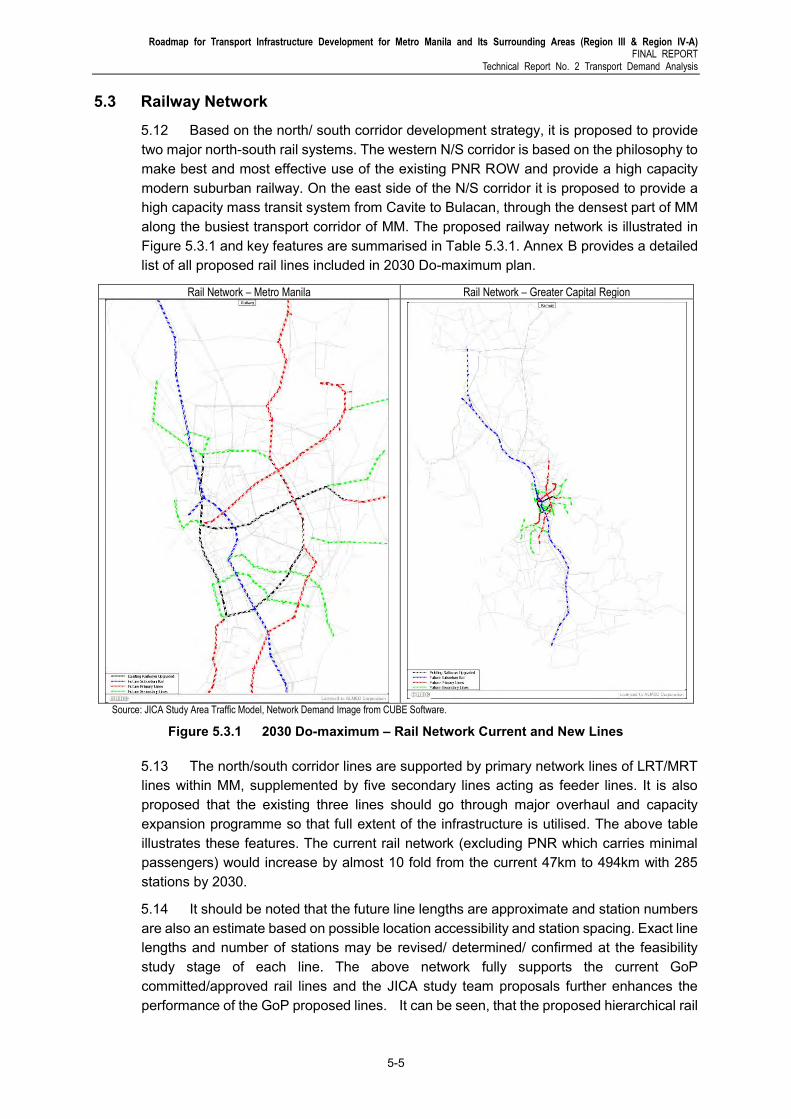
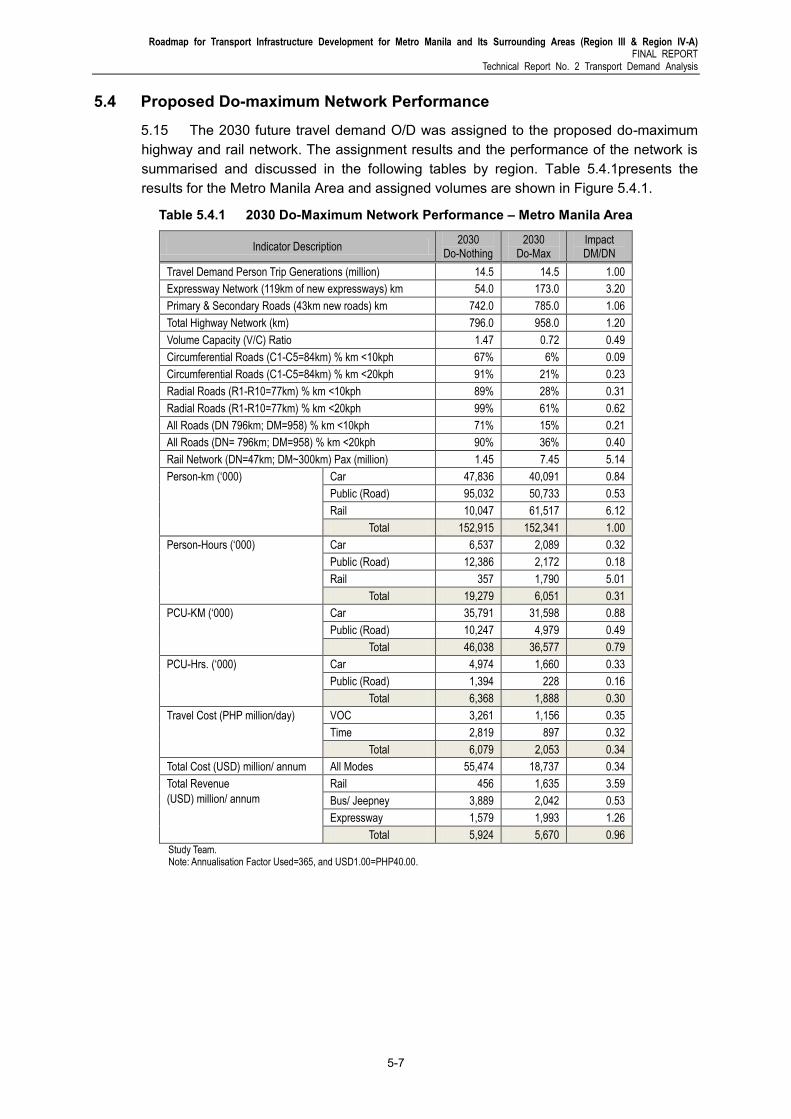
Figure 2.1.1 Traffic Demand Analysis – Methodology ...................................................................... 2-2 Figure 2.4.1 Volume Delay Function ................................................................................................. 2-6 Figure 2.4.2 Study Area Base Year Traffic Model – Highway Network ............................................. 2-7 Figure 2.4.3 Study Area Base Year Traffic Model – Rail Network ..................................................... 2-8 Figure 3.1.1 Traffic Model – Highway Network Traffic Volume and V/C Ratio .................................. 3-3 Figure 3.1.2 Travel Demand by Mode –Person Trips by Car, Jeepney and Bus .............................. 3-5 Figure 4.2.1 Travel Demand Comparison by Region for 2012 and 2030 ......................................... 4-2 Figure 4.2.2 Trip Length Distribution of 2012 and 2030 Private and Public Trips ............................ 4-3 Figure 4.2.3 Mode Share 2012 and 2030 Private and Public Trips .................................................. 4-3 Figure 4.3.1 2030 Travel Demand Impact on 2012 (Do-Nothing) Network ...................................... 4-4 Figure 5.2.1 2030 Do-maximum Highway Network Expressways .................................................... 5-3 Figure 5.2.2 2030 Do-maximum – Road Network Existing, Upgrades & New Roads ...................... 5-4 Figure 5.3.1 2030 Do-maximum – Rail Network Current and New Lines ......................................... 5-5 Figure 5.4.1 2030 Do-maximum – Highway Network Performance ................................................. 5-8 Figure 5.4.2 2030 Do-maximum – Expressway and Railway Network Performance ....................... 5-8 Figure 5.5.1 Do-Nothing Network Performance and Short Term Plan Projects .............................. 5-12 Figure 5.5.2 2016 Network Performance and Railway Demand..................................................... 5-12
iv
ABBREVIATIONS
ADB Asian Development Bank AFCS automatic fare collection system ATI Asian Terminals Inc. BCDA Bases Conversion and Development Authority BMDS bus management and dispatch facilities BOT build–operate–transfer BPO business process outsourcing BRT bus rapid transit CALA Cavite Laguna CALABARZON Cavite, Laguna, Batangas, Rizal and Quezon CAMANAVA Caloocan, Malabon, Navotas and Valenzuela CBD central business district CBU completely built unit CCW center/cluster-corridor-wedge CIAC Clark International Airport CLUP comprehensive land use plans DBM Department of Budget and Management DBP Development Bank of the Philippines DMIA Diosdado Macapagal International Airport DOF Department of Finance DOST Department of Science and Technology DOTC Department of Transportation and Communications RTPD Road Transport Planning Division DPWH Department of Public Works and Highways ECC environmental compliance certificate EDSA Epifanio de los Santos Avenue FTI Food Terminal, Inc. GCR greater capital region GDP gross domestic product GRDP gross regional domestic product HCPTI Harbour Centre Port Terminal Inc. HLURB Housing and Land Use Regulatory Board HUDCC Housing and Urban Development Coordinating
Council ICTSI International Container Terminal Service, Inc. Infracom infrastructure committee IRR internal rate of return ITS integrated transport system JBIC Japan Bank for International Cooperation JICA Japan International Cooperation Agency LGU local government unit LRT Light Rail Transit LRTA Light Rail Transit Authority LTFRB Land Transportation Franchising & Regulatory Board MIAA Manila International Airport Authority MICT Manila International Container Terminal MMDA Metro Manila Development Authority MMEIRS Earthquake Impact Reduction Study for Metro Manila MMPTS Mega Manila Public Transport Study MMUTIS Metro Manila Urban Transportation Integration Study MNL Manila North Line
v
MNTC Manila North Tollways Corporation MNHPI Manila North Harbour Port Inc. MPDTC Metro Pacific Tollways Development Corp. MPPA million passengers per annum MRO maintenance, repair and overhaul MRT Metro Rail Transit MSL Manila South Line MTDP medium-term development plan NAIA Ninoy Aquino International Airport NCR National Capital Region NEDA National Economic and Development Authority ICC Investment Coordination Committee NLEX North Luzon Expressway NSCB National Statistical Coordination Board NSO National Statistics Office O&M operations and maintenance ODA Official Development Assistance OTCA Overseas Technical Cooperation Agency PDP Philippine Development Plan PEZA Philippine Economic Zone Authority PIBAS provincial integrated bus axis system PNCC Philippine National Construction Corporation PNR Philippine National Railways PPA Philippine Port Authority PPP public-private-partnership PUB public utility bus PUJ public utility jeepney Php Philippine peso R&D research and development RDA regional development agenda RET rapid exit taxiways ROW right-of-way SBF Subic Bay Freeport Zone SBPDP Subic Bay Port Development Project SCMB Subic-Clark-Manila- Batangas SCTEX Subic-Clark-Tarlac Expressway SLEX South Luzon Expressway SLTC South Luzon Tollway Corporation SOE state-owned enterprise STAR Southern Tagalog Arterial Road TEAM traffic engineering and management TEU twenty-foot equivalent units USAID United States Agency for International Development USD US dollar UV utility vehicle VFR visual flight rules WB World Bank
Roadmap for Transport Infrastructure Development for Metro Manila and Its Surrounding Areas (Region III & Region IV-A) FINAL REPORT
Technical Report No. 2 Transport Demand Analysis
1-1
1 INTRODUCTION
1.1 In recent years a number of transport sector studies have been conducted for the Metro Manila (MM) and its adjoining provinces. Most of these studies have been either related to a single transport mode/sector or specifically for a particular project. No study, since MMUTIS (Metro Manila Urban Transportation Integration Study, March 1999) has assessed the changes in land use, population growth and the transportation infrastructure as a whole. One of the key objectives of this study is to assess the performance of the current transport infrastructure in the Greater Capital Region (GCR), particularly in the Mega-Manila area and to formulate the “Roadmap for Transport Infrastructure Development for Metro Manila and Its Surrounding Areas (Region III and Region IV-A)”.In the context of this study, detailed travel demand analysis is required to fulfil the following objectives:
(i) To provide magnitude of travel demand within MM and between MM and the adjoining provinces within the GCR;
(ii) Provide information on current and future travel patterns in the GCR for the short, medium, and long term situation, especially by main modes of travel;
(iii) To assist in the identification of network capacity deficiencies, particularly by modes of travel; and
(iv) To assess the performance of the on-going, committed and proposed projects.
1.2 The approach to traffic analysis was to develop and validate a travel demand model that can be used to achieve the above outlined objectives, such that:
(i) The traffic model replicates the current situation well by mode of travel; (ii) It assists in the analyses and assessment/identification of the short fall/ deficiencies in
the performance of the current transport infrastructure; (iii) Use the model to forecast future travel demand and assess the performance of the
current network and with the on-going and committed transport infrastructure projects. (iv) Prepare/ propose integrated transportation infrastructure development projects, test
and assess the performance of the proposed projects using the traffic model, and (v) Then select and prioritise the development of an integrated network of transport
infrastructure that best meets the future travel demand.
1.3 The selected transportation infrastructure projects are then further analysed to be prioritised according to not only the project(s) performance, but also taking into account the available budget constraints and opportunities. This Technical Report 2, following this introduction describes these traffic demand analysis tasks of the study.
Roadmap for Transport Infrastructure Development for Metro Manila and Its Surrounding Areas (Region III & Region IV-A) FINAL REPORT
Technical Report No. 2 Transport Demand Analysis
2-1
2 DEMAND FORECAST METHODOLOGY
2.1 Broad Approach
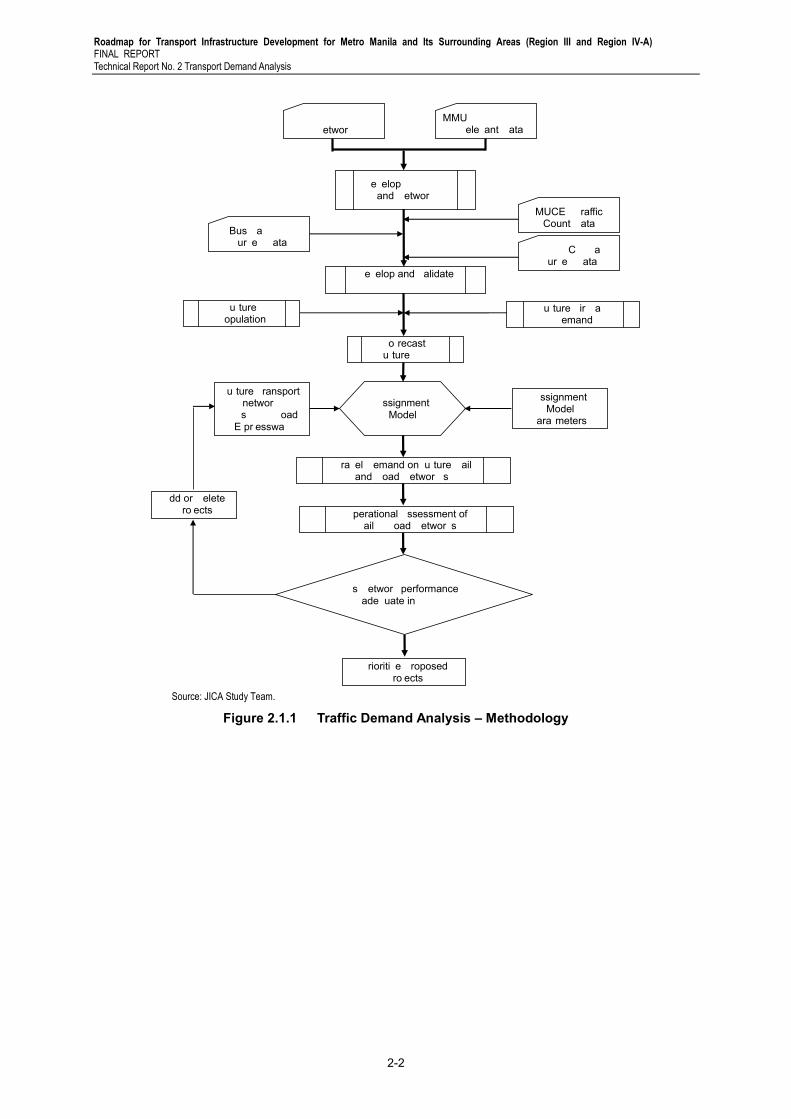
2.1 The traffic demand analysis methodology has been kept simple and relied mostly on the available data and information from recent studies. The key features of the traffic demand analysis and the forecast methodology used for the development of transportation infrastructure program is depicted in Figure 2.1.1. The key steps involved in the development, validation and use of the traffic model are summarised below and detailed in the remainder of this section.
(i) Convert MMUTIS and HSH study area O/D trip matrices to the project traffic model zone system as detailed in the following section.
(ii) Create 2012 O/D trip matrices for common base year of the project 2012. This aspect is detailed in the model validation section and shows that the traffic model replicates the current situation well by mode of travel;
(iii) Combine 2012 MMUTIS and HSH O/D trip matrices by selecting the whole of MMUTIS area trips for the Mega Manila area, and HSH O/D trips for the remainder of the GCR regions.
(iv) Develop the study area highway and railway network from HSH study and update where necessary.
(v) Validate the 2012 O/D trip matrices by assigning to the 2012 network and comparing the assigned traffic volume against the MUCEP traffic count data collected in 20012.
(vi) Prepare future year O/D trip tables and assign to the 2012 network and to the committed/ proposed highway and rail networks.
(vii) Assess the performance of the proposed projects and add/ delete projects until satisfactory integrated network development is achieved.
(viii) Prioritise projects by assessing the performance of each project relative to other projects.
(ix) Economic, financial and environmental evaluation of the proposed candidate projects using traffic model outputs.
(x) State-of-the-art ‘CUBE’ transport planning software was used for traffic modelling tasks.
Roadmap for Transport Infrastructure Development for Metro Manila and Its Surrounding Areas (Region III and Region IV-A) FINAL REPORT Technical Report No. 2 Transport Demand Analysis
Roadmap for Transport Infrastructure Development for Metro Manila and Its Surrounding Areas (Region III & Region IV-A) FINAL REPORT
Technical Report No. 2 Transport Demand Analysis
2-3
2.2 Study Area Traffic Zone System
2.2 The initial task in data gathering, manipulation and combining it for the project study area was to develop a new traffic analysis zone system. The new zone system developed for the study is compatible with other studies, mainly MMUTIS, HSH and recently completed study of Airport Express Rail study. The project study area has been defined elsewhere in this report, and the related socio-economic characteristics have been detailed in Chapter 2. The zone system developed for the project and its compatibility with other studies is summarised in Table 2.2.1.
Table 2.2.1 Study Traffic Zone System and its Compatibility with Other Projects
Area Description Number of Traffic Zones in the Study Area
Roadmap1 MMUTIS2 HSH3
Metro Manila (NCR 17 Cities) 94 94 94
Bulacan Province 26 23 26
Laguna Province 14 11 19
Rizal Province 15 19 17
Cavite Province 23 30 25
Rest of Region III 37 1 74
Rest of Region IV-A 18 1 28
Special Zones (Ports & Airports) 8 2 1
Other Areas in Luzon (Externals) 10 - 36
Total Zones 245 181 320
Source: Compiled by JICA Study Team. 1 Roadmap for Transport Infrastructure Development for MM and its Surrounding Areas (Regions III & IV-A) 2 Metro Manila Urban Transport Integration Study 1999, Forecast Model Zone System 3 The Study of High Standard Highway Network Development, 2009.
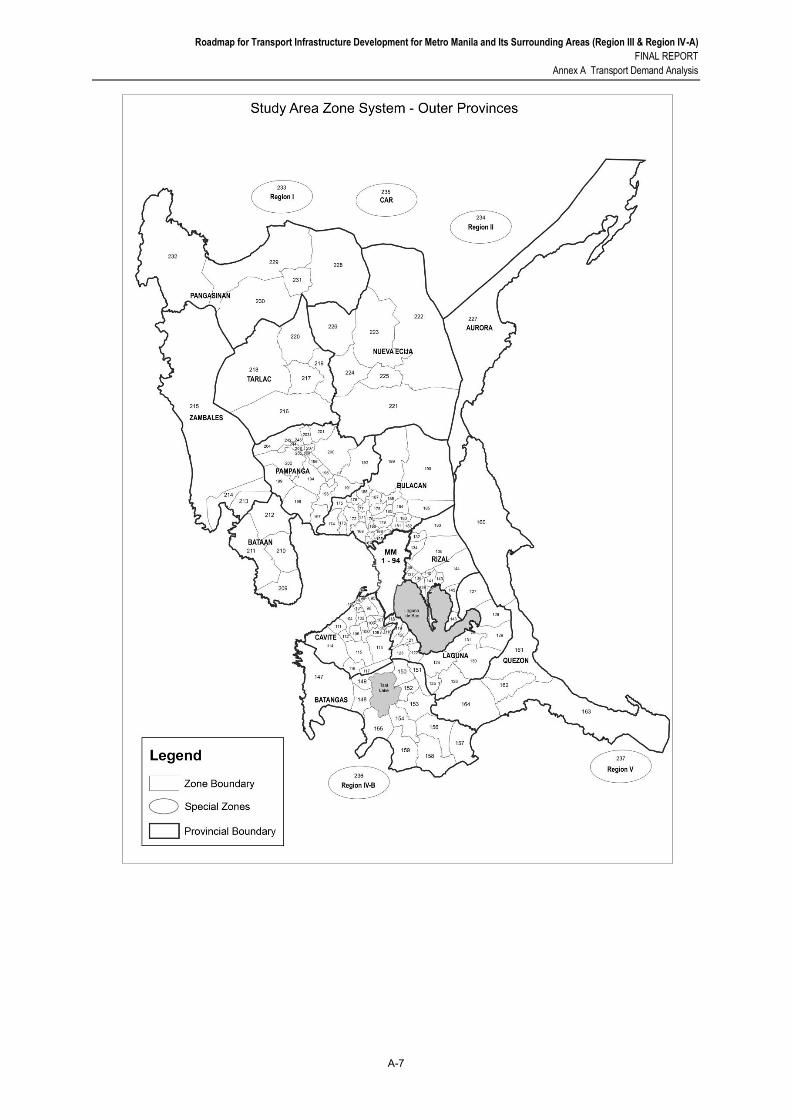
2.3 For the this project, the traffic zone system was devised such that when converting O/D trip tables to the project area, minimum detail is lost in aggregation of zones within the Greater Metro Manila (GMM) area comprising of NCR, Bulacan, Laguna, Rizal and Cavite provinces. In the outer areas with the Greater Capital Region (comprising of NCR, Region III and Region IV-A) some zones were aggregated to lose the detail that are not necessary for this project. In addition, special airport zones were created for exogenously modelling airport related landside trips. The resultant study area zone system is detailed in Annex A.
Roadmap for Transport Infrastructure Development for Metro Manila and Its Surrounding Areas (Region III and Region IV-A) FINAL REPORT Technical Report No. 2 Transport Demand Analysis
2-4
2.3 Development of the Study Area Base Year (2012) Travel Demand O/D Tables
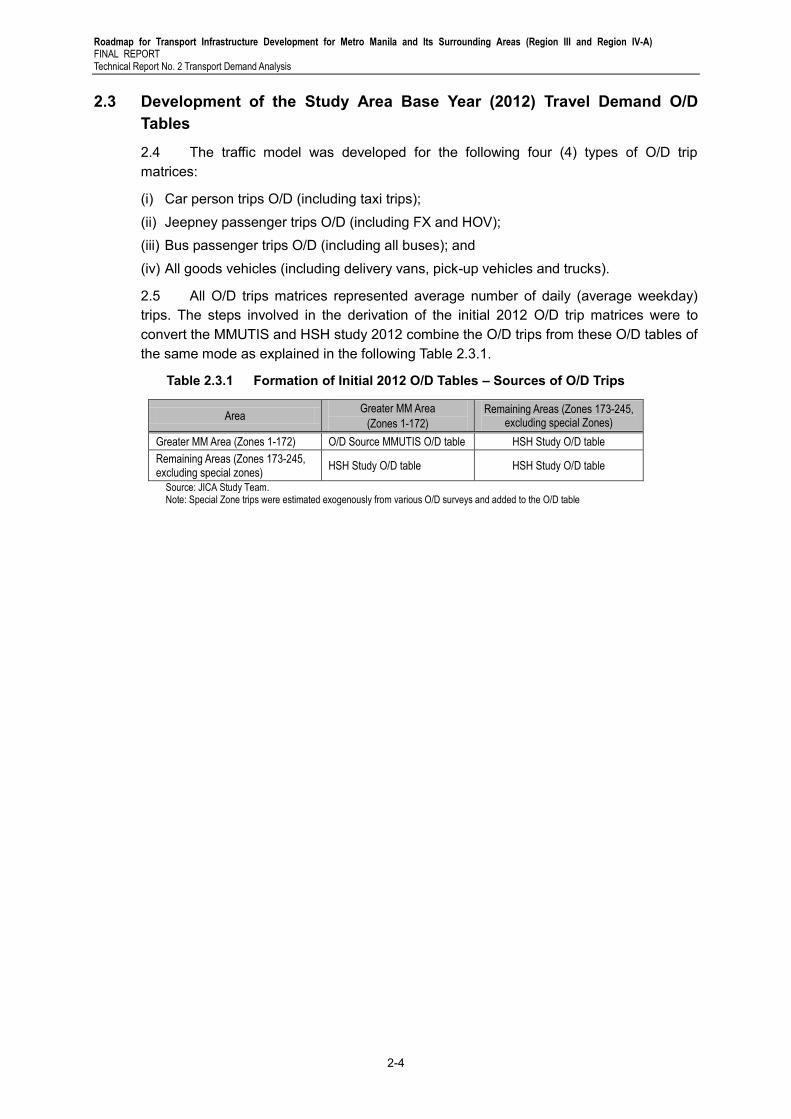
2.4 The traffic model was developed for the following four (4) types of O/D trip matrices:
(i) Car person trips O/D (including taxi trips); (ii) Jeepney passenger trips O/D (including FX and HOV); (iii) Bus passenger trips O/D (including all buses); and (iv) All goods vehicles (including delivery vans, pick-up vehicles and trucks).
2.5 All O/D trips matrices represented average number of daily (average weekday) trips. The steps involved in the derivation of the initial 2012 O/D trip matrices were to convert the MMUTIS and HSH study 2012 combine the O/D trips from these O/D tables of the same mode as explained in the following Table 2.3.1.
Table 2.3.1 Formation of Initial 2012 O/D Tables – Sources of O/D Trips
Area Greater MM Area
(Zones 1-172) Remaining Areas (Zones 173-245,
excluding special Zones) Greater MM Area (Zones 1-172) O/D Source MMUTIS O/D table HSH Study O/D table Remaining Areas (Zones 173-245, excluding special zones) HSH Study O/D table HSH Study O/D table
Source: JICA Study Team. Note: Special Zone trips were estimated exogenously from various O/D surveys and added to the O/D table
Roadmap for Transport Infrastructure Development for Metro Manila and Its Surrounding Areas (Region III & Region IV-A) FINAL REPORT
Technical Report No. 2 Transport Demand Analysis
2-5
2.4 Base Year (2012) Traffic Model Networks
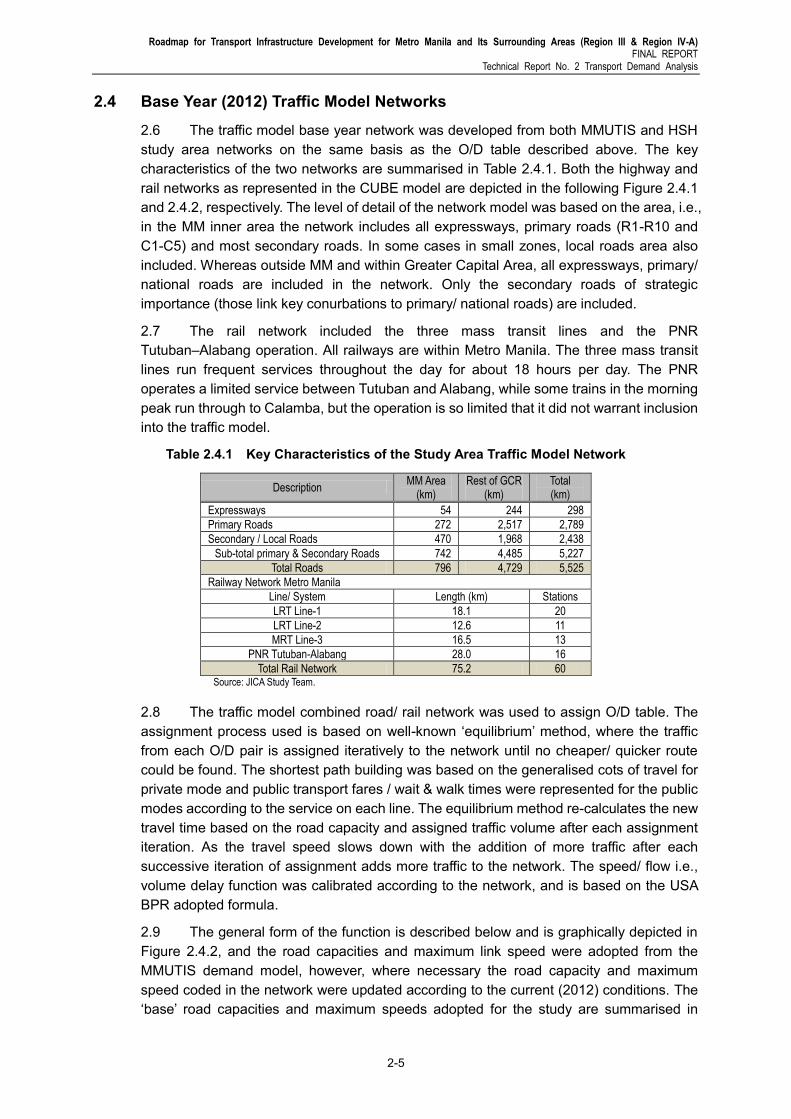
2.6 The traffic model base year network was developed from both MMUTIS and HSH study area networks on the same basis as the O/D table described above. The key characteristics of the two networks are summarised in Table 2.4.1. Both the highway and rail networks as represented in the CUBE model are depicted in the following Figure 2.4.1 and 2.4.2, respectively. The level of detail of the network model was based on the area, i.e., in the MM inner area the network includes all expressways, primary roads (R1-R10 and C1-C5) and most secondary roads. In some cases in small zones, local roads area also included. Whereas outside MM and within Greater Capital Area, all expressways, primary/ national roads are included in the network. Only the secondary roads of strategic importance (those link key conurbations to primary/ national roads) are included.
2.7 The rail network included the three mass transit lines and the PNR Tutuban–Alabang operation. All railways are within Metro Manila. The three mass transit lines run frequent services throughout the day for about 18 hours per day. The PNR operates a limited service between Tutuban and Alabang, while some trains in the morning peak run through to Calamba, but the operation is so limited that it did not warrant inclusion into the traffic model.
Table 2.4.1 Key Characteristics of the Study Area Traffic Model Network
Total Rail Network 75.2 60 Source: JICA Study Team.
2.8 The traffic model combined road/ rail network was used to assign O/D table. The assignment process used is based on well-known ‘equilibrium’ method, where the traffic from each O/D pair is assigned iteratively to the network until no cheaper/ quicker route could be found. The shortest path building was based on the generalised cots of travel for private mode and public transport fares / wait & walk times were represented for the public modes according to the service on each line. The equilibrium method re-calculates the new travel time based on the road capacity and assigned traffic volume after each assignment iteration. As the travel speed slows down with the addition of more traffic after each successive iteration of assignment adds more traffic to the network. The speed/ flow i.e., volume delay function was calibrated according to the network, and is based on the USA BPR adopted formula.
2.9 The general form of the function is described below and is graphically depicted in Figure 2.4.2, and the road capacities and maximum link speed were adopted from the MMUTIS demand model, however, where necessary the road capacity and maximum speed coded in the network were updated according to the current (2012) conditions. The ‘base’ road capacities and maximum speeds adopted for the study are summarised in
Roadmap for Transport Infrastructure Development for Metro Manila and Its Surrounding Areas (Region III and Region IV-A) FINAL REPORT Technical Report No. 2 Transport Demand Analysis
2-6
Table 2.4.2.Other assignment model parameters are listed in Table 2.4.3, and the related railway assignment parameters are given in Table 2.4.4.
𝑇𝑥 = 𝑇0 {1 + 𝛼 (𝑉
𝐶)
𝛽
}
Where: Tx= Travel Time at a Volume/Capacity Ratio x,T0= Travel Time at Maximum Speed,
V=Traffic Volume in PCU, C=Road Capacity in PCU; and
𝛼and𝛽 are Calibrated Parameters with values: 𝛼 = 3.0, 𝛽 = 4.0
Source: MMUTIS Study and Updated by JICA Study Team.
Figure 2.4.1 Volume Delay Function
Table 2.4.2 Road Network Capacities and Maximum Speed
Area Road Category Carriageway
Type Capacity 1-way
pcu/hr/lane Maximum Speed
Inside EDSA Local road Single 220 30
Secondary Single 440 40
Primary Single 660 45
Outside EDSA Inside MM (including EDSA)
Secondary Single 770 50
Primary Single 825 60
Secondary Divided 1,400 70
Primary Divided 1,650 80
Outside MM Local road Single 800 30
Secondary Single 1,100 55
Primary Single 1,540 60
Urban / Inter City Access / egress Single 1,500 80
Expressway Single 1,700 80
Expressway Divided 2,000 100 Source: MMUTIS Study and Updated by JICA Study Team where Appropriate.
Table 2.4.3 Assignment Model Parameters – 2012 Road Transport 2012
Parameter Description Car Jeepney Bus Truck
Average 24-hour Occupancy (Person) 1.70 10.02 35.28 n/a
PCU Factor 1.00 1.50 2.00 2.00
Value of Time (PHP/min) 1.86 1.30 1.30 n/a
Vehicle Operating Cost (PHP/km) 7.30 n/a n/a n/a
Toll Rate Within MM (PHP/km) 10.30 10.30 20.60 30.90
Toll Rate Outside MM (PHP/km) 3.40 3.40 6.80 10.20
Perceived Toll Factor 1.00 0 0 0.50
Public Transport Fare (PHP/km) n/a 2.00 1.72 n/a Source: JICA Study Team.
-
10.0
20.0
30.0
40.0
50.0
60.0
70.0
80.0
90.0
100.0
- 0.50 1.00 1.50
Spee
d (k
ph)
Vol/Capacity Ratio
Volume Delay Curves - Speed Change
Roadmap for Transport Infrastructure Development for Metro Manila and Its Surrounding Areas (Region III & Region IV-A) FINAL REPORT
Technical Report No. 2 Transport Demand Analysis
2-7
Table 2.4.4 Assignment Model Parameters 2012 - Railways
Parameter Description LRT-1 LRT-2 MRT-3 PNR
Average Peak Hour Headway (mins) 3.0 5..0 2.5 30.0
Average Speed (km/h) 26.0 29.6 29.5 26.1
Boarding Fare (PHP/boarding) 12.0 12.0 10.0 10.0
Additional Fare (Boarding + PHP/km) 0.45 0.18 0.28 0.30
Perceived Wait Time (Factor) 1.3 1.3 1.3 1.3
Access Walk Speed (km/h) 4.0 4.0 4.0 4.0 Source: JICA Study Team.
Study Area (GCR) – Highway Network Metro Manila Area – Highway Network
Source: Study Area Traffic Model, Network Image from CUBE Software.
Figure 2.4.2 Study Area Base Year Traffic Model – Highway Network
Roadmap for Transport Infrastructure Development for Metro Manila and Its Surrounding Areas (Region III and Region IV-A) FINAL REPORT Technical Report No. 2 Transport Demand Analysis
2-8
Source: JICA Study Team.
Figure 2.4.3 Study Area Base Year Traffic Model – Rail Network
Roadmap for Transport Infrastructure Development for Metro Manila and Its Surrounding Areas (Region III & Region IV-A) FINAL REPORT
Technical Report No. 2 Transport Demand Analysis
2-9
2.5 Validation of the Base Year (2012) O/D Tables
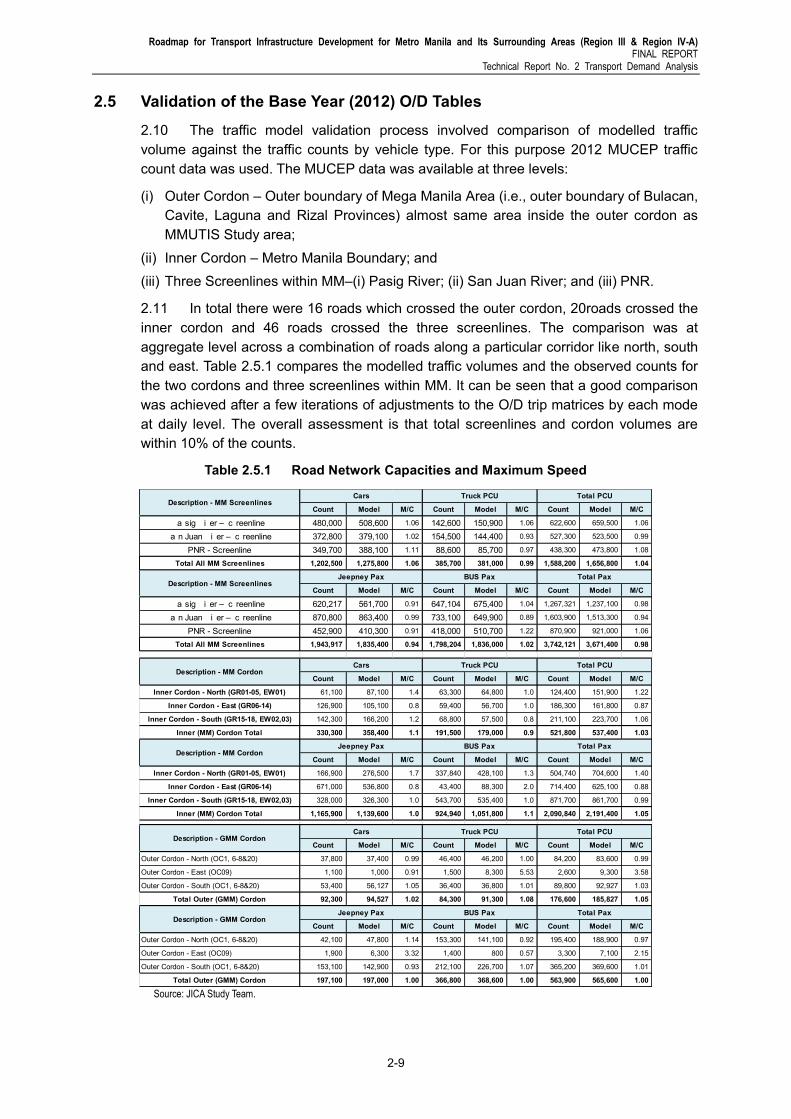
2.10 The traffic model validation process involved comparison of modelled traffic volume against the traffic counts by vehicle type. For this purpose 2012 MUCEP traffic count data was used. The MUCEP data was available at three levels:
(i) Outer Cordon – Outer boundary of Mega Manila Area (i.e., outer boundary of Bulacan, Cavite, Laguna and Rizal Provinces) almost same area inside the outer cordon as MMUTIS Study area;
(ii) Inner Cordon – Metro Manila Boundary; and (iii) Three Screenlines within MM–(i) Pasig River; (ii) San Juan River; and (iii) PNR.
2.11 In total there were 16 roads which crossed the outer cordon, 20roads crossed the inner cordon and 46 roads crossed the three screenlines. The comparison was at aggregate level across a combination of roads along a particular corridor like north, south and east. Table 2.5.1 compares the modelled traffic volumes and the observed counts for the two cordons and three screenlines within MM. It can be seen that a good comparison was achieved after a few iterations of adjustments to the O/D trip matrices by each mode at daily level. The overall assessment is that total screenlines and cordon volumes are within 10% of the counts.
Table 2.5.1 Road Network Capacities and Maximum Speed
Source: JICA Study Team.
Count Model M/C Count Model M/C Count Model M/C
a sig i er – c reenline 480,000 508,600 1.06 142,600 150,900 1.06 622,600 659,500 1.06
a n Juan i er – c reenline 372,800 379,100 1.02 154,500 144,400 0.93 527,300 523,500 0.99
Roadmap for Transport Infrastructure Development for Metro Manila and Its Surrounding Areas (Region III and Region IV-A) FINAL REPORT Technical Report No. 2 Transport Demand Analysis
2-10
2.12 Validation of person trips on railways was carried by comparing the modelled patronage with the total daily boarding on each line and the results are summarised in Table 2.5.2. It can be seen that the total modelled rail patronage is within 10% of the average daily volume of all lines. The Line-1 modelled daily demand is 17% higher than the observed volume. This was further analysed and was deemed to be acceptable as the modelling process is set-up to forecast overall demand rather than each station by station volumes, which requires a greater level of detail of rail line access (road and walk) network and finer/ smaller traffic zone system than adopted for this strategic network assessment model. In the case of PNR patronage the actual boarding numbers are small and are not of much concern. As the service provided is erratic and observed volume are also subject to large daily fluctuations.
Table 2.5.2 Comparison of Observed and Modeled Patronage on MM Railways
Source: JICA Study Team.
2.13 The model validation process yielded the 2012 O/D trip matrices by four modes of travel. Table2.5.3 summarises the total Inter-Zonal trips in each trip O/D table by region.
Table 2.5.3 Summary of 2012 Inter-Zonal Trips by Study Area Regions
Source: JICA Study Team.
Count Model M/CLine-1 Baclaran to Roosevelt 518,600 605,100 1.17Line-2 Recto to Santolan 212,000 206,500 0.97Line-3 Taft to North Avenue 570,000 577,900 1.01PNR Tutuban to Alabang 46,700 61,200 1.31
Total MM Railways 1,347,300 1,450,700 1.08
Description - Railway LineDaily Railway Pax
TRSD - 2012 Validated Person Trips by Car Pax ('000)No. City/Province/ Region 1 2 3 Total1 Metro Manila 4,077.9 73.1 20.3 4,171.4 2 Bulacan+Laguna+Rizal+Cavite 73.1 1,711.6 18.6 1,803.2 3 Rest of GCR 20.3 18.6 156.3 195.2
4,171.4 1,803.2 195.2 6,169.8
TRSD - 2012 Validated Person Trips by Jeepney Pax ('000)No. City/Province/ Region 1 2 3 Total1 Metro Manila 5,307.3 318.9 15.0 5,641.3 2 Bulacan+Laguna+Rizal+Cavite 318.9 1,408.4 38.5 1,765.8 3 Rest of GCR 15.0 38.5 160.1 213.5
5,641.3 1,765.8 213.5 7,620.5
TRSD - 2012 Validated Person Trips by Bus Pax ('000)No. City/Province/ Region 1 2 3 Total1 Metro Manila 2,692.3 247.0 90.1 3,029.4 2 Bulacan+Laguna+Rizal+Cavite 247.0 2,164.2 14.4 2,425.6 3 Rest of GCR 90.1 14.4 121.1 225.6
Roadmap for Transport Infrastructure Development for Metro Manila and Its Surrounding Areas (Region III & Region IV-A) FINAL REPORT
Technical Report No. 2 Transport Demand Analysis
3-1
3 CHARACTERISTICS OF EXISTING TRAVEL DEMAND
3.1 Characteristics of Road Traffic Demand and Existing Network Performance
3.1 The daily travel demand by main modes of travel in the study area is summarised in Table 3.1.1. ‘ like with like’ comparison of the estimated 2012 travel demand with the MMUTIS 1996 observed person trips within and to and from MM show an increase in trips of15% by car, while trips by public transport (jeepney and bus) declined by about 7%. However, in terms of vehicle trips the increase in car trips has been 69% (on average 3.3% per annum) compared with increase in public vehicle trips of 41% (average growth of 2.2% p.a.) over the last 16 years. The increase in public vehicle trips has been both in terms increase in jeepney (2 times as many as by bus) and bus traffic.
3.2 This high increase in car traffic has been due to ever increasing car ownership as well as decline in car occupancy from 2.5 persons per car in 1996 (MMUTIS Survey) to 1.70 in 2012. In case of public transport the decline in vehicle occupancy has been even more marked, the jeepney occupancy dropped from an average of 15.1 to 10, while the bus occupancy declined from 46.5 to 35.3 passengers per bus over the same period. To some extent the decrease in public vehicle occupancy could be attributed to the use of somewhat smaller vehicles: e.g., introduction of 16-seat jeepneys also in case of buses introduction of more air-conditioned buses which have fewer seats and operate as ‘luxury service (all seated passengers compared to ’s high capacity buses with many passengers standing.
Table 3.1.1 Travel Demand in the Study Area – Inter-Zonal Trips
3.3 This marked increase in traffic volume has led to considerable increase in traffic resulting in congestion le el much worst that late ’s, in some cases leading to total Grid-lock on key arterial and circumferential roads. The truck traffic has also declined, and as trucks mostly operate at night due to truck traffic ban on some roads during peak or day-light hours. However, the truck volume remains small compared to private and public vehicular traffic.
3.4 The assignment model calibrated for the 2012 matrix validation process is used to assess the current traffic condition on the roads in the study area. The network performance assessment is based on assigning 10% of the daily traffic volume on the hourly network capacity. The assessment of current traffic situation shows that most of the network is either operating at or above capacity. Table 3.1.2 provides a summary of level of traffic demand on the road network by area and key roads in Mega Manila. The impact of network operation at capacity (a measure of congestion) is that road traffic speed tend to drop rapidly once the traffic volume on the road exceeds 50% of capacity (Refer to Figure
Roadmap for Transport Infrastructure Development for Metro Manila and Its Surrounding Areas (Region III and Region IV-A) FINAL REPORT Technical Report No. 2 Transport Demand Analysis
3-2
3.1.1). Table also shows the traffic volume weighted average speed and also in terms of % of the roads sections (kms) operating at or below 10kph and 20kph.
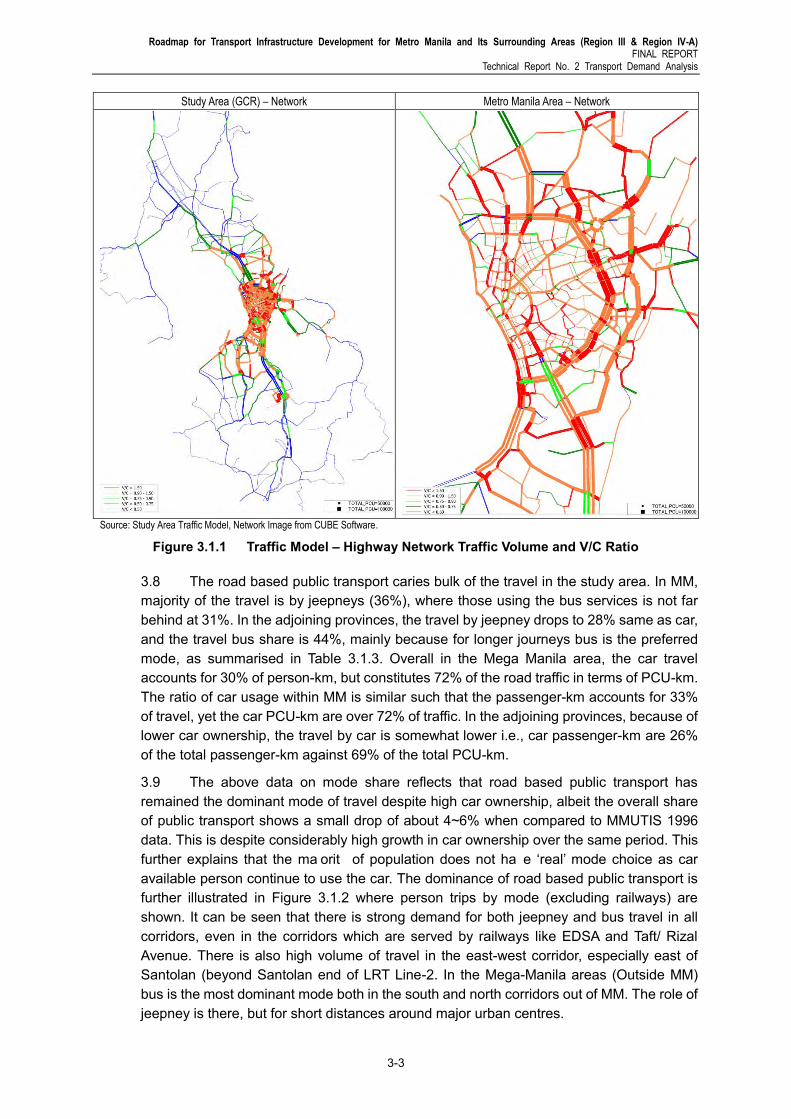
3.5 It can be seen that (with few exceptions) majority of the traffic in MM on 55% to 76% of the road km travels below 10 kph, and 75% to 92% travel at speeds below 20 kph. This is the result of traffic volumes approaching road capacity which is further illustrated in Figure 3.1.1 in terms of both traffic volume and the Volume Capacity (V/C) ratio of each road section, separately for GCR and MM areas. Colours orange and red show road sections with V/C greater than 0.9 or higher.
3.6 Among the main arterial (R1 to R10) and circumferential (C1 to C5) roads, EDSA (C4) carries the highest traffic volume, with over 4.8 million PCU-km or 11.3 million person-kms daily. This level of traffic causes the road to reach capacity throughout the day and close to 70% of EDSA operates at speeds below 20 kph. The impact of such high volume of traffic concentration on a single road is not just result in economic losses, but also high level of pollution and poor living environment. The busiest radial road is R7, with traffic exceeding one million PCU-km and person-km in excess of 3.5 million daily. This shows that the person demand in corridor is even higher than on EDSA on per PCU-km basis. As a result traffic speed on R7 is even worse than EDSA, over its entire length of about 12 km operating below 20 kph.
3.7 On area basis, most of MM roads are at capacity, and situation is not much better at Mega Manila level either. Mega Manila road network which represents about 50% of the study area network on average operates at V/C ratio of 0.80, with close to half of the road network operating below 20 kph. This assessment demonstrates that it is about time some serious notice is taken of the current traffic condition in the Mega Manila areas. There has been limited expansion of road network both in terms of new roads or capacity expansion through traffic/ demand management has been realised since MMUTIS study, yet the demand has been allowed to increase unabated.
Table 3.1.2 Summary of Road Traffic Volume and Network Performance
Area Av. V/C Rd. Section (km) with Speed PCU (000) Pax (000)
Road Description Av. V/C Rd. Section (km) with Speed PCU (000) Pax (000)
Roadmap for Transport Infrastructure Development for Metro Manila and Its Surrounding Areas (Region III & Region IV-A) FINAL REPORT
Technical Report No. 2 Transport Demand Analysis
3-3
Study Area (GCR) – Network Metro Manila Area – Network
Source: Study Area Traffic Model, Network Image from CUBE Software.
Figure 3.1.1 Traffic Model – Highway Network Traffic Volume and V/C Ratio
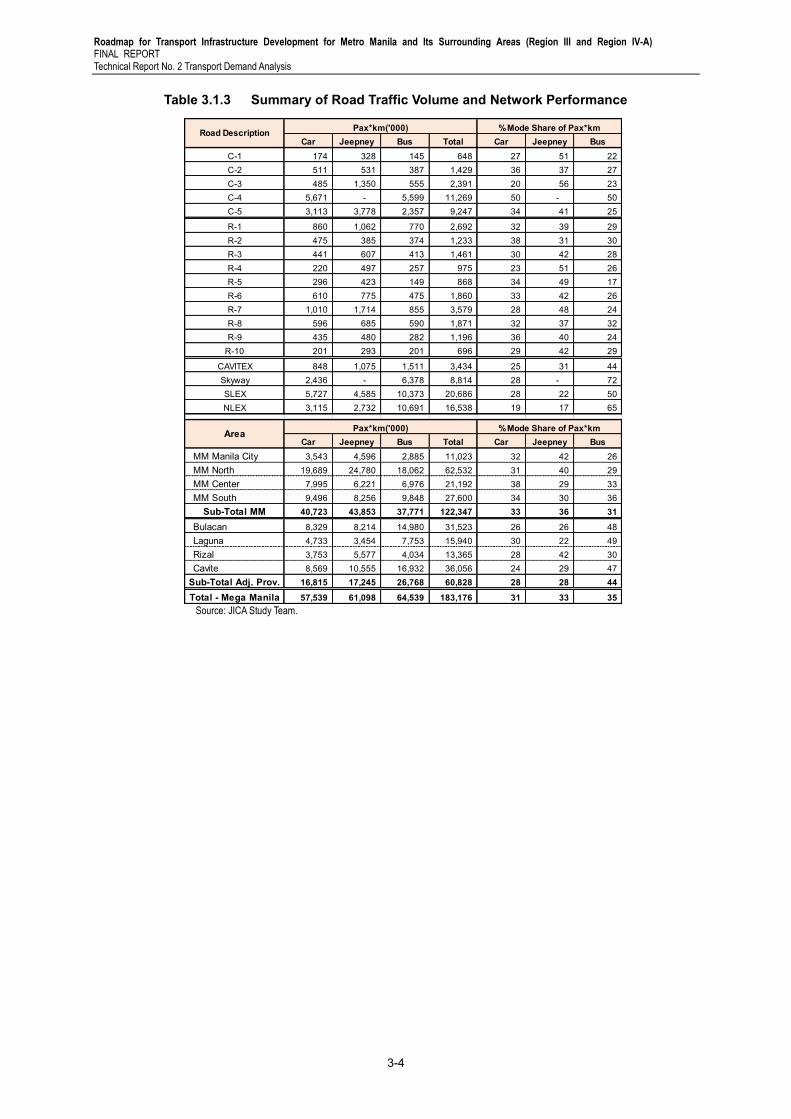
3.8 The road based public transport caries bulk of the travel in the study area. In MM, majority of the travel is by jeepneys (36%), where those using the bus services is not far behind at 31%. In the adjoining provinces, the travel by jeepney drops to 28% same as car, and the travel bus share is 44%, mainly because for longer journeys bus is the preferred mode, as summarised in Table 3.1.3. Overall in the Mega Manila area, the car travel accounts for 30% of person-km, but constitutes 72% of the road traffic in terms of PCU-km. The ratio of car usage within MM is similar such that the passenger-km accounts for 33% of travel, yet the car PCU-km are over 72% of traffic. In the adjoining provinces, because of lower car ownership, the travel by car is somewhat lower i.e., car passenger-km are 26% of the total passenger-km against 69% of the total PCU-km.
3.9 The above data on mode share reflects that road based public transport has remained the dominant mode of travel despite high car ownership, albeit the overall share of public transport shows a small drop of about 4~6% when compared to MMUTIS 1996 data. This is despite considerably high growth in car ownership over the same period. This further explains that the ma orit of population does not ha e ‘real’ mode choice as car available person continue to use the car. The dominance of road based public transport is further illustrated in Figure 3.1.2 where person trips by mode (excluding railways) are shown. It can be seen that there is strong demand for both jeepney and bus travel in all corridors, even in the corridors which are served by railways like EDSA and Taft/ Rizal Avenue. There is also high volume of travel in the east-west corridor, especially east of Santolan (beyond Santolan end of LRT Line-2. In the Mega-Manila areas (Outside MM) bus is the most dominant mode both in the south and north corridors out of MM. The role of jeepney is there, but for short distances around major urban centres.
Roadmap for Transport Infrastructure Development for Metro Manila and Its Surrounding Areas (Region III and Region IV-A) FINAL REPORT Technical Report No. 2 Transport Demand Analysis
3-4
Table 3.1.3 Summary of Road Traffic Volume and Network Performance
Car Jeepney Bus Total Car Jeepney BusMM Manila City 3,543 4,596 2,885 11,023 32 42 26 MM North 19,689 24,780 18,062 62,532 31 40 29 MM Center 7,995 6,221 6,976 21,192 38 29 33 MM South 9,496 8,256 9,848 27,600 34 30 36
Sub-Total MM 40,723 43,853 37,771 122,347 33 36 31
Total - Mega Manila 57,539 61,098 64,539 183,176 31 33 35
Area Pax*km('000) % Mode Share of Pax*km
Road Description Pax*km('000) % Mode Share of Pax*km
Roadmap for Transport Infrastructure Development for Metro Manila and Its Surrounding Areas (Region III & Region IV-A) FINAL REPORT
Technical Report No. 2 Transport Demand Analysis
3-5
Study Area (GCR) Metro Manila Area
Source: Study Area Traffic Model, Network Demand Image from CUBE Software
Figure 3.1.2 Travel Demand by Mode –Person Trips by Car, Jeepney and Bus
Roadmap for Transport Infrastructure Development for Metro Manila and Its Surrounding Areas (Region III and Region IV-A) FINAL REPORT Technical Report No. 2 Transport Demand Analysis
3-6
3.2 Characteristics of Railways in MM
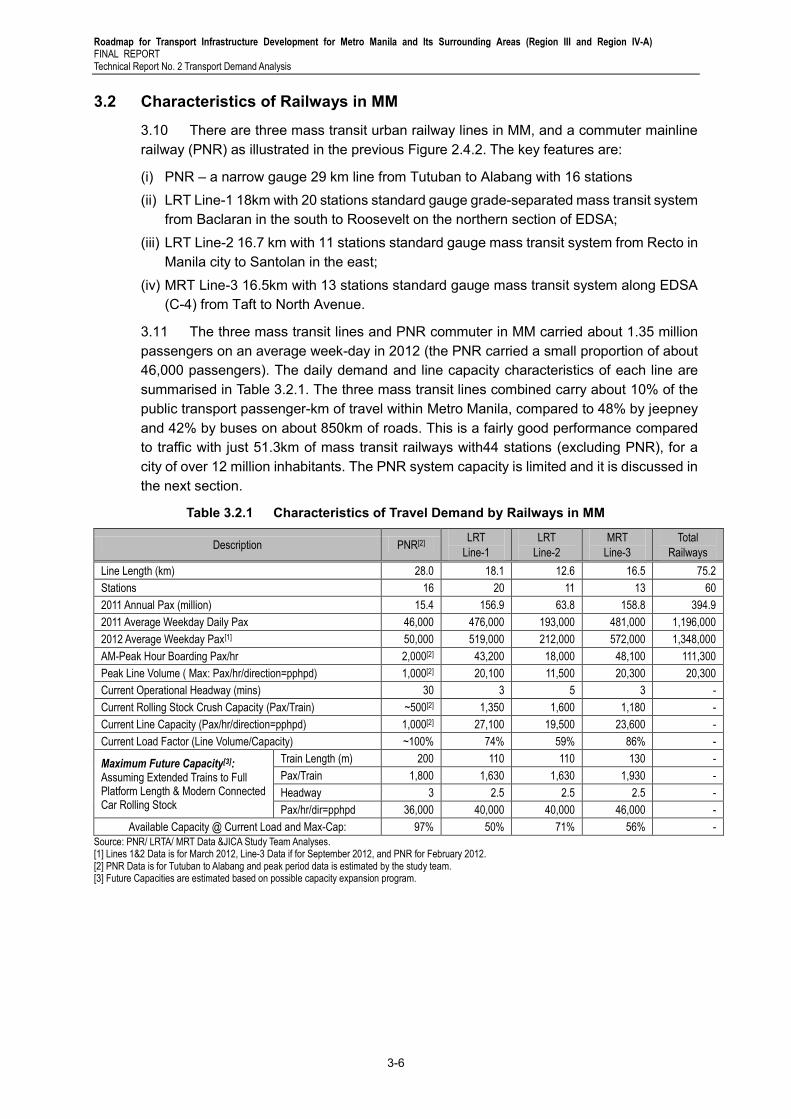
3.10 There are three mass transit urban railway lines in MM, and a commuter mainline railway (PNR) as illustrated in the previous Figure 2.4.2. The key features are:
(i) PNR – a narrow gauge 29 km line from Tutuban to Alabang with 16 stations (ii) LRT Line-1 18km with 20 stations standard gauge grade-separated mass transit system
from Baclaran in the south to Roosevelt on the northern section of EDSA; (iii) LRT Line-2 16.7 km with 11 stations standard gauge mass transit system from Recto in
Manila city to Santolan in the east; (iv) MRT Line-3 16.5km with 13 stations standard gauge mass transit system along EDSA
(C-4) from Taft to North Avenue.
3.11 The three mass transit lines and PNR commuter in MM carried about 1.35 million passengers on an average week-day in 2012 (the PNR carried a small proportion of about 46,000 passengers). The daily demand and line capacity characteristics of each line are summarised in Table 3.2.1. The three mass transit lines combined carry about 10% of the public transport passenger-km of travel within Metro Manila, compared to 48% by jeepney and 42% by buses on about 850km of roads. This is a fairly good performance compared to traffic with just 51.3km of mass transit railways with44 stations (excluding PNR), for a city of over 12 million inhabitants. The PNR system capacity is limited and it is discussed in the next section.
Table 3.2.1 Characteristics of Travel Demand by Railways in MM
Current Rolling Stock Crush Capacity (Pax/Train) ~500[2] 1,350 1,600 1,180 -
Current Line Capacity (Pax/hr/direction=pphpd) 1,000[2] 27,100 19,500 23,600 -
Current Load Factor (Line Volume/Capacity) ~100% 74% 59% 86% -
Maximum Future Capacity[3]: Assuming Extended Trains to Full Platform Length & Modern Connected Car Rolling Stock
Train Length (m) 200 110 110 130 -
Pax/Train 1,800 1,630 1,630 1,930 -
Headway 3 2.5 2.5 2.5 -
Pax/hr/dir=pphpd 36,000 40,000 40,000 46,000 -
Available Capacity @ Current Load and Max-Cap: 97% 50% 71% 56% -
Source: PNR/ LRTA/ MRT Data &JICA Study Team Analyses. [1] Lines 1&2 Data is for March 2012, Line-3 Data if for September 2012, and PNR for February 2012. [2] PNR Data is for Tutuban to Alabang and peak period data is estimated by the study team. [3] Future Capacities are estimated based on possible capacity expansion program.
Roadmap for Transport Infrastructure Development for Metro Manila and Its Surrounding Areas (Region III & Region IV-A) FINAL REPORT
Technical Report No. 2 Transport Demand Analysis
3-7
3.3 Philippine National Railways (PNR)
3.12 Currently, PNR runs half-hourly service between Tutuban and Alabang. It carries around 40,000 to 50,000 passengers daily. The service is slow, rather erratic as train stop-starts many times. Trains are full to crush-load from Tutuban to Alabang. Passengers at intervening stations some time cannot even get on the train and have to wait 30+ minutes for the next service. h e ser ice could hardl be called a ‘commuter’ ser ice with half-hour headways and un-predictable travel times. It just acts as a ‘social-ser ice’ for the poor who need to use the train in that corridor with fairly cheap fare otherwise may have to make a number of jeepney/ bus rides for the same journey.
3.13 All most all intervening stations are open; public can walk from street to train or out without any check/ control. It is not known how many people travel without payment/ ticket. Individual station loadings indicate that 17% of all demand is to/from Alabang. Tutuban and the other four stations (i.e., Blumentritt, Espana, Sta. Mesa and Bicutan) account for majority of the remaining demand. The whole of PNR service needs a major over-haul to be called an efficient commuter service between Tutuban and Alabang. PNR line from labang to Calamba is ‘called’ as operational, but services are limited to a few trains per day, and no details were available of patronage on this service.
Roadmap for Transport Infrastructure Development for Metro Manila and Its Surrounding Areas (Region III and Region IV-A) FINAL REPORT Technical Report No. 2 Transport Demand Analysis
3-8
3.4 Metro Manila Urban Mass Transit Lines
3.14 Line-1 is the oldest of the three mass transit lines. It was built in the mid- 8 ’ s. The patronage on the line grew with time, and reached a peak after about a decade to 450,000 passengers per day by 1994. From then on the patronage started to decline due to several operational issues mostly related to rolling stock. This lack of capacity led to decline in patronage to as low as 300,000 passengers per day by 2004/2005. A capacity expansion program was initiated, and the induction of new/ improved rolling stock led to increase in patronage to the current near maximum patronage of around half million passengers per day. The maximum demand is during the morning peak hour in the southbound direction, during which the maximum line volume is over 20,000 passengers per hour per direction (PPHPD). The busiest stations are EDSA in the south and the Monumento in the north where daily boarding and alighting passengers is over 100,000 per day. The line carries 33% of the rail passenger-km in Metro Manila through the most dense corridor of the metropolis.
3.15 Currently, the line is operating at 74% load factor because of rolling stock issues, there are speed restrictions on several sections of the line. The line headways are also affected due to non-availability of rolling stock resulting in unnecessary congestion at stations and in trains – making the system less attractive to passengers. As a result Line-1 is going through its second capacity expansion program to enhance its capacity and image. However, most of the physical infrastructure looks dilapidated. Queues at ticket booths are common, due to many reasons. The integration with Line-2 and Line-3 remain one of the most unattractive way to allow passengers to transfer between lines, further hindering the patronage growth. Most stations have side platforms with a single entry/exit stair case with no escalators. With serious capacity expansion involving the improvement to travel speed, shorter headways by reducing dwell time at stations and state-of-the art modern signalling and other improvements (such as platform screen-doors) could lead almost to doubling its current line capacity to 40,000 PPHPD. Such operational improvements would put more pressure on station infrastructure and facilities which would also need to be enhanced in line with other infrastructure and operational improvements.
3.16 MRT Line-3 is a circumferential line that carries most rail passengers in MM, some days well in excess of half million passengers. The travel demand on the line accounts for over50% of the total daily rail passenger-km travelled, along one of the busiest transport corridor of MM. It is estimated that Line-3 is operating at near capacity of 85% load factor. The estimation of the load factor as detailed in the above table is calculated using train crush capacity at 8 passengers/m2. In reality, it is difficult to achieve such loading for every train. Such crush capacity train loading leads to other issues like increased dwell time resulting in delays – in turn reducing system capacity not to mention passenger inconvenience. Currently, it is a well-known fact that patronage on Line-3 is capacity constrained. The travel demand in the corridor far exceeds both the road and rail available capacities. No doubt, enhanced travel time on Line-3 and better passenger handling arrangement and improved station access facilities could bring more patronage, but that would require a serious overhaul of the entire system. With higher capacity rolling stock, better station arrangements and improved accessibility could lead to about 40% increase in peak hour capacity to 46,000 PPHPD, from the current near capacity volume of 24,000PPHPD.
Roadmap for Transport Infrastructure Development for Metro Manila and Its Surrounding Areas (Region III & Region IV-A) FINAL REPORT
Technical Report No. 2 Transport Demand Analysis
3-9
3.17 LRT Line-2 is a radial line from Santolan in the east to Recto in the heart of Manila City. The Line is a modern mass transit system which opened for revenue service in 2003. The patronage on the line increased rapidly in early years of opening and has now reached over 212,000 passengers per day. Peak line volume analysis revealed that loading on Line-2 is extremely directional compared to Lines 1 and 3, and was estimated to be 11,500 passengers/hr/direction. The service operated at 5 minutes heady, with a load factor of about 60%. This traffic on the line accounts for 16% of the total rail passenger-km of MM, with an average trip length of about 7km. The two terminal stations are busiest, followed by the Cubao station where passengers transfer to Line-3. This passenger interchange facility with Line-3 is the most inconvenient to say the least, involving a walk of well over ¼ km, through a busy shopping area. Similarly the passenger interchange with Line-1 at Recto involves a long walk. However, the station facilities are better than the other two lines. At Santolan, the majority of the patronage is of passengers transferring to LRT from jeepneys, but the interchange facility is poor and inconvenient, involving major road (Marcos Highway) crossing using a pedestrian bridge. The line has major potential and available capacity to increase patronage, but this would require improving multi-modal transfer facilities at Recto, Santolan and Cubao.
Roadmap for Transport Infrastructure Development for Metro Manila and Its Surrounding Areas (Region III and Region IV-A) FINAL REPORT Technical Report No. 2 Transport Demand Analysis
3-10
3.5 Metro Manila Urban Mass Transit Lines – Capacity Constraints
3.18 Individual line capacity issues are discussed above, and these issues are common to all rail system as outlined next. One major reason for poor rail patronage is the station accessibility. Public footpaths within 1km radius of stations are almost non-existent. In most cases footpaths are occupied by vendors, street furniture, used by shop owners for display of their goods, or by many other activities on the roadside – hindering easy, smooth and convenient walk to/ from the station. h ere are limited or no ‘safe’ road crossing facilities at stations to access the opposite side, as most stations have side platform and a single side access/ egress arrangements, requiring road crossing at-grade in the street. Similarly, multi-modal interchange facilities between metro lines and with other modes like kiss-n-ride, tricycles, jeepneys, and busses are poor and lack properly designed facilities. These aspects of system improvement need urgent attention, particularly at terminal stations.
3.19 A recent survey for the JICA LRT Lines 1&2 studies showed that less than 5% of all rail passenger walk-in from the origin of their journey and walk-out to their destination. Of the remainder,4~6% of trips are, where car is either the mode of access, or egress, to/ from the rail to destination. These trips are usually at the terminal stations like Santolan/North Avenue, where there are drop-off or park-n-ride facilities available. For the rest of the rail passengers (about 90%+)use other modes of public transport at one or both ends of their rail trip, yet multi-modal interchange facilities are most neglected component of the rail passenger accessibility. In addition, other system integration facilities like common ticketing, fare integration between rail lines and other modes are most desirable features and need urgent attention to relieve the currently overloaded transport infra-structure.
Roadmap for Transport Infrastructure Development for Metro Manila and Its Surrounding Areas (Region III & Region IV-A) FINAL REPORT
Technical Report No. 2 Transport Demand Analysis
3-11
3.6 Traffic Management and Demand Management in Mega Manila
3.20 The current traffic and congestion situation has been explained above in detail. Building new roads to meet the demand is not an easy and only solution. Many cities around the world no longer build or cannot build new roads in dense urban areas. One of the solutions to reduce congestion is to make effective and efficient use of existing road infrastructure through traffic and demand management (TDM). In Metro Manila, considerable effort and resources have been expended to reduce congestion through TDM measures, but results are not so encouraging. Therefore, it is even more important to address the TDM measures to reduce the chronic congestion along some corridors, and improve travel times. Some of the approaches which need immediate attention are outlined next.
(a) Encroachments: The most important reason of reduced road capacity in the inner city areas of MM is the encroachments – not only of the road space but of footpaths. Encroachment of footpath leads to pedestrians walking in the road, causing serious safety issues, and reducing road capacity. Encroachment of road space by adjacent building/ shop owners for parking, and by hawkers/ street vendors is most serious and common cause of loss of road capacity and reduced speed in MM and rest of Mega Manila where ribbon development along the roadside is a common practice. Both fix and transient encroachments should be removed without excuse to release road space for traffic.
(b) Traffic Signals & Enforcement of Traffic Laws: There are currently 350 or so signalised intersections in MM. None of these operate in an efficient manner. Reasons are many – long cycle time, no pedestrian phase, right-turn on red without yielding to traffic with priority or to crossing pedestrians, no linkages of signals to get greater throughput. The enforcement of traffic signals sometimes is left to traffic enforcers. On occasions they ignore the traffic signals and manually control traffic, leading to even longer cycle times, longer queues and less efficient use of road space. Right turn on the red signal is inefficient, especially where the turning traffic does not yield take account of the traffic in priority lane. The situation is even worse when the turning traffic ignore the pedestrian phase of traffic signal.
(c) Non-signalised Intersections: there are numerous junctions/intersections that would provide better use of road space if signalised. Currently, there is no such program with Metro Manila Development Authority (MMDA) or any other agency to improve traffic condition through improved and wider area traffic signalisation. This is now necessary and efficient intersection operation cannot be left to the whim of traffic enforcers. Non obedience of pedestrian crossing at Zebra crossing or at non-signalised crossings leads to congestion as pedestrian are forced to cross anywhere and to wait in the middle of the road for crossing both side of traffic thus causing unsafe situation and traffic congestion. Installation of pedestrian refuges could help ease traffic congestion.
(d) Traffic Channelization and Lane Discipline: Lane hoping is common in Manila traffic, and lane discipline is non-existent. This is particularly true of buses along EDSA, and at times is the main cause of congestion. Physically segregated traffic lanes like service road and main carriageway for through traffic would reduce congestion and instil lane discipline. Physically segregated bus/Jeepney lanes are now essential for efficient use of road space, as the enforcement of bus lanes, with lane markings are not obeyed by drivers of buses/jeepneys and also by the private car drivers alike.
Roadmap for Transport Infrastructure Development for Metro Manila and Its Surrounding Areas (Region III and Region IV-A) FINAL REPORT Technical Report No. 2 Transport Demand Analysis
3-12
(e) Pedestrian Facilities: Good and adequate pedestrian facilities are essential – both for pedestrian safety and to reduce traffic congestion. Inadequate pedestrian side-walk leads to forcing pedestrians into road space causing traffic congestion. This situation is common near bus stops, multi-modal interchanges, and mega-malls. For example, along EDSA pedestrians are almost caged in less than 1m wide footpath, but they still escape at the end of the fences causing major problem for traffic. In addition, a re-think of bus/jeepney stops is essential. Passengers must be dropped off on sidewalks, from where they can easily walk to their destination. However, it is common that passengers are dropped-off in the middle of the road leaving them in unsafe situation and to cross the road causing delays to other vehicles. Such practice is even common at major bus stops like Ayala bus terminal in Makati. Therefore, safe and adequate pedestrian facilities are essential to improve road capacity and reduce congestion.
(f) Bus/Jeepney/Taxi Stops: Jeepneys and taxis do not really have any marked stops or lay-over space as terminals. This leads to stray vehicles all over the road space and lead to congestion. Taxis continue to drive around looking for passengers causing unnecessary congestion. Clearly marked jeepney and taxi stops could alleviate some congestion. Bus stops are provided but stopping of buses only at the bus stops is not effectively enforced. In some cases where bus stops are provided, but are without sufficient entry/exit slopes required for the buses to park parallel to the kerbside for convenient passenger boarding/ alighting. This leads to buses over-hanging in the road space outside the bus stop area causing congestion.
(g) Goods Loading & Unloading: This goes on at all times without any check along all major roads, with few exceptions. This could be restricted by provision of proper locations for loading/ unloading bays or through time restrictions. Current practices often lead to road space being restricted for through traffic, while loading/ unloading takes place.
(h) Parking Facilities and Control: In most major cities around the world parking is a major issue and kerbside parking takes away the scarce/ limited road space. In MM, particularly in inner city areas free kerbside parking is common. In contrast, in some cities of MM (e.g., Makati) and in specific developments parking is well organised and illegal parking is effectively controlled. Sadly, the Makati example is not followed elsewhere in MM and almost not at all in outer urban areas of Mega Manila, leading to loss road space and congestion. An efficient parking control of illegal parking and price controlled parking is essential for efficient traffic circulation and to assists in reduction of traffic congestion.
(i) Traffic Demand Management: Transport/ traffic demand management (TDM) measures are used to reduce traffic through road pricing, on the principle ‘user pa s’ or through other traffic control measures to reduce congestion. Singapore has effectively used road pricing for decades and now many western cities, like London have followed. Road pricing is the best form of congestion reduction, as it not only reduces congestion, but generates revenue that could be used to provide transport infrastructure, and / or to improve public transport. In MM, restrictions are placed on the use of private cars during weekdays, overextended peak periods. The system works by not allowing cars with licence number plates ending with 1 and 2 to be banned on Mondays, those ending with 3 and 4 banned on Tuesday and so on. Initially the scheme had some success in suppressing traffic by about 18% (not by 1/5), but now the scheme has run its useful life, and does not seem to be effective any longer.
Roadmap for Transport Infrastructure Development for Metro Manila and Its Surrounding Areas (Region III & Region IV-A) FINAL REPORT
Technical Report No. 2 Transport Demand Analysis
3-13
3.21 The traffic demand analysis showed that currently major areas and most roads in MM are heavily congested throughout the day. It is costing the nation enormously both in terms of lost time, fuel costs, and unnecessary environmental degradation, not to mention the social costs where urban poor have to travel for long time to / from work, leaving them less time for leisure and family. It is therefore essential to reduce congestion by all means available including TDM. TDM may be invoked to reduce congestion and improve effective use of road space in forms other than to restrict travel, – through measures such as: high occupancy lanes, car-pooling/ road pricing/ parking restrictions through land-use control, / high car ownership taxes/ fuel taxation are a few to mention. But the most efficient of all would be to increase the use of public transport which is efficient and attractive and public must feel that it is a real alternative to car. This would lead to decongestion.
Roadmap for Transport Infrastructure Development for Metro Manila and Its Surrounding Areas (Region III & Region IV-A) FINAL REPORT
Technical Report No. 2 Transport Demand Analysis
4-1
4 CHARACTERISTICS OF FUTURE TRAVEL DEMAND
4.1 Introduction
4.1. The travel demand forecast methodology has been outlined above in Section 4.2. A number of socio-economic development scenarios have been considered for the Mega Manila area, and are described elsewhere in this report. This section describes the travel demand forecast based on the ‘ rend’ scenario – as this scenario is considered to be the most realistic, and in any case the aggregate demand level is quite similar to other socio-economic scenarios.
4.2 Trend’ scenario Based 2030 Travel demand Forecast
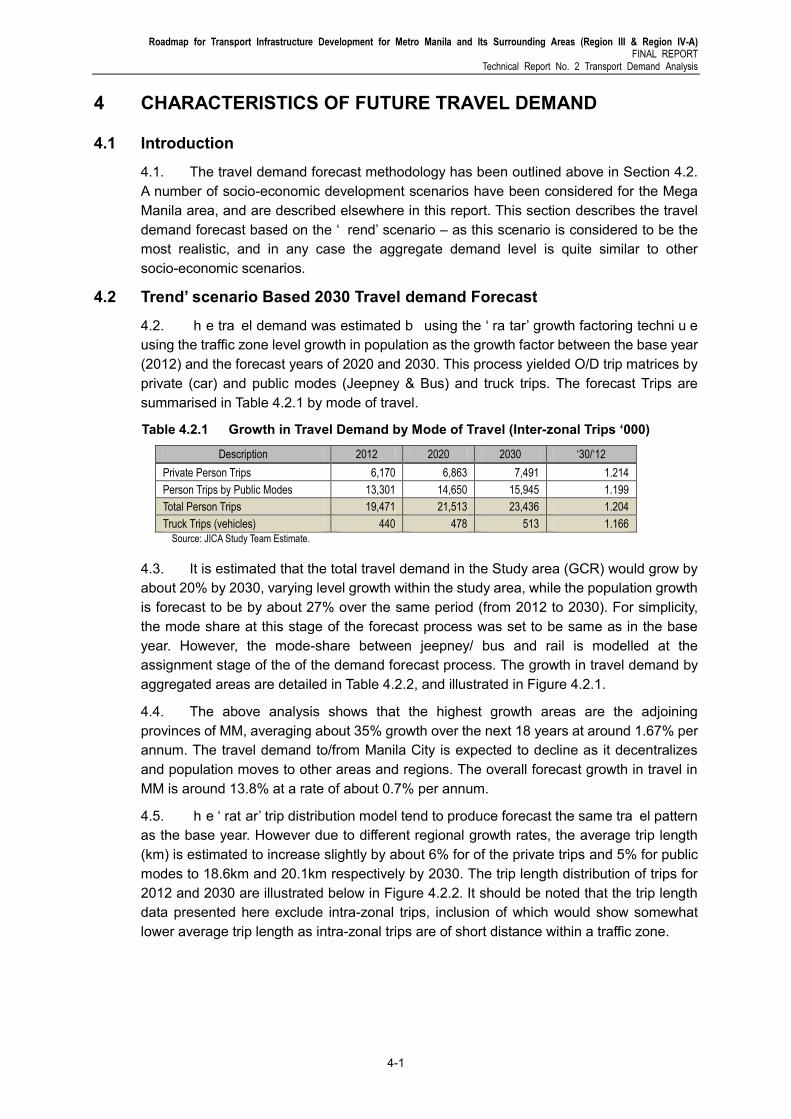
4.2. h e tra el demand was estimated b using the ‘ ra tar’ growth factoring techni u e using the traffic zone level growth in population as the growth factor between the base year (2012) and the forecast years of 2020 and 2030. This process yielded O/D trip matrices by private (car) and public modes (Jeepney & Bus) and truck trips. The forecast Trips are summarised in Table 4.2.1 by mode of travel.
Table 4.2.1 Growth in Travel Demand by Mode of Travel (Inter-zonal Trips ‘000)
Description 2012 2020 2030 ‘30/‘12
Private Person Trips 6,170 6,863 7,491 1.214
Person Trips by Public Modes 13,301 14,650 15,945 1.199
Total Person Trips 19,471 21,513 23,436 1.204
Truck Trips (vehicles) 440 478 513 1.166
Source: JICA Study Team Estimate.
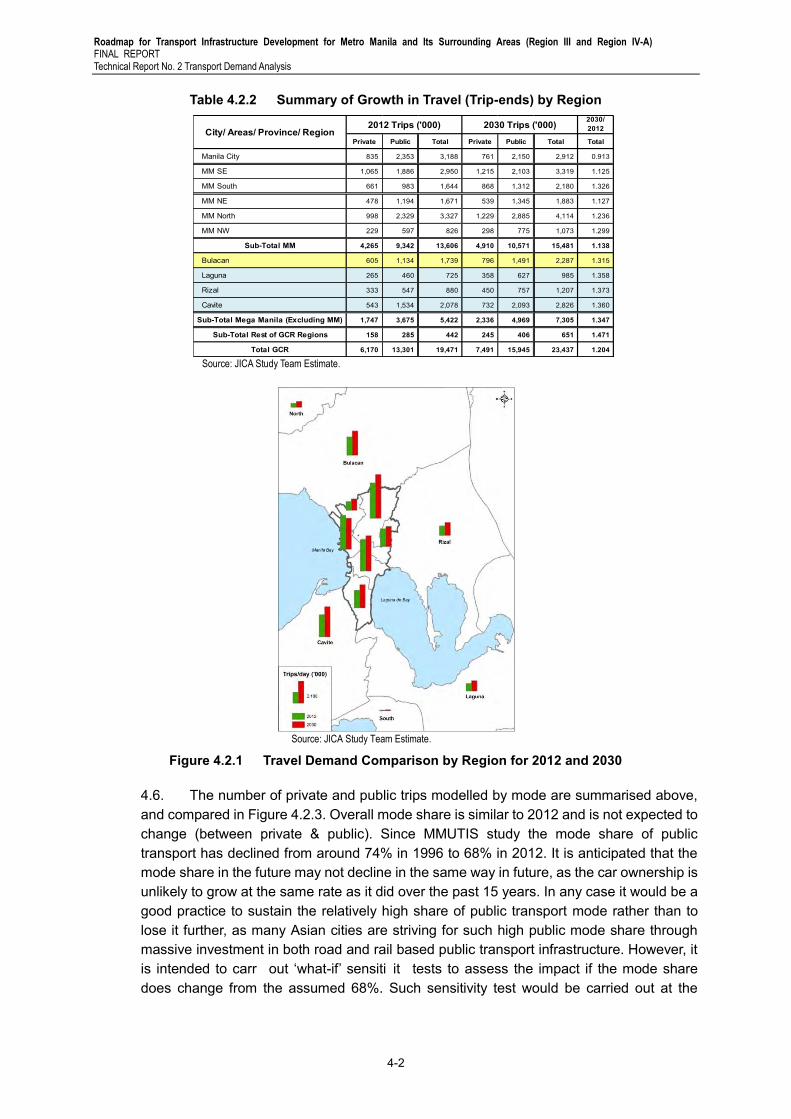
4.3. It is estimated that the total travel demand in the Study area (GCR) would grow by about 20% by 2030, varying level growth within the study area, while the population growth is forecast to be by about 27% over the same period (from 2012 to 2030). For simplicity, the mode share at this stage of the forecast process was set to be same as in the base year. However, the mode-share between jeepney/ bus and rail is modelled at the assignment stage of the of the demand forecast process. The growth in travel demand by aggregated areas are detailed in Table 4.2.2, and illustrated in Figure 4.2.1.
4.4. The above analysis shows that the highest growth areas are the adjoining provinces of MM, averaging about 35% growth over the next 18 years at around 1.67% per annum. The travel demand to/from Manila City is expected to decline as it decentralizes and population moves to other areas and regions. The overall forecast growth in travel in MM is around 13.8% at a rate of about 0.7% per annum.
4.5. h e ‘ rat ar’ trip distribution model tend to produce forecast the same tra el pattern as the base year. However due to different regional growth rates, the average trip length (km) is estimated to increase slightly by about 6% for of the private trips and 5% for public modes to 18.6km and 20.1km respectively by 2030. The trip length distribution of trips for 2012 and 2030 are illustrated below in Figure 4.2.2. It should be noted that the trip length data presented here exclude intra-zonal trips, inclusion of which would show somewhat lower average trip length as intra-zonal trips are of short distance within a traffic zone.
Roadmap for Transport Infrastructure Development for Metro Manila and Its Surrounding Areas (Region III and Region IV-A) FINAL REPORT Technical Report No. 2 Transport Demand Analysis
4-2
Table 4.2.2 Summary of Growth in Travel (Trip-ends) by Region
Source: JICA Study Team Estimate.
Source: JICA Study Team Estimate.
Figure 4.2.1 Travel Demand Comparison by Region for 2012 and 2030
4.6. The number of private and public trips modelled by mode are summarised above, and compared in Figure 4.2.3. Overall mode share is similar to 2012 and is not expected to change (between private & public). Since MMUTIS study the mode share of public transport has declined from around 74% in 1996 to 68% in 2012. It is anticipated that the mode share in the future may not decline in the same way in future, as the car ownership is unlikely to grow at the same rate as it did over the past 15 years. In any case it would be a good practice to sustain the relatively high share of public transport mode rather than to lose it further, as many Asian cities are striving for such high public mode share through massive investment in both road and rail based public transport infrastructure. However, it is intended to carr out ‘what-if’ sensiti it tests to assess the impact if the mode share does change from the assumed 68%. Such sensitivity test would be carried out at the
2030/2012
Private Public Total Private Public Total Total
Manila City 835 2,353 3,188 761 2,150 2,912 0.913
MM SE 1,065 1,886 2,950 1,215 2,103 3,319 1.125
MM South 661 983 1,644 868 1,312 2,180 1.326
MM NE 478 1,194 1,671 539 1,345 1,883 1.127
MM North 998 2,329 3,327 1,229 2,885 4,114 1.236
MM NW 229 597 826 298 775 1,073 1.299
Sub-Total MM 4,265 9,342 13,606 4,910 10,571 15,481 1.138
Roadmap for Transport Infrastructure Development for Metro Manila and Its Surrounding Areas (Region III & Region IV-A) FINAL REPORT
Technical Report No. 2 Transport Demand Analysis
4-3
individual project assessment stage to estimate the impact of changes in mode shift on the project viability and performance.
Source: JICA Study Team Estimate.
Figure 4.2.2 Trip Length Distribution of 2012 and 2030 Private and Public Trips
Source: JICA Study Team Estimate.
Figure 4.2.3 Mode Share 2012 and 2030 Private and Public Trips
0
1,000
2,000
3,000
4,000
5 15 25 35 45 55 65 75 85 95 +
TRIP
S Th
ousa
nds
Distance - KM
Trip Length Distribution 2012 ans 2030 by Mode
Priv-2012Priv_2030Pub-2012Pub_2030
0
5,000
10,000
15,000
20,000
25,000
2012 2030
Trip
s ('0
00) b
y Tr
avel
Mod
e
Pub PrivPublic Private
Roadmap for Transport Infrastructure Development for Metro Manila and Its Surrounding Areas (Region III and Region IV-A) FINAL REPORT Technical Report No. 2 Transport Demand Analysis
4-4
4.3 Impact of 2030 Forecasts Travel Demand – Do-nothing Scenario
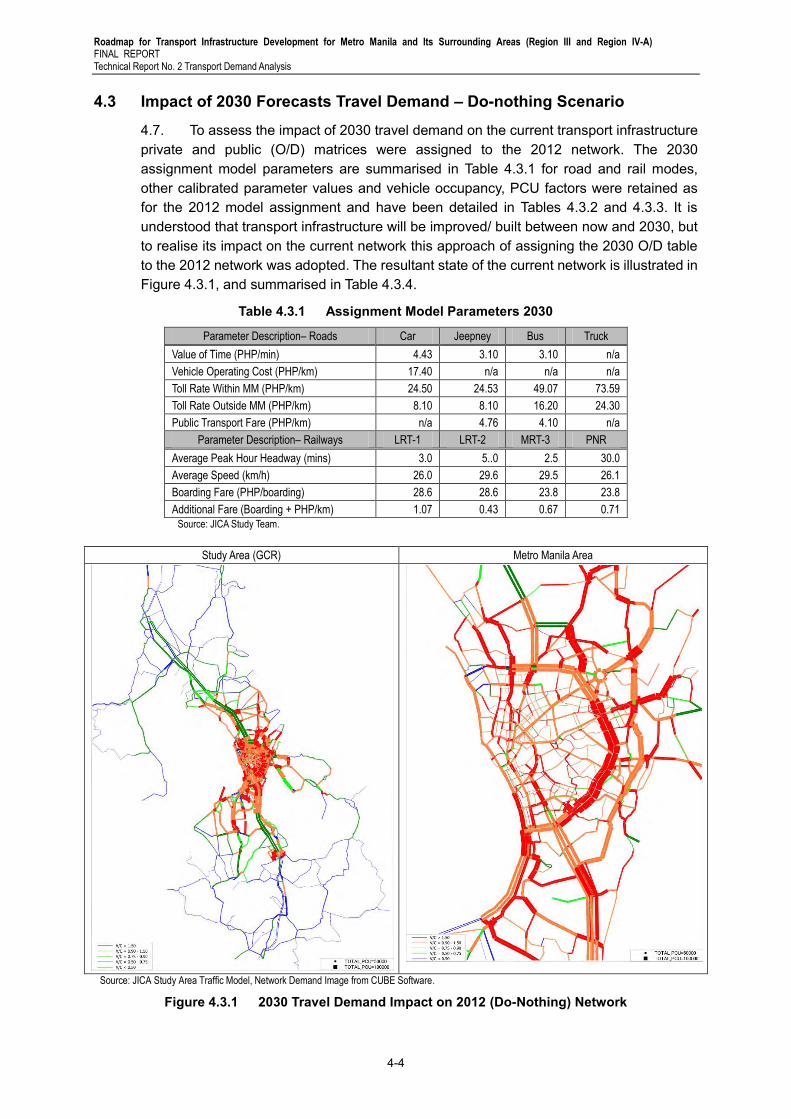
4.7. To assess the impact of 2030 travel demand on the current transport infrastructure private and public (O/D) matrices were assigned to the 2012 network. The 2030 assignment model parameters are summarised in Table 4.3.1 for road and rail modes, other calibrated parameter values and vehicle occupancy, PCU factors were retained as for the 2012 model assignment and have been detailed in Tables 4.3.2 and 4.3.3. It is understood that transport infrastructure will be improved/ built between now and 2030, but to realise its impact on the current network this approach of assigning the 2030 O/D table to the 2012 network was adopted. The resultant state of the current network is illustrated in Figure 4.3.1, and summarised in Table 4.3.4.
Table 4.3.1 Assignment Model Parameters 2030
Parameter Description– Roads Car Jeepney Bus Truck
Value of Time (PHP/min) 4.43 3.10 3.10 n/a
Vehicle Operating Cost (PHP/km) 17.40 n/a n/a n/a
Toll Rate Within MM (PHP/km) 24.50 24.53 49.07 73.59
Toll Rate Outside MM (PHP/km) 8.10 8.10 16.20 24.30
Average Peak Hour Headway (mins) 3.0 5..0 2.5 30.0
Average Speed (km/h) 26.0 29.6 29.5 26.1
Boarding Fare (PHP/boarding) 28.6 28.6 23.8 23.8
Additional Fare (Boarding + PHP/km) 1.07 0.43 0.67 0.71
Source: JICA Study Team.
Study Area (GCR) Metro Manila Area
Source: JICA Study Area Traffic Model, Network Demand Image from CUBE Software.
Figure 4.3.1 2030 Travel Demand Impact on 2012 (Do-Nothing) Network
Roadmap for Transport Infrastructure Development for Metro Manila and Its Surrounding Areas (Region III & Region IV-A) FINAL REPORT
Technical Report No. 2 Transport Demand Analysis
4-5
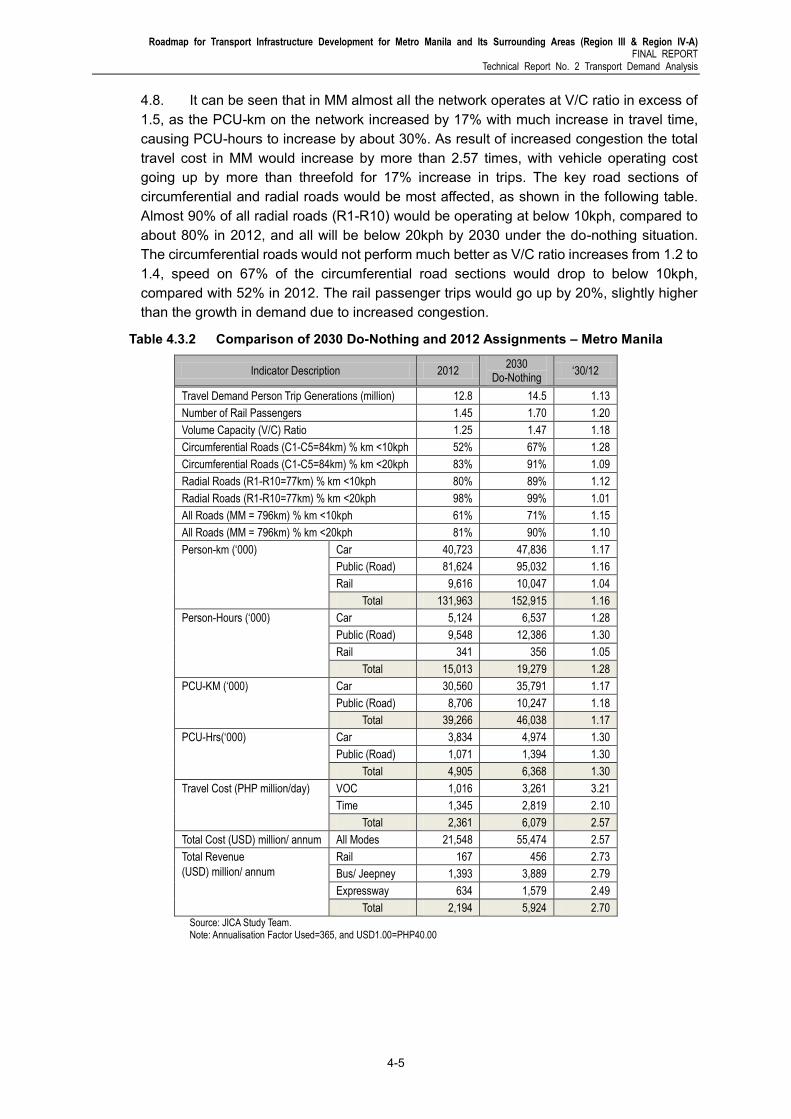
4.8. It can be seen that in MM almost all the network operates at V/C ratio in excess of 1.5, as the PCU-km on the network increased by 17% with much increase in travel time, causing PCU-hours to increase by about 30%. As result of increased congestion the total travel cost in MM would increase by more than 2.57 times, with vehicle operating cost going up by more than threefold for 17% increase in trips. The key road sections of circumferential and radial roads would be most affected, as shown in the following table. Almost 90% of all radial roads (R1-R10) would be operating at below 10kph, compared to about 80% in 2012, and all will be below 20kph by 2030 under the do-nothing situation. The circumferential roads would not perform much better as V/C ratio increases from 1.2 to 1.4, speed on 67% of the circumferential road sections would drop to below 10kph, compared with 52% in 2012. The rail passenger trips would go up by 20%, slightly higher than the growth in demand due to increased congestion.
Table 4.3.2 Comparison of 2030 Do-Nothing and 2012 Assignments – Metro Manila
Indicator Description 2012 2030
Do-Nothing ‘30/12
Travel Demand Person Trip Generations (million) 12.8 14.5 1.13
Number of Rail Passengers 1.45 1.70 1.20
Volume Capacity (V/C) Ratio 1.25 1.47 1.18
Circumferential Roads (C1-C5=84km) % km <10kph 52% 67% 1.28
Circumferential Roads (C1-C5=84km) % km <20kph 83% 91% 1.09
Radial Roads (R1-R10=77km) % km <10kph 80% 89% 1.12
Radial Roads (R1-R10=77km) % km <20kph 98% 99% 1.01
Total Cost (USD) million/ annum All Modes 21,548 55,474 2.57
Total Revenue
(USD) million/ annum
Rail 167 456 2.73
Bus/ Jeepney 1,393 3,889 2.79
Expressway 634 1,579 2.49
Total 2,194 5,924 2.70
Source: JICA Study Team. Note: Annualisation Factor Used=365, and USD1.00=PHP40.00
Roadmap for Transport Infrastructure Development for Metro Manila and Its Surrounding Areas (Region III and Region IV-A) FINAL REPORT Technical Report No. 2 Transport Demand Analysis
4-6
4.9. In the provinces adjoining MM (i.e. Mega Manila less MM) the impact would be even more severe as the number trip would increase by about 33% from 2012 to 2030. This would increase the partially congested network at overall V/C ratio 0.53 to close to level of service C or worst to V/C ratio of 0.72. Total travel cost of the network would increase by about 3.5 times whereas operating cost would increase by almost four fold. The results for Mega Manila (excluding MM) are summarised in Table 4.3.3. Table 4.3.4 gives the results for whole for Mega Manila, whereas outer region results are presented in Table 4.3.5 and study area total results are compiled in Table 4.3.6.
4.10. The transport infrastructure in the study area (GCR) as whole would need comprehensive upgrade and new roads and railways to sustain the anticipated growth in travel demand, otherwise the city would grind to halt within the next few years. This would have dire impact on the economic growth of the Greater Capital Region the economic engine of the Philippines, with tremendous degradation of quality of life, which is already barely acceptable by poor masses. What needs to be done is presented in the following section.
Table 4.3.3 Comparison of 2012 and 2030 Traffic Impacts of Do-Nothing, in Mega Manila (Excluding MM)
Indicator Description 2012 2030
Do-Nothing ‘30/12
Travel Demand Person Trip Generations (million) 6.0 8.0 1.33
Volume Capacity (V/C) Ratio 0.53 0.72 1.35
Roads (Total=1,478km) % km <10kph 11% 22% 2.09
Roads (Total=1,478km) % km <20kph 22% 33% 1.48
Person-km (‘000) Car 25,384 35,035 1.38
Public (Road) 71,500 94,458 1.32
Rail - - -
Total 96,884 129,493 1.34
Person-Hours (‘000) Car 1,843 3,360 1.82
Public (Road) 4,169 7,656 1.84
Rail - - -
Total 6,012 11,016 1.83
PCU-KM (‘000) Car 21,118 28,777 1.36
Public (Road) 6,639 8,781 1.32
Total 27,757 37,557 1.35
PCU-Hrs(‘000) Car 1,403 2,602 1.86
Public (Road) 401 735 1.83
Total 1,804 3,337 1.85
Travel Cost (PHP million/day) VOC 462 1,887 4.08
Time 532 1,590 2.99
Total 994 3,477 3.50
Total Cost (USD) million/ annum All Modes 9,069 31,725 3.50
Total Revenue
(USD) million/ annum
Rail - - -
Bus/ Jeepney 1,193 3,769 3.16
Expressway 104 351 3.37
Total 1,297 4,120 3.18
Source: JICA Study Team. Note: Annualisation Factor Used=365, and USD1.00=PHP40.00
Roadmap for Transport Infrastructure Development for Metro Manila and Its Surrounding Areas (Region III & Region IV-A) FINAL REPORT
Technical Report No. 2 Transport Demand Analysis
4-7
Table 4.3.4 Comparison of 2012 and 2030 Traffic Impacts Do-Nothing, Mega Manila
Indicator Description 2012 2030
Do-Nothing ‘30/12
Travel Demand Person Trip Generations (million) 18.8 22.5 1.20
Total Cost (USD) million/ annum All Modes 30,616 87,199 2.85
Total Revenue (USD) million/ annum
Rail 167 456 2.73
Bus/ Jeepney 2,586 7,658 2.96
Expressway 738 1,930 2.61
Total 3,492 10,044 2.88 Source: JICA Study Team Note: Annualisation Factor Used=365, and USD1.00=PHP40.00
Table 4.3.5 Comparison of 2012 and 2030 Traffic Impacts of Do-Nothing, in Rest of Regions III and IV-A
Indicator Description 2012 2030
Do-Nothing ‘30/12
Travel Demand Person Trip Generations (million) 0.60 0.9 1.50
Volume Capacity (V/C) Ratio 0.14 .21 1.46
Roads (Total=3,241km) % km <10kph 0% 0% -
Roads (Total=3,241km) % km <20kph 0% 1% -
Person-km (‘000) Car 10,903 17,322 1.59
Public (Road) 34,874 48,811 1.40
Rail - - -
Total 45,777 66,134 1.44
Person-Hours (‘000) Car 198 342 1.73
Public (Road) 615 914 1.49
Rail - - -
Total 812 1,256 1.55
PCU-KM (‘000) Car 11,203 16,458 1.47
Public (Road) 2,971 4,200 1.41
Total 14,174 20,658 1.46
PCU-Hrs(‘000) Car 211 341 1.61
Public (Road) 55 84 1.54
Total 265 424 1.60
Travel Cost (PHP million/day) VOC 150 534 3.57
Time 70 179 2.55
Total 220 713 3.24
Total Cost (USD) million/ annum All Modes 2,006 6,508 3.24
Total Revenue (USD) million/ annum
Rail - - -
Bus/ Jeepney 575 1,925 3.35
Expressway 33 191 5.73
Total 608 2,116 3.48 Source: JICA Study Team. Note: Annualisation Factor Used=365, and USD1.00=PHP40.00
Roadmap for Transport Infrastructure Development for Metro Manila and Its Surrounding Areas (Region III and Region IV-A) FINAL REPORT Technical Report No. 2 Transport Demand Analysis
4-8
Table 4.3.6 Comparison of 2012 and 2030 Traffic Impacts of Do-Nothing, in GCR
Indicator Description 2012 2030
Do-Nothing ‘30/12
Travel Demand Person Trip Generations (million) 19.5 23.4 1.20
Total Cost (USD) million/ annum All Modes 32,622 93,707 2.87
Total Revenue
(USD) million/ annum
Rail 167 456 2.73
Bus/ Jeepney 3,161 9,583 3.03
Expressway 772 2,121 2.75
Total 4,100 12,160 2.97
Source: JICA Study Team. Note: Annualisation Factor Used=365, and USD1.00=PHP40.00
Roadmap for Transport Infrastructure Development for Metro Manila and Its Surrounding Areas (Region III & Region IV-A) FINAL REPORT
Technical Report No. 2 Transport Demand Analysis
5-1
5 ASSESSMENT OF PROPOSED RAIL/ ROAD NETWORK
5.1 Development of 2030 ‘Do-maximum’ Highway/ Rail Networks
5.1 The impact of forecast 2030 travel demand on the existing transport network, as discussed in the previous section shows that the entire road and rail network would need drastic level of upgrade. This involved improving existing roads/ expressways and Railways to provide additional capacity. Initial comparison of demand/ supply revealed that adding capacities by upgrade existing facilities alone would not be sufficient – new roads/ expressways and railways would be required to meet the 2030 demand for the sustained development of the GCR region. The proposed, a hierarchical roads/ expressway and an integrated rail network was developed through in iterative process, whereby at the end the final network provides a congestion free environment in the Mega-Manila area with relief to most road users and retains high share of public transport.
5.2 The proposed rail network ‘do-ma imum’ consists of north/south commuter heavy rail line as the backbone of the north-south corridor public transport demand corridor. The demand within Metro Manila is supported by numerous primary LRT/MRT lines supplemented by secondary rail (e.g. monorail, AGT, etc.) network acting as feeders to the primary lines. Parallel with the rail network, the proposed highway network provides high capacity high speed network of urban and inter-urban expressways supplemented by provision of primary and secondary roads. In the development of highway network full consideration was given to the improved use of existing infrastructure through upgrading the existing roads and where necessary new road sections are proposed.
5.3 The proposed ‘do-ma i mum’ networ full ta es account of the transport projects being undertaken by various government agencies in the GCR – these projects are:
(i) On-going transport projects due for completion in the near future, (ii) Committed transport projects at various stages of implementation; and (iii) Proposed transport projects at various stages of study/ approval etc.
5.4 Initial assessment of the impact of all above (on-going, committed and proposed) Government projects revealed that these projects alone would not be sufficient at all to relieve congestion, and congestion would remain prevalent and sever in most of MM areas, particularly along the major north/south axis in the mega-manila area. As a result additional transport infrastructure pro ects were de eloped under the guidelines of the ‘transport de elopment strateg ’ described elsewhere in this report.
5.5 Other infrastructure projects such as intersection improvement through construction of multi-level flyovers, better traffic management through improved/ modern traffic signal arrangements or soft projects like introduction of integrated fare system or institutional reforms etc. have also been studied, their impact taken into account and reported elsewhere in this report. The following sections report on the operational performance of the proposed transport infrastructure ‘do-ma i mum’ case in . The 2030 ‘do-ma i mum’ networ would need se eral ears to implement. h e implementation schedule was prepared based on growth in transport demand, available budget, and giving priority to Government on-going, committed and proposed projects. In view of the staged implementation assessment of transport network performance were made for the intermediate years of 2016 and 2020.
Roadmap for Transport Infrastructure Development for Metro Manila and Its Surrounding Areas (Region III and Region IV-A) FINAL REPORT Technical Report No. 2 Transport Demand Analysis
5-2
5.2 Highway Network
5.6 The proposed road network includes urban and inter-urban expressways, primary and secondary arterial roads in Mega-Manila area and primary (national) roads in the rest of the Regions III and IV-A. The existing expressways are proposed to be upgraded (widened), and new ones are proposed to form a network of integrated expressways from north to south in the GCR. The expressway network is supported by both new and upgraded primary and secondary roads in the entire GCR to provide seamless connectivity between major GCR regional, sub-regional centres and cities. The proposed highway network is illustrated in Figure 5.2.1 and key features are summarised in Table 5.2.1. Report Volume Roadmap Projects Profile provides a detailed list of all projects included in 2030 Do-maximum plan.
Table 5.2.1 Key Characteristics of Do-maximum Highway Network - 2030
Road Type and Area
Length (km)
Metro Manila
Rest of GCR
Total
Expressways Existing No Upgrade 54 47 101
Existing – Upgrade 0 197 197
Sub-Total Existing 54 244 298
New - Expressways 119 386 505
Total Expressways 173 630 803
Primary & Secondary Roads
Existing No Upgrade 577 4,102 4,679
Existing – Upgrade 165 383 548
Sub-Total Existing 742 4485 5227
New – Roads 43 94 137
Total Primary & Sec. Roads 785 4,579 5,364
Highway Network Expressways & Roads
Existing No Upgrade 631 4,149 4,780
Existing – Upgrade 165 580 745
Sub-Total Existing 796 4729 5525
New - Proposed 162 480 642
Total X-way & Roads 958 5,209 6,167 Source: JICA Study Team.
5.7 The proposed network requires more than 170% increase in the current expressway network both in MM and in the rest of the GCR study area region to ensure reasonable level of service on the expressway system. The proposed network of expressways is shown in Figure 5.2.1 for MM and whole of GCR. The Do-maximum scenario would extend the current network of 300km to over 800 km, which will provide high standard expressway from Batangas to San Jose (Nova Ecija) on the east side of GCR, and from Cavite to Tarlac on the west of GCR, thus providing two high standard north/south roads both passing through MM, with numerous east-west links between the two expressways. The proposed expressway would strengthen the north-south corridor with a completely new expressway from CAVITEX in the west over the existing C-5 circumferential road to San Jose del Monte in Bulacan, and north to Cabanatuan, and up to San Jose in Nova Ecija.
5.8 It is also proposed to make the best use of existing available Right of Way (ROW) of the existing expressways through widening (adding additional lanes) from the current single two lane (Part of Star & SCTEX) or dual 2 lane (NLEX & other) to dual 3 lanes (i.e. divided six lanes).Similarly it is proposed to improve SLEX/ Star to dual 3 lane standard wherever the existing expressways are dual 2lanes. In the south east it is also proposed to extend SLEX to Lucena City. In the north-west it is proposed to provide an expressway between
Roadmap for Transport Infrastructure Development for Metro Manila and Its Surrounding Areas (Region III & Region IV-A) FINAL REPORT
Technical Report No. 2 Transport Demand Analysis
5-3
San Fernando (Pampanga) and Subic port – this providing a much shorter expressway route between Subic and Metro Manila.
Expressways – Metro Manila Expressways – Greater Capital Region
Source: JICA Study Area Traffic Model, Network Demand Image from CUBE Software.
5.9 Under the do-maximum the expressway network in MM would increase by almost threefold from the current 54 km to 173 km. Within MM the committed expressways (SLEX-NLEX connector, Skyway stage 3, NAIA expressway) would provide adequate capacity in major north/south corridor. The radial corridor specially R-4 & R-7 corridors would need additional capacity and need to have elevated expressways. In addition extension of skyway-3 to the north harbour, and NAIA Phase-II would enhance the expressway connectivity to the key traffic nodes in MM.
5.10 Parallel with the (toll) expressway network, the local area primary/ secondary road network has also been enhanced mostly through capacity expansion and where necessary through new roads both in MM urban areas and in the GCR provinces. The road network enhancement is summarised above in Table 5.2.1. The new roads proposed would increase the network in much needed areas by about 140km, including completion/ construction of several missing links in MM, thus increasing the road network by 6% in MM.
5.11 Greater emphasis is placed increasing capacity of the existing network through traffic & demand management measures. However, in some areas such as Marikina, Navotas and Malabon would require road widening from current single carriageway to at least dual carriageway of two lanes on each side. The provision of divided carriageway enhances the road capacity considerably, particularly on primary routes. About 550 km of road network has been identified for capacity expansion, almost one third of the 548km is in MM, and rest of the upgrade of roads is mostly in the surrounding provinces.
Roadmap for Transport Infrastructure Development for Metro Manila and Its Surrounding Areas (Region III and Region IV-A) FINAL REPORT Technical Report No. 2 Transport Demand Analysis
5-4
Road Network – Metro Manila Road Network – Greater Capital Region
Source: JICA Study Area Traffic Model, Network Demand Image from CUBE Software.
Roadmap for Transport Infrastructure Development for Metro Manila and Its Surrounding Areas (Region III & Region IV-A) FINAL REPORT
Technical Report No. 2 Transport Demand Analysis
5-5
5.3 Railway Network
5.12 Based on the north/ south corridor development strategy, it is proposed to provide two major north-south rail systems. The western N/S corridor is based on the philosophy to make best and most effective use of the existing PNR ROW and provide a high capacity modern suburban railway. On the east side of the N/S corridor it is proposed to provide a high capacity mass transit system from Cavite to Bulacan, through the densest part of MM along the busiest transport corridor of MM. The proposed railway network is illustrated in Figure 5.3.1 and key features are summarised in Table 5.3.1. Annex B provides a detailed list of all proposed rail lines included in 2030 Do-maximum plan.
Rail Network – Metro Manila Rail Network – Greater Capital Region
Source: JICA Study Area Traffic Model, Network Demand Image from CUBE Software.
Figure 5.3.1 2030 Do-maximum – Rail Network Current and New Lines
5.13 The north/south corridor lines are supported by primary network lines of LRT/MRT lines within MM, supplemented by five secondary lines acting as feeder lines. It is also proposed that the existing three lines should go through major overhaul and capacity expansion programme so that full extent of the infrastructure is utilised. The above table illustrates these features. The current rail network (excluding PNR which carries minimal passengers) would increase by almost 10 fold from the current 47km to 494km with 285 stations by 2030.
5.14 It should be noted that the future line lengths are approximate and station numbers are also an estimate based on possible location accessibility and station spacing. Exact line lengths and number of stations may be revised/ determined/ confirmed at the feasibility study stage of each line. The above network fully supports the current GoP committed/approved rail lines and the JICA study team proposals further enhances the performance of the GoP proposed lines. It can be seen, that the proposed hierarchical rail
Roadmap for Transport Infrastructure Development for Metro Manila and Its Surrounding Areas (Region III and Region IV-A) FINAL REPORT Technical Report No. 2 Transport Demand Analysis
5-6
network (refer Figure 5.3.1) is a well-integrated rail system with higher density of stations inside and along EDSA, and all secondary lines on the outskirts acting as local transit railways as well as feeder to the primary lines.
LRT-2-1 LRT-2 East Ext. Ph-I Santolan - Masinag 4.2 2 LRT-2-2 LRT-2 East Ext. Ph-II Masinag - Antipolo (U-Ground) 3.0 1 LRT-2-2 LRT-2 East Ext. Ph-II Masinag - Antipolo 6.0 5 LRT-2-3 LRT-2 West Ext. Recto - MM North Harbour 4.7 3 LRT-2 Sub Total 30.5 22 MRT-3 Existing Capex Taft - North Avenue 16.5 13
MRT-3-1 MRT-3 Ext. - South Taft - Mall of Asia (Underground) 2.2 2 MRT-3-2 MRT-3 Ext. - West Monumento - Malabon/ Navotas 7.2 5 MRT-3 Sub Total 25.9 20
MRT-7-1 MRT-7 (Underground) Recto - Blumentritt 2.1 3 MRT-7-2 MRT-7 (Elevated) Blumentritt - Comm. Av - Banaba 24.0 18 MRT-7 Sub Total 26.1 21
MRT-NS-1 NS Line (Underground) MM - BGC - Makati 43.5 30 MRT-NS-2 NS Line (Elevated) North & South - Sections 25.1 18 MRT-NS Sub Total 68.6 48
Roadmap for Transport Infrastructure Development for Metro Manila and Its Surrounding Areas (Region III & Region IV-A) FINAL REPORT
Technical Report No. 2 Transport Demand Analysis
5-7
5.4 Proposed Do-maximum Network Performance
5.15 The 2030 future travel demand O/D was assigned to the proposed do-maximum highway and rail network. The assignment results and the performance of the network is summarised and discussed in the following tables by region. Table 5.4.1presents the results for the Metro Manila Area and assigned volumes are shown in Figure 5.4.1.
Table 5.4.1 2030 Do-Maximum Network Performance – Metro Manila Area
Indicator Description 2030
Do-Nothing 2030
Do-Max Impact DM/DN
Travel Demand Person Trip Generations (million) 14.5 14.5 1.00
Expressway Network (119km of new expressways) km 54.0 173.0 3.20
Primary & Secondary Roads (43km new roads) km 742.0 785.0 1.06
Total Highway Network (km) 796.0 958.0 1.20
Volume Capacity (V/C) Ratio 1.47 0.72 0.49
Circumferential Roads (C1-C5=84km) % km <10kph 67% 6% 0.09
Circumferential Roads (C1-C5=84km) % km <20kph 91% 21% 0.23
Radial Roads (R1-R10=77km) % km <10kph 89% 28% 0.31
Radial Roads (R1-R10=77km) % km <20kph 99% 61% 0.62
All Roads (DN 796km; DM=958) % km <10kph 71% 15% 0.21
All Roads (DN= 796km; DM=958) % km <20kph 90% 36% 0.40
Total Cost (USD) million/ annum All Modes 55,474 18,737 0.34
Total Revenue
(USD) million/ annum
Rail 456 1,635 3.59
Bus/ Jeepney 3,889 2,042 0.53
Expressway 1,579 1,993 1.26
Total 5,924 5,670 0.96
Study Team. Note: Annualisation Factor Used=365, and USD1.00=PHP40.00.
Roadmap for Transport Infrastructure Development for Metro Manila and Its Surrounding Areas (Region III and Region IV-A) FINAL REPORT Technical Report No. 2 Transport Demand Analysis
5-8
Highway Network – Metro Manila Highway Network – Greater Capital Region
Source: JICA Study Area Traffic Model, Network Demand Image from CUBE Software
Total Cost (USD) million/ annum All Modes 93,707 35,761 0.38
Total Revenue
(USD) million/ annum
Rail 456 2,591 5.68
Bus/ Jeepney 9,583 5,809 0.61
Expressway 2,121 2,775 1.31
Total 12,160 11,155 0.80
Source: JICA Study Team. Note: Annualisation Factor Used=365, and USD1.00=PHP40.00.
Roadmap for Transport Infrastructure Development for Metro Manila and Its Surrounding Areas (Region III and Region IV-A) FINAL REPORT Technical Report No. 2 Transport Demand Analysis
5-10
5.5 Proposed Short Term 2016 Network Performance
5.16 The short term network development was proposed to alleviate the dire traffic conditions in MM and also in the adjoining provinces. The impact of some of the minor projects will be localised, like with the addition of flyovers at junctions. Whereas the major improvements of road sections (e.g. C-4 ‘E ’ rehabilitation and building and completion of new road/ expressway sections over the next three years (2013~2016) would have considerable impact in reducing the traffic congestion. The impact of the completion of the proposed Short Term projects was assessed using the travel demand forecast model by comparing the 2016 do-nothing situation with the completion of Short Term plan projects by 2016. The details of the Short Term projects are presented and discussed in the Main Report and its appendices; however, a summary list of Short Term projects is given in Table 5.5.1; and depicted in Figure 5.5.1.
Table 5.5.1 Highway, Expressway, Other Roads, Railways Short Term Projects
Name of Project Region Status New/
Upgrade Length (km)
Existing Lanes
Proposed Lanes
A. R
oads
2. Global City to Ortigas Center Link Road NCR Proposed New 1.2 3-3
4. MRT 7 stage1 (Quezon Ave. – Comm. Ave.) NCR/BRLC Committed New 22.8 Common Station
5. Contactless Automatic Fare Collection System (AFCS) NCR Committed New All Rail & Possibly Bus System
6. Line1 and Line2 System Rehabilitations NCR Committed Existing 18.1 Upgrade/ Stations
Source: JICA Study Team.
Roadmap for Transport Infrastructure Development for Metro Manila and Its Surrounding Areas (Region III & Region IV-A) FINAL REPORT
Technical Report No. 2 Transport Demand Analysis
5-11
5.17 The impact of implementing the Short Term plan is compared with the do-nothing scenario in Table 5.5.2 for the study area as whole, and reflected in Figure 5.5.1.The figure illustrates how even limited upgrades (e.g. EDSA) could have major impact in reducing congestion in MM areas. Congestion in the south of MM would also reduce due to extension of Line-1 to Niyog. The overall railway patronage would go up by almost three fold due to capacity expansion of existing Line-1 and Line-3 and extension of Line-1 to south, extension of Line-2 to Masinag and completion of MRT-7 to Common Station. This increase of about 2.9million Pax would reduce congestion in their respective corridor of operation. On the roads speeds would increase, albeit not substantially, some 24% of MM network will no longer operate below 20kph. Substantial economic benefit resulting in total Vehicle Operating Cost (VOC) going down by 29% and time savings of about 36% would accrue, resulting in annual benefit of about USD14.5billion annually.
Table 5.5.2 Short Term (ST) Plan Performance – GCR Study Area
Total Cost (USD) million/ annum All Modes 44,325 29,825 0.67
Total Revenue
(USD) million/ annum
Rail 206 591 2.87
Bus/ Jeepney 4,139 3,705 0.90
Expressway 1,075 1,297 1.21
Total 5,420 5,594 1.03
Source: JICA Study Team. Note: Annualisation Factor Used=365, and USD1.00=PHP40.00
Roadmap for Transport Infrastructure Development for Metro Manila and Its Surrounding Areas (Region III and Region IV-A) FINAL REPORT Technical Report No. 2 Transport Demand Analysis
5-12
2016 Do-nothing Scenario – Metro Manila 2016 Short Term Plan Projects
Source: JICA Study Area Traffic Model, Network Demand Image from CUBE Software
Figure 5.5.1 Do-Nothing Network Performance and Short Term Plan Projects
2016 Impact Short Term Plan – Metro Manila 2016 Railway Passengers – Metro Manila
Source: JICA Study Area Traffic Model, Network Demand Image from CUBE Software.
Figure 5.5.2 2016 Network Performance and Railway Demand
ANNEXES
Roadmap for Transport Infrastructure Development for Metro Manila and Its Surrounding Areas (Region III & Region IV-A)
FINAL REPORT
Annex A Transport Demand Analysis
A-1
ANNEX A Study Area Zone System
Zone Area Province Region
1 Manila Metro Manila NCR
2 Manila Metro Manila NCR
3 Manila Metro Manila NCR
4 Manila Metro Manila NCR
5 Manila Metro Manila NCR
6 Manila Metro Manila NCR
7 Manila Metro Manila NCR
8 Manila Metro Manila NCR
9 Manila Metro Manila NCR
10 Manila Metro Manila NCR
11 Manila Metro Manila NCR
12 Manila Metro Manila NCR
13 Manila Metro Manila NCR
14 Manila Metro Manila NCR
15 Manila Metro Manila NCR
16 Manila Metro Manila NCR
17 Manila Metro Manila NCR
18 Manila Metro Manila NCR
19 Manila Metro Manila NCR
20 Pasay Metro Manila NCR
21 Pasay Metro Manila NCR
22 Pasay Metro Manila NCR
23 Pasay Metro Manila NCR
24 Pasay Metro Manila NCR
25 Makati Metro Manila NCR
26 Makati Metro Manila NCR
27 Makati Metro Manila NCR
28 Makati Metro Manila NCR
29 Makati Metro Manila NCR
30 Makati Metro Manila NCR
31 Makati Metro Manila NCR
32 Mandaluyong_W Metro Manila NCR
33 Mandaluyong_C Metro Manila NCR
34 Mandaluyong_SE Metro Manila NCR
35 Mandaluyong_NE Metro Manila NCR
36 San-Juan_E Metro Manila NCR
37 San-Juan_W Metro Manila NCR
38 Quezon Metro Manila NCR
39 Quezon Metro Manila NCR
40 Quezon Metro Manila NCR
41 Quezon Metro Manila NCR
42 Quezon Metro Manila NCR
43 Quezon Metro Manila NCR
44 Quezon Metro Manila NCR
45 Quezon Metro Manila NCR
46 Quezon Metro Manila NCR
47 Quezon Metro Manila NCR
48 Quezon Metro Manila NCR
49 Quezon Metro Manila NCR
Roadmap for Transport Infrastructure Development for Metro Manila and Its Surrounding Areas (Region III & Region IV-A)
FINAL REPORT
Annex A Transport Demand Analysis
A-2
Zone Area Province Region
50 Quezon Metro Manila NCR
51 Quezon Metro Manila NCR
52 Quezon Metro Manila NCR
53 Quezon Metro Manila NCR
54 Quezon Metro Manila NCR
55 Quezon Metro Manila NCR
56 Quezon Metro Manila NCR
57 Quezon Metro Manila NCR
58 Valenzuela Metro Manila NCR
59 Valenzuela Metro Manila NCR
60 Valenzuela Metro Manila NCR
61 Valenzuela Metro Manila NCR
62 Valenzuela Metro Manila NCR
63 Malabon_W Metro Manila NCR
64 Malabon_E Metro Manila NCR
65 Navotas Metro Manila NCR
66 Caloocan_S_W Metro Manila NCR
67 Caloocan_S_NE Metro Manila NCR
68 Caloocan_S_SE Metro Manila NCR
69 Caloocan_NE Metro Manila NCR
70 Caloocan_N Metro Manila NCR
71 Caloocan_NW Metro Manila NCR
72 Marikina_N Metro Manila NCR
73 Marikina_S Metro Manila NCR
74 Pasig_W Metro Manila NCR
75 Pasig_N Metro Manila NCR
76 Pasig_C Metro Manila NCR
77 Pasig_S Metro Manila NCR
78 Pateros Metro Manila NCR
79 Taguig_W Metro Manila NCR
80 Taguig_N Metro Manila NCR
81 Taguig_S Metro Manila NCR
82 PRNQ_Santos Metro Manila NCR
83 PRNQ_RCLM Metro Manila NCR
84 PRNQ_NE Metro Manila NCR
85 PRNQ_E Metro Manila NCR
86 PRNQ_S Metro Manila NCR
87 PRNQ_C Metro Manila NCR
88 PRNQ_W Metro Manila NCR
89 Muntinlupa_N Metro Manila NCR
90 Muntinlupa_C Metro Manila NCR
91 Muntinlupa_S Metro Manila NCR
92 Las_Pinas_SE Metro Manila NCR
93 Las_Pinas_C Metro Manila NCR
94 Las_Pinas_NW Metro Manila NCR
95 Bacoor Cavite IV-A
96 Imus Cavite IV-A
97 Cavite_City Cavite IV-A
98 Kawit Cavite IV-A
99 Noveleta Cavite IV-A
100 Rosario Cavite IV-A
101 Gen_Trias_N Cavite IV-A
102 Gen_Trias_C Cavite IV-A
Roadmap for Transport Infrastructure Development for Metro Manila and Its Surrounding Areas (Region III & Region IV-A)
FINAL REPORT
Annex A Transport Demand Analysis
A-3
Zone Area Province Region
103 Gen_Trias_S Cavite IV-A
104 Tanza Cavite IV-A
105 Trece_Martires_City Cavite IV-A
106 Dasmarinas_W Cavite IV-A
107 Dasmarinas_E Cavite IV-A
108 Dasmarinas_S Cavite IV-A
109 Gen_Alvarez Cavite IV-A
110 Carmona Cavite IV-A
111 Naic_W Cavite IV-A
112 Naic_E Cavite IV-A
113 Silang Cavite IV-A
114 Aguinaldo_Magallanes Cavite IV-A
115 Amadeo_Indang Cavite IV-A
116 Alfonso_Indang Cavite IV-A
117 Tagaytay_City Cavite IV-A
118 San Pedro Laguna IV-A
119 Binan Laguna IV-A
120 Santa_Rosa_City Laguna IV-A
121 Cabuya Laguna IV-A
122 Calamba_City Laguna IV-A
123 Calamba_W Laguna IV-A
124 Bay Laguna IV-A
125 Alaminos Laguna IV-A
126 San_Pablo_City Laguna IV-A
127 Santa Maria Laguna IV-A
128 Kalayaan Laguna IV-A
129 Cavinti Laguna IV-A
130 Liliw Laguna IV-A
131 Pagsanjan Laguna IV-A
132 San_Jose Rizal IV-A
133 Burgos Rizal IV-A
134 San Mateo Rizal IV-A
135 Antipolo_City Rizal IV-A
136 Cainta Rizal IV-A
137 Taytay Rizal IV-A
138 Angono Rizal IV-A
139 Binangonan Rizal IV-A
140 Teresa Rizal IV-A
141 Morong Rizal IV-A
142 Cardona Rizal IV-A
143 Baras Rizal IV-A
144 Tanay Rizal IV-A
145 Pililla Rizal IV-A
146 Jalajala Rizal IV-A
147 Balayan Batangas IV-A
148 Agoncillo Batangas IV-A
149 Laurel Batangas IV-A
150 Tanauan_City Batangas IV-A
151 Santo_Tomas Batangas IV-A
152 Balete Batangas IV-A
153 Lipa_City Batangas IV-A
154 Cuenca Batangas IV-A
155 Alitagtag Batangas IV-A
Roadmap for Transport Infrastructure Development for Metro Manila and Its Surrounding Areas (Region III & Region IV-A)
FINAL REPORT
Annex A Transport Demand Analysis
A-4
Zone Area Province Region
156 Padre_Garcia Batangas IV-A
157 San_Juan Batangas IV-A
158 Lobo Batangas IV-A
159 Batangas_City Batangas IV-A
160 Gen_Nakar Quezon IV-A
161 Lucban Quezon IV-A
162 Tayabas_City Quezon IV-A
163 Lucena_City_SE Quezon IV-A
164 Quezon_SW Quezon IV-A
165 Meycauayan Bulacan III
166 Marilao Bulacan III
167 Obando Bulacan III
168 Bulacan Bulacan III
169 Bocaue Bulacan III
170 Balagtas Bulacan III
171 Guiguinto Bulacan III
172 Malolos Bulacan III
173 Paombong Bulacan III
174 Hagonoy Bulacan III
175 Calumpit Bulacan III
176 Pulilan Bulacan III
177 Plaridel Bulacan III
178 Pandi Bulacan III
179 Santa_Maria_S Bulacan III
180 Santa_Maria_N Bulacan III
181 San_Jose_Del_Monte_W Bulacan III
182 San_Jose_Del_Monte_E Bulacan III
183 San_Jose_Del_Monte_N Bulacan III
184 Norzagaray_W Bulacan III
185 Norzagaray_E Bulacan III
186 Baliuag Bulacan III
187 Bustos Bulacan III
188 Angat Bulacan III
189 San_Ildefonso_Miguel_Rafael Bulacan III
190 Dona_Remedios_Trinidad Bulacan III
191 Apalit_SanSimon Pampanga III
192 Candaba_SanLuis Pampanga III
193 Minalin_Macabebe Pampanga III
194 Bacolor_Guagua_S-R_S-T Pampanga III
195 San_Fernando_S Pampanga III
196 San_Fernando_N Pampanga III
197 Masantol Pampanga III
198 Lubao_Sasmuan Pampanga III
199 Floridablanca Pampanga III
200 Arayat_Mexico_Santa_Ana Pampanga III
201 Magalang Pampanga III
202 Porac Pampanga III
203 Mabalacat_E Pampanga III
204 Mabalacat_W Pampanga III
205 Angeles_C Pampanga III
206 Angeles_S Pampanga III
207 Angeles_E Pampanga III
208 Angeles_W Pampanga III
Roadmap for Transport Infrastructure Development for Metro Manila and Its Surrounding Areas (Region III & Region IV-A)
FINAL REPORT
Annex A Transport Demand Analysis
A-5
Zone Area Province Region
209 Mariveles_Limay Bataan III
210 Balanga Bataan III
211 Bagac Bataan III
212 Dinalupihan Bataan III
213 Olongapo_City Zambales III
214 Subic Zambales III
215 Zambales_NW Zambales III
216 Tarlac_SW Tarlac III
217 Tarlac_City Tarlac III
218 Tarlac_W Tarlac III
219 Tarlac_E Tarlac III
220 Tarlac_N Tarlac III
221 Nueva_Ecija_S Nueva Ecija III
222 Nueva_Ecija_E Nueva Ecija III
223 Nueva_Ecija_NC Nueva Ecija III
224 Nueva_Ecija_W Nueva Ecija III
225 Cabanatuan_City Nueva Ecija III
226 Nueva_Ecija_NW Nueva Ecija III
227 Aurora Aurora III
228 Pangasinan_E Pangasinan I
229 Pangasinan_N Pangasinan I
230 Pangasinan_SW Pangasinan I
231 Pangasinan_C Pangasinan I
232 Pangasinan_NW Pangasinan I
233 La Union La Union I
234 Nueva Vizcaya Nueva Vizcaya II
235 Benguet Benguet CAR
236 ALL_IV-B ALL_IV-B IV-B
237 ALL_V ALL_V V
238 Manila Port Special_Ext NCR
239 NAIA (I) Special_Ext NCR
240 NAIA (D) Special_Ext NCR
241 NAIA (W) Special_Ext NCR
242 CIA (I) Special_Ext III
243 CIA (D) Special_Ext III
244 CIA (W) Special_Ext III
245 Spare Special ?
Roadmap for Transport Infrastructure Development for Metro Manila and Its Surrounding Areas (Region III & Region IV-A)
FINAL REPORT
Annex A Transport Demand Analysis
A-6
Roadmap for Transport Infrastructure Development for Metro Manila and Its Surrounding Areas (Region III & Region IV-A)
FINAL REPORT
Annex A Transport Demand Analysis
A-7
Roadmap for Transport Infrastructure Development for Metro Manila and Its Surrounding Areas (Region III & Region IV-A) FINAL REPORT
Annex B Vehicle Operating Cost and Value of Time
B-1
ANNEX B Vehicle Operating Cost and Value of Time
1 B.1 Calculation of Vehicle Operating Cost (VOC)
Network wide vehicle operating cost was estimated using the exogenously calculated VOC for each of the four (1. Car, 2.Jeepney, 3.Bus 4. Truck) vehicle types modelled for the study. Vehicle operating cost is estimated for each link in the network and summed up for the entire network for any scenario. The VOC calculation method is same for each scenario.
Vehicle Operating Cost for each link in the model network was calculated by using link speed associated with the total assigned volume to the link and its capacity. The volume, capacity and speed relationship is defined in the main text of Technical Report 2.
VOC = (a × link speed(kph) + b) × linkdistance(km)
1000× No. of assigned vehicles
Where “a” and “b” are coefficient as define in Table B.1 to B.3 for 2012, 2016 and 2030 respectively below, and link length, link travel speed and assigned volume for each vehicle type are taken from the assigned network.
Roadmap for Transport Infrastructure Development for Metro Manila and Its Surrounding Areas (Region III & Region IV-A) FINAL REPORT Annex B Vehicle Operating Cost and Value of Time