59
Japanese Scientific Activities Related to FUTURE

Japanese Scientific Activities Related to FUTURE

Key words:
Global WarmingClimate‐Ocean InteractionMonitoringNatural and Anthropogenic Forcings on Ecosystem Sustainability of Ecosystem ServicesCommunication between Science and Society


Study on the atmospheric response to ocean fronts and its feedback to the ocean
5‐years project of JSP (Kekenhi)PL: Prof. Shoshiro MinobeTarget region: Kuroshio front off Okinawa


JAMSTECBiogeochemical Time-series Observation
Seasonal Shipboard
Observation
Change in
Biological Carbon
Pump function?
Autonomous Continuous observation
Ecosystem responses
to physical/chemical
environmental
variation
(c) ミュール

2 stations: K2 and S1
S1: 30N, 145E
K2: 47N, 160E
KEO: 32‐20N, 144‐30E
J‐KEO: 38‐05N, 146‐25E

decrease in Opal to CaCO3 ratio flux at 5000m
increase in wintertime surface
pCO2
delay in phytoplankton
bloom
SeaWifs
Chl
a
(1998‐2006)45‐50 N, 155‐165 EFeb 1 – Aug 31 (10 days composite)
K2
S1
Sediment trap data at
Station K2
What’s up in WNP in 2000s
Biogeochemical
time‐series
observation by
JAMSTEC
Satellite based
phenology
study

R/V Mirai
cruises for the time series observation

HakuhoHakuho‐‐MaruMaru
Cruises for BGC and Ecosystem Cruises for BGC and Ecosystem Studies from Dec 2011 to Aug 2012 (3 cruises, 160 Studies from Dec 2011 to Aug 2012 (3 cruises, 160
days, 150 scientists) days, 150 scientists)

Comparative studies of NW and SE subtropicac
PacificPI: Prof. Ken FuruyaDec. 2011‐Jan. 2012 (60 days)

SOLAS cruise
PIs: Prof. Mitsu
UematsuFeb‐Mar 2012 (30 days for obs.)

IMBER cruise
120 E゚ 130 E゚ 140 E゚ 150 E゚ 160 E゚ 170 E゚ 180゜60 N゚
50 N゚
40 N゚
30 N゚
20 N゚
10 N゚
0゜ホ ナ゚ ペ
○ : 大測点● : 小測点
レグ1: 160E南北測線(48N→ 10N)
レグ2: 148E南北測線(20N→ 40N) 移動測線(148E,40N→ 130E,20N)
黒潮源流横断測線(130E,20N→ 123E,28N)
120 E゚ 130 E゚ 140 E゚ 150 E゚ 160 E゚ 170 E゚ 180゜60 N゚
50 N゚
40 N゚
30 N゚
20 N゚
10 N゚
0゜ホ ナ゚ ペ
○ : 大測点● : 小測点
レグ1: 160E南北測線(48N→ 10N)
レグ2: 148E南北測線(20N→ 40N) 移動測線(148E,40N→ 130E,20N)
黒潮源流横断測線(130E,20N→ 123E,28N)
120 E゚ 130 E゚ 140 E゚ 150 E゚ 160 E゚ 170 E゚ 180゜60 N゚
50 N゚
40 N゚
30 N゚
20 N゚
10 N゚
0゜
120 E゚ 130 E゚ 140 E゚ 150 E゚ 160 E゚ 170 E゚ 180゜60 N゚
50 N゚
40 N゚
30 N゚
20 N゚
10 N゚
0゜
120 E゚ 130 E゚ 140 E゚ 150 E゚ 160 E゚ 170 E゚ 180゜60 N゚
50 N゚
40 N゚
30 N゚
20 N゚
10 N゚
0゜ホ ナ゚ ペ
○ : 大測点● : 小測点
レグ1: 160E南北測線(48N→ 10N)
レグ2: 148E南北測線(20N→ 40N) 移動測線(148E,40N→ 130E,20N)
黒潮源流横断測線(130E,20N→ 123E,28N)
PIs: Drs H. Ogawa and H. SaitoJuly‐August 2012 (45 days)

Evaluation, Adaptation and Mitigation of Global Warming in
Agriculture, Forestry and Fisheries
• 5‐years project by the Ministry of Agriculture, Forestry and Fisheries from 2010. Funding for fisheries sciences is ca. 400 M JPY.
• 3 themes in fisheris: monitoring, fisheries of the Sea of Japan, fisheries in coastal & inland waters

Oceanographic monitoring and the evaluation of global warming impact on the marine ecosystem
Evaluation of the impact of global
warming
CK-
line
A-line
O-line
栄養分(窒素・リン・ケイ素)
光
餌 >> 動物プランク
トン
植物プランクト
ン
水温・塩分クロロフィ
ル測定・採水
プランク
トン採集
低次生態系調査
光合成
Oceanographic Monitoring
Neocalanus
PO4

un
1
2
3
4
Impact of the global warming on the fisheries in the Sea of Japan
Fisheries in the Sea of JapanModel
夏
冬
秋オホーツク海
冬アラスカ湾
ベーリング海
母川回帰
日本のシロザケの回遊ルート
1 年目
1 年目
2 年目以降
2 年目以降
Variable impact thorugh
migration route
Salmon in the Sea of
Japan
Impact of the increase in water
temperature on chum salmon
Development of nuresery/release
techniques adapting to global
warming
Forecasting the Environment
of the Sea of Japan
Forecasting Higher Trophic
Levels under Global Wariming
Ecosystem
model
Fish growth and migration
Adaptation strategy of
the fisheries in the Sea of
Japan under global
warming
Forecasting the impact of global
warming
Coupling OGCM C‐HOPE and ecosystem
model e‐NEMURO
Saury migration forecastng

生残
動物プランクトン 仔魚
良 悪マッチ ミスマッチ
ワカサギ・イサザ温暖化進行
Impact of the global warming on the fisheries in coastal and inland waters
Fisheries in inland watersSeaweed bed Aquaculture
Forecasting the
impact of the global
warming on algae
Understanding the
control factors of
the dynamics of
seaweed bed
Development of the prey pellet
giving high‐temperature
tolerance for cultured fishes
Selection of strains tolerative
for high temperature
Impact of the global warming
on aquaculture fields
Adaptation technique of
aquaculture to the global
warming
Forecasting the impact of
global warming on the
fisheries of inland waters
Impacts of larval fish and
prey organisms
Adaptation/mitigation
technique of algal
community for global
warming
Sustainable fisheries
production under global
warming
イサザ ワカサギ

Population Outbreak of Marine Life
POMALPOMALPOMALPOMAL
POMAL is a new IMBER‐JAPAN project for 2007‐2012 studying
the marine ecosystem responses to the natural and/or
anthropogenic environmental changes,
funded by the
Agriculture, Forestry and Fisheries Research Council (AFFRC).850 M JPY

POMAL has a couple of subproject, which are SUPRFISHSUPRFISHStudies on Prediction and Application of Fish Studies on Prediction and Application of Fish Species Alternation Species Alternation (ES responses to natural F)
STOPJELLYSTOPJELLYStudies on Prediction and Control of Jellyfish Studies on Prediction and Control of Jellyfish Outbreaks Outbreaks (ES responses to anthropo. F)
POMALPOMALPOMALPOMAL
Natural forcing
Anthropogenic forcing
Fish species alternation
Jellyfish outburst
Changes in Changes in
Ecosystem Ecosystem
StructureStructure

海洋生物大発生
Natural forcing
Anthropogenic forcing
Fish species alternation
Jellyfish outburst
Changes in Changes in
Ecosystem Ecosystem
StructureStructure

Structure of SUPRFISHStructure of SUPRFISH
Biology and Ecology
of Pelagic Fish
Climatic and Physical
Oceanographic Processes
Inducing FSA
Lower Food‐Web
Dynamics in KEX
Model
OGCM+PFGM+FISH IBM
Application of Uncontrollable FSA to
Fisheries Management
Establishing an Interdisciplinary Scientists Group [20 PIs, 60 Scientists]

魚種交替モデル 構造:
物理モデル生態系モデル魚類SUPER IBMモデル
(成長モデル+回遊モデ ル)
Bioenergetics Model : 魚類成長モデル
体重変化
f
z
CALCALPEFSRC
dtWdW
)(
E: 排出C: 摂餌
R: 呼吸代謝
S: 消化エネルギー
F: 排泄
P: 卵形成
0
5
10
15
20
25
30
0 500 1000 1500 2000 2500 3000age (day)
body
leng
th (c
m)
modelobs.
体長マイワシ
wet weight (g)
体重 カタクチイワシ

Structure of SUPRFISHStructure of SUPRFISH
Biology and Ecology
of Pelagic Fish
Climatic and Physical
Oceanographic Processes
Inducing FSA
Lower Food‐Web
Dynamics in KEX
Model
OGCM+PFGM+FISH IBM
Application of Uncontrollable FSA to
Fisheries Management
Establishing an Interdisciplinary Scientists Group [20 PIs, 60 Scientists]

• Fishers increased fishing ability by
enlarging transporter (<99ton class
to 2 x >200 ton class)
0
5000
10000
15000
20000
25000
30000
1962
1966
1970
1974
1978
1982
1986
1990
1994
1998
2002
15T~19T20T~29T30T~49T50T~99T100T~199T200T以上
Shipbuilding Shipbuilding by fleet size
330 ton class tranporter
Shipbuilding at highShipbuilding at high‐‐stock periodstock period
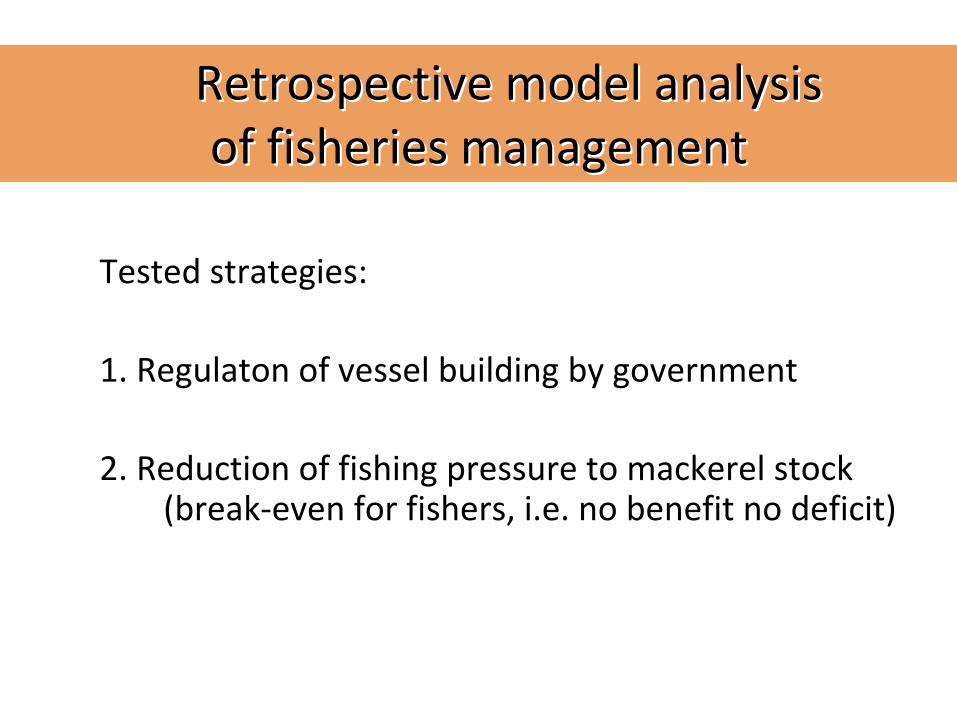
Tested strategies:
1. Regulaton
of vessel building by government
2. Reduction of fishing pressure to mackerel stock (break‐even for fishers, i.e. no benefit no deficit)
Retrospective model analysis Retrospective model analysis of fisheries managementof fisheries management

0.0
200.0
400.0
600.0
800.0
1000.0
1200.0
1400.0
1600.0
1800.0
2000.0
1992
1994
1996
1998
2000
2002
2004
2006
漁獲量(1000 tonnes)
Real
Scenario 1(5y)
Scenario 1(10y)
Scenario 2(5y)
Scenario 3(92)
Scenario 3(92,96)
0.0
1000.0
2000.0
3000.0
4000.0
5000.0
6000.0
1992
1994
1996
1998
2000
2002
2004
2006
マサバ資源量 (1000 tonnes)
Real
Scenario 1(5y)Scenario 1(10y)Scenario 2(5y)Scenario 3(92)Scenario 3(92,96)
31
Reduce fleet number (cost) by
10 % and reduce fishing
pressure for 2‐year for each
strong year class (92‐93, 96‐97)
(this strategy
is equivalent to 10‐
years reduction
in fishing
pressure)
‘92-93
‘96-97
Best solutionBest solutionMackerel stock level (1000 tons)
Mackerel landing (1000 tons)

愛媛大学
武岡英隆
STOPJELLYSTOPJELLYStudies on Prediction and Control of Jellyfish Studies on Prediction and Control of Jellyfish Outbreaks Outbreaks (ES responses to anthropo. F)

愛媛大学
武岡英隆

撮影:京都大学
益田玲爾

山陰沿岸の定置網(中国新聞社提供)
大型クラゲの大発生

撮影:読売新聞
板山康成

Historical record of giant jelly outburst
1920 1958 1995
052002
0319501900 06
07
09

Anthropogenic ecosystem change
SST in the Yellow Sea
(1.7oC/25年)
(Lin et al., 2005)
0
50
100
150
200
年間漁獲量(千トン)
1970 1975 1980 1985 1990 1995 2000 2005
Landing of the Korea (west coat)
(Wang, 2006)
リン
HABs in Yangtze estuary
Nutrient in Yangtze estuary(Wang,2006)
ケイ酸
窒素

Integrated Global Marine Plankton Database Project
• Proposal of Grant‐in –Aid for Scientific Research (KAKENHI) of the Ministry of Education, Culture, Sports,
Science and Technology (MEXT), 2011‐2014• Organizations:
– Meteorological Research Institute (MRI; leader),– National Institute of Polar Research (NiPR),– Marine Information Research Center (MIRC),– Sir Alister
Hardy Foundation for Ocean Science (SAHFOS),
– JAMSTEC, and cooperation with Fisheries Research Agency

Integrated Global Marine Plankton Database Project
Source Wet weight Phytoplankton Zooplankton Protists, etc.
JMA 7,000 400,000 200,000
WOD05/09 (NOAA) 21,000 162,000 308,000 7,500
COPEPOD (NOAA) 157,000 47,000
Hokkaido Univ. 6,000
FRA 46,000 32,000
SAHFOS 2,543,000
Total 231,000 562,000 3,136,000 7,500
Need to digitize from papers

Integrated Global Marine Plankton Database Project
• Contributions:– To use biogeochemical, marine biological,
fisheries studies;
– To clarify long term and basin scale ecosystem processes and responses by global warming and
climate change;
– Open through the Internet on JODC and IOC/IODE system (online) and optical media (offline)


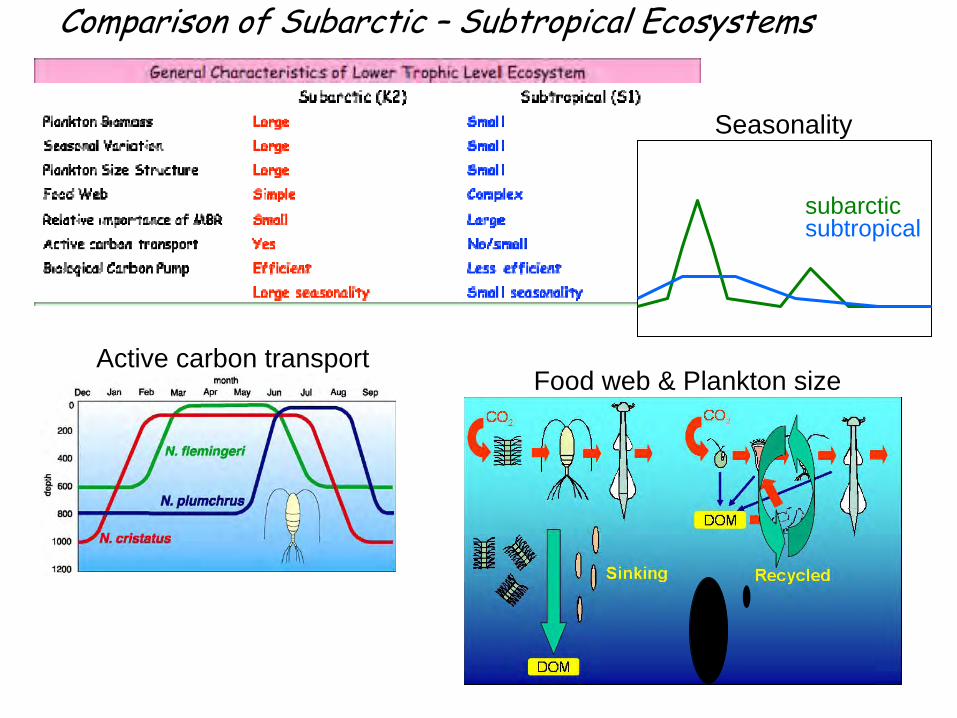
Food web & Plankton sizeActive carbon transport
Seasonality
subarcticsubtropical
Comparison of Subarctic – Subtropical Ecosystems

6: Time series observation in the western North Pacific

Summary
of
changes
in
biological
production
in
the
North
Pacific
(right)
and
phenological
changes
in
the
western North Pacific (left) observed after the 1976/77 regime shift. Chiba (2004)
The 11th Japan-U.S. Workshop on Global Change, Nov 2005Site Selection: Geographical Characteristics
Change in Asian Monsoon
Change in Air‐Sea Interactions
Change in Shallow water circulation, and water column stratification
Change in Ecosystem Structure
Change in BGC
Time series observation at two sites

Wind vector, PARTemp, Humidity
Gas exchange rateConcentration difference
Vertical transport of DMEddy diffusivity
Particle dynamics
Vertical transport of PMRain RatioSinking speed
Decomposition Bacteria, Archea
DOM
Paleo
Proxies in sediments
Plankton population Suspended Particles
Diurnal and ontogenic
migration
Air‐sea fluxes of CO2 etc.
Macro, micro nutrients
Oxygen, carbonate system,
Vertical fluxTransformation and decompositionof particles
Abundance of Bacteria and Archea*Growth, metabolism*
Transformation of particles in very surface sediment
Production and transformation of fecal pellets*
Zooplankton metabolism*
Shipboard measurements for time series observation
Focal point of shipboard Experiments, and measurements:characterize the sinkingparticles
Change in wind stress
Change in Ecosystem Structure and Function
Change in stratification
Change in Sinking particles
Change in PaleoProxies
Change in water circulation
Comparison of 2 stations with Strong Air‐Sea Interaction
C, N Isotopes as Indices of Biology
* In collaboration with external labs, esp. on biology

Gross Primary Production
(GPP)
Air‐Sea Gas Exchange
Eddy diffusion
Algal Respiration
Net Primary Production
(NPP)
Heterotrophic Respiration
Net Community Production
(NCP)
CO2POCDOC
Phyto‐POCPhyto‐DOC
Export Flux
NO3
NO3
CO2*HCO3‐
CO32‐
Phyto‐PON
NH3
New Production
(NP)
RegeneratedProduction
(RP)
CO2
DIC
DIC
New Production
(NP)
Respiration
Nitrification
Sinking・Eddy diffusion
PONDON
CO2 CO2
POCDOC
PONDON
Time series observation by moored instruments
17O meas.
Satellites +validation by FRRF
Gas Tension Device
Buoy Profilings
Sediment traps

Combination with pCO2
monitoring
instantaneous gross photosynthesis
17O anomaly averaged gross photosynthesis
(photosynthesis‐respiration)net community production calcification
Oxygen pCO2Nitrogen, Argon
gas exchangeadvection/diffusionphotosynthesis/
respiration
gas exchageadvection/diffusion
photosynthesis/respiratoncalcification
gas exchangeadvection/diffusion
GTD+CTD pCO2
‐monitor
averaged gas exchange coefficient
Profiler‐FRRF
Time Series Sampler
community respiration
TSO2
Chl profilesadvection/diffusion
natural populationsrelevant time scaledetect events

Toward better projection:Contribution by Environmental Biogeochemical Cycle Research Program
Ocean
Biogeochemical Cycle RT
Atmospheric Geochemical Cycle RT
Atmospheric Composition RT
Terrestrial Ecosystem RTMarine Ecosystem RT
Paleoceanography
RT
Ocean Climate Change Research ProgramEnvironmental
Biogeochemical Cycle Research Program
Strategic Ocean Monitoring Research TeamOcean Circulation Research TeamOcean‐Atmosphere Interaction Research TeamOcean Data Assimilation Research Team
Ocean 4D Reanalysis Dataset
Atmosphere4D Reanalysis Dataset
Global Change Projection Research Program
Knowledge on BGC Processes
Reanalyzed Data
Ecosystem Dynamics
GHG Dynamics

HARADA Team
Lan
Chiba
HONDA Team
Sasaoka
Ishida
Hashioka
Noguchi
Sasai
Wada
Kishi
Yamanak
Advisorymembers
The BOSS
Marine Ecosystem Research Team
Paleoceanography
RT
Marine Biogeochemical Cycle RT
Oceans Group in EBCRP

水産-適応技術 我が国周辺海域における低次生態系モニタリングと影響評価
調査船により定期的な調査を行い、豊かな漁業生産を支える我が国周辺海域の水温や塩分濃度、海洋中
の栄養塩、植物プランクトンや動物プランクトンの変化を調べ、温暖化の海への影響を明らかにします。
温暖化の影響評価
東シナ海CK ライン
長江・甑島観測線
A ライン:厚岸沖観測線
黒潮
対馬暖流
親潮
O ライン御前崎沖観測線
海洋環境:観測ラインに沿って観測点を
配置して水温・塩分・酸素・
栄養塩の鉛直分布を計測し、
表層混合層の発達の程度や水
塊の特性の変化を調べる。
植物プランクトン:下層からの栄養塩と光を用い
て光合成を行い、海の生産を
支えます。この種類や量を調
べる。
動物プランクトン:魚の餌として重要です。その
種類と量をネット採集サンプ
ルの分析により調べる。
栄養分(窒素・リン・ケイ素)
光
餌 >> 動物プランク
トン
植物プランクト
ン
水温・塩分クロロフィ
ル測定・採水
プランク
トン採集
低次生態系調査
光合成
東北・北海道沖 (親潮域)サンマ・マイワシなどの回遊魚の
摂餌・成育に重要な海域。道東厚岸沖のAラインでの観測を
継続実施(1987年~)する。
日本南岸 (黒潮域)小型浮魚類の産卵場・仔魚の成育
域で、仔魚期の生残に影響する。御前崎沖のOラインでの観測を継
続実施(1999年~)する。
東シナ海 (対馬暖流の源流域マアジ・マサバなどの浮魚類の主
要な産卵域・仔魚の成育域として
重要な海域。甑島沖のCKラインでの観測を継
続実施(2002年~)する。
3海域のモニタリング
低次生態系調査
低次生態系モニタリング
低次生態系の変化の把握
○観測データの蓄積により、温暖化の進行にともない日本周辺海域
の低次生態系に起こっている変化を把握することが期待される。
・長期の海洋調査データにより、親潮混合域のリン酸塩濃度とサンマやスケソ
ウダラの重要な餌である動物プランクトンのネオカラヌスの量は有意な減少ト
レンドを示すことが明らかにされている。その要因として、温暖化に関係した
成層化によって栄養塩の供給量が減少し、植物プランクトン生産が低下し、ネ
オカラヌスの生産に影響した可能性が検討されている。
ネオカラヌス
餌料環境の変動機構の解明
○長期にわたる高精度・多項目モニタリングデータを活用すること
により、日本周辺の魚の餌環境の変動機構の解明が期待される。
モニタリング調査の継続実施に
より、高精度野海洋環境データ、
動物プランクトン・植物プラン
クトンの量と種組成に関する長
期データベースがさらに延長さ
れる。
黒潮海域のクロロフィル量
(植物プランクトン)の長
期変化
餌料動物プランクトンと栄
養塩の長期変化の解析例

1
2
3
4
水産-適応技術 沖合域を回遊する漁業資源への影響評価と適応技術の開発
サンマやマイワシなどの多獲性浮魚類、日本系サケ、日本海のスルメイカやブリ等の主要な漁業資源へ
の温暖化の影響を生態系モデルにより予測し、分布や資源量の変化に対応するための漁業の適応策を検
討します。
日本海漁業資源生態系モデルによる多漁性浮魚予測
夏
冬
秋オホーツク海
冬アラスカ湾
ベーリング海
母川回帰
日本のシロザケの回遊ルート
1 年目
1 年目
2 年目以降
2 年目以降
どこで?どのように?影響を受け
る?
○海洋環境の影響を考慮した回帰予測モ
デル、生態系モデルを開発して温暖化の
影響予測を行います。
日本系サケ
・温暖化は、水温上昇、塩
分や酸素量の増減などの海
の物理、化学的変化だけで
なく、餌となる動物プラン
クトンの増減を通して魚に
影響します。・定量的な生態系予測、サ
ンマなどの多獲性浮魚の成
長回遊の予測のため、海洋
の餌環境を再現する低次生
態系モデルの開発を進めま
す。
・日本海水産資源の被食・捕食関係を
基にした高次生態系モデルを開発し、
温暖化の進行による魚種の構成の変化
の予測に取組みます。
・日本系サケは北日本の重要な漁業資源
ですが、温暖化の影響で資源が減少する
可能性が指摘されています。・回遊の途上での海洋環境の影響を明ら
かにするため、サケの回帰とサケの回遊
する北太平洋の亜寒帯域における海洋環
境との関係を精査します。
○温暖化に伴う春季水温の早期上昇への
対応のため、早期に安定的にサケ種苗
を作る技術の開発に取組みます。
サケへの影響予測
ふ化放流の適応技術の開発
日本海の海洋環境予測
高次生態系予測
低次生態系モデル
浮魚成長・回遊
低次生態系モデルeNEMUROの構
成を示すダイヤグラム
○日本海で利用でき
る魚の温暖化によ
る変化に対応する
漁業形態を検討し
ます。
・日本海の低次生態系
モデルを開発して、餌
料環境の予測を行いま
す。・海洋環境と餌の予測
を基にブリ・スルメイ
カ等の資源の分布回遊
への影響を予測します。
温暖化予測実験
海洋物理モデルC‐HOPEと低次生
態系モデルe‐NEMUROの結合
○日本周辺高解像度物理-
低次生態系モデルによる温
暖化実験を行い餌料環境の
変化を予測します。○サンマ成長-回遊モデル
と低次生態系モデルを結合
した温暖化実験を行い、サ
ンマの成長と回遊の変化を
予測します。
・サンマ仔稚魚の分布の水
温への依存性や成長特性と
環境要因の関係を調べ、サ
ンマ成長-回遊モデルの精
度向上を図ります。
サンマ回遊の計算例

生残
動物プランクトン 仔魚
良 悪マッチ ミスマッチ
ワカサギ・イサザ温暖化進行
水産-適応技術 沿岸域及び内水面における漁業生産への影響評価と適応技術の開発
磯根資源が利用する沿岸の藻場、沿岸域に展開される養殖場、湖沼の漁業資源など温暖化の影響が顕著
に表れる浅い水域における漁業生産を安定させるための適応技術を開発します。
湖沼漁業生産藻場生態系への影響評価と対策 増養殖業対策
・コンブ類などの大型藻類の培養実験
を行い、生長と成熟の温度条件を明ら
かにします。水温の温暖化予測と組み
合わせ、将来の大型藻類の分布、藻類
の葉上の微細藻類の変化の予測を行い
ます。
藻場の変化の予測
藻場生態系の変動機構解明
6月 20℃
- 100
102030405060
0 50 100 150 200
モデル実測
藻食魚のパラメータ
温暖化予測のためのパラメータ取
得
光合成の温度依存性
藻場の分布と生産力の将来予測、磯根生物の藻場の利用形態
○藻場生産力を維持するための方策○広がりつつある亜熱帯性藻場の活用法○磯根資源の生産を維持するための
餌場・隠れ家としての藻場の保全
策
○高温に強い魚を作るための飼料を開発○高温に強い魚の選抜効果を確認
食欲抑制の仕組解明
餌の消化・吸収
成長
高温で成長できる個体
の選別効果の把握
高水温で吸収されやすい餌抗ストレス耐性を持たせる餌の開
発
餌
餌
餌
高水温
高温ストレス低減方
法開発
食欲関連ホルモン
養殖場所の高温化の影響把握
温暖化は沿岸域の養殖場の高温化をも
たらし、その悪影響を克服する適応技
術の開発が重要な課題です。
高温環境では ・餌を食べない・餌が吸収されにくい・高温ストレスがある・呼吸量が増加・成長しない
マツカワ・ブリ・ニジマスなどの養殖対象魚を
対象に、成長を支える摂食、消化、利用の基礎
的特性、高温ストレスの生理学的特性を調べ、
高温環境との関連を実験により明らかにします。
養殖漁の温暖化適応技術開発
湖沼環境への温暖化影響予測・温暖化の進行は、湖沼の水温などの
物理環境に多大な影響を与えると考え
られ、その予測は漁業生産の対策に重
要です。・気象データや湖沼の環境条件を用い
た水温予測式を作成し、湖沼水温の温
暖化予測を行います。
湖沼の水温変化予測仔魚・餌動物プランクトンへの影響評価
○ミスマッチを解消する放流技術の開発○親魚の産卵時期の変化を解消するため
の産卵場造成管理技術の開発
仔魚と餌料環境への影
響・諏訪湖のワカサギ・琵琶湖のイサザ
を対象に仔魚期の生残と餌料環境への
水温上昇の影響を評価します。・温暖化の進行にともなう仔魚の発生
と餌の動物プランクトンの発生時期の
ずれ(ミスマッチ)を評価します。
藻場の温暖化適応技術開発
コンブ
場
微細藻類
培養装置
・変化しつつある西日
本藻場について、温暖
化の影響を取り入れた
生産力モデルを開発し、
生産力の変化を予測し
ます。
・イセエビやアワビなどの
磯根生物の藻場の利用の実
態を調査し、持続的な磯根
資源の生産の維持のため必
要な藻場の条件を明らかに
します。
藻場保全例
湖沼漁業資源の安定生産技術の開発イサザ ワカサギ

Mooring observation combined with satellites observations
to complement shipboard observations
Time series satellite data validated by mooring obs.


Primary
Productivity
Profiler
Sediment Traps
Surface Flux Buoy
Time SeriesWater Sampler
Underwaterwinch
ADCP
pCO2 sensor
Satellite Observation
Sediment Traps
Sediment Traps
Floats
Gliders
Time SeriesWater Sampler
Instrumental ocean obs
to complement satellites obs


