Tokyo Big Sight (Tokyo International Exhibition Center) East Halls 1, 2, 3, 5, 6 VENUE DATE Sept. 13 – 16 10:00 – 17:00 Tokyo Big Sight SHOW RERORT The Japan Society of Industrial Machinery Manufacturers (JSIM) Japan Industrial Vehicles Association (JIVA) Japan Pallet Association (JPA) Japan Material Handling Association (JMHA) The Japan Institute of Material Handling (JIMH) Japan Institute of Logistics Systems (JILS) Japan Management Association (JMA) Sponsors http://www.logis-tech-tokyo.com/
Transcript
Tokyo Big Sight (Tokyo International Exhibition Center)
East Halls 1, 2, 3, 5, 6
V E N U E
D A T E
Sept. 13 – 1610:00 – 17:00
Tokyo Big Sight
SHOW RERORT
The Japan Society of Industrial Machinery Manufacturers (JSIM)
Japan Industrial Vehicles Association (JIVA)
Japan Pallet Association (JPA)
Japan Material Handling Association (JMHA)
The Japan Institute of Material Handling (JIMH)
Japan Institute of Logistics Systems (JILS)
Japan Management Association (JMA)
The Secretariat of LOGIS-TECH TOKYO
Inquiries
Japan Institute of Logistics Systems (JILS)3F Suzuebaydium, 1-15-1 Kaigan, Minato-ku, Tokyo 105-0022Tel: +81-3-3436-3191 Fax: +81-3-3436-3190E-mail: [email protected]
Japan Management Association (JMA)14F Sumitomo Corporation Takebashi Bldg., 1-2-2 Hitotsubashi, Chiyoda-ku, Tokyo 100-0003Tel: +81-3-3434-1988 Fax: +81-3-3434-8076E-mail: [email protected]
Japan’s Largest Exhibition for Material Handling & Logistics
http://www.logis-tech-tokyo.com/
2018
3
1 2
Overview
Theme
Date & Time
Venue
Related Events
Exhibitions Held During the Same Period
Admission Fee
Organizers
Business Innovation in Logistics – Find Your Best Solution Here in Tokyo –
September 13th – 16th, 2016 10:00 – 17:00
Tokyo Big Sight (Tokyo International Exhibition Center) East Halls 1, 2, 3, 5, 6
The Japan Society of Industrial Machinery Manufacturers (JSIM) The Japan Institute of Material Handling (JIMH)Japan Industrial Vehicles Association (JIVA) Japan Institute of Logistics Systems (JILS)Japan Pallet Association (JPA) Japan Management Association (JMA)Japan Material Handling Association (JMHA)
●Opening reception Date: September 13th, 2016 17:30-19:00 Venue: Reception Hall, Tokyo Big Sight
●Display corners Solution for location strategy, Environment-friendly Packaging Systems
●Logistics conference Date: September 13th – 16th, 2016 Venue: Reception Hall, Conference Tower, Tokyo Big Sight
●Business networking for overseas visitors Date: September 14th, 2016 Conference Tower, Tokyo Big Sight
●Presentation seminars
●Technical visits Date: September 15th, 2016
18th AUTOID & COMMUNICATION EXPO (September 14th – 16th, 2016)
¥1,000 (with tax) *Free for visitors with invitation or who have pre-registered online.
2
Overseas Exhibitors
Registered VIPs
Changes in Exhibition Scale, Number of Registered Visitors & Number of Entries
U.S.A., India, Netherlands, Korea, Thailand, China, Germany / Taiwan, Hong Kong
Date WeatherNumber of Registered Visitors
* Number of re-registered visitors from AUTOID & COMMUNICTION EXPO 2016
Number of Entries
Tuesday 13 September
Rainy / Cloudy 11,414 (9,165) 24,022 (20,990)
Wednesday 14 September Cloudy 15,963 (13,334) 37,662 (33,523)
Thursday 15 September Cloudy 17,412 (15,038) 42,532 (36,607)
Friday 16 September Cloudy 19,282 (17,149) 48,437 (41,383)
Total 64,071 (54,686)*Including 3,115 (3,815)
152,653 (132,503)
Number of Registered Visitors: Number of people who registered as visitors to the exhibition (One registration during the exhibition is counted as one visitor)
Number of Entries: Total number of people who entered the exhibition venue (counted by staff at each entrance using a counting system)(The number includes registered visitors, registered visitors to other events that allow mutual entry, members of the press, exhibition planning committee members, seminar lecturers, representatives of sponsors, etc.)
2,964 (3,484)
1,108 (1,175)
Total: 22 countries / 2 regions (28 countries / 2 regions)
U.S.A., U.K., Italy, India, Indonesia, Australia, Netherlands, Canada, Korea, Singapore, Sweden, Thailand, Chile, China, Germany, Bangladesh, Philippines, Finland, France, Belgium, Malaysia, Russia / Taiwan, Hong Kong
0
500
1000
1500
2000
2500
Number of Exhibitors
Num
ber of Booths
2012(10th Logis-Tech Tokyo)
2016(12th Logis-Tech Tokyo)
2014(11th Logis-Tech Tokyo)
152,653
4602,078
Number of Entries
0
100
200
300
400
500 129,192
411 418
1,594
52,467 54,68664,071
1,701
132,503
Number of Registered Visitors
*( ): Logis-Tech Tokyo 2014
Overview
3 4
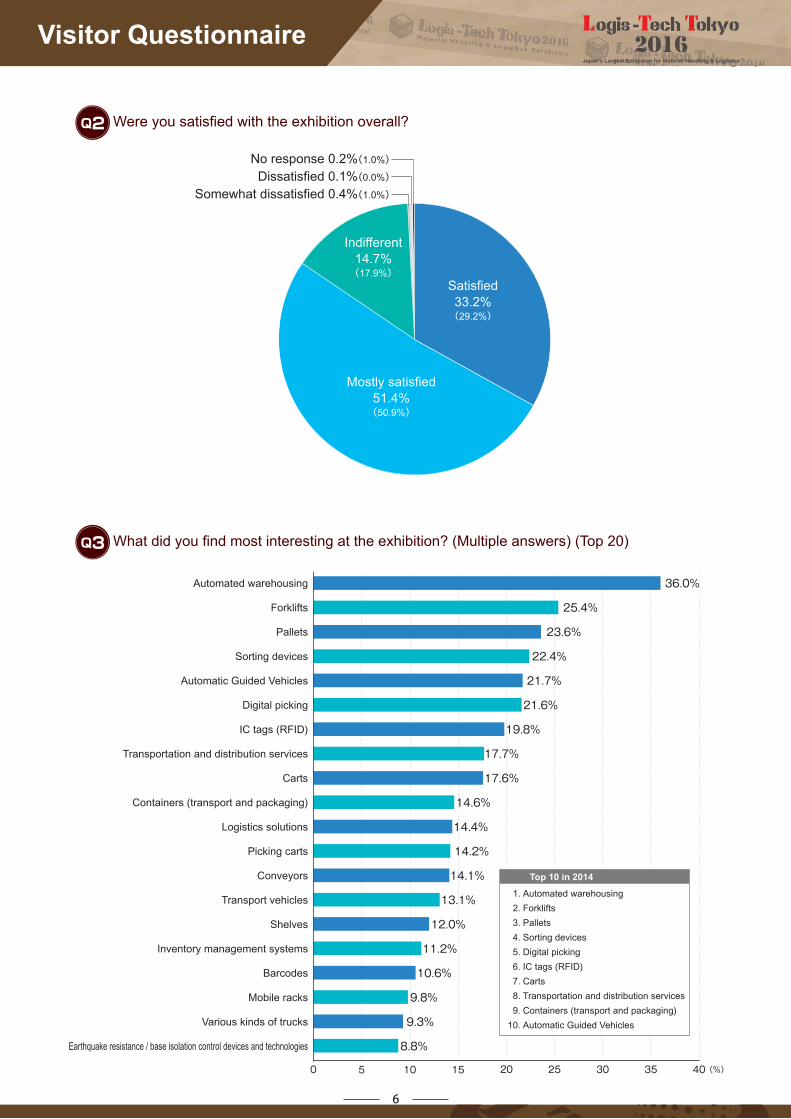
Visitor Analysis
Visitors By Industry
Visitors By Position
*( ): Logis-Tech Tokyo 2014
Food 3.3%(3.6%)
Pulp / Paper 1.3%(1.6%)
Chemicals 3.3%(3.4%)
Pharmaceuticals 0.6%(0.7%)
Apparel 0.4%(0.6%)
Steel 1.0%(1.2%)
Non-ferrous metals 1.0%(1.0%)
Electrical appliances5.8%(5.1%)
Material handling equipment4.3%(4.5%)
Wholesale / Trading13.6%(13.4%)
Other logistics 3.0%(3.1%)
No response 0.2%Other non-manufacturing industry 2.7%(2.7%)
Government / Local government / Public corporation 0.8%(0.8%)Organization / Research institute 0.5%(0.5%)
Tokyo Big Sight (Tokyo International Exhibition Center)
East Halls 1, 2, 3, 5, 6
V E N U E
D A T E
Sept. 13 – 1610:00 – 17:00
Tokyo Big Sight
SHOW RERORT
The Japan Society of Industrial Machinery Manufacturers (JSIM)
Japan Industrial Vehicles Association (JIVA)
Japan Pallet Association (JPA)
Japan Material Handling Association (JMHA)
The Japan Institute of Material Handling (JIMH)
Japan Institute of Logistics Systems (JILS)
Japan Management Association (JMA)
The Secretariat of LOGIS-TECH TOKYO
Inquiries
Japan Institute of Logistics Systems (JILS)3F Suzuebaydium, 1-15-1 Kaigan, Minato-ku, Tokyo 105-0022Tel: +81-3-3436-3191 Fax: +81-3-3436-3190E-mail: [email protected]
Japan Management Association (JMA)14F Sumitomo Corporation Takebashi Bldg., 1-2-2 Hitotsubashi, Chiyoda-ku, Tokyo 100-0003Tel: +81-3-3434-1988 Fax: +81-3-3434-8076E-mail: [email protected]


![Near Misses Specialty Gases: Handling precautions and what you need to know [Adapted from Hiyari Hatto (Near Misses) Japan Industrial & Medical Gases Association]](https://static.documents.pub/doc/80x56/551a34ad5503463e778b4a8e/near-misses-specialty-gases-handling-precautions-and-what-you-need-to-know-adapted-from-hiyari-hatto-near-misses-japan-industrial-medical-gases-association.jpg)


