Japan’s Long-term Energy Outlook to 2050: Estimation for the Potential of Massive CO 2 Mitigation Ryoichi Komiyama The Institute of Energy Economics, Japan (IEEJ) 1. Introduction Present international situation involving energy security and climate change issues has dramatically changed, as indicated by increasing energy demand mainly in China and India, growing resources nationalism in Middle East nations, Russia and other energy-producing countries, and international negotiations towards a post-Kyoto Protocol framework. Under the situation, Japan is required to develop a long-term energy strategy well-organized in regard to energy demand and supply towards energy security and the resolution of climate change issue. Particularly, the development of an energy and environmental technology perspective may be important for addressing energy and environmental problems. By promoting the research, development and deployment of innovative technologies, Japan could realize energy efficiency improvements and CO 2 emission reductions. The nation may also achieve its sustainable economic development including the improvement of Japanese industries’ international competitiveness through exports of innovative energy technologies. This report provides Japan’s energy demand and supply outlook to 2050 and consistently analyzes the potentials of technology to reducing its energy demand and CO 2 emissions, considering energy and environmental technologies that could diffuse through future research and development progress. 2. Scenario Analysis Framework Energy forecasts change greatly depending on background factors including the domestic and foreign economic situations, the international energy situation and technology developments. As preconditions of these factors are likely to change greatly, multiple scenarios should be developed in forecasting energy demand and supply over a long time span until 2050. This analysis focuses on Reference Scenario envisaging standard energy and environmental technology developments and on Technology Advance Scenarios which assumes the further penetration of innovative technologies as shown in Table 2-1. - Reference Scenario This scenario is a trend based on the present economic and social situations, and the current technology system as preconditions. - Technology Advance Scenario In Technology Advance Scenario, energy and environmental technologies under research and development or in the initial introduction stage are expected to be introduced more dramatically than assumed for the Reference Scenario. - Technology Advance Scenario (Nine New Nuclear Plants)
Transcript
Japan’s Long-term Energy Outlook to 2050: Estimation for the Potential of Massive
CO2 Mitigation
Ryoichi Komiyama
The Institute of Energy Economics, Japan (IEEJ)
1. Introduction
Present international situation involving energy security and climate change issues has
dramatically changed, as indicated by increasing energy demand mainly in China and India,
growing resources nationalism in Middle East nations, Russia and other energy-producing countries,
and international negotiations towards a post-Kyoto Protocol framework. Under the situation, Japan
is required to develop a long-term energy strategy well-organized in regard to energy demand and
supply towards energy security and the resolution of climate change issue. Particularly, the
development of an energy and environmental technology perspective may be important for
addressing energy and environmental problems. By promoting the research, development and
deployment of innovative technologies, Japan could realize energy efficiency improvements and
CO2 emission reductions. The nation may also achieve its sustainable economic development
including the improvement of Japanese industries’ international competitiveness through exports of
innovative energy technologies. This report provides Japan’s energy demand and supply outlook to
2050 and consistently analyzes the potentials of technology to reducing its energy demand and CO2
emissions, considering energy and environmental technologies that could diffuse through future
research and development progress.
2. Scenario Analysis Framework
Energy forecasts change greatly depending on background factors including the domestic
and foreign economic situations, the international energy situation and technology developments.
As preconditions of these factors are likely to change greatly, multiple scenarios should be
developed in forecasting energy demand and supply over a long time span until 2050. This analysis
focuses on Reference Scenario envisaging standard energy and environmental technology
developments and on Technology Advance Scenarios which assumes the further penetration of
innovative technologies as shown in Table 2-1.
- Reference Scenario
This scenario is a trend based on the present economic and social situations, and the current
technology system as preconditions.
- Technology Advance Scenario
In Technology Advance Scenario, energy and environmental technologies under research
and development or in the initial introduction stage are expected to be introduced more dramatically
than assumed for the Reference Scenario.
- Technology Advance Scenario (Nine New Nuclear Plants)
In the Reference Scenario and the Technology Advance Scenario, 13 additional plant is
assumed to be constructed. If electric utilities’ electricity sales decline on further progress in energy
saving, however, the feasibility of additional nuclear power plant construction may grow more
uncertain. This scenario is based on the assumption that 9 of the 13 nuclear power plants planned
under official nuclear power supply program will be actually constructed between 2005 and 2050.
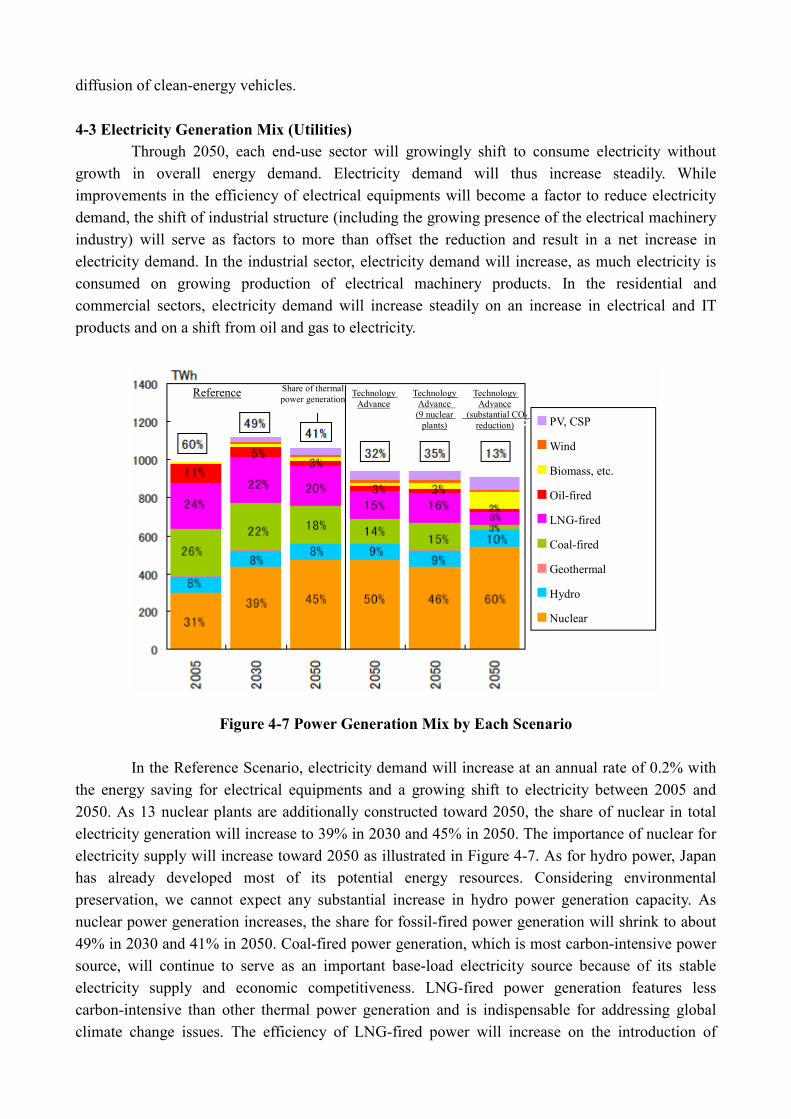
Table 2-1 Key Assumptions for Each Scenario
Reference Scenario Technology Advance Scenario
Technology Advance
Scenario (Substantial CO2
Reduction)
Energy efficient
appliances
The present pace of
introduction
Acceleration of the introduction pace,
including highly efficient lights (LED),
highly efficient heat pumps (heat pump
water heaters with the coefficient of
performance at 6.0 and air conditioner
heat pumps with the COP at 7.0),
geothermal heat pumps, and BEMS
The same as for the
Technology Advance
Scenario
Clean energy
vehicles
About 22 million
vehicles
(almost all are hybrid
vehicles) in 2050
About 45 million vehicles, including 25
million plug-in hybrids, 7 million electric
vehicles and 6 million fuel cell vehicles
The same as for the
Technology Advance
Scenario
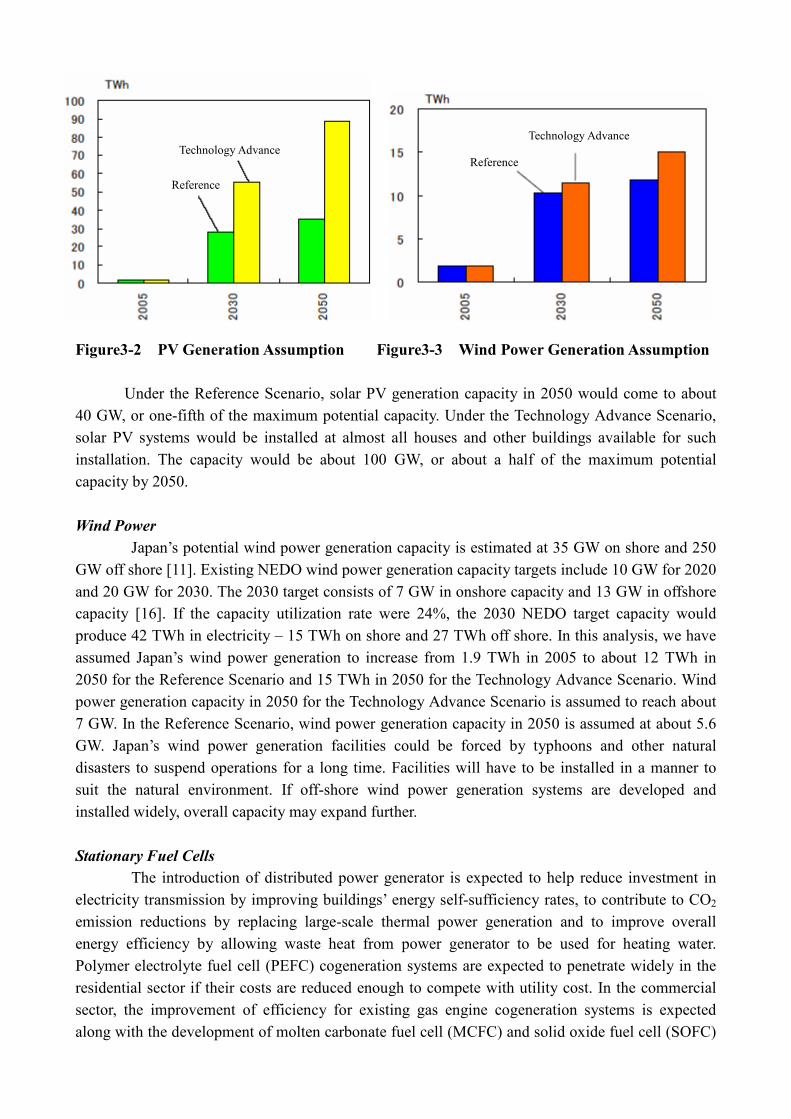
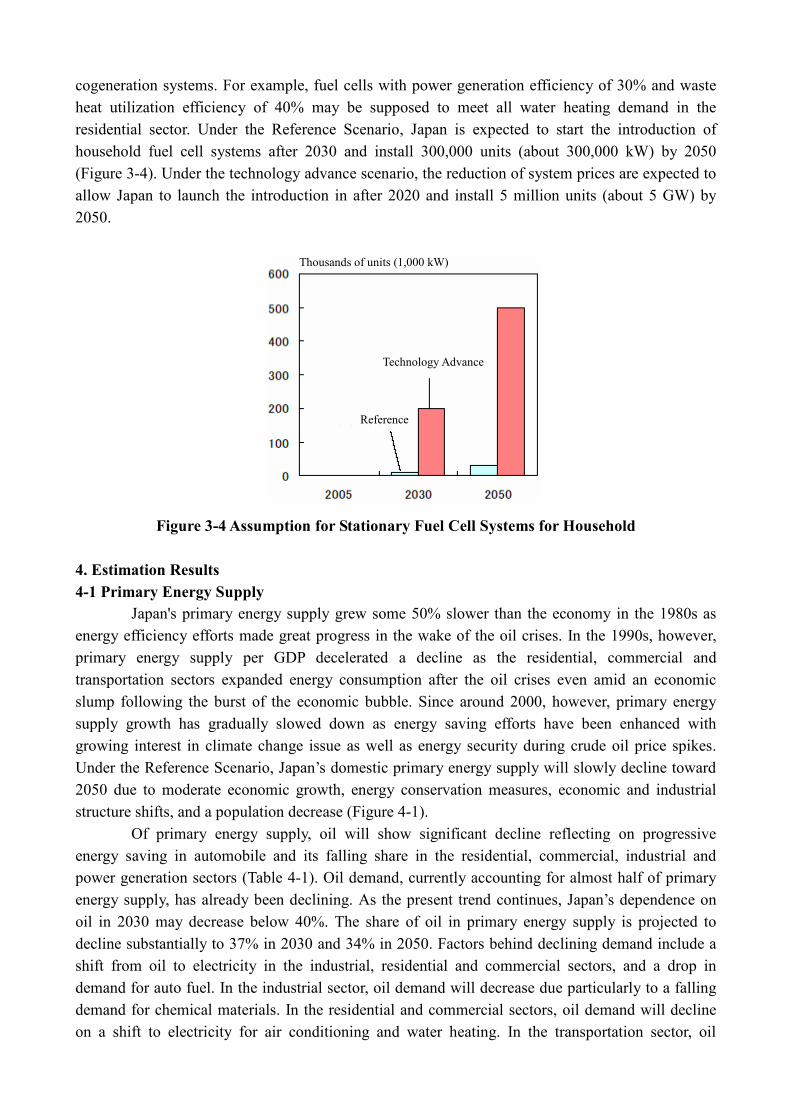
Renewables
In 2050:
Solar PV generation at
40 GW, wind power
generation at 5.6 GW
In 2050:
Solar PV generation at 100 GW,
wind power generation at 7 GW
A further expansion of
renewable energy power
generation is added to the
Technology Advance
Scenario assumptions.
Stationary fuel
cells 300,000 kW in 2030 5 GW in 2030
The same as for the
Technology Advance
Scenario
Fossil-fired
power
generation
The present pace of
power generation
efficiency improvement
Further improvement of coal and
LNG-fired power generation efficiency
(ultra-supercritical pressure power
generation, and 1,700-degree-Celsius
coal-IGCC and LNG-GTCC
The same as for the
Technology Advance
Scenario
Nuclear
Construction of 13 new
plants between 2005
and 2050
The same as for the Reference Scenario
Construction of 21 new
plants between 2005 and
2050
Carbon capture
and storage
No consideration is
given to the CCS. No consideration is given to the CCS.
The CCS will be introduced
from 2030; 30% of CO2
emissions from coal and
LNG thermal power plants
is assumed to be captured. (Note) For the “Technology Advance Scenario (nine new nuclear plants)”, the number of nuclear plants for construction between 2005 and 2050 is nine, changed from 13 for the “Technology Advance Scenario”. Other assumptions of the “Technology Advance Scenario (nine new nuclear plants)” are the same as for the Technology Advance Scenario.
---- Technology Advance Scenario (Substantial CO2 Emission Reduction)
This scenario takes into account an additional expansion of nuclear power plant, and CCS
(carbon capture and storage) technology and some other technology developments in addition to
those for the “Technology Advance Scenario”. The maximum introduction of nuclear power
generation is assumed from the technological and economic viewpoints for electricity generation.
This means that nuclear energy is assumed to account for 60% of total electricity generation in 2050.
Nuclear power generation capacity in 2050 comes online to 77.5 GW, with the capacity utilization
rate planned at 80%. In order to achieve the capacity, Japan will have to construct about 21 new
nuclear plants – about eight in addition to the planned 13 under the national nuclear power
development program. This scenario also considers CCS systems. In this analysis, we have assumed
that the CCS system would be introduced for coal and LNG thermal power plants gradually from
2030. According to the Institute of Applied Energy [11], Japan’s underground CO2 storage capacity
for the CCS system totals 3.5 billion tons CO2 for stable isolation. If possible leaks are additionally
considered, the capacity expands to about 91.5 billion tons. As Japan’s annual CO2 emissions now
total 1.3 billion tons, the stable isolation capacity is equivalent to emissions over 2.7 years. The
capacity including possible leaks is equivalent to those over 70.4 years. In our analysis, isolated
CO2 storage capacity is assumed at the stable category of 3.5 billion tons. For 2050, the CCS
system is assumed to stably isolate about 30% of CO2 emissions from coal and LNG combustion
within Japan. Furthermore, renewable energy sources (excluding hydro and geothermal) are
assumed to expand their share of electric utilities’ power generation to 20%.
3. Key Assumptions
3-1 Economic Growth, etc.
Key assumptions including economic growth, population, crude oil prices, industrial
materials production and the floor area of buildings follow references [8] and [9]. Economic growth
is assumed at 1.3% per year between 2005 and 2050. Population is assumed to decline from about
127.77 million in 2005 to 95.15 million in 2050. The imported crude oil price assumption is based
on a U.S. Department of Energy estimate (a rise from about $53/bbl (the real price for
U.S.-imported crude oil in 2006) for 2005 to about $78/bbl for 2050) [10]. Technology assumptions,
including improvements in the efficiency of various technologies and timings for the introduction of
new technologies, are based on energy technology roadmap [11] [12] [13].
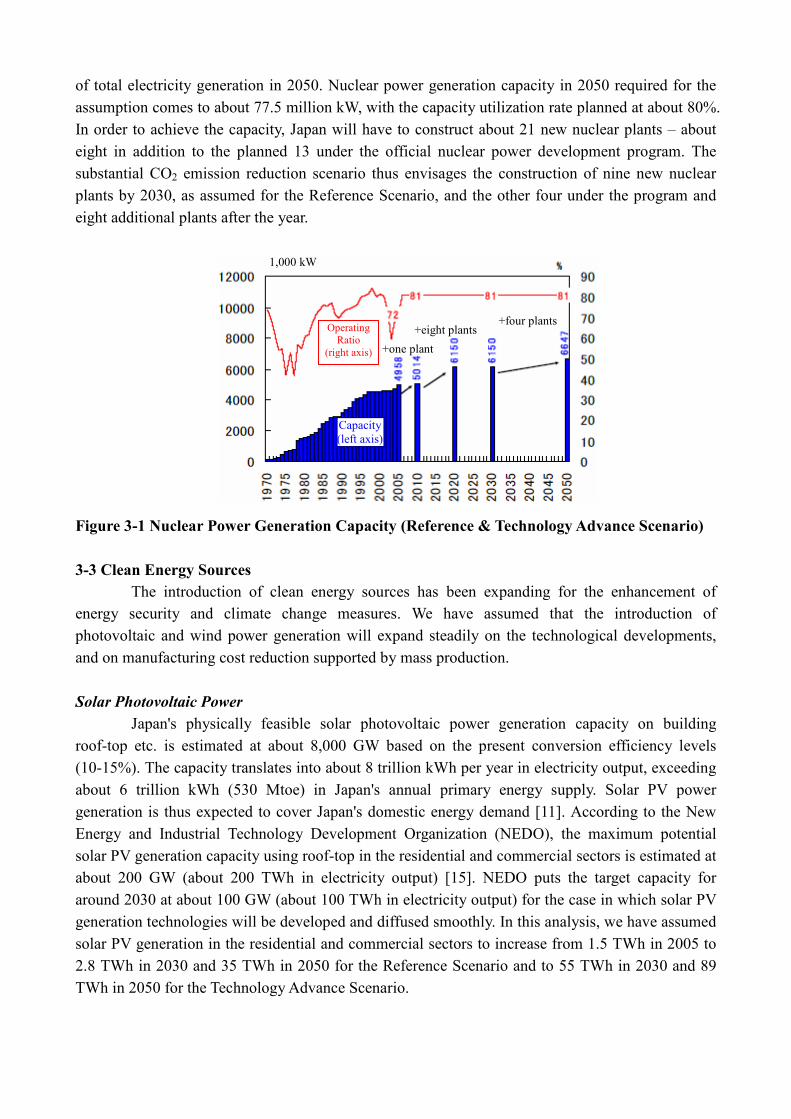
3-2 Nuclear Power Generation
Nuclear power generation outlook is based on the governmental electricity supply outlook
[14] and its long-term energy outlook [8]. According to a nuclear power station development plan in
FY 2008, the government will totally construct 13 nuclear power plants (with a total capacity of
17.23 million kW) for the future. Of the 13 nuclear plants, nine nuclear plants (with a total capacity
of about 12.26 million kW) will go on stream over the next decade. The governmental long-term
energy outlook projects nine nuclear plants to be built by 2030. The Reference and Technology
Advance Scenarios for our analysis follow the outlook, projecting the construction of nine plants by
2030 and the remaining four out of the planned 13 after 2030 as shown in Figure 3-1. The official
long-term energy outlook projects Japan Atomic Power Co.’s Tsuruga-1 nuclear plant (357,000 kW)
to suspend commercial operations in FY 2010. Our scenarios have taken this projection into account.
The other existing nuclear plants are projected to undergo adequate aging management measures to
avoid their suspension or termination. As a result, Japan’s nuclear power generation capacity is
estimated to increase from 49.58 million kW in 2005 to 66.47 million kW in 2050 for the Reference
and Technology Advance Scenarios. The capacity utilization rate is assumed to remain at about 80%
to 2050 for both scenarios, although the rate is expected to rise on changes to the legal framework
for regular checkups.
In the Technology Advance Scenario (substantial CO2 emission reduction), the maximum
introduction of nuclear power generation is assumed considering the technological and economic
viewpoints for electricity generation. This means that nuclear energy is assumed to account for 60%
of total electricity generation in 2050. Nuclear power generation capacity in 2050 required for the
assumption comes to about 77.5 million kW, with the capacity utilization rate planned at about 80%.
In order to achieve the capacity, Japan will have to construct about 21 new nuclear plants – about
eight in addition to the planned 13 under the official nuclear power development program. The
substantial CO2 emission reduction scenario thus envisages the construction of nine new nuclear
plants by 2030, as assumed for the Reference Scenario, and the other four under the program and
Total final demand 334 100 382 100 354 100 321 100 0.9 -0.3 -0.5 -0.4
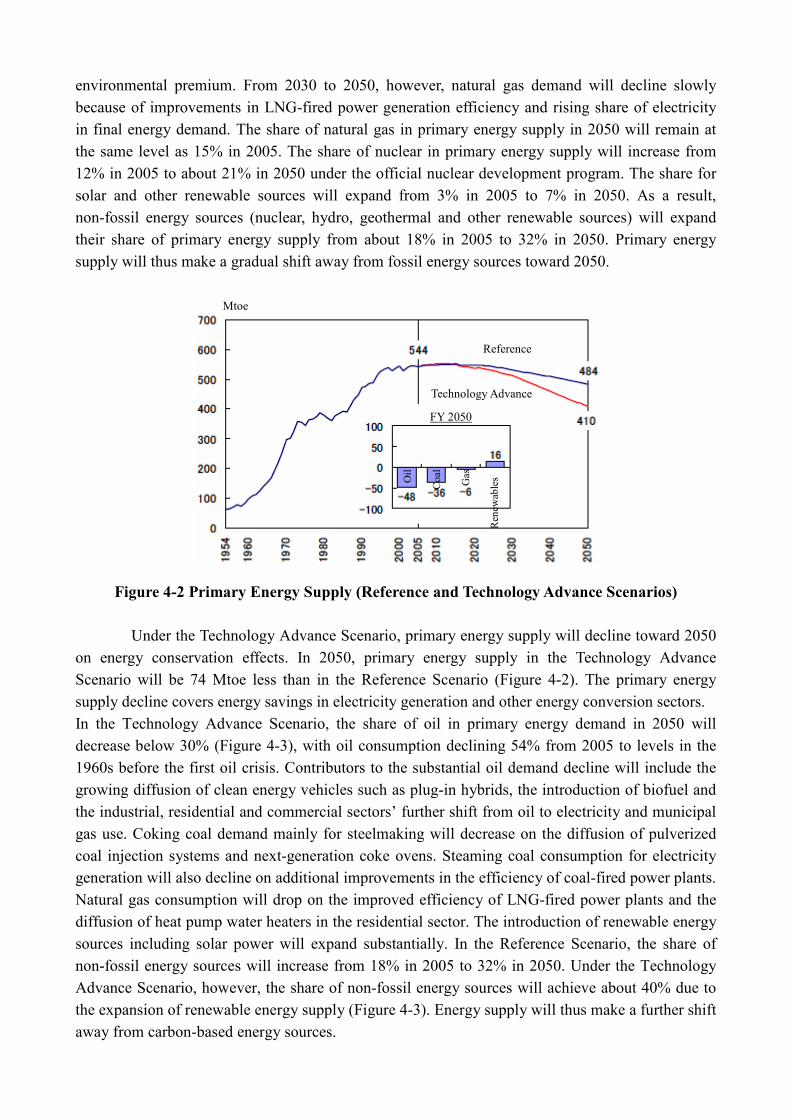
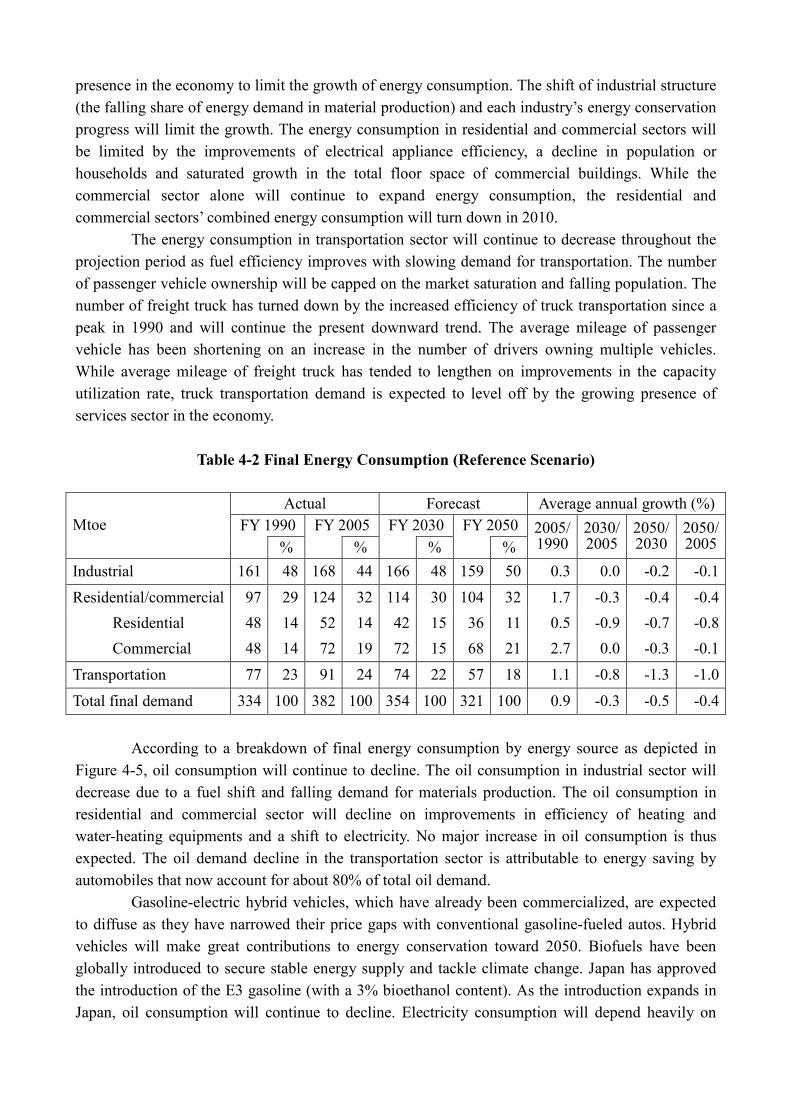
According to a breakdown of final energy consumption by energy source as depicted in
Figure 4-5, oil consumption will continue to decline. The oil consumption in industrial sector will
decrease due to a fuel shift and falling demand for materials production. The oil consumption in
residential and commercial sector will decline on improvements in efficiency of heating and
water-heating equipments and a shift to electricity. No major increase in oil consumption is thus
expected. The oil demand decline in the transportation sector is attributable to energy saving by
automobiles that now account for about 80% of total oil demand.
Gasoline-electric hybrid vehicles, which have already been commercialized, are expected
to diffuse as they have narrowed their price gaps with conventional gasoline-fueled autos. Hybrid
vehicles will make great contributions to energy conservation toward 2050. Biofuels have been
globally introduced to secure stable energy supply and tackle climate change. Japan has approved
the introduction of the E3 gasoline (with a 3% bioethanol content). As the introduction expands in
Japan, oil consumption will continue to decline. Electricity consumption will depend heavily on
developments in the residential and commercial sectors. These sectors will growingly shift to
electricity that is more convenient and safer as they increase their holdings of home appliances,
information technology equipments and other electrical machines and as new electrical equipments
diffuse. Given tougher energy efficiency standards, however, electricity consumption will slowly
grow toward 2050.
Figure 4-5 Final Energy Consumption by Energy Source (Reference Scenario)
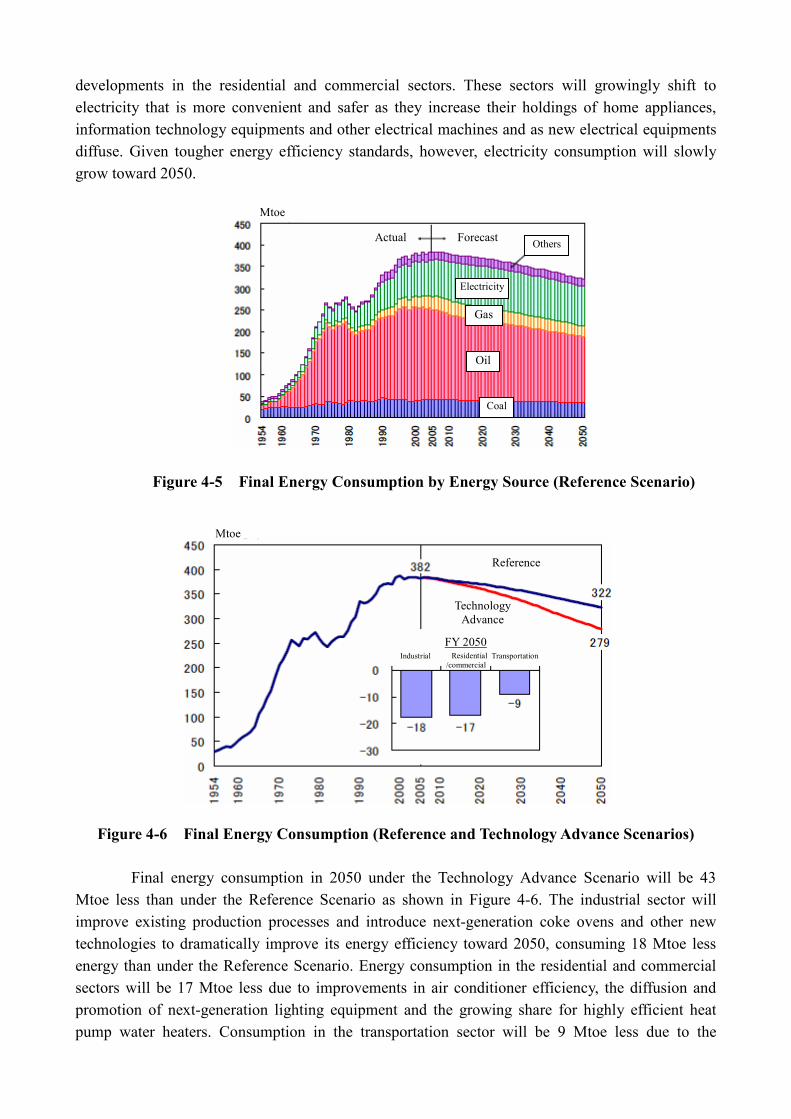
Figure 4-6 Final Energy Consumption (Reference and Technology Advance Scenarios)
Final energy consumption in 2050 under the Technology Advance Scenario will be 43
Mtoe less than under the Reference Scenario as shown in Figure 4-6. The industrial sector will
improve existing production processes and introduce next-generation coke ovens and other new
technologies to dramatically improve its energy efficiency toward 2050, consuming 18 Mtoe less
energy than under the Reference Scenario. Energy consumption in the residential and commercial
sectors will be 17 Mtoe less due to improvements in air conditioner efficiency, the diffusion and
promotion of next-generation lighting equipment and the growing share for highly efficient heat
pump water heaters. Consumption in the transportation sector will be 9 Mtoe less due to the
Mtoe
Actual Forecast Others
Electricity
Gas
Oil
Coal
Mtoe
Reference
Technology Advance
FY 2050 Industrial Residential
/commercial Transportation
diffusion of clean-energy vehicles.
4-3 Electricity Generation Mix (Utilities)
Through 2050, each end-use sector will growingly shift to consume electricity without
growth in overall energy demand. Electricity demand will thus increase steadily. While
improvements in the efficiency of electrical equipments will become a factor to reduce electricity
demand, the shift of industrial structure (including the growing presence of the electrical machinery
industry) will serve as factors to more than offset the reduction and result in a net increase in
electricity demand. In the industrial sector, electricity demand will increase, as much electricity is
consumed on growing production of electrical machinery products. In the residential and
commercial sectors, electricity demand will increase steadily on an increase in electrical and IT
products and on a shift from oil and gas to electricity.
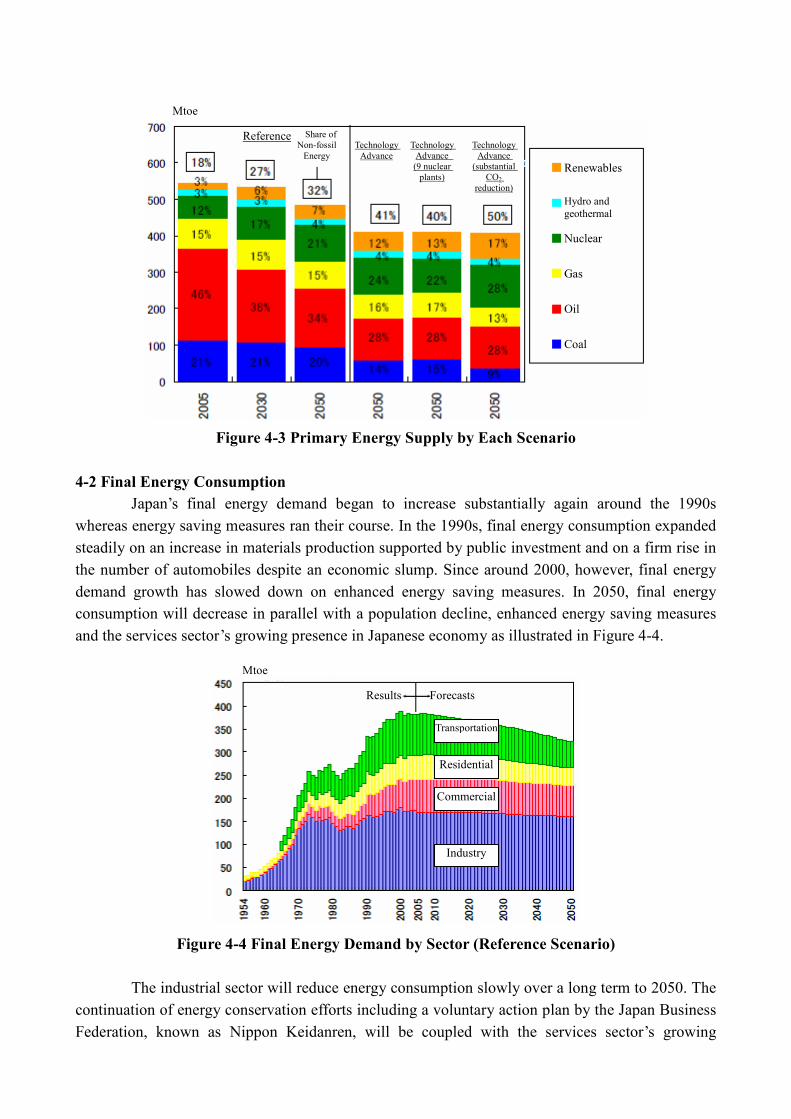
Figure 4-7 Power Generation Mix by Each Scenario
In the Reference Scenario, electricity demand will increase at an annual rate of 0.2% with
the energy saving for electrical equipments and a growing shift to electricity between 2005 and
2050. As 13 nuclear plants are additionally constructed toward 2050, the share of nuclear in total
electricity generation will increase to 39% in 2030 and 45% in 2050. The importance of nuclear for
electricity supply will increase toward 2050 as illustrated in Figure 4-7. As for hydro power, Japan
has already developed most of its potential energy resources. Considering environmental
preservation, we cannot expect any substantial increase in hydro power generation capacity. As
nuclear power generation increases, the share for fossil-fired power generation will shrink to about
49% in 2030 and 41% in 2050. Coal-fired power generation, which is most carbon-intensive power
source, will continue to serve as an important base-load electricity source because of its stable
electricity supply and economic competitiveness. LNG-fired power generation features less
carbon-intensive than other thermal power generation and is indispensable for addressing global
climate change issues. The efficiency of LNG-fired power will increase on the introduction of
Reference Technology
Advance
Technology Advance (9 nuclear
plants)
Technology Advance
(substantial CO2
reduction)
Share of thermal
power generation
PV, CSP
Wind
Biomass, etc.
Oil-fired
LNG-fired
Coal-fired
Geothermal
Hydro
Nuclear
1,500-degree-Celsius combined cycle plants. Oil-fired power generation will continue to serve as a
peak-load generator or back-up generator. But oil-fired power generation will gradually decline as
LNG-fired power generation alternatively plays a role as peak-load generator.
Under the Technology Advance Scenario, we have assumed the expansion of highly
efficient electric power generation and renewable energy sources. The share of nuclear in total
electricity generation will increase to 50% in 2050 as other electricity generation declines due to
energy conservation and growing share of solar PV generation systems. The conversion efficiency
of coal-fired power generation will increase to 50% in 2050 on the introduction of
ultra-supercritical pressure power generation, 1,700-degree-Celsius gas turbine IGCC (integrated
gasification combined cycle) and other highly efficient generation technologies. The efficiency of
LNG-fired power generation is projected to rise to 55% toward 2050 on the introduction of
1,700-degree-Celsius combined cycle generation systems. Electric utilities will expand renewable
technologies including large-scale solar PV and concentrated solar power generation. As a result,
the share of thermal power generation will decline to 32% by 2050. As the share of non-fossil
power generation in total electricity generation expands under the Technology Advance Scenario,
the shift away from fossil power generator will make a greater progress than under the Reference
Scenario. The Technology Advance Scenario (substantial CO2 emission reduction) envisages the
further promotion of nuclear energy and the expansion of renewable energy. Under the substantial
CO2 emission reduction scenario, the share of nuclear in total electricity generation in 2050 will
expand to 60%. Renewable energy generation will increase to about 20% of total electricity
generation, including solar PV, biomass and waste power generation technologies. As a result, the
share of thermal power generation will decline to 13%. Under this scenario, electricity generation
using non-fossil fuels will account for the mainstream.
4-4 CO2 Emissions
Since 1990, energy-related CO2 emissions have increased at almost the same pace as energy
supply. The fuel switching of energy supply from fossil energy sources has so far made little
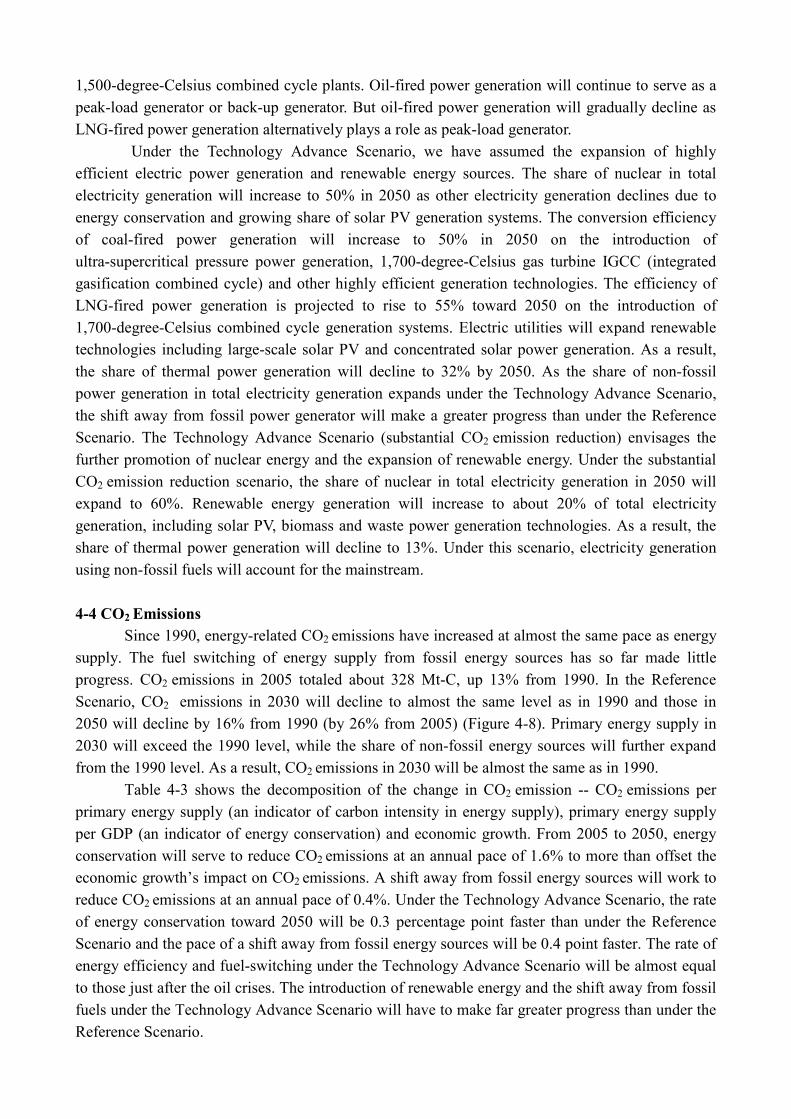
progress. CO2 emissions in 2005 totaled about 328 Mt-C, up 13% from 1990. In the Reference
Scenario, CO2 emissions in 2030 will decline to almost the same level as in 1990 and those in
2050 will decline by 16% from 1990 (by 26% from 2005) (Figure 4-8). Primary energy supply in
2030 will exceed the 1990 level, while the share of non-fossil energy sources will further expand
from the 1990 level. As a result, CO2 emissions in 2030 will be almost the same as in 1990.
Table 4-3 shows the decomposition of the change in CO2 emission -- CO2 emissions per
primary energy supply (an indicator of carbon intensity in energy supply), primary energy supply
per GDP (an indicator of energy conservation) and economic growth. From 2005 to 2050, energy
conservation will serve to reduce CO2 emissions at an annual pace of 1.6% to more than offset the
economic growth’s impact on CO2 emissions. A shift away from fossil energy sources will work to
reduce CO2 emissions at an annual pace of 0.4%. Under the Technology Advance Scenario, the rate
of energy conservation toward 2050 will be 0.3 percentage point faster than under the Reference
Scenario and the pace of a shift away from fossil energy sources will be 0.4 point faster. The rate of
energy efficiency and fuel-switching under the Technology Advance Scenario will be almost equal
to those just after the oil crises. The introduction of renewable energy and the shift away from fossil
fuels under the Technology Advance Scenario will have to make far greater progress than under the
Reference Scenario.
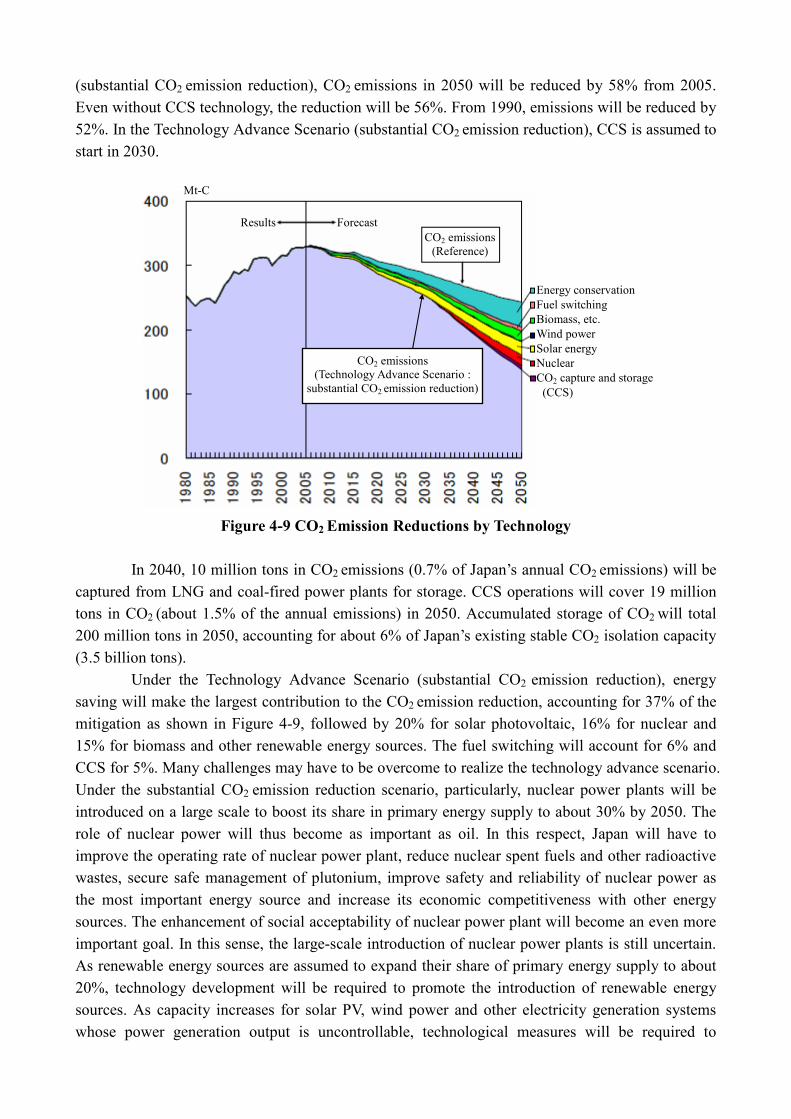
Figure 4-8 CO2 Emissions by Each Scenario Note: The IEEJ outlook is from “Japan’s Long-term Energy Supply/Demand Outlook through 2030 – Under Environmental Constraints and Changing Energy Markets,” Institute of Energy Economics, Japan, 2006. The METI outlook is from Reference No. 8. The candidate goal of the medium-term goal consideration committee is from the seventh paper at the Cabinet Secretariat’s panel on global warming in 2009. Former Prime Minister Yasuo Fukuda’s goal is from his speech titled “In Pursuit of Japan as a Low-Carbon Society” in 2008.
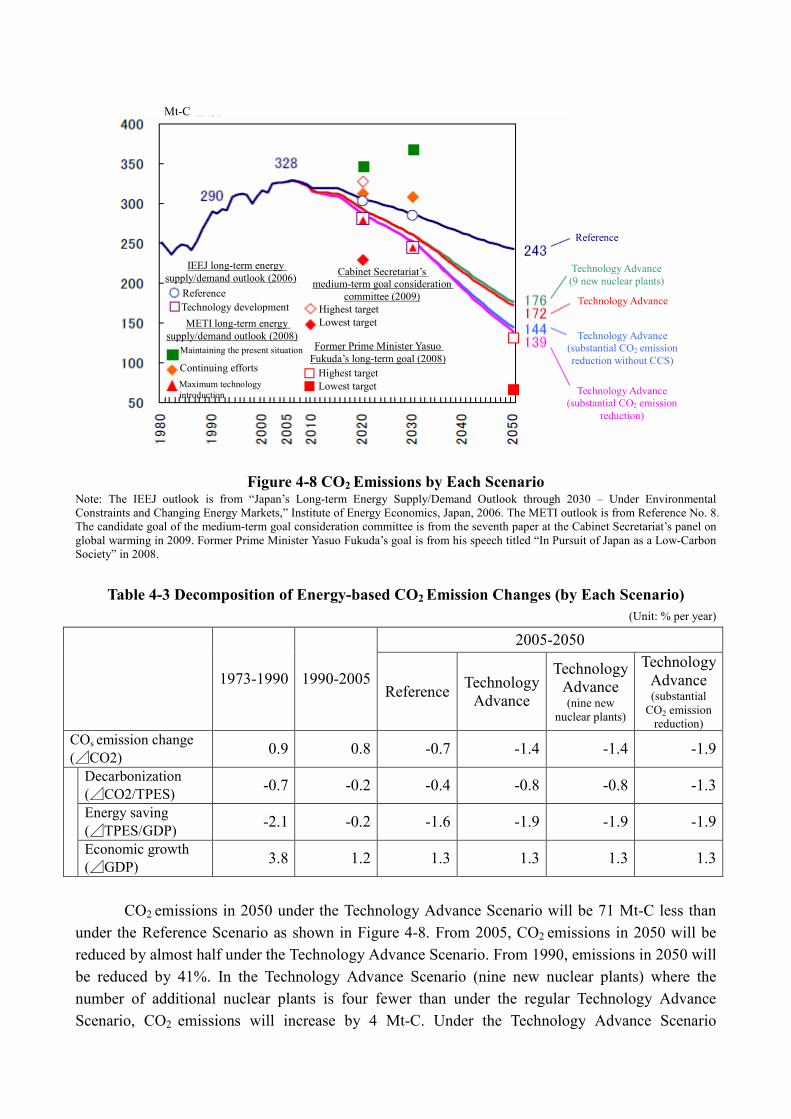
Table 4-3 Decomposition of Energy-based CO2 Emission Changes (by Each Scenario)
(Unit: % per year)
2005-2050
1973-1990 1990-2005 Reference
Technology Advance
Technology Advance (nine new
nuclear plants)
Technology Advance (substantial CO2 emission reduction)
COs emission change
(⊿CO2) 0.9 0.8 -0.7 -1.4 -1.4 -1.9
Decarbonization
(⊿CO2/TPES) -0.7 -0.2 -0.4 -0.8 -0.8 -1.3
Energy saving
(⊿TPES/GDP) -2.1 -0.2 -1.6 -1.9 -1.9 -1.9
Economic growth
(⊿GDP) 3.8 1.2 1.3 1.3 1.3 1.3
CO2 emissions in 2050 under the Technology Advance Scenario will be 71 Mt-C less than
under the Reference Scenario as shown in Figure 4-8. From 2005, CO2 emissions in 2050 will be
reduced by almost half under the Technology Advance Scenario. From 1990, emissions in 2050 will
be reduced by 41%. In the Technology Advance Scenario (nine new nuclear plants) where the
number of additional nuclear plants is four fewer than under the regular Technology Advance
Scenario, CO2 emissions will increase by 4 Mt-C. Under the Technology Advance Scenario


![Japan’s Stewardship Code and Japan’s Corporate Governance Code · 2017-03-13 · Japan’s Stewardship Code and Japan’s Corporate Governance Code December 22, 2015 [Ikeo, Chairman]](https://static.documents.pub/doc/80x56/5f90a50a670cf42f0354242f/japanas-stewardship-code-and-japanas-corporate-governance-code-2017-03-13.jpg)


