46
FY2015 Financial Results Japfa Ltd Investor Presentation

FY2015 Financial Results
Japfa Ltd Investor Presentation
1
Agenda
Operational & Segmental Review 3
Financial Highlights 2
1 Company Overview
Growth Strategies 4
Company Overview

Leading Pan-Asian Industrialized Agri-Food Company
3
WHAT WE DO
We produce quality dairy, protein staples and packaged food that nourish millions
of people
WHERE WE ARE
We employ over 30,000 people across Singapore, Indonesia, China, Vietnam, India
and Myanmar
WHY WE DO IT
3 billion people living in our target markets
More than 40% of the world’s total population
A leading pan-Asian, industrialized agri-food company dedicated to feeding emerging Asia with essential proteins

Vertically Integrated Business Across Entire Value Chain
UPSTREAM: Animal Feed & Breeding
• Produce quality animal feed on an industrial scale
• Use world class genetics supported by advanced farming
technology to maximize efficiency in our breeding operations in
dairy cattle, poultry, beef cattle, swine and aquaculture
MIDSTREAM: Milking & Fattening
• Operate dairy milking parlours and commercial livestock
fattening farms
• Achieve quality and productivity gains through a combination of
superior livestock genetics, quality feed nutrition, and
international bio-security standards
DOWNSTREAM: Processing & Distribution
• Produce high quality consumer dairy, meat, and aquaculture
products with traceability and food safety assurance across the
entire supply chain
Ve
rtic
ally In
teg
rate
d B
usin
es
s M
od
el
HOW WE DO IT
4

Bio-security
Technology and Genetics
Standardization / Replication
Large Scale
Core Competencies Across All Business Segments
5
INDUSTRIALIZED APPROACH TO FARMING AND FOOD PRODUCTION
Ability to manage mega-scale operations:
> 10,000 poultry commercial farms
> 600 million day-old-chicks (“DOCs”)
10 large scale dairy farms with more than 10,000 cattle per farm
30,000 employees across geographies
Replication of best practices and infrastructure design
Replication of farm design model in dairy farms, DOC breeding farms, feedmills, etc.
JVs with and for superior breeding and genetics
Advanced feed technology
Combined with best farm management practices
Best in class biosecurity means using stringent operating procedures
In-house vaccine production firm PT Vaksindo
1 2
3 4
We are a market leader across multiple classes of protein foods, with an emphasis on milk, poultry and beef, complemented by growing businesses in swine and aquaculture.

FY2015 Financial Highlights

Key Highlights for FY2015
7
Profitability for FY2015 improved year-on-year, across the board…
PT Japfa Tbk’s poultry
business turned around in
2H 2015, mainly due to
improvement in
Indonesian’s poultry
market leading to better
pricing environment
Animal feed
business
continues to
be one of our
core stable
strengths
… driven by better market conditions, diversification strategy and higher efficiencies
Significant
improvement
in Vietnam’s
swine
business
Improvement
in milk volume
and yields
helped offset
lower milk
prices
Operating Profit
US$216.6 m
+13.2%
Profit After Tax
US$91.8 m
+55.0%
Revenue
US$2.8 bn
-5.4%
Operating Profit Margin
7.8%
+1.3 ppt
Core PATMI w/o Forex
US$88.6 m
+56.0%
EBITDA
US$297.5 m
+12.7%

8
FY2015 Financial Overview
Broad-based improvements in FY2015 profitability
Consolidated sales decreased 5.4% YoY mainly due to a 10% decline in sales at PT Japfa Tbk in USD terms (PT Japfa Tbk sales
increased by 2% in Rupiah terms) which was compensated by increase in sales for Animal Protein Other and Dairy businesses
Significant improvement in profitability was due to PT Japfa Tbk’s poultry business turning around in 2H 2015. Poultry market in
Indonesia has improved, resulting in better pricing environment for DOC and broiler. PT Japfa Tbk generated US$126.4m
operating profit in FY2015, compared to US$105.3m in FY2014
The Group’s operating profit grew 13.2% to US$216.6m, while EBITDA grew 12.7% to US$297.5m
The Rupiah exchange rate has declined by 12% from Rp12,410 as at 31 December 2014 to 13,858 as at 31 December 2015
Even with the forex loss (US$42.0m), the Group’s PAT improved 55.0% to US$91.8m
FY2015 Core PATMI w/o Forex was US$88.6m, up by 56.0% from US$56.8m in FY2014
4Q / FY2015 Key Financial Highlights (US$m)
Income Statement 4Q 2015 4Q 2014 % change FY2015 FY2014 % change
Revenue 711.8 705.4 +0.9% 2,787.1 2,947.5 -5.4%
Operating profit 75.3 46.7 +61.2% 216.6 191.5 +13.2%
Operating profit margin 10.6% 6.6% +4.0ppt 7.8% 6.5% +1.3ppt
EBITDA 95.0 61.1 +55.5% 297.5 263.9 +12.7%
PBT w/o Forex and Bio-Assets 61.1 24.4 +150.8% 159.5 122.0 +30.8%
PAT 74.9 -16.5 +554.5% 91.8 59.2 +55.0%
Core PATMI 36.9 10.4 +254.9% 64.0 51.8 +23.5%
Core PATMI w/o Forex 33.7 13.2 +155.4% 88.6 56.8 +56.0%

8.6
21.2
13.8 13.2 9.5
17.6
27.7 33.7
0
20
40
60
80
100
1Q 2014 2Q 2014 3Q 2014 4Q 2014 1Q 2015 2Q 2015 3Q 2015 4Q 2015
Core PATMI w/o Forex
Quarterly improvements leading to a strong FY2015
9
Quarterly performance continued to improved year-on-year and sequentially
4Q 2015 Core PATMI w/o Forex is the highest over the published numbers
FY2015 Core PATMI w/o Forex has increased by 56.0% compared to that of FY2014
1 We derived Core PATMI from “Profit Attributable to Owners of the Parent, Net of Tax” by excluding changes in fair value of biological assets attributable to owners of the parent (net of tax), and
excluded extraordinary items (attributable to owners of the parent, net of tax) namely, a one-off gain from the disposal of asset held for sale in 2Q 2014 and a gain from the buyback of USD bonds in
PT Japfa Tbk in FY2015.
2 “Core PATMI w/o Forex” is an estimate derived from Core PATMI by excluding foreign exchange gains/losses (before tax) attributable to the owners of the parent. As the majority of the foreign
exchange gains/losses are unrealised and arises from the translation of USD bonds in PT Japfa Tbk, which has no tax implication, we have not made an estimate of the tax impact on foreign exchange
gains/losses.
US$ million Core PATMI w/o Forex2
60.7 56.8
88.6
0
20
40
60
80
100
FY2013 FY2014 FY2015
US$ million

FY2015 Group Financials
FY2015 operating profit, EBITDA as well as PAT all improved year-on-year
The 12% depreciation of the Rupiah in FY2015 resulted in forex loss of US$42.0m (note: there is an unrealised forex loss of US$24m
from the translation of the US$203m bond outstanding (US$225m minus US$22m bond buyback))
In FY2014, there was an extraordinary one-off gain of US$9.6m from the sale of an office in Kallang, Singapore. In FY2015, there was
a gain of US$6.4m from the buy back of USD bonds in PT Japfa Tbk (The operating profit, EBITDA and PAT above have not been
adjusted for these extraordinary items)
EBITDA increased by 12.7% to US$297.5m in FY2015, as compared to US$263.9m in FY2014
Despite the forex loss of US$42.0m and bio-asset valuation loss of US$5.6m, the Group generated a 55.0% growth in PAT to
US$91.8m for FY2015
10
Revenue US$ million
Operating Profit US$ million
EBITDA US$ million
PAT US$ million

FY2015 Profit Attributable to Parent
11
PATMI US$ million
Core PATMI US$ million
Core PATMI w/o Forex US$ million
Core PATMI, which excludes bio-assets, is an important measurement of income attributable to shareholders compared to PATMI
Core PATMI w/o Forex is a reflection of the Group’s operating performance

FY2015 Segmental Highlights
12
• Turnaround in poultry business in 2H 2015
• Improved poultry market in Indonesia with better selling prices of feed, DOCs and broilers in 2H 2015
• Strong PAT despite foreign exchange loss
• Notwithstanding challenging and volatile conditions in Indonesia, PT Japfa Tbk generated positive cash flow and EBITDA in FY2015
• Low raw milk prices continue to persist in China in FY2015, as compared to exceptionally high prices in FY2014
• Low prices in FY2015 were mitigated by growth in sales volumes and improvement in milk yields
• Consumer Food business in Indonesia was profitable, boosted by sales of Real Good milk
• Overall Consumer Food segment registered a small loss in FY2015, due to the start-up loss of Consumer Food operations in Vietnam
• Overall performance in APO was boosted by significant improvement in Vietnam’s operations, which saw an increase in poultry and swine feed and swine fattening volumes
• This was offset by weaker performance in India and start-up losses for China’s beef operations
• Animal Protein Other continues to be a key part of the Group’s diversification strategy
PT Japfa Tbk
Animal
Protein
Other
Dairy
Consumer
Food
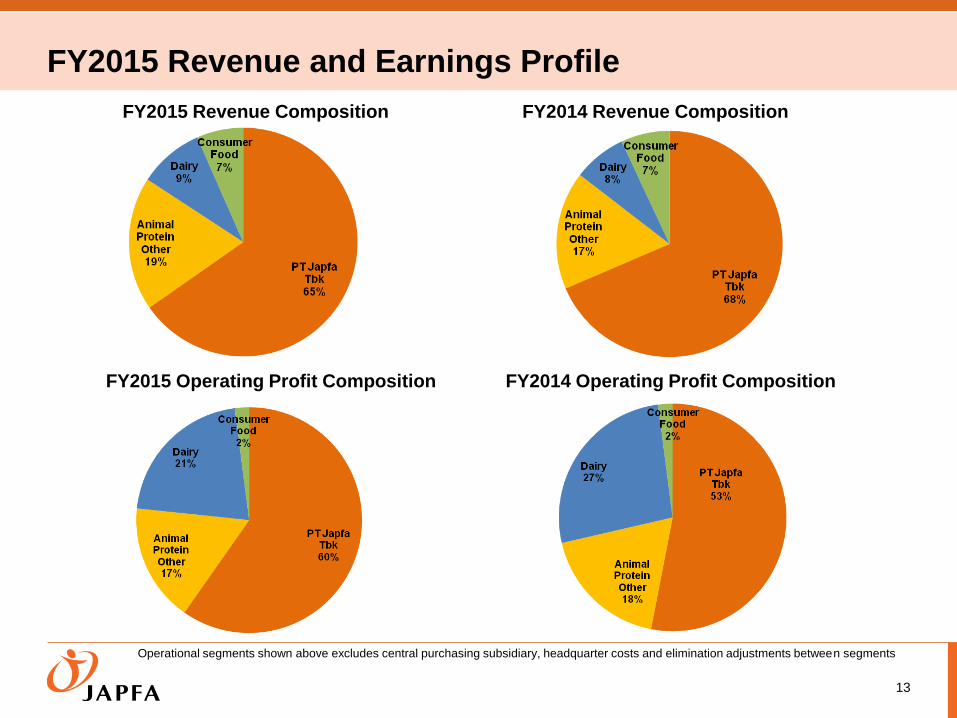
FY2015 Revenue and Earnings Profile
13
FY2015 Revenue Composition
FY2015 Operating Profit Composition
FY2014 Revenue Composition
FY2014 Operating Profit Composition
Operational segments shown above excludes central purchasing subsidiary, headquarter costs and elimination adjustments between segments

Core PATMI Breakdown
Diversification strategy across three pillars
14
Core PATMI w/o Forex Breakdown
Balance contribution from the Group’s three pillars – PT Japfa Tbk, Animal Protein Other and Dairy
“AP Other” refers to “Animal Protein Other”
Operational segments shown above excludes central purchasing subsidiary, headquarter costs and elimination adjustments between segments
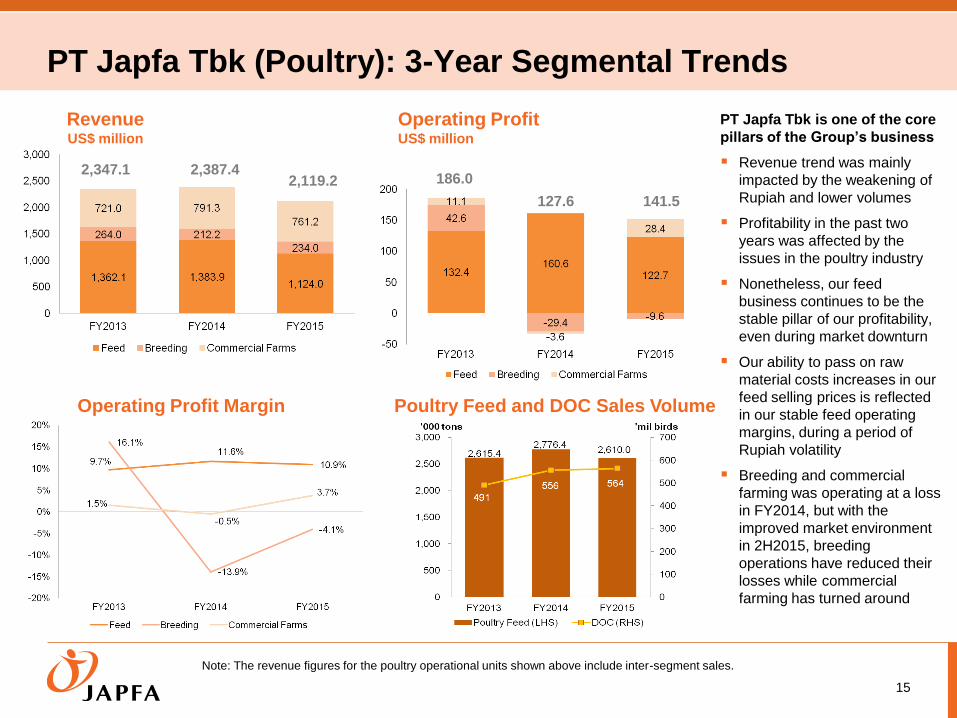
PT Japfa Tbk (Poultry): 3-Year Segmental Trends
15
PT Japfa Tbk is one of the core
pillars of the Group’s business
Revenue trend was mainly
impacted by the weakening of
Rupiah and lower volumes
Profitability in the past two
years was affected by the
issues in the poultry industry
Nonetheless, our feed
business continues to be the
stable pillar of our profitability,
even during market downturn
Our ability to pass on raw
material costs increases in our
feed selling prices is reflected
in our stable feed operating
margins, during a period of
Rupiah volatility
Breeding and commercial
farming was operating at a loss
in FY2014, but with the
improved market environment
in 2H2015, breeding
operations have reduced their
losses while commercial
farming has turned around
Note: The revenue figures for the poultry operational units shown above include inter-segment sales.
Revenue US$ million
Operating Profit Margin
Operating Profit US$ million
2,347.1 2,387.4 2,119.2 186.0
127.6 141.5
Poultry Feed and DOC Sales Volume

Animal Protein Other: 3-Year Segmental Trends
16
Note: Operational units shown above exclude beef operations in China.
Diversification strategy is coming
through
With our expertise and track record
in the poultry business, we are
replicating the same success model
in Vietnam, Myanmar and India
Profitability of our Animal Protein
Other business has been
strengthening over the past three
years
Vietnam’s strong growth was in part
due to the turnaround of its swine
business – it incurred a start-up loss
in FY2013, broke even in the
following year and turned profitable
in FY2015
Myanmar contributed consistently in
the last two years to our revenue and
profitability, and provides growth
opportunity in the medium term
In the longer term, we see India as
another key growth market; our
current focus is on growing our feed
business
Our aim is to grow the Animal
Protein Other business to be the
next major pillar for the Group
Revenue US$ million
Operating Profit Margin
Operating Profit US$ million
367.1
506.7 527.5
7.5
37.4 38.2
Feed and Swine Fattening Volume

Dairy: 3-Year Segmental Trends
17
Dairy business is poised to be a
strong third pillar for the Group
Revenue growth for our dairy
business has been driven by
China
Profit generation is similarly
driven by China, while our SEA
operations are breaking even
In China, our current operations
are focused on dairy farming,
whereas in SEA, our focus has
moved beyond dairy farming to
downstream processing and
branding
In SEA, we have been investing
strategically in building the
Greenfields brand
Profitability in FY2015 was
subdued by the low raw milk
price environment in China
We continue to focus on
improving our milk yields and
volumes in China, to mitigate
fluctuations in raw milk prices
Revenue US$ million
Operating Profit Margin
Operating Profit US$ million
25.8
52.7
45.1
148.1
227.7
259.4
China Raw Milk Sales Volume and
Average Daily Milking
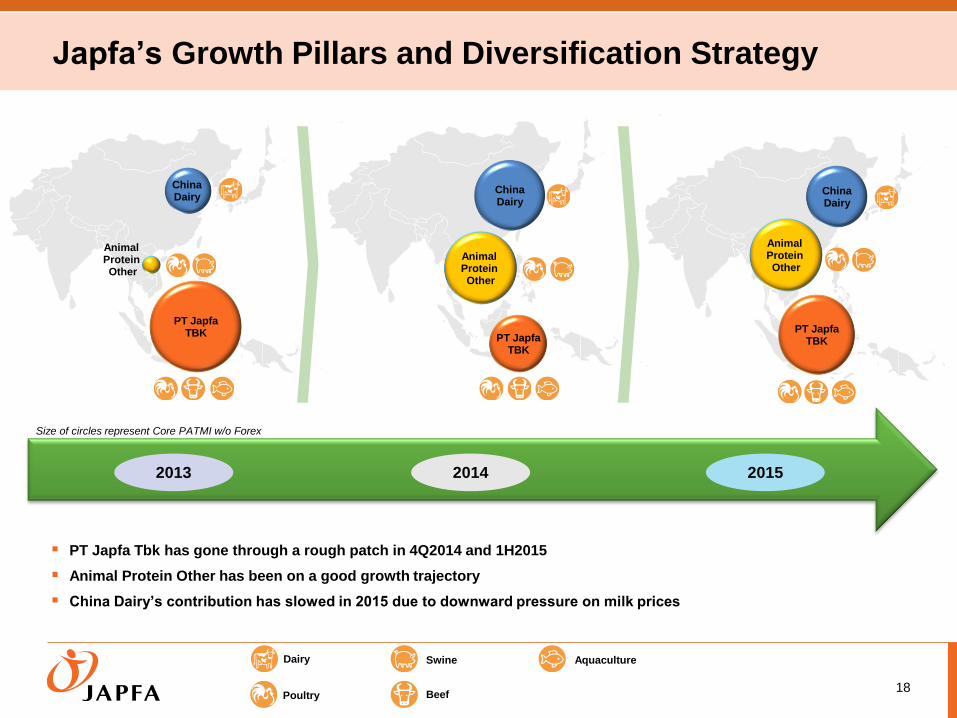
Japfa’s Growth Pillars and Diversification Strategy
2013 2015
Dairy
Poultry
Swine
Beef
Aquaculture
2014
Animal Protein Other
18
China Dairy
China Dairy
Animal Protein Other
Animal Protein Other
PT Japfa TBK
PT Japfa TBK
PT Japfa TBK
PT Japfa Tbk has gone through a rough patch in 4Q2014 and 1H2015
Animal Protein Other has been on a good growth trajectory
China Dairy’s contribution has slowed in 2015 due to downward pressure on milk prices
Size of circles represent Core PATMI w/o Forex
China Dairy

Other Financial Highlights

Other Financial Highlights
20
Balance Sheet (US$m) FY2015 FY2014 % change
Total Assets 2,212.6 2,327.0 -4.9%
Cash 147.9 286.7 -48.4%
Inventory 609.4 598.1 +1.9%
Total Liabilities 1,204.0 1,332.7 -9.7%
Financial liabilities 840.3 992.6 -15.3%
Total Equity 1,008.6 994.3 +1.4%
Net Debt / Equity Ratio (x) 0.7 0.7
Inventory Turnover Days 97.3 88.2
Cash Flows (US$m) FY2015 FY2014
Net Cash Flows from Operating Activities 254.4 126.2
Net Cash Flows used in Investing Activities (185.9) (298.5)
Net Cash Flows (used in) / from Financing Activities (203.5) 232.5
Net (Decrease) / Increase in Cash and Cash Equivalents (135.0) 60.2

PT Japfa Tbk – USD Debt Exposure
21
As at 31 December 2015
USD millions
PT Japfa Tbk
IDR book
Loans in USD 228
Loans in Local Currency (US$ equivalent) 287
Total Loans 515
% USD Loans to Total Loans 44%
As at 31 December 2015
USD millions
PT Japfa Tbk
USD Debt (gross) 228
USD Bond Buybacks (face value) (22)
USD Debt (net) 206
Currency Hedging - Operational 51
Currency Hedging - Principal and/or Interest -
USD Cash 26
Total Hedging + Cash 77
PT Japfa Tbk
1. Minimal operational currency exposure as able to pass on Rupiah changes by adjusting feed selling prices
2. Operational hedges are applied in effect to cover the USD bond exposure
3. We have a natural hedge as we typically hold more than US$150m of USD-linked raw material inventory
4. Buyback of USD bonds from secondary market also reduces USD debt exposure
5. Currency Hedging - Operational: Hedged 57% of committed USD supplier payments as at end Dec 15. Procurement is
low in 4Q 2015, hence the lower value of operational hedges.
6. Currency Hedging - Principal &/or Interest: Fully hedged the next USD bond coupon of US$8.4m in early 2016

Capex 2014 - 2015
22

Segmental Debt & Cash Profile
23
Total Debt as at 31 December 2015
US$840m Total Cash as at 31 December 2015
US$148m
1 PT Japfa Tbk’s debt is net of USD bond buybacks of US$22m 2 Total Debt – Others refer to the debt of Annona (the central purchasing subsidiary in Singapore) for working capital purposes, costs of which are fully recovered 3 Animal Protein Other’s debt includes US$20m borrowed by Japfa Ltd and on-lent to the Vietnam operations. 4 Total Cash – Others refer mainly to the cash of Japfa Ltd

Segmental & Operational Highlights

4Q/FY2015 Segmental Overview
25
Notes:
• Animal Protein – where PT Japfa Comfeed Indonesia Tbk (PT Japfa Tbk) is shown separately from Animal Protein Other (AP Other). AP Other refers to the animal protein operations in Vietnam, India, Myanmar and China
• Dairy – includes the operations in China, Indonesia and South East Asia
• Consumer Food – includes the operations in Indonesia and Vietnam
1 The combined revenue for PT Japfa Tbk and AP Other includes inter-segment revenue of US$9.5 million in 4Q 2015 (4Q 2014: US$10.2 million) & US$40.1 million in
FY2015 (FY2014: US$50.3 million). 2 The Dairy segment revenue includes inter-segment revenue of US$0.5 million in 4Q 2015 (4Q 2014: US$0.5 million) & US$2.0 million in FY2015 (FY2014: US$2.2
million). 3 The Consumer Food segment revenue includes inter-segment revenue of US$0.2 million in 4Q 2015 (4Q 2014: US$2.1 million) & US$5.2 million in FY2015 (FY2014:
US$8.8 million).
(US$m) 4Q2015 4Q2014 % change FY2015 FY2014 %change
PT Japfa Tbk
Revenue1 464.2 469.5 -1.1% ▼ 1,854.6 2,056.3 -9.8% ▼
Operating profit 52.1 21.8 +138.7% ▲ 126.4 105.3 +20.0% ▲
Operating profit margin 11.2% 4.7% +6.6ppt ▲ 6.8% 5.1% +1.7ppt ▲
EBITDA 64.8 33.6 +92.8% ▲ 179.9 149.8 +20.1% ▲
PAT 45.4 -2.4 +2016.9% ▲ 36.0 27.2 +32.5% ▲
Core PATMI 25.0 -0.2 N.A. ▲ 14.3 14.9 -3.9% ▼
Core PATMI w/o Forex 19.1 2.4 +681.1% ▲ 34.7 18.6 +86.3% ▲
Animal Protein Other
Revenue1 141.7 139.4 +1.6% ▲ 534.1 506.7 +5.4% ▲
Operating profit 7.0 13.8 -49.0% ▼ 35.8 36.4 -1.7% ▼
Operating profit margin 5.0% 9.9% -4.9ppt ▼ 6.7% 7.2% -0.5ppt ▼
EBITDA 8.6 14.7 -41.6% ▼ 42.5 41.4 +2.7% ▲
PAT 6.6 -2.4 +379.6% ▲ 30.8 19.6 +56.8% ▲
Core PATMI 6.6 12.4 -47.1% ▼ 28.7 29.9 -4.1% ▼
Core PATMI w/o Forex 6.6 12.6 -47.9% ▼ 30.1 29.1 +3.2% ▲
Dairy
Revenue2 69.8 60.4 +15.7% ▲ 259.4 227.7 +14.0% ▲
Operating profit 13.2 9.0 +46.6% ▲ 45.1 52.7 -14.5% ▼
Operating profit margin 18.9% 14.9% +4.0ppt ▲ 17.4% 23.2% -5.8ppt ▼
EBITDA 17.6 11.0 +60.7% ▲ 60.7 70.4 -13.8% ▼
PAT 22.6 -6.4 +454.4% ▲ 22.7 32.0 -29.3% ▼
Core PATMI 5.1 3.9 +31.9% ▲ 18.6 26.5 -29.7% ▼
Core PATMI w/o Forex 6.3 3.7 +72.2% ▲ 22.4 27.1 -17.5% ▼
Consumer Food
Revenue3 46.3 48.3 -4.2% ▼ 186.3 209.0 -10.9% ▼
Operating profit 0.2 1.8 -87.7% ▼ 4.3 4.1 +5.5% ▲
Operating profit margin 0.5% 3.8% -3.3ppt ▼ 2.3% 2.0% +0.3ppt ▲
EBITDA 1.4 1.9 -26.4% ▼ 8.8 9.1 -4.1% ▼
PAT -2.1 -4.1 +48.4% ▲ -2.4 -4.1 +42.1% ▲
Core PATMI -2.1 -4.4 +52.0% ▲ -2.4 -4.1 +41.9% ▲
Core PATMI w/o Forex -0.7 -4.5 +85.3% ▲ -3.7 -4.9 +24.3% ▲

PT Japfa Tbk – Financial performance
26
Revenue US$ million
PAT US$ million
Operating Profit US$ million
EBITDA US$ million
FY2015 was a significant improvement from FY2014 , with a turnaround in the Indonesia poultry business in 2H 2015
Revenue declined by 10% in USD terms, but increased slightly by 2% in Rupiah terms
The poultry oversupply situation improved in 2H 2015. The Indonesian government coordinated an industry-wide culling programme of an initial 4 million parent stock, which
resulted in lower DOC production across the industry. This has led to an improvement and stability in the average selling prices of DOC and broilers in 2H 2015
Feed continues to provide stable contribution to profitability and operating cash flow in FY2015
Operating profit for breeding improved from a loss of US$29.4m to a loss of US$9.6m, while commercial farming improved from a loss of US$3.6m to a profit of US$28.4m.
Overall, feed and commercial farming operations were more than able to cover the operating loss of breeding operations, resulting in a 20.0% growth in operating profit to
US$126.4m
EBITDA grew from US$149.8m in FY2014 to US$179.9m in FY2015
The 12% depreciation of the Rupiah in FY2015 resulted in forex loss of US$35.5m (note: there is an unrealised forex loss of US$24m from the translation of the US$203m
bond outstanding (US$225m minus US$22m bond buyback)
Despite the forex loss of US$35.5m, PT Japfa Tbk still recorded a 32.5% growth in PAT to US$36.0m in FY2015
Notwithstanding the challenging and volatile conditions in Indonesia, PT Japfa Tbk has generated positive operating cash flow and EBITDA in FY2015

Animal Protein Other – Financial performance
27
Revenue US$ million
Operating Profit US$ million
EBITDA US$ million
PAT US$ million
+379.6% YoY
Diversification continues to pay off with Vietnam as a star performer in FY2015
Sales were 5% higher at US$534.1m in FY2015 compared to last year
Revenue growth was mainly due to Vietnam’s business where poultry feed and swine feed volume was up 18%, and swine fattening
volume was up significantly by 62% in FY2015. Swine fattening in Vietnam continues to perform well due to operational efficiencies
Significant improvement in Vietnam’s operations, together with positive contribution from Myanmar, was offset by: (1) weaker performance
in India mainly due to lower selling prices of poultry in 2015, and (2) continuing start-up losses for China’s beef operations
Operating profit in 4Q2015 declined primarily due to Vietnam’s poultry industry seeing lower selling prices for DOCs and broilers,
compared to exceptionally high prices in 4Q2014. We also lowered feed selling prices as a strategy to gain greater market share.
4Q2014 registered a negative PAT due to bio-asset valuation losses of US$19.7m, compared to a US$0.1m bio-asset valuation gain in
4Q2015. Hence, the lower PAT in FY2014 includes bio-asset valuation losses of US$15.5m, compared to a US$1.7m bio-asset valuation
gain in FY2015.

Animal Protein – Operational Performance
28
Animal Feed – Poultry: Sales Volume (‘000 tons)
DOC - Broiler: Sales Volume (mil birds) Commercial Farm – Live Birds: Sales Volume (‘000 tons)
0
100
200
300
400
500
600
700
800
4Q2014 1Q2015 2Q2015 3Q2015 4Q2015 2013 2014 2015
PT Japfa Tbk Japfa India Japfa Vietnam Japfa Myanmar
(mil birds)(mil birds)(mil birds)
147 151 147 160 159
540614 617
0
500
1,000
1,500
2,000
2,500
3,000
3,500
4,000
4Q2014 1Q2015 2Q2015 3Q2015 4Q2015 2013 2014 2015
PT Japfa Tbk Japfa India Japfa Vietnam Japfa Myanmar
('000 tons)
853 824 818 826 833
3,175 3,377 3,301
0
100
200
300
400
500
600
700
800
4Q2014 1Q2015 2Q2015 3Q2015 4Q2015 2013 2014 2015
PT Japfa Tbk Japfa India Japfa Vietnam Japfa Myanmar
('000 tons)
170174 164 169 167
539
656 669

Animal Protein – Operational Performance
29
Beef – Live Cattle: Sales Volume (‘000 tons) Aquaculture – Aqua-feed: Sales Volume (‘000 tons)
Swine Fattening: Sales Volume (‘000 tons) Animal Feed – Swine: Sales Volume (‘000 tons)
74.6 74.8 75.2 80.8 88.0
239.8271.0
318.7
0
50
100
150
200
250
300
350
4Q2014 1Q2015 2Q2015 3Q2015 4Q2015 2013 2014 2015
Japfa Vietnam
('000 tons)
10.0 9.4 11.1 9.1 6.9
21.3
37.6 36.6
0
5
10
15
20
25
30
35
40
4Q2014 1Q2015 2Q2015 3Q2015 4Q2015 2013 2014 2015
PT Japfa Tbk
('000 tons)
50.5 52.3 55.3 51.8 52.9
203.6 206.0 212.2
0
50
100
150
200
250
4Q2014 1Q2015 2Q2015 3Q2015 4Q2015 2013 2014 2015
PT Japfa Tbk
('000 tons)
7.6 7.5 9.8 8.9 11.16.5
22.5
37.2
0
5
10
15
20
25
30
35
40
4Q2014 1Q2015 2Q2015 3Q2015 4Q2015 2013 2014 2015
Japfa Vietnam
('000 tons)('000 tons)

Dairy – Financial performance
30
Growth in milk volume and improvements in milk yields were offset by lower milk prices in FY2015
Revenue was up 14% due to increase in sales volume in China Hub 1; Farm 4 is fully milking; and Farm 5 start generated sales since
March 2015. Total milkable cows in China and Indonesia farms increased from 28,557 in FY2014 to 34,459 in FY2015
Profitability declined because of lower milk prices in China in FY2015 compared to FY2014 which saw exceptionally high raw milk prices
Lower milk prices were partly compensated by improved milk yield at 34.2 Kg/head/day to 36.1 Kg/head/day for China farms. The
significant improvement in milk yields, together with the growth in sales volumes, managed to mitigate the full impact of lower raw milk
prices in China, resulting in a strong EBITDA of US$60.7 million and EBITDA margin of 23%
Loss from changes in fair value of biological assets was US$8.2m in FY2015, as compared to US$20.8m in FY2014. Forex loss was
US$6.0m in FY2015, as compared to US$1.0m in FY2014
Revenue US$ million
Operating Profit US$ million
PAT US$ million
EBITDA US$ million

Dairy – Operational Performance
31
1 Number of milkable cows as at end of the quarter
SE Asia Extended Shelf Life Branded Milk:
Sales Volume (mil litres)
Milkable cows – SE Asia (heads)1
China Raw Milk: Sales Volume (mil kg) Milkable cows – China (heads)1
56.3 64.5 73.0 73.4 84.1 124.4
200.7
295.0
0
50
100
150
200
250
300
350
4Q2014 1Q2015 2Q2015 3Q2015 4Q2015 2013 2014 2015
China
(mil kg)
5.8 5.2 5.1 5.4 5.5
22.0 22.6 21.1
0
5
10
15
20
25
4Q2014 1Q2015 2Q2015 3Q2015 4Q2015 2013 2014 2015
SE Asia
(mil litres)
0
500
1,000
1,500
2,000
2,500
3,000
3,500
4,000
4,500
4Q2014 1Q2015 2Q2015 3Q2015 4Q2015
Milking Cows Dry Cows
(heads)
3,8074,028 4,068 3,976 4,158
24,750 25,429 26,64428,712
30,301
0
5,000
10,000
15,000
20,000
25,000
30,000
35,000
4Q2014 1Q2015 2Q2015 3Q2015 4Q2015
Milking Cows Dry Cows
(heads)

32
Dairy – Operational Performance
Average Daily Milking – SEA (kg/head/day)
Average Daily Milking – China (kg/head/day)
29.2 29.7 30.9 30.3 29.5 25.9 27.0
30.1
0
5
10
15
20
25
30
35
4Q2014 1Q2015 2Q2015 3Q2015 4Q2015 2013 2014 2015
SEA
(kg/head/day)
35.7 36.6 36.6 34.7 36.5 31.6 34.2 36.1
0
5
10
15
20
25
30
35
40
4Q2014 1Q2015 2Q2015 3Q2015 4Q2015 2013 2014 2015
China
(kg/head/day)

Consumer Food – Financial performance
33
Consumer Food business in Indonesia continues to be profitable, while Vietnam incurred start-up loss
Revenue dropped 11% in USD terms (while flat in Rupiah terms) for Consumer Food business in Indonesia.
Sales volume of Real Good milk went up 30%, which compensate the decline in sales volume for frozen food products
Overall Consumer Food business recorded a small loss in FY2015 due to Vietnam start-up loss
Revenue US$ million
Operating Profit US$ million
EBITDA US$ million
PAT US$ million
-4.1
-2.1
+48.4% YoY

Consumer Food – Operational Performance
34
Frozen products: Sales Volume (tons)
Ambient products: Sales volume (tons)
Growth Strategies

Growth Strategies
36
Focus on Industrialization and
Diversification
Leverage our track record in replicating our industrialized
and scalable business, to build our three key business
pillars – dairy in China, poultry in Indonesia, and poultry and
swine in Indochina
Mitigating Market Challenges
Continue to enhance efficiency and profitability of
our operations to counter price fluctuations
Improve milk yields and productivity to mitigate lower average selling prices of raw
milk in China
Maximising Returns from Our Assets
Long term fundamentals for the Group remain favorable
Large-scale business enables us to tap on growth
opportunities
Strategic investments in selected markets to capture rise in consumer demand

Appendix

Segment Information – FY2015
38
Notes:
• Animal Protein - where PT.Japfa Comfeed
Indonesia Tbk (TBK) is shown separately
from Animal Protein Other (AP Other).
• Animal Protein Other (AP Other) – refers to
the animal protein operations in Vietnam,
India, Myanmar and China.
• Dairy – includes the operations in China,
Indonesia and Southeast Asia.
• Consumer Food – includes the operations in
Indonesia and Vietnam.
• Others - include corporate office, central
purchasing office in Singapore and
consolidation adjustments between
segments.
• EBITDA = PBT net of interest income
(expense), FV of bio assets and marketable
securities, forex gain (loss), depreciation of
fixed assets and amortization of intangible
assets.
• Core PATMI from “Profit Attributable to
Owners of the Parent, Net of Tax” by
excluding changes in fair value of biological
assets attributable to owners of the parent
(net of tax), and excluded extraordinary items
(attributable to owners of the parent, net of
tax) namely, a one-off gain from the disposal
of asset held for sale in 2Q 2014 and a gain
from the buyback of USD bonds in PT Japfa
Tbk in FY2015.
• Core PATMI w/o Forex (Estimate) is derived
from Core PATMI by excluding foreign
exchange gains/losses (before tax)
attributable to the owners of the parent. As
the majority of the foreign exchange
gains/losses are unrealised and arises from
the translation of USD bonds in PT Japfa
Tbk, which has no tax implication, we have
not made an estimate of the tax impact on
foreign exchange gains/losses. Accordingly
this “Core PATMI w/o Forex (Estimate)” is to
be viewed as an indicative number only.
YTD DEC 2015 ANIMAL PROTEIN DAIRY CONSUMER Others TOTAL TBK AP Other Total FOOD
External Revenue 1,814.5 534.1 2,348.5 257.4 181.1 0.0 2,787.1 Inter Segment Sales 40.1 0.0 40.1 2.0 5.2 (47.3) 0.0 TOTAL REVENUE 1,854.6 534.1 2,388.7 259.4 186.3 (47.3) 2,787.1 GROSS PROFIT 296.0 69.5 365.4 84.7 57.5 12.6 520.3 16.0% 13.0% 15.3% 32.7% 30.8% -26.7% 18.7% OPERATING PROFIT 126.4 35.8 162.2 45.1 4.3 5.0 216.6 6.8% 6.7% 6.8% 17.4% 2.3% -10.6% 7.8% EBITDA 179.9 42.5 220.3 60.7 8.8 5.7 297.5 9.8% 8.0% 9.4% 23.4% 4.7% -11.8% 10.7% Depreciation & Amortization (45.3) (6.9) (52.1) (15.7) (4.8) (0.5) (73.2) Net Interest Expense (49.1) (2.5) (50.4) (8.2) (5.1) (2.4) (67.2) Fair Value Gain(Loss) Marketable Securities 0.0 0.0 0.0 0.0 0.0 2.5 2.5 PBT before Forex & BioA Valuation 85.5 33.2 117.9 36.8 (1.1) 5.3 159.5 Forex Gain(loss) (35.5) (1.4) (36.8) (6.0) 1.3 (0.5) (42.0) Fair Value Gain(Loss) Bio A 0.9 1.7 5.3 (8.2) 0.0 0.0 (5.6) PBT 50.9 33.5 86.4 22.5 0.2 4.9 111.9 Tax (14.9) (2.7) (18.9) 0.1 (2.6) (0.1) (20.2) PAT 36.0 30.8 67.5 22.7 (2.4) 4.8 91.8 PAT w/o Bio A 35.3 29.5 63.3 30.2 (2.4) 4.8 97.2 % ownership 58.0% 100.0% 61.9% 100.0% 100.0% PATMI 18.4 30.0 48.3 13.9 (2.4) 4.8 64.7 Core PATMI 14.3 28.7 43.0 18.6 (2.4) 4.7 64.0 Core PATMI w/o Forex 34.7 30.1 64.8 22.4 (3.7) 5.1 88.6

Segment Information – FY2014
39
YTD DEC 2014 ANIMAL PROTEIN DAIRY CONSUMER Others TOTAL TBK AP Other Total FOOD
External Revenue 2,006.0 506.7 2,512.7 225.5 200.2 9.1 2,947.5 Inter Segment Sales 50.3 0.0 50.3 2.2 8.8 (61.3) 0.0 TOTAL REVENUE 2,056.3 506.7 2,563.0 227.7 209.0 (52.2) 2,947.5 GROSS PROFIT 288.0 62.5 350.5 88.8 58.5 8.6 506.4 14.0% 12.3% 13.7% 39.0% 28.0% -16.4% 17.2% OPERATING PROFIT 105.3 36.4 141.8 52.7 4.1 (7.1) 191.5 5.1% 7.2% 5.5% 23.2% 2.0% 13.7% 6.5% EBITDA 149.8 41.4 191.2 70.4 9.1 (6.8) 263.9 7.3% 8.2% 7.5% 30.9% 4.4% 13.0% 9.0% Depreciation & Amortization (42.5) (5.4) (47.9) (9.9) (5.1) (0.3) (63.1) Net Interest Expense (57.0) (4.6) (61.6) (7.1) (5.0) (5.4) (79.2) Fair Value Gain(Loss) Marketable Securities 0.0 0.0 0.0 0.0 0.0 0.4 0.4 PBT before Forex & BioA Valuation 50.2 31.5 81.7 53.4 (1.0) (12.1) 122.0 Forex Gain(loss) (6.5) 0.8 (5.7) (1.0) 0.8 (2.2) (8.1) Fair Value Gain(Loss) Bio A (3.9) (15.5) (19.4) (20.8) 0.0 0.0 (40.2) PBT 39.8 16.8 56.6 31.6 (0.2) (14.3) 73.7 Tax (12.6) 2.9 (9.8) 0.4 (3.9) (1.2) (14.5) PAT 27.2 19.6 46.8 32.0 (4.1) (15.6) 59.2 PAT w/o Bio A 30.3 31.8 62.0 52.4 (4.1) (15.6) 94.8 % ownership 57.5% 100.0% 61.9% 100.0% 100.0% PATMI 13.1 17.8 30.9 19.8 (4.1) (15.4) 31.2 Core PATMI 14.9 29.9 44.8 26.5 (4.1) (15.4) 51.8 Core PATMI w/o Forex 18.6 29.1 47.8 27.1 (4.9) (13.2) 56.8
Notes:
• Animal Protein - where PT.Japfa Comfeed
Indonesia Tbk (TBK) is shown separately
from Animal Protein Other (AP Other).
• Animal Protein Other (AP Other) – refers to
the animal protein operations in Vietnam,
India, Myanmar and China.
• Dairy – includes the operations in China,
Indonesia and Southeast Asia.
• Consumer Food – includes the operations in
Indonesia and Vietnam.
• Others - include corporate office, central
purchasing office in Singapore and
consolidation adjustments between
segments.
• EBITDA = PBT net of interest income
(expense), FV of bio assets and marketable
securities, forex gain (loss), depreciation of
fixed assets and amortization of intangible
assets.
• Core PATMI from “Profit Attributable to
Owners of the Parent, Net of Tax” by
excluding changes in fair value of biological
assets attributable to owners of the parent
(net of tax), and excluded extraordinary items
(attributable to owners of the parent, net of
tax) namely, a one-off gain from the disposal
of asset held for sale in 2Q 2014 and a gain
from the buyback of USD bonds in PT Japfa
Tbk in FY2015.
• Core PATMI w/o Forex (Estimate) is derived
from Core PATMI by excluding foreign
exchange gains/losses (before tax)
attributable to the owners of the parent. As
the majority of the foreign exchange
gains/losses are unrealised and arises from
the translation of USD bonds in PT Japfa
Tbk, which has no tax implication, we have
not made an estimate of the tax impact on
foreign exchange gains/losses. Accordingly
this “Core PATMI w/o Forex (Estimate)” is to
be viewed as an indicative number only.

Quarterly Segment Information – 4Q 2015
40
4Q 2015 ANIMAL PROTEIN DAIRY CONSUMER Others TOTAL TBK AP Other Total FOOD
External Revenue 454.7 141.7 596.3 69.3 46.1 (0.0) 711.8 Inter Segment Sales 9.5 0.0 9.5 0.5 0.2 (10.2) (0.0) TOTAL REVENUE 464.2 141.7 605.9 69.8 46.3 (10.2) 711.8 GROSS PROFIT 93.7 16.4 110.1 23.5 14.5 4.6 152.7 20.2% 11.6% 18.2% 33.6% 31.3% -45.1% 21.5% OPERATING PROFIT 52.1 7.0 59.2 13.2 0.2 2.7 75.3 11.2% 5.0% 9.8% 18.9% 0.5% -26.3% 10.6% EBITDA 64.8 8.6 71.2 17.6 1.4 2.8 95.0 14.3% 6.0% 12.0% 25.2% 3.0% -27.4% 13.6% Depreciation & Amortization (11.4) (1.6) (12.9) (4.4) (1.2) (0.1) (18.6) Net Interest Expense (11.3) (0.5) (10.6) (1.5) (1.3) (0.6) (15.2) Fair Value Gain(Loss) Marketable Securities 0.0 0.0 0.0 0.0 0.0 (0.1) (0.1) PBT before Forex & BioA Valuation 42.0 6.5 47.7 11.7 (1.1) 2.1 61.1 Forex Gain(loss) 10.3 (0.0) 10.4 (2.0) (1.5) (0.0) 6.9 Fair Value Gain(Loss) Bio A 0.1 0.1 2.8 13.6 0.0 (0.0) 13.8 PBT 52.4 6.5 60.9 23.4 (2.5) 2.1 81.7 Tax (7.0) 0.1 (8.2) (0.8) 0.4 0.5 (6.8) PAT 45.4 6.6 52.7 22.6 (2.1) 2.5 74.9 PAT w/o Bio A 45.4 6.6 50.5 8.2 (2.1) 2.5 60.5 % ownership 58.0% 100.0% 61.9% 100.0% 100.0% PATMI 25.8 6.6 32.3 14.1 (2.1) 2.5 46.7 Core PATMI 25.0 6.6 31.6 5.1 (2.1) 2.4 36.9 Core PATMI w/o Forex 19.1 6.6 25.7 6.3 (0.7) 2.4 33.7
Notes:
• Animal Protein - where PT.Japfa Comfeed
Indonesia Tbk (TBK) is shown separately
from Animal Protein Other (AP Other).
• Animal Protein Other (AP Other) – refers to
the animal protein operations in Vietnam,
India, Myanmar and China.
• Dairy – includes the operations in China,
Indonesia and Southeast Asia.
• Consumer Food – includes the operations in
Indonesia and Vietnam.
• Others - include corporate office, central
purchasing office in Singapore and
consolidation adjustments between
segments.
• EBITDA = PBT net of interest income
(expense), FV of bio assets and marketable
securities, forex gain (loss), depreciation of
fixed assets and amortization of intangible
assets.
• Core PATMI from “Profit Attributable to
Owners of the Parent, Net of Tax” by
excluding changes in fair value of biological
assets attributable to owners of the parent
(net of tax), and excluded extraordinary items
(attributable to owners of the parent, net of
tax) namely, a one-off gain from the disposal
of asset held for sale in 2Q 2014 and a gain
from the buyback of USD bonds in PT Japfa
Tbk in FY2015.
• Core PATMI w/o Forex (Estimate) is derived
from Core PATMI by excluding foreign
exchange gains/losses (before tax)
attributable to the owners of the parent. As
the majority of the foreign exchange
gains/losses are unrealised and arises from
the translation of USD bonds in PT Japfa
Tbk, which has no tax implication, we have
not made an estimate of the tax impact on
foreign exchange gains/losses. Accordingly
this “Core PATMI w/o Forex (Estimate)” is to
be viewed as an indicative number only.
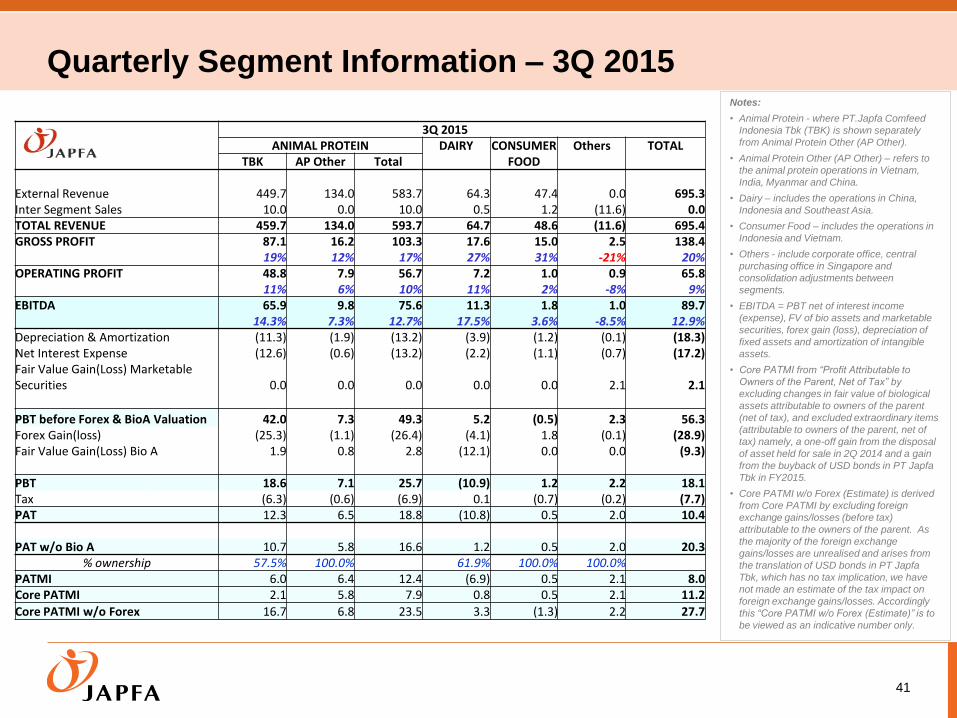
Quarterly Segment Information – 3Q 2015
41
3Q 2015 ANIMAL PROTEIN DAIRY CONSUMER Others TOTAL TBK AP Other Total FOOD
External Revenue 449.7 134.0 583.7 64.3 47.4 0.0 695.3 Inter Segment Sales 10.0 0.0 10.0 0.5 1.2 (11.6) 0.0 TOTAL REVENUE 459.7 134.0 593.7 64.7 48.6 (11.6) 695.4 GROSS PROFIT 87.1 16.2 103.3 17.6 15.0 2.5 138.4 19% 12% 17% 27% 31% -21% 20% OPERATING PROFIT 48.8 7.9 56.7 7.2 1.0 0.9 65.8 11% 6% 10% 11% 2% -8% 9% EBITDA 65.9 9.8 75.6 11.3 1.8 1.0 89.7 14.3% 7.3% 12.7% 17.5% 3.6% -8.5% 12.9% Depreciation & Amortization (11.3) (1.9) (13.2) (3.9) (1.2) (0.1) (18.3) Net Interest Expense (12.6) (0.6) (13.2) (2.2) (1.1) (0.7) (17.2) Fair Value Gain(Loss) Marketable Securities 0.0 0.0 0.0 0.0 0.0 2.1 2.1
PBT before Forex & BioA Valuation 42.0 7.3 49.3 5.2 (0.5) 2.3 56.3 Forex Gain(loss) (25.3) (1.1) (26.4) (4.1) 1.8 (0.1) (28.9) Fair Value Gain(Loss) Bio A 1.9 0.8 2.8 (12.1) 0.0 0.0 (9.3) PBT 18.6 7.1 25.7 (10.9) 1.2 2.2 18.1 Tax (6.3) (0.6) (6.9) 0.1 (0.7) (0.2) (7.7) PAT 12.3 6.5 18.8 (10.8) 0.5 2.0 10.4 PAT w/o Bio A 10.7 5.8 16.6 1.2 0.5 2.0 20.3 % ownership 57.5% 100.0% 61.9% 100.0% 100.0% PATMI 6.0 6.4 12.4 (6.9) 0.5 2.1 8.0 Core PATMI 2.1 5.8 7.9 0.8 0.5 2.1 11.2
Core PATMI w/o Forex 16.7 6.8 23.5 3.3 (1.3) 2.2 27.7
Notes:
• Animal Protein - where PT.Japfa Comfeed
Indonesia Tbk (TBK) is shown separately
from Animal Protein Other (AP Other).
• Animal Protein Other (AP Other) – refers to
the animal protein operations in Vietnam,
India, Myanmar and China.
• Dairy – includes the operations in China,
Indonesia and Southeast Asia.
• Consumer Food – includes the operations in
Indonesia and Vietnam.
• Others - include corporate office, central
purchasing office in Singapore and
consolidation adjustments between
segments.
• EBITDA = PBT net of interest income
(expense), FV of bio assets and marketable
securities, forex gain (loss), depreciation of
fixed assets and amortization of intangible
assets.
• Core PATMI from “Profit Attributable to
Owners of the Parent, Net of Tax” by
excluding changes in fair value of biological
assets attributable to owners of the parent
(net of tax), and excluded extraordinary items
(attributable to owners of the parent, net of
tax) namely, a one-off gain from the disposal
of asset held for sale in 2Q 2014 and a gain
from the buyback of USD bonds in PT Japfa
Tbk in FY2015.
• Core PATMI w/o Forex (Estimate) is derived
from Core PATMI by excluding foreign
exchange gains/losses (before tax)
attributable to the owners of the parent. As
the majority of the foreign exchange
gains/losses are unrealised and arises from
the translation of USD bonds in PT Japfa
Tbk, which has no tax implication, we have
not made an estimate of the tax impact on
foreign exchange gains/losses. Accordingly
this “Core PATMI w/o Forex (Estimate)” is to
be viewed as an indicative number only.

Quarterly Segment Information – 2Q 2015
42
Notes:
• Animal Protein - where PT.Japfa Comfeed
Indonesia Tbk (TBK) is shown separately
from Animal Protein Other (AP Other).
• Animal Protein Other (AP Other) – refers to
the animal protein operations in Vietnam,
India, Myanmar and China.
• Dairy – includes the operations in China,
Indonesia and Southeast Asia.
• Consumer Food – includes the operations in
Indonesia and Vietnam.
• Others - include corporate office, central
purchasing office in Singapore and
consolidation adjustments between
segments.
• EBITDA = PBT net of interest income
(expense), FV of bio assets and marketable
securities, forex gain (loss), depreciation of
fixed assets and amortization of intangible
assets.
• Core PATMI from “Profit Attributable to
Owners of the Parent, Net of Tax” by
excluding changes in fair value of biological
assets attributable to owners of the parent
(net of tax), and excluded extraordinary items
(attributable to owners of the parent, net of
tax) namely, a one-off gain from the disposal
of asset held for sale in 2Q 2014 and a gain
from the buyback of USD bonds in PT Japfa
Tbk in FY2015.
• Core PATMI w/o Forex (Estimate) is derived
from Core PATMI by excluding foreign
exchange gains/losses (before tax)
attributable to the owners of the parent. As
the majority of the foreign exchange
gains/losses are unrealised and arises from
the translation of USD bonds in PT Japfa
Tbk, which has no tax implication, we have
not made an estimate of the tax impact on
foreign exchange gains/losses. Accordingly
this “Core PATMI w/o Forex (Estimate)” is to
be viewed as an indicative number only.
2Q 2015
ANIMAL PROTEIN DAIRY CONSUMER Others TOTAL
TBK AP Other Total FOOD
External Revenue 462.0 131.7 593.6 64.1 46.6 (0.0) 704.3
Inter Segment Sales 10.5 0.0 10.5 0.6 1.8 (12.9) (0.0)
TOTAL REVENUE 472.4 131.7 604.1 64.6 48.4 (12.9) 704.3
GROSS PROFIT 62.7 19.8 82.6 21.4 15.3 2.6 122.0
13% 15% 14% 33% 32% -20% 17%
OPERATING PROFIT 17.6 11.8 29.5 11.4 2.4 0.8 44.1
4% 9% 5% 18% 5% -6% 6% EBITDA 29.0 13.4 42.4 15.4 3.6 1.1 62.4
6.1% 10.2% 7.0% 23.8% 7.3% -8.6% 8.9%
Depreciation & Amortization (11.4) (1.6) (13.0) (3.9) (1.2) (0.2) (18.2)
Net Interest Expense (13.2) (0.8) (14.0) (2.1) (1.3) (0.5) (18.0)
Fair Value Gain(Loss) Marketable Securities 0.0 0.0 0.0 0.0 0.0 0.7 0.7
PBT before Forex & BioA Valuation 4.4 11.0 15.4 9.4 1.0 1.1 26.9
Forex Gain(loss) (6.8) (0.2) (7.0) 0.6 0.2 0.1 (6.0)
Fair Value Gain(Loss) Bio A (1.3) (4.1) (5.4) (12.1) 0.0 0.0 (17.5)
PBT (3.7) 6.7 3.0 (2.0) 1.2 1.2 3.4 Tax (0.8) (0.8) (1.6) 0.7 (0.9) (0.2) (2.0)
PAT (4.5) 5.9 1.4 (1.3) 0.4 1.1 1.4
PAT w/o Bio A (3.5) 9.1 5.7 10.7 0.4 1.1 17.8 % ownership 57.5% 100.0% 61.9% 100.0% 100.0%
PATMI (3.2) 5.6 2.4 (0.8) 0.4 1.1 3.0
Core PATMI (2.6) 8.8 6.2 6.6 0.4 1.1 14.3
Core PATMI w/o Forex 1.3 9.0 10.3 6.3 0.1 0.9 17.6

Quarterly Segment Information – 1Q 2015
43
Notes:
• Animal Protein - where PT.Japfa Comfeed
Indonesia Tbk (TBK) is shown separately
from Animal Protein Other (AP Other).
• Animal Protein Other (AP Other) – refers to
the animal protein operations in Vietnam,
India, Myanmar and China.
• Dairy – includes the operations in China,
Indonesia and Southeast Asia.
• Consumer Food – includes the operations in
Indonesia and Vietnam.
• Others - include corporate office, central
purchasing office in Singapore and
consolidation adjustments between
segments.
• EBITDA = PBT net of interest income
(expense), FV of bio assets and marketable
securities, forex gain (loss), depreciation of
fixed assets and amortization of intangible
assets.
• Core PATMI from “Profit Attributable to
Owners of the Parent, Net of Tax” by
excluding changes in fair value of biological
assets attributable to owners of the parent
(net of tax), and excluded extraordinary items
(attributable to owners of the parent, net of
tax) namely, a one-off gain from the disposal
of asset held for sale in 2Q 2014 and a gain
from the buyback of USD bonds in PT Japfa
Tbk in FY2015.
• Core PATMI w/o Forex (Estimate) is derived
from Core PATMI by excluding foreign
exchange gains/losses (before tax)
attributable to the owners of the parent. As
the majority of the foreign exchange
gains/losses are unrealised and arises from
the translation of USD bonds in PT Japfa
Tbk, which has no tax implication, we have
not made an estimate of the tax impact on
foreign exchange gains/losses. Accordingly
this “Core PATMI w/o Forex (Estimate)” is to
be viewed as an indicative number only.
1Q 2015 ANIMAL PROTEIN DAIRY CONSUMER Others TOTAL TBK AP Other Total FOOD
External Revenue 448.1 126.8 574.9 59.8 41.0 0.0 675.7 Inter Segment Sales 10.1 0.0 10.1 0.4 2.0 (12.5) 0.0 TOTAL REVENUE 458.2 126.8 585.0 60.2 43.0 (12.5) 675.7 GROSS PROFIT 52.4 17.1 69.5 22.2 12.6 2.9 107.2 11% 13% 12% 37% 29% -23% 16% OPERATING PROFIT 7.8 9.0 16.9 13.2 0.7 0.6 31.5 2% 7% 3% 22% 2% -5% 5% EBITDA 20.3 10.8 31.1 16.4 2.0 0.8 50.3 4.4% 8.5% 5.3% 27.2% 4.8% -6.5% 7.4% Depreciation & Amortization (11.2) (1.8) (13.0) (3.6) (1.2) (0.2) (18.1) Net Interest Expense (12.0) (0.6) (12.6) (2.4) (1.3) (0.6) (16.9) Fair Value Gain(Loss) Marketable Securities 0.0 0.0 0.0 0.0 0.0 (0.2) (0.2)
PBT before Forex & BioA Valuation (2.9) 8.4 5.5 10.4 (0.5) (0.2) 15.1 Forex Gain(loss) (13.7) (0.1) (13.8) (0.5) 0.8 (0.4) (13.9) Fair Value Gain(Loss) Bio A 0.2 4.9 5.1 2.2 0.0 0.0 7.4 PBT (16.4) 13.2 (3.2) 12.1 0.3 (0.6) 8.6 Tax (0.7) (1.4) (2.2) 0.2 (1.4) (0.2) (3.6) PAT (17.1) 11.8 (5.3) 12.2 (1.1) (0.8) 5.0 PAT w/o Bio A (17.3) 7.9 (9.4) 10.0 (1.1) (0.8) (1.3) % ownership 57.5% 100.0% 61.9% 100.0% 100.0% PATMI (10.2) 11.5 1.3 7.6 (1.1) (0.8) 7.0 Core PATMI (10.3) 7.6 (2.6) 6.2 (1.1) (0.8) 1.6
Core PATMI w/o Forex (2.4) 7.7 5.3 6.5 (1.9) (0.4) 9.5

Quarterly Segment Information – 4Q 2014
44
Notes:
• Animal Protein - where PT.Japfa Comfeed
Indonesia Tbk (TBK) is shown separately
from Animal Protein Other (AP Other).
• Animal Protein Other (AP Other) – refers to
the animal protein operations in Vietnam,
India, Myanmar and China.
• Dairy – includes the operations in China,
Indonesia and Southeast Asia.
• Consumer Food – includes the operations in
Indonesia and Vietnam.
• Others - include corporate office, central
purchasing office in Singapore and
consolidation adjustments between
segments.
• EBITDA = PBT net of interest income
(expense), FV of bio assets and marketable
securities, forex gain (loss), depreciation of
fixed assets and amortization of intangible
assets.
• Core PATMI from “Profit Attributable to
Owners of the Parent, Net of Tax” by
excluding changes in fair value of biological
assets attributable to owners of the parent
(net of tax), and excluded extraordinary items
(attributable to owners of the parent, net of
tax) namely, a one-off gain from the disposal
of asset held for sale in 2Q 2014 and a gain
from the buyback of USD bonds in PT Japfa
Tbk in FY2015.
• Core PATMI w/o Forex (Estimate) is derived
from Core PATMI by excluding foreign
exchange gains/losses (before tax)
attributable to the owners of the parent. As
the majority of the foreign exchange
gains/losses are unrealised and arises from
the translation of USD bonds in PT Japfa
Tbk, which has no tax implication, we have
not made an estimate of the tax impact on
foreign exchange gains/losses. Accordingly
this “Core PATMI w/o Forex (Estimate)” is to
be viewed as an indicative number only.
4Q 2014 ANIMAL PROTEIN DAIRY CONSUMER Others TOTAL TBK AP Other Total FOOD
External Revenue 459.2 139.4 598.6 59.9 46.3 0.6 705.4 Inter Segment Sales 10.2 0.0 10.2 0.5 2.1 (12.8) 0.0 TOTAL REVENUE 469.5 139.4 608.9 60.4 48.3 (12.2) 705.4 GROSS PROFIT 65.8 20.8 86.6 20.9 15.0 3.3 125.8 14% 15% 14% 35% 31% -27% 18% OPERATING PROFIT 21.8 13.8 35.6 9.0 1.8 0.2 46.7 5% 10% 6% 15% 4% -2% 7% EBITDA 33.6 14.7 48.3 11.0 1.9 (0.0) 61.1 7.2% 10.5% 7.9% 18.1% 3.9% 0.2% 8.7% Depreciation & Amortization (11.5) (1.4) (12.9) (3.1) (1.2) 0.3 (16.9) Net Interest Expense (14.5) (0.7) (15.2) (2.2) (1.5) (0.8) (19.6) Fair Value Gain(Loss) Marketable Securities 0.0 0.0 0.0 0.0 0.0 (0.2) (0.2) PBT before Forex & BioA Valuation 7.6 12.6 20.1 5.7 (0.7) (0.7) 24.4 Forex Gain(loss) (4.6) (0.2) (4.8) 0.3 0.1 (0.2) (4.6) Fair Value Gain(Loss) Bio A (2.5) (19.7) (22.2) (12.8) 0.0 0.0 (35.0) PBT 0.4 (7.3) (6.9) (6.8) (0.6) (0.9) (15.3) Tax (2.8) 4.9 2.1 0.4 (3.5) (0.3) (1.2) PAT (2.4) (2.4) (4.7) (6.4) (4.1) (1.2) (16.5) PAT w/o Bio A (0.3) 13.0 12.6 6.2 (4.1) (1.2) 13.5 % ownership 57.5% 100.0% 61.9% 100.0% 100.0% PATMI (1.3) (3.0) (4.3) (3.9) (4.4) (1.2) (13.9) Core PATMI (0.2) 12.4 12.2 3.9 (4.4) (1.2) 10.4 Core PATMI w/o Forex 2.4 12.6 15.0 3.7 (4.5) (1.0) 13.2
Thank You


