Dysplastic haemopoiesisPeripheral cytopeniasNo expansion of blasts
Dysplastic haemopoiesisPeripheral cytopeniasExpansion of blasts
Progress
AML = acute myeloid leukaemia. W.K.Hoffman / with permission /
Who should be treated ?Who should be treated ?
Prognostic factors :- traditional- traditional- new
5/15/2012
3
FAB classification
MDS subtype
Blast percentageAdditional features
AML transformation (%)Peripheral
bl t (%)Bone marrow
bl t (%)blasts (%) blasts (%)
RA Refractory anaemia ≤ 1 < 5 10–20
RARSRA with ringed sideroblasts
≤ 1 < 5> 15% ringed sideroblasts in bone marrow
10–35
RAEBRA with excess
blasts< 5 5–20 > 50
Bennett JM, et al. Br J Haematol. 1982;51:189‐99.
RAEB-TRAEB in
transformation≥ 5 21–29
Optional Auer rods
60–100
CMMLChronic
myelomonocyticleukaemia
< 5 ≤ 20Peripheral
monocytosis (> 103/µL)
> 40
Prognostic factors / traditionalFAB - 1992
5/15/2012
4
International Prognostic Scoring System (IPSS)
Score
0 0 5 1 0 1 5 2 00 0.5 1.0 1.5 2.0
Medullary blasts (%) < 5 5–10 – 11–20 21–30
Karyotype Good* Intermediate† Poor‡ – –
Cytopenia 0/1 2/3 – – –
Low risk 0 pointsp
Intermediate‐1 risk 0.5–1.0 points
Intermediate‐2 risk 1.5–2.0 points
High risk ≥ 2.5 points
Greenberg P, et al. Blood. 1997;89:2079‐88.
*Good: normal, ‐Y, del(5q), del(20q).†Intermediate: other abnormalities not seen in “good” or “poor”. ‡Poor: complex (≥ 3 abnormalities) or chromosome 7 anomalies.
Prognostic factors / traditionalIPSS - 1997
5/15/2012
5
Prognostic factors / traditionalWHO - 2001
5/15/2012
6
Score
Prognostic Variable
1 2 3
WHO Classification-Based Prognostic Scoring System (WPSS)
Intermediate: other abnormalities Malcovati L et al, JCO, 25(23), 2007:3503‐351
Very low risk 0 pointsLow risk 1 pointsIntermediate 2 pointsHigh risk 3–4 pointsVery high risk 5–6 points
Prognostic factors / traditionalWPSS - 2007
5/15/2012
7
New prognostic factors
Revised cytogenetics,molecular cytogenetics
Revised IPSS
MDS
Molecular biology
Flow cytometry
New prognostic cytogenetic scoring system
Very goodn = 81 (2.9%)
Goodn = 1,809 (65.7%)
Intermediaten = 529 (19.2%)
Poorn = 148 (5.4%)
Very poorn = 187 (6.8%)
Single
del(11q)
−Y
Normal
Single
del(5q)
del(12p)
del(20q)
Single
del(7q)
+8
i(17q)
+19
any others
indep. clones
Single
der(3q)
−7
Double
incl. −7/7q−
Complex
Complex
> 3 abnormalities
Double
incl. del(5q)Double
any other
Complex
3 abnormalities
Schanz J, et al. J Clin Oncol. 2011;29:1963‐70.
60,8 48,5 25,0 15,0 5,7
Overall survival(months)
5/15/2012
8
Molecular cytogenetics
• No significant differencegin overall survival andprogression free survivalin patients withkaryotype abnormalitiesdiagnosed either by :
chromosomal bandingchromosomal bandingor
molecular cytogenetics
Tiu R V et al. Blood 2011;117:4552-4560
SNP microarray based karyotyping in MDS
5/15/2012
9
SNP array analysis – impact on outcome
High density SNP arrays have facilitated the detection of cryptic chromosomal aberrations(75% of MDS and AML have abnormal cytogenetics by SNP array) and are of prognostic importance but need to be evaluated in large prospective studies
Next generation sequencing in MDS
Mutated gene
No. of samples
Median survival (95% CI) (year)
p value
All samples 439 (100) 1.86 (1.60–2.14)
Hazard Ratios for Death in a Multivariable Model.*
Mutational statusp ( ) ( )
TET2 90 (20.5) 1.88 (1.26–2.55) 0.48
ASXL1 63(14.4) 1.33 (0.96–1.88) 0.003
RUNX1 38 (8.7) 1.16 (0.77–1.53) < 0.001
TP53 33 (7.5) 0.65 (0.44–1.10) < 0.001
EZH2 28 (6.4) 0.79 (0.67–1.40) < 0.001
NRAS 16 (3.6) 1.03 (0.44–1.98) 0.006
JAK2 13 (3.0) 2.14 (1.02–3.12) 0.96
ETV6 12 (2.7) 0.83 (0.62–2.29) 0.04
CBL 10 (2.3) 1.52 (0.14–1.71) 0.02
IDH2 9 (2 1) 1 58 (0 50–2 14) 0 03
TP53 mutation present vs. absent 2.48 (1.60–3.84) <0.001EZH2 mutation present vs. absent 2.13 (1.36–3.33) <0.001ETV6 mutation present vs. absent 2.04 (1.08–3.86) 0.03RUNX1 mutation present vs. absent 1.47 (1.01–2.15) 0.047ASXL1 mutation present vs. absent 1.38 (1.00–1.89) 0.049
Somatic point mutations are common in myelodysplastic syndromes and are associated with specific clinical features.IDH2 9 (2.1) 1.58 (0.50–2.14) 0.03
NPM1 8 (1.8) 2.18 (0.59–2.74) 0.43
IDH1 6 (1.4) 3.30 (0.35–9.52) 0.52
KRAS 4 (0.9) 0.89 (0.36–7.44) 0.54
GNAS 3 (0.7)
PTPN11 3 (0.7)
BRAF 2 (0.5)
PTEN 1 (0.2)
CDKN2A 1 (0.2)
associated with specific clinical features.
Mutations in TP53, EZH2, ETV6, RUNX1, andASXL1 are predictors of poor overall survival in patients with myelodysplastic syndromes,independently of established risk factors.
Bejar R, et al. N Engl J Med 2011;364:2496‐506.
5/15/2012
10
Flow cytometry
Aberrant flow cytometry patterns well correlate with morphology, subclassificationof MDS and with prognostic systems, but prospective validation of the impact ofimmunophenotypic patterns is necessarry.
Loosdrecht et al., Haematologica 2008
Revised IPSS ( IPSS-R )• 7012 patients with primary MDS from 11 countries• Significant parameters for prognostic classification :
Hb, WBC, PLT (depth of cytopenias)new prognostic cytogenetic system (5 subgroups)percentage of bone marrow blastspercentage of bone marrow blasts
5 different prognostic subgroupssurvival leukemic transformation
P.Greenberg – with permission
5/15/2012
11
Conclusions :• all „traditional“ prognostic systems :
a significant difference in overall survival and riskof leukemic transformation between :very low, low, intermediate‐1 andintermediate‐2, high, very high subgroups.
• new prognostic parameters :may have a significant prognostic impactmay have a significant prognostic impact(SNP arrays, next generations sequencing ofgene mutations, FCM) but their impact needsto be validated.
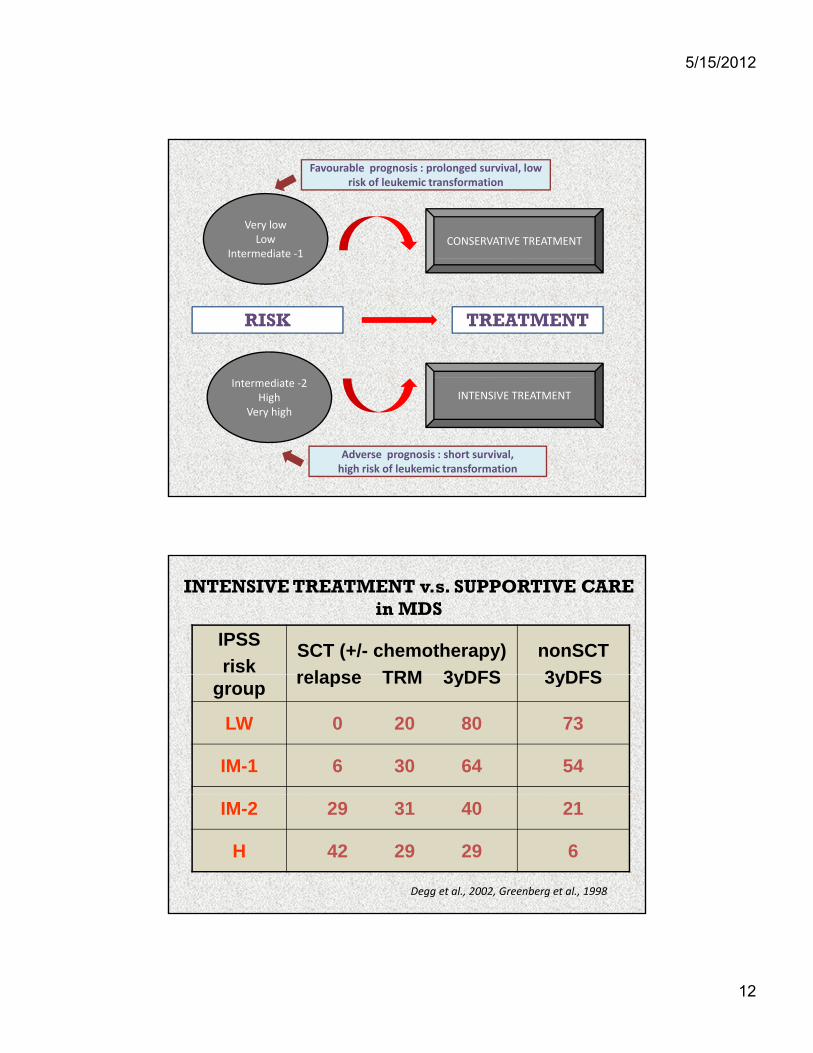
When should we treat ?
5/15/2012
12
Very lowLow
Intermediate ‐1CONSERVATIVE TREATMENT
Favourable prognosis : prolonged survival, lowrisk of leukemic transformation
RISK TREATMENT
Intermediate ‐2High
Very high
INTENSIVE TREATMENT
Adverse prognosis : short survival, high risk of leukemic transformation
IPSS
risk SCT (+/- chemotherapy)
relapse TRM 3yDFS
nonSCT
3yDFS
INTENSIVE TREATMENT v.s. SUPPORTIVE CAREin MDS
grouprelapse TRM 3yDFS 3yDFS
LW 0 20 80 73
IM-1 6 30 64 54
IM-2 29 31 40 21
H 42 29 29 6
Degg et al., 2002, Greenberg et al., 1998
5/15/2012
13
How should we treat ?
Control and modification of behaviour Eradication of the clone
of the clone
NON‐INTENSIVETREATMENT
INTENSIVETREATMENT
RBC and PLT transfusionschelation
growth factorsimmune supression
hypomethylating agents
chemotherapystem cell
transplantation
5/15/2012
14
Non-intensive treatment :correction of cytopenia
• RBC and PLT transfusions
0-1
0
1 2
2-3
>3
44 % of MDS patients2 TU of RBC
1-2
Iron overload – the most serious consequence ofrepeated RBC transfusions
only 14% of patients 0 TU of RBC
Chelation treatment
• Removal of existing iron surplus from the body• Prevention of iron overload in MDS patients
• Who should be treated with chelators ?- no definitive consensus- patients with serum ferritin > 1000-1500 μg/l- patients who received > 20-25 TU of RBC- measurement of NMR of heart using T2* - probably the
best estimation of organ iron stores
• Who should receive chelators as a prophylaxis ?- patients with isolated erythroid dysplasia receiving > 2
TU of RBC/month- presence of comorbidities (coronary disease, rheumatic
disease) significantly increases risk of iron overload
5/15/2012
15
• Deferasirox- first line treatment of iron overloaded MDS patients- effectively decreases toxic iron (LPI level)y ( )- less effective than deferiprone in removal of iron from myocardium- chelation may lead to improvement in blood cell counts, ? improvement in survival
• Deferipronenot routinely used in MDS patients (risk of- not routinely used in MDS patients (risk of
granulocytopenia)- alternative treatment for patients not indicatedfor deferasirox (adverse effects, renalinsufficiency)
Non-intensive treatment : Erythropoietin (EPO)
MDSi h
Probability of erythroid response
Score: 0
Score: 1
74%
23%
High
Intermediate
Score
Serum EPO (U/L)
< 500 U/L 0
500 U/L 1
Transfusion requirement
< 2 pRBC per month
0
2 pRBC per month
1
Score: 2 7% Low
Hellström‐Lindberg E, et al. Br J Haematol. 1997;99:344‐51. Jädersten M,et al. Blood 2005;106 :803‐811.
per month
EPO may be combined with G‐CSF for treating anemia and granulocytopeniaAdministration of EPO may be connected with prolonged overall survival.
5/15/2012
16
Non-intensive treatment : Immune suppression
• Total of 88 patients with MDS
R d i d t i l
ATG+CSA
BSC
Crossovere
1.0
0.8• Randomized trial
– 45 patients with ATG+CSA
– 43 patients with BSC (RBC; Epo)
• Response rates
– ATG+CSA: 13/45 (29%)
– BSC: 4/43 (9%)
Proportion remaining alive
0.6
0.4
0.0
0.2
0 1 2 3 4 5 6 7
Indication for immunosuppressive treatment :requested criteria – LW or IM‐1 IPSS score, patients
who are indicated for treatment but not eligible forSCT.recommended criteria – hypoplastic MDS, HLA‐Dr
15, PNH like MDS
• Overall survival at 2 years
– ATG+CSA: 49%
– BSC: 63%
– p = 0.828
Passweg JR, et al. J Clin Oncol. 2011;29:303‐9.BSC = best standard of care; OS = overall survival.
Time from randomization (years)
Non-intensive treatment : Lenalidomide
PATHOGENESIS OF 5q‐ syndrome
Jädersten et al.,Haematologica 2010; 85, 328‐581.
Lenalidomide in del 5q : reversion of SPARC gene function, ↑ expression of miRNA 145, miRNA 156a.stimulation of Cdc25c, PPAcα (regulation of cell cycle)
Degg et. al. (2005), Sierra et al. (2002), Martino et al. (2005), Mufti et al. (2005).
5/15/2012
23
Conclusions• Percentage of bone marrow blasts and karyotypeabnormities are still the most important prognosticfactors in MDS patients and play the most importantl i th t t t d i i (i t irole in the treatment decision (intensive v.s.
conservative approach)
• Stem cell transplantation still represents the onlycurative treatment in MDS
• New factors e.g. molecular genetics changes may affectprognosis and choice of the appropriate treatmentprognosis and choice of the appropriate treatment
• New drugs targeting the molecular basis of the disease(e.g. hypomethylating agents) represent promisingtherapeutic modalities in MDS.