28
State of Kansas Background Radiation Study Jason Meinholdt, Mark Ungerer, James Uhlemeyer, David Lawrenz Radiation Control Program January 2017

State of Kansas Background Radiation Study
Jason Meinholdt, Mark Ungerer, James Uhlemeyer, David Lawrenz
Radiation Control Program
January 2017

Contents State of Kansas Background Radiation Survey .............................................................................................. 3
Abstract ......................................................................................................................................................... 3
Acknowledgment .......................................................................................................................................... 3
Introduction .................................................................................................................................................. 3
Methods ........................................................................................................................................................ 4
Sampling Plan ............................................................................................................................................ 4
Gamma Exposure Rate Measurements .................................................................................................... 4
Soil Sample Collection ............................................................................................................................... 5
Results ........................................................................................................................................................... 5
Gamma Exposure Rates ............................................................................................................................ 5
Radionuclide Activities in Soil ................................................................................................................... 6
Discussion...................................................................................................................................................... 6
Gamma Exposure Rates ............................................................................................................................ 6
Isotopic Distribution of Radionuclides in Soil ........................................................................................... 7
Uranium Concentration ............................................................................................................................ 7
Radon Source ............................................................................................................................................ 8
Summary ....................................................................................................................................................... 8
References .................................................................................................................................................... 9
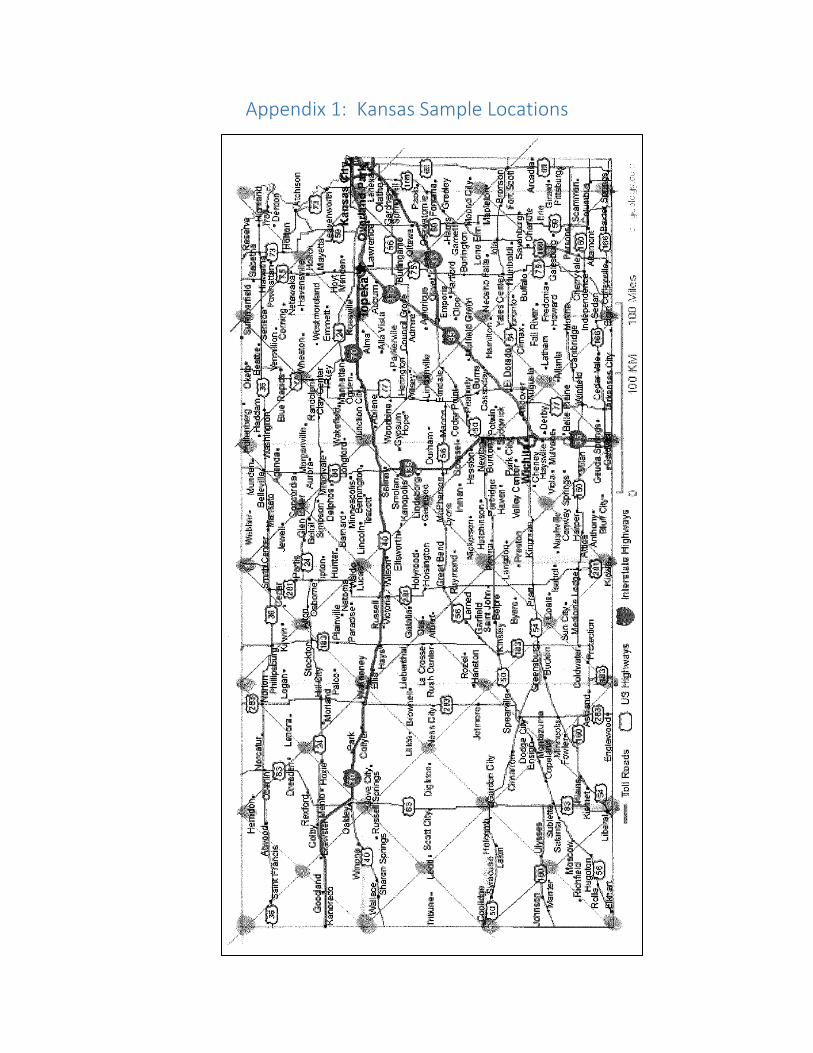
Appendix 1: Kansas Sample Locations ....................................................................................................... 10
Appendix 2: RadResponder Sampling Location Map .................................................................................. 11
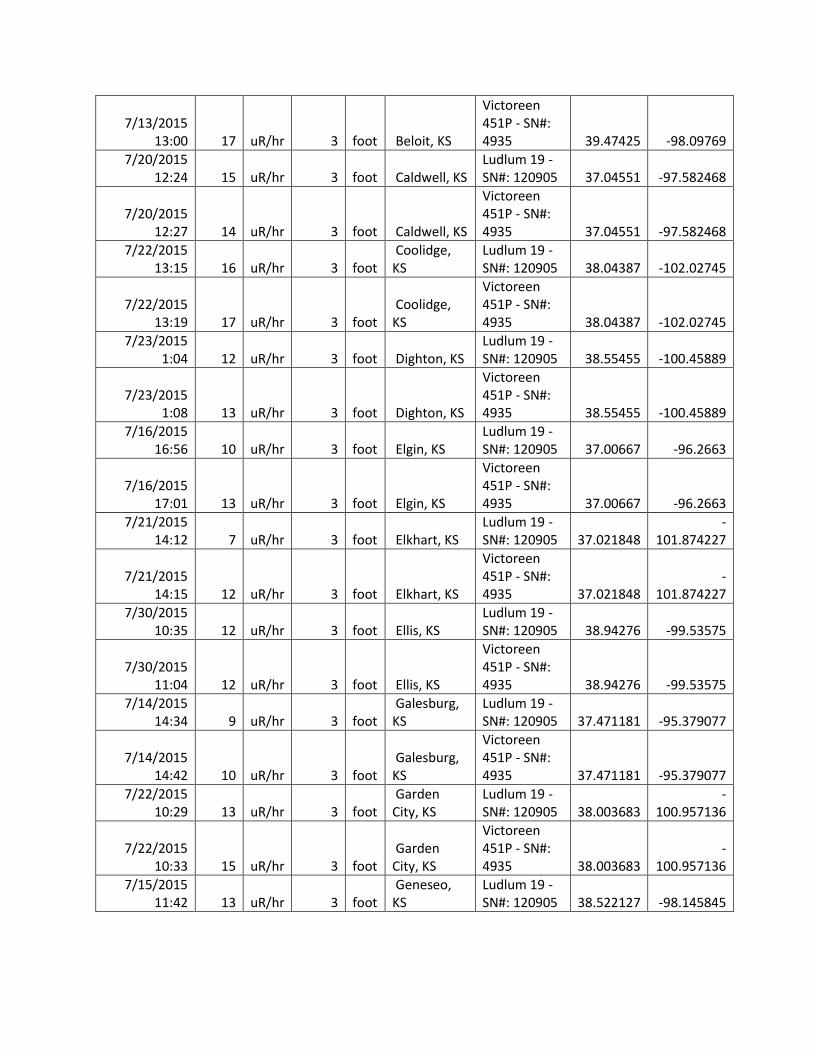
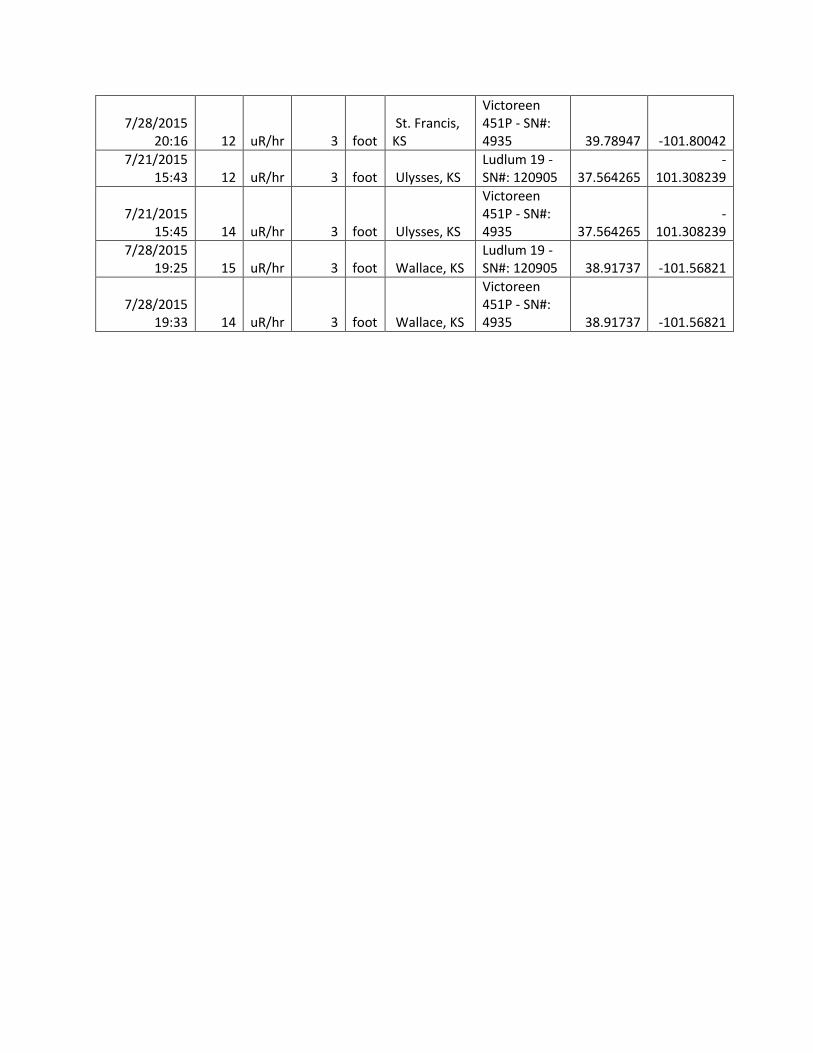
Appendix 3: Gamma Exposure Rate Data Table ......................................................................................... 12
Appendix 4: Gamma Exposure Rate Maps .................................................................................................. 18
Appendix 5: Radionuclide Activities with Exposure Rate ........................................................................... 19
Appendix 6: Uranium Concentration Maps ................................................................................................ 24
Appendix 7: Uranium Concentration with Exposure Rate .......................................................................... 25
Appendix 8: Effect of Elevation on Exposure Rates .................................................................................... 26
Appendix 9: Kansas Radon Maps ................................................................................................................ 27

State of Kansas Background Radiation Survey
Abstract The Kansas Department of Health and Environment’s Radiation Control Program (RCP), in conjunction
with the Kansas Environmental Public Health Tracking program (EPHT) collaborated on a radiological
data collection project for the state of Kansas in July 2015 to address an identified data gap in
background radiation knowledge related to natural background radiation. The data acquired is based on
measurements for gamma radiation measurements and laboratory analysis of uranium, thorium, and
radium activities in soil. The purpose for the collection of measurements and soil gamma spectroscopy
analysis results were to establish a baseline dataset. In the future, this dataset can be used in the event
of a radiological emergency, for regulatory purposes, or risk evaluation.
Acknowledgment This report was supported by many. We thank Jason Barney and D. Shay Hannah for assistance with
coordinating the sample collection process and instrument expertise. This would not have been
possible without Benjamin McCaffrey for his professional work collecting measurements and samples
across the state. We also thank everyone at the Iowa State Hygienic Radiochemistry Laboratory for their
expedient and high quality laboratory analysis. Most of all, Kimberly Steves, Jessica Willard, and their
respective departments are appreciated for supporting this project from the beginning.
Introduction The Kansas Department of Health and Environment routinely receives requests for information
regarding radiation risk from the general public. Previously the relevant data available came from the
United States Geological Society (USGS) background radiation maps for gamma radiation, uranium
concentrations, and thorium concentrations, which were likely generated from models based on flyover
spectrometer data and not from actual samples or ground level surveys (Duval, Carson, Holman,
Darnley, 2005). More exposure hazard information and specific radiation data was necessary to be able
to adequately answer their questions. This type of data would also be informative when conducting
environmental public health investigations. Therefore, the Kansas Radiation Control Program partnered
with the Kansas Environmental Public Health Tracking program to fund, support, analyze, and display
data for the background radiation project. Radiological data across the state of Kansas was collected to
establish a current baseline dataset for background radiation.
This project and resulting article was supported by the cooperative agreement number, NU38EH000618-
08, funded by the Centers for Disease Control and Prevention. Its contents are solely the responsibility
of the authors and do not necessarily represent the official views of the Centers for Disease Control and
Prevention or the Department of Health and Human Services.
The initial purpose of the project was to establish a baseline data set based on ground measurements for background gamma radiation levels and for uranium, thorium, and radium activities in the soil. Forty-seven sampling sites were selected to cover the state in a grid pattern. Sample locations were chosen where the soil had not been disturbed. The collection procedure was the same one utilized by the nuclear power plant environmental monitoring program within the state. Samples and survey data were collected from all the sites in 2015 and sent to a radiochemistry laboratory for analysis.

Information that was collected during and after sampling was uploaded into a system called RadResponder (www.radresponder.net), which is utilized by the Kansas Radiation Control Program for data aggregation and emergency preparedness activities. The RadResponder Network was created to support radiological response and has also served as a valuable tool for data management and quality control. Radiation Control Program staff are able to collect additional gamma radiation readings in the future to add to the database. Analysis has been conducted and shows that gamma exposure rate data is consistent with trends depicted in the USGS terrestrial gamma ray map (Duval et al., 2005) in that exposure rates are higher towards the western half of the state. In addition to the exposure rate data, soil analysis shows that radionuclide activities are largely consistent with both the Oak Ridge National Laboratory study ORNL/TM-7343 (Myrick, Berven, Haywood, 1981), and the extensive data collected in Kansas due to nuclear power plant environmental monitoring. When comparing exposure rate data to specific radionuclide activities identified, there is no evidence to confirm correlation between any single radionuclide and overall gamma exposure rate.
Methods
Sampling Plan The state was divided into a grid to identify an even distribution of samplings points. The grid was
chosen as it corresponded well with existing roads and nearby communities. At each of the locations
identified, undisturbed areas were selected. A map was created to identify locations (Appendix 1). The
sampled locations are listed in Table 1:
Holton Highland Seneca Alma Olathe Ottawa Mapleton Hamilton
Belleville Randolph Beloit Baxter Springs
Galesburg Geneseo Newton Plevna
Lucas Caldwell Kiowa Kingman Greensburg Protection Liberal Elkhart
Garden City
Coolidge Leoti Dighton Hanston Otis Alton Smith Center
Wallace Goodland St. Francis
Atwood Hoxie Ellis Admire Atlanta
Abilene Lincolnville Norton Oakley Ulysses Montezuma Elgin
Table 1: Sampling Locations
Gamma Exposure Rate Measurements Exposure rate measurements were taken using two instruments; a NaL Micro-R meter (Ludlum Model
19) and a pressurized ion chamber (Victoreen 451P). Gamma readings were taken three feet above the
ground surface prior to soil sampling. Instruments remained consistent throughout the data collection
period and had recent calibration reports. For data analysis purposes, the exposure rates from the
Ludlum Model 19 Micro-R meter were used. Each of the instruments were calibrated and read in
conventional units and were converted to the International System of Units (SI) mathematically. Data
was logged using the RadResponder Network application on an iPad (Appendix 2). Date, time, GPS

coordinates, meter information, height, observations, and measurement data were uploaded into
RadResponder during collections to ensure consistent data throughout the process. The RadResponder
Network is the product of collaboration between Federal Emergency Management Agency (FEMA),
Department of Energy (DOE) / National Nuclear Security Administration (NNSA), and the Environmental
Protection Agency (EPA).
Soil Sample Collection Surficial soil samples of 1000 cm3 were collected at each location. Samples were contained in
chemically resistant polypropylene containers with matching airtight lids. Undisturbed (no visual signs
of soil disturbance and away from any roadways or buildings) locations were selected. Supplies were
decontaminated after each sample to prevent cross contamination. To allow secular equilibrium to be
reached, samples remained sealed for a minimum of 60 days (Figure 1). The samples were then sent to
the Iowa State Hygienic Laboratory for analysis by both gamma spectroscopy and by inductively coupled
plasma – mass spectrometry (ICP-MS) for uranium content. Sample results were reported in
conventional units (pCi/kg) and converted to SI units mathematically. Both man-made and naturally
occurring radionuclides were analyzed, but only those naturally occurring will be discussed in this
report. Those radionuclides include: Actinium-228, Bismuth-212, Bismuth-214, Lead-212, Lead-214,
Radium-224, Thorium-228, and Potassium-40.
𝑡𝑚𝑎𝑥 =
ln (𝛌𝒅
𝛌𝒑)
𝛌𝑑 − 𝛌𝑝
where λp = decay constant of parent; and λd = decay constant of daughter
Figure1: Equation to calculate time to reach max activity of radioactive daughter
Results
Gamma Exposure Rates The Ludlum Model 19 Micro-R meter results ranged from 0.07 to 0.16 μSv/hr (7 to 16 μR/hr). The
statewide average gamma exposure rate using the Ludlum Model 19 Micro-R meter was 0.12 μSv/hr (12
μR/hr). The Victoreen 451P pressurized ion chamber results ranged from 0.10 to 0.18 μSv/hr (10 to 18
μR/hr) with higher readings found in the north central area of the state. The statewide average gamma
exposure rate using the Victoreen 451P pressurized ion chamber was 0.142 μSv/hr (14.2 μR/hr).
Locations measured were logged in RadResponder (Appendix 2).
Exposure rate data tables can be found in Appendix 3. Heat maps of exposure rate readings can be
found in Appendix 4.

Radionuclide Activities in Soil Soil sample analysis resulted in ranges of activities for each nuclide depending on location. In addition
to gamma spectroscopy analysis, each sample was analyzed for uranium content by ICP-MS. Results are
listed in Table 2:
Nuclide Minimum Maximum Unit Minimum Maximum Unit
Actinium-228 15.98 ± 2.07 60.31 ± 5.85 Bq/kg 432 ± 56.2 1630 ± 158 pCi/kg
Bismuth-212 >4.221 141.71 ± 5.85 Bq/kg >1141 3830 ± 158 pCi/kg
Bismuth-214 13.76 ± 1.31 78.07 ± 4.55 Bq/kg 372 ± 35.4 2110 ± 123 pCi/kg
Lead-212 >0.721 54.02 ± 2.58 Bq/kg >19.51 1460 ± 69.8 pCi/kg
Lead-214 15.65 ± 1.26 90.28 ± 4.92 Bq/kg 423 ± 34.1 2440 ± 133 pCi/kg
Radium-224 12.77 ± 6.51 51.8 ± 13.84 Bq/kg 345 ± 176 1400 ± 374 pCi/kg
Thorium-228 >18.321 131.35 ± 43.66 Bq/kg >4951 3550 ± 1180 pCi/kg
Potassium-40 61.42 ± 31.60 795.5 ± 37.37 Bq/kg 1660 ± 854 21500 ± 1010 pCi/kg
Uranium content 0.64 3.30 mg/kg 0.64 3.30 ppm 1minimum detectable concentration
Table 2: Minimum and Maximum Radionuclide Activity Found in Soil
Discussion
Gamma Exposure Rates The Ludlum Model 19 Micro-R meter showed high readings further west, as expected due to geology
and elevation. The Victoreen 451P pressurized ion chamber showed higher readings in the north central
area of the state. The Oak Ridge National Laboratory Study (Myrick et al., 1981) found higher exposure
rate readings in western Kansas, ranging from 0.14 μSv/hr (14 μR/hr) at the furthest location to the west
and 0.098 μSv/hr (9.8 μR/hr) furthest to the east. The ORNL study was limited to points along Interstate
70. The USGS terrestrial radiation report (Duval et al., 2005) shows gamma-ray absorbed dose to be
highest in the northern and western part of the state, consistent with the measurements from the
Ludlum Model 19 Micro-R meter, but differing from those using the Victoreen 451P pressurized ion
chamber. This could be due to different energy response between the instruments.
In an effort to quantify the effect of cosmic radiation on exposure rates, a correlation coefficient was
calculated based on elevation change throughout the state (Appendix 8). A weak correlation coefficient
of 0.3945 was found.

Isotopic Distribution of Radionuclides in Soil Although not directly measured using gamma spectroscopy, it can
be inferred that Radium-226 is in equilibrium with Bismuth-214 due
to the time allowed to reach secular equilibrium (Figure 2). The
activity of Radium-226 in the soil is consistent with that
documented in the ORNL TM-7343 study (Myrick et al., 1981). Their
results showed Radium-226 in activities from 12.58 to 51.8 Bq/kg
(340 to 1400 pCi/kg) whereas the current study showed activities
from 13.76 to 78.07 Bq/kg (372 to 2110 pCi/kg). Using the soil
sample analysis results combined with exposure rate data across the
state, correlation with these naturally occurring radionuclides could
be measured. Using the data collected of all naturally occurring
radionuclides, an overlay of the data was created with isotopic
concentrations to determine potential correlation with exposure
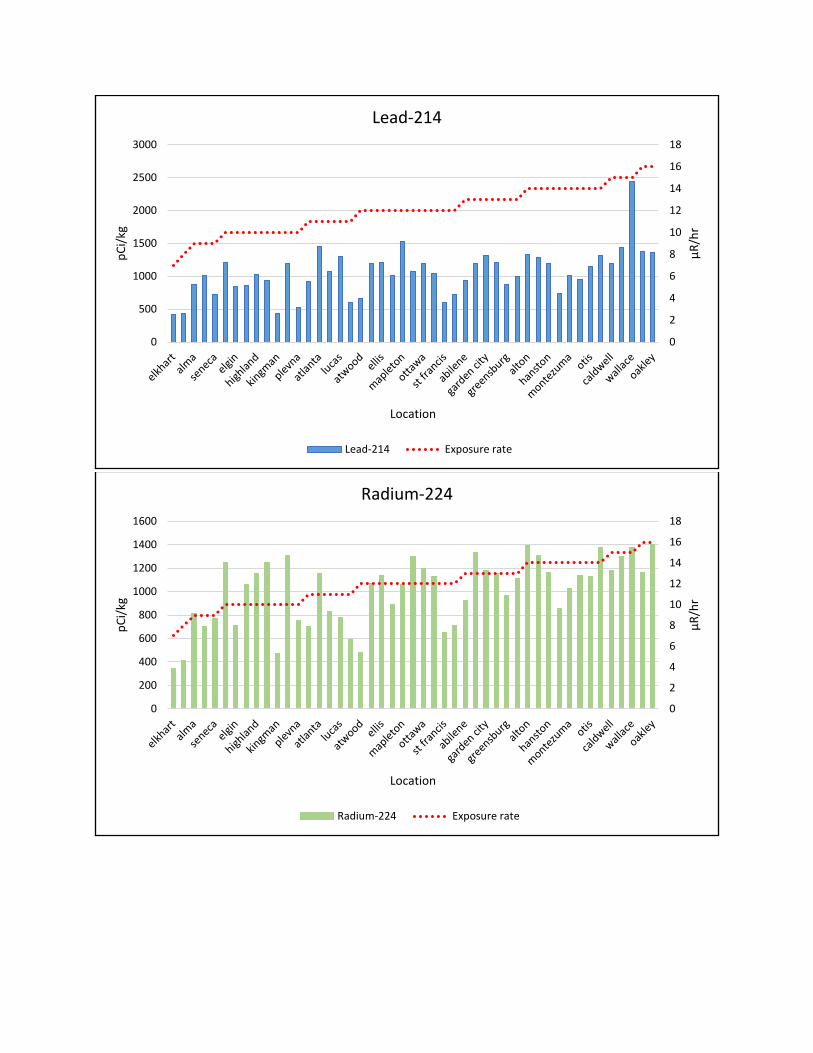
rate measurements (Appendix 5). No specific radionuclide had a
strong correlation with exposure rates, however, there is a
correlation between the summation of all natural radionuclides
measured and exposure rate at any given location. A scatter plot
was created showing this correlation (Appendix 5). Other factors
contribute to gamma exposure rates at three feet above the ground,
such as cosmic radiation or non-naturally occurring radionuclides.
Correlation coefficients are listed in Table 3:
Radionuclide Correlation coefficient
Actinium-228 0.6579
Bismuth-212 0.031
Bismuth-214 0.5792
Lead-212 0.6034
Lead-214 0.5735
Radium-224 0.6204
Thorium-228 0.3001
Potassium-40 0.6158
Uranium content 0.2012
Summation of all natural radionuclides 0.7705 Table 3: Correlation coefficients of radionuclides and exposure rates
Uranium Concentration The pattern for both exposure rate measurements and soil analysis data is consistent with previous
Kansas data from both the ORNL TM-7343 study (Myrick et al., 1981) and USGS flyover gamma-ray
exposure data (Duval et al., 2005). In addition, uranium concentration data collected by the USGS in the
aforementioned study is comparable to the results found in the current study. The USGS study shows
concentrations of uranium across the state ranging from approximately 0.7 ppm to 3.0 ppm. For this
study, samples ranged from 0.64 mg/kg (equivalent to ppm by mass) to 3.3 mg/kg (Appendix 6). The
average concentration across the state was 1.82 mg/kg. Using the uranium concentration data per
Figure 2: Decay Chain of Radium-226

location, we were also able to make direct comparisons to exposure rate measurements at each
location. Uranium concentration showed little correlation with the gamma exposure rate at three feet
with a correlation coefficient of 0.2012 (Appendix 7).
Radon Source Soil analyses may indicate if there are locations that are more or less likely to have radon concentrations
in the soil. As noted by the Environmental Protection Agency (EPA), most of Kansas is determined to be
in radon zone 1, which is the zone predicted to have average indoor radon concentration levels of
greater than 4.0 pCi/L (White, 1993). The Kansas Radon Program has determined that 42.6% of homes
tested in Kansas have high levels of Radon. (www.kansasradonprogram.org)
Radon is the decay product of Radium-226. Because of the decay of Radium-226 into Radon-222 gas, it
can reasonably be inferred that locations with higher activities of Radium-226 have greater potential for
radon emanation (White, 1993). As many factors contribute to the potential for elevated indoor radon
levels in homes, such as building design, air tightness, heating and cooling systems, and weather, data
collected during this study cannot be used as a predictor of elevated indoor radon levels. Maps
produced using this data show the amount of source activity of the radioactive parent of Radon-222 in
each of the samples collected. A map showing the activity of Bismuth-214 (in equilibrium with Radium-
226) can be found in Appendix 9 along with maps produced by the Kansas Geological Survey and the
Kansas Department of Health and Environment Environmental Public Health Tracking Network. The
Kansas County Radon Map from the Kansas Radon Program is also included based on EPA zone levels
and actual indoor radon measurements across the state.
Summary This study comprised the collection of radiation data at 47 undisturbed locations evenly distributed
across the state of Kansas. In addition to the data collected specifically for this study, additional data
points can be collected by the Radiation Control Program during field activities for dataset expansion
and future research. The data obtained is consistent with previous conclusions from ORNL and USGS
regarding background gamma ray exposure data based on a much smaller sample size. The gridded
sampling locations across the state provides a comprehensive picture of background radiation.
Although slight correlation can be seen at various locations on several different radionuclides, individual
radionuclides do not have strong correlation with exposure rate. The strongest correlation was found
with a summation of all natural radionuclides in a given sample with a correlation coefficient of 0.7705.
Cosmic radiation likely contributes, particularly in the higher elevations in the western part of the state.
Expansion of data analysis including man-made contribution, mostly from fallout due to atmospheric
nuclear weapons testing around the world, can be done in the future. This data also indicates radon
source activity in each of these samples by quantification of Radium-226 at each location with soil
analysis.
Development of this dataset and resulting analysis provides the state with an informative baseline that
can be used for comparative research in the future. Most notably in any type of activity that affects
radiation levels, such as technologically enhanced naturally occurring radioactive material (TENORM),
transportation accidents, nuclear power plant accidents, or acts of terrorism.

References
Myrick, T. E., Berven, B. A., & Haywood, F. F. (November 1981). State Background Radiation Levels: Results of Measurements Taken During 1975-1979. Retrieved from http://web.ornl.gov/info/reports/1981/3445605600481.pdf ORNL TM-7343 Duval, J. S., Carson, J. M., Holman, P. B., & Darnley, A. G. (2005). USGS Open-File Report 2005-1413: Terrestrial Radioactivity and Gamma-ray Exposure in the United States and Canada. Retrieved from https://pubs.usgs.gov/of/2005/1413/ White, S. W. (September 1993). EPA's Map of Radon Zones. Retrieved from https://nepis.epa.gov/Exe/ZyPURL.cgi?Dockey=0000098R.TXT EPA-402-R-93-071
Kansas Radon County Maps. (2014). Retrieved from http://kansasradonprogram.org/county-map Copyright 2014, KDHE and Kansas State University. Lyle, S., Killion, M., & Menager, H. Average Indoor Radon Measurements with Respect to the Surficial Geology of Kansas [Map]. Retrieved from https://keap.kdhe.state.ks.us/Ephtm/. Created by Kansas Geological Survey and Kansas Environmental Public Health Tracking Network RadResponder - RadResponder Network. (n.d.). Retrieved from http://www.radresponder.net/ Additional Information can be obtained by contacting the Kansas Radiation Control Program (http://www.kdheks.gov/radiation/index.html). More information is available about the Kansas Environmental Public Health Tracking Program on their website https://keap.kdhe.state.ks.us/Ephtm/ or by email [email protected]
Appendix 1: Kansas Sample Locations

Appendix 2: RadResponder Sampling Location Map

Appendix 3: Gamma Exposure Rate Data Table Collected Value Units Height Unit Description Meter Latitude Longitude
7/9/2015 14:58 13 uR/hr 3 foot Abilene, KS
Ludlum 19 - SN#: 120905 38.949102 -97.228049
7/9/2015 15:02 15 uR/hr 3 foot Abilene, KS
Victoreen 451P - SN#: 4935 38.949102 -97.228049
7/30/2015 11:22 11 uR/hr 3 foot Admire, KS
Ludlum 19 - SN#: 120905 38.65853 -96.06987
7/30/2015 11:54 10 uR/hr 3 foot Admire, KS
Victoreen 451P - SN#: 4935 38.65853 -96.06987
7/7/2015 14:32 9 uR/hr 3 foot Alma, KS
Ludlum 19 - SN#: 120905 38.99269 -96.274662
7/7/2015 15:25 17 uR/hr 3 foot Alma, KS
Victoreen 451P - SN#: 4935 38.99269 -96.27466
7/27/2015 13:43 14 uR/hr 3 foot Alton, KS
Ludlum 19 - SN#: 120905 39.480951 -98.918404
7/27/2015 13:47 16 uR/hr 3 foot Alton, KS
Victoreen 451P - SN#: 4935 39.480951 -98.918404
7/16/2015 17:06 11 uR/hr 3 foot Atlanta, KS
Ludlum 19 - SN#: 120905 37.41765 -96.78645
7/16/2015 17:11 17 uR/hr 3 foot Atlanta, KS
Victoreen 451P - SN#: 4935 37.41765 -96.78645
7/29/2015 10:52 12 uR/hr 3 foot Atwood, KS
Ludlum 19 - SN#: 120905 39.810078
-101.046863
7/29/2015 10:54 13 uR/hr 3 foot Atwood, KS
Victoreen 451P - SN#: 4935 39.810078
-101.046863
7/14/2015 12:22 10 uR/hr 3 foot
Baxter Springs, KS
Ludlum 19 - SN#: 120905 37.06755 -94.726873
7/14/2015 12:30 12 uR/hr 3 foot
Baxter Springs, KS
Victoreen 451P - SN#: 4935 37.06751 -94.726825
7/10/2015 11:36 18 uR/hr 3 foot
Belleville, KS
Victoreen 451P - SN#: 4935 39.841595 -97.646533
7/10/2015 11:37 13 uR/hr 3 foot
Belleville, KS
Ludlum 19 - SN#: 120905 39.841595 -97.646533
7/13/2015 12:57 11 uR/hr 3 foot Beloit, KS
Ludlum 19 - SN#: 120905 39.47425 -98.09769
7/13/2015 13:00 17 uR/hr 3 foot Beloit, KS
Victoreen 451P - SN#: 4935 39.47425 -98.09769
7/20/2015 12:24 15 uR/hr 3 foot Caldwell, KS
Ludlum 19 - SN#: 120905 37.04551 -97.582468
7/20/2015 12:27 14 uR/hr 3 foot Caldwell, KS
Victoreen 451P - SN#: 4935 37.04551 -97.582468
7/22/2015 13:15 16 uR/hr 3 foot
Coolidge, KS
Ludlum 19 - SN#: 120905 38.04387 -102.02745
7/22/2015 13:19 17 uR/hr 3 foot
Coolidge, KS
Victoreen 451P - SN#: 4935 38.04387 -102.02745
7/23/2015 1:04 12 uR/hr 3 foot Dighton, KS
Ludlum 19 - SN#: 120905 38.55455 -100.45889
7/23/2015 1:08 13 uR/hr 3 foot Dighton, KS
Victoreen 451P - SN#: 4935 38.55455 -100.45889
7/16/2015 16:56 10 uR/hr 3 foot Elgin, KS
Ludlum 19 - SN#: 120905 37.00667 -96.2663
7/16/2015 17:01 13 uR/hr 3 foot Elgin, KS
Victoreen 451P - SN#: 4935 37.00667 -96.2663
7/21/2015 14:12 7 uR/hr 3 foot Elkhart, KS
Ludlum 19 - SN#: 120905 37.021848
-101.874227
7/21/2015 14:15 12 uR/hr 3 foot Elkhart, KS
Victoreen 451P - SN#: 4935 37.021848
-101.874227
7/30/2015 10:35 12 uR/hr 3 foot Ellis, KS
Ludlum 19 - SN#: 120905 38.94276 -99.53575
7/30/2015 11:04 12 uR/hr 3 foot Ellis, KS
Victoreen 451P - SN#: 4935 38.94276 -99.53575
7/14/2015 14:34 9 uR/hr 3 foot
Galesburg, KS
Ludlum 19 - SN#: 120905 37.471181 -95.379077
7/14/2015 14:42 10 uR/hr 3 foot
Galesburg, KS
Victoreen 451P - SN#: 4935 37.471181 -95.379077
7/22/2015 10:29 13 uR/hr 3 foot
Garden City, KS
Ludlum 19 - SN#: 120905 38.003683
-100.957136
7/22/2015 10:33 15 uR/hr 3 foot
Garden City, KS
Victoreen 451P - SN#: 4935 38.003683
-100.957136
7/15/2015 11:42 13 uR/hr 3 foot
Geneseo, KS
Ludlum 19 - SN#: 120905 38.522127 -98.145845

7/15/2015 11:51 12 uR/hr 3 foot
Geneseo, KS
Victoreen 451P - SN#: 4935 38.522127 -98.145845
7/28/2015 19:53 14 uR/hr 3 foot
Goodland, KS
Ludlum 19 - SN#: 120905 39.3663 -101.72576
7/28/2015 19:58 15 uR/hr 3 foot
Goodland, KS
Victoreen 451P - SN#: 4935 39.3663 -101.72576
7/21/2015 1:15 13 uR/hr 3 foot
Greensburg, KS
Ludlum 19 - SN#: 120905 37.62006 -99.26744
7/21/2015 1:20 14 uR/hr 3 foot
Greensburg, KS
Victoreen 451P - SN#: 4935 37.62006 -99.26744
7/9/2015 11:00 10 uR/hr 3 foot
Hamilton, KS
Ludlum 19 - SN#: 120905 37.96115 -96.17345
7/9/2015 11:05 17 uR/hr 3 foot
Hamilton, KS
Victoreen 451P - SN#: 4935 37.96115 -96.17345
7/23/2015 10:02 14 uR/hr 3 foot Hanston, KS
Ludlum 19 - SN#: 120905 38.13156 -99.707377
7/23/2015 10:07 15 uR/hr 3 foot Hanston, KS
Victoreen 451P - SN#: 4935 38.13156 -99.707377
7/7/2015 9:50 10 uR/hr 3 foot
Highland, KS
Ludlum 19 - SN#: 120905 39.849488 -95.332393
7/7/2015 10:13 15 uR/hr 3 foot
Highland, KS
Victoreen 451P - SN#: 4935 39.847196 -95.323486
7/6/2015 13:22 10 uR/hr 3 foot Holton, KS
Ludlum 19 - SN#: 120905 39.475129 -95.757157
7/6/2015 13:42 12 uR/hr 3 foot Holton, KS
Victoreen 451P - SN#: 4935 39.475002 -95.757347
7/29/2015 12:25 14 uR/hr 3 foot Hoxie, KS
Ludlum 19 - SN#: 120905 39.321337
-100.443251
7/29/2015 12:28 15 uR/hr 3 foot Hoxie, KS
Victoreen 451P - SN#: 4935 39.321337
-100.443251
7/20/2015 15:42 10 uR/hr 3 foot
Kingman, KS
Ludlum 19 - SN#: 120905 37.66655 -98.135378
7/20/2015 15:45 12 uR/hr 3 foot
Kingman, KS
Victoreen 451P - SN#: 4935 37.66655 -98.135378
7/20/2015 14:01 13 uR/hr 3 foot Kiowa, KS
Ludlum 19 - SN#: 120905 37.020853 -98.503552

7/20/2015 14:03 16 uR/hr 3 foot Kiowa, KS
Victoreen 451P - SN#: 4935 37.020853 -98.503552
7/22/2015 13:43 15 uR/hr 3 foot Leoti, KS
Ludlum 19 - SN#: 120905 38.4822
-101.332616
7/21/2015 12:48 8 uR/hr 3 foot Liberal, KS
Ludlum 19 - SN#: 120905 37.11234
-100.921648
7/21/2015 12:51 13 uR/hr 3 foot Liberal, KS
Victoreen 451P - SN#: 4935 37.11234
-100.921648
7/9/2015 15:17 12 uR/hr 3 foot
Lincolnville, KS
Ludlum 19 - SN#: 120905 38.50797 -96.95581
7/9/2015 15:22 14 uR/hr 3 foot
Lincolnville, KS
Victoreen 451P - SN#: 4935 38.50797 -96.95581
7/17/2015 11:22 11 uR/hr 3 foot Lucas, KS
Ludlum 19 - SN#: 120905 39.075298 -98.540538
7/17/2015 11:27 15 uR/hr 3 foot Lucas, KS
Victoreen 451P - SN#: 4935 39.07539 -98.540638
7/8/2015 15:58 12 uR/hr 3 foot
Mapleton, KS
Ludlum 19 - SN#: 120905 38.00788 -94.89707
7/8/2015 16:04 11 uR/hr 3 foot
Mapleton, KS
Victoreen 451P - SN#: 4935 38.00788 -94.89707
7/21/2015 16:53 14 uR/hr 3 foot
Montezuma, KS
Ludlum 19 - SN#: 120905 37.607198
-100.415889
7/21/2015 16:56 15 uR/hr 3 foot
Montezuma, KS
Victoreen 451P - SN#: 4935 37.607198
-100.415889
7/15/2015 15:09 12 uR/hr 3 foot Newton, KS
Ludlum 19 - SN#: 120905 38.072118 -97.379171
7/15/2015 15:12 16 uR/hr 3 foot Newton, KS
Victoreen 451P - SN#: 4935 38.072118 -97.379171
7/28/2015 0:43 14 uR/hr 3 foot Norton, KS
Ludlum 19 - SN#: 120905 39.83354 -99.79534
7/28/2015 0:48 13 uR/hr 3 foot Norton, KS
Victoreen 451P - SN#: 4935 39.83354 -99.79534
7/28/2015 0:43 14 uR/hr 3 foot Norton, KS
Ludlum 19 - SN#: 120905 39.83354 -99.79534
7/28/2015 19:14 16 uR/hr 3 foot Oakley, KS
Ludlum 19 - SN#: 120905 39.10491 -100.83267

7/28/2015 19:20 17 uR/hr 3 foot Oakley, KS
Victoreen 451P - SN#: 4935 39.10491 -100.83267
7/8/2015 9:37 10 uR/hr 3 foot Olathe, KS
Ludlum 19 - SN#: 120905 38.871207 -94.862691
7/8/2015 10:27 15 uR/hr 3 foot Olathe, KS
Victoreen 451P - SN#: 4935 38.87121 -94.86269
7/23/2015 11:39 14 uR/hr 3 foot Otis, KS
Ludlum 19 - SN#: 120905 38.535688 -99.032938
7/23/2015 11:42 15 uR/hr 3 foot Otis, KS
Victoreen 451P - SN#: 4935 38.535688 -99.032938
7/8/2015 11:18 12 uR/hr 3 foot Ottawa, KS
Ludlum 19 - SN#: 120905 38.617325 -95.27898
7/8/2015 11:22 13 uR/hr 3 foot Ottawa, KS
Victoreen 451P - SN#: 4935 38.617325 -95.27898
7/15/2015 15:14 10 uR/hr 3 foot Plevna, KS
Ludlum 19 - SN#: 120905 37.9701 -98.29412
7/15/2015 15:19 15 uR/hr 3 foot Plevna, KS
Victoreen 451P - SN#: 4935 37.9701 -98.29412
7/21/2015 10:23 11 uR/hr 3 foot
Protection, KS
Ludlum 19 - SN#: 120905 37.192372 -99.500976
7/21/2015 10:27 13 uR/hr 3 foot
Protection, KS
Victoreen 451P - SN#: 4935 37.192372 -99.500976
7/10/2015 11:44 12 uR/hr 3 foot
Randolph, KS
Ludlum 19 - SN#: 120905 39.4432 -96.7387
7/10/2015 11:49 16 uR/hr 3 foot
Randolph, KS
Victoreen 451P - SN#: 4935 39.4432 -96.7387
7/7/2015 11:50 9 uR/hr 3 foot Seneca, KS
Ludlum 19 - SN#: 120905 39.83174 -96.04267
7/7/2015 11:53 17 uR/hr 3 foot Seneca, KS
Victoreen 451P - SN#: 4935 39.83174 -96.04267
7/27/2015 14:44 14 uR/hr 3 foot
Smith Center, KS
Ludlum 19 - SN#: 120905 39.756311 -98.804565
7/27/2015 14:47 13 uR/hr 3 foot
Smith Center, KS
Victoreen 451P - SN#: 4935 39.756311 -98.804565
7/28/2015 20:09 12 uR/hr 3 foot
St. Francis, KS
Ludlum 19 - SN#: 120905 39.78947 -101.80042
7/28/2015 20:16 12 uR/hr 3 foot
St. Francis, KS
Victoreen 451P - SN#: 4935 39.78947 -101.80042
7/21/2015 15:43 12 uR/hr 3 foot Ulysses, KS
Ludlum 19 - SN#: 120905 37.564265
-101.308239
7/21/2015 15:45 14 uR/hr 3 foot Ulysses, KS
Victoreen 451P - SN#: 4935 37.564265
-101.308239
7/28/2015 19:25 15 uR/hr 3 foot Wallace, KS
Ludlum 19 - SN#: 120905 38.91737 -101.56821
7/28/2015 19:33 14 uR/hr 3 foot Wallace, KS
Victoreen 451P - SN#: 4935 38.91737 -101.56821

Appendix 4: Gamma Exposure Rate Maps

Appendix 5: Radionuclide Activities with Exposure Rate
0
2
4
6
8
10
12
14
16
18
0
200
400
600
800
1000
1200
1400
1600
1800
μR/hr
pC
i/kg
Location
Actinium-228
Actinium-228 Exposure rate
0
2
4
6
8
10
12
14
16
18
0
500
1000
1500
2000
2500
3000
3500
4000
4500
μR/hr
pC
i/kg
Location (* designates level below MDL)
Bismuth-212
Bismuth-212 Exposure rate

0
2
4
6
8
10
12
14
16
18
0
500
1000
1500
2000
2500
μR/hr
pC
i/kg
Location
Bismuth-214
Bismuth-214 Exposure rate
0
2
4
6
8
10
12
14
16
18
0
200
400
600
800
1000
1200
1400
1600
μR/hr
pC
i/kg
Location (* designates level below MDL)
Lead-212
Lead-212 Exposure rate
0
2
4
6
8
10
12
14
16
18
0
500
1000
1500
2000
2500
3000
μR/hr
pC
i/kg
Location
Lead-214
Lead-214 Exposure rate
0
2
4
6
8
10
12
14
16
18
0
200
400
600
800
1000
1200
1400
1600
μR/hr
pC
i/kg
Location
Radium-224
Radium-224 Exposure rate

0
2
4
6
8
10
12
14
16
18
0
500
1000
1500
2000
2500
3000
3500
4000
μR/hr
pC
i/kg
Location (* designates level below MDL)
Thorium-228
Thorium-228 Exposure rate
0
2
4
6
8
10
12
14
16
18
0
5000
10000
15000
20000
25000
elkh
art
alm
a
sen
eca
elgi
n
hig
hla
nd
kin
gman
ple
vna
atla
nta
luca
s
atw
oo
d
ellis
map
leto
n
ott
awa
st f
ran
cis
abile
ne
gard
en c
ity
gre
ensb
urg
alto
n
han
sto
n
mo
nte
zum
a
oti
s
cald
wel
l
wal
lace
oak
ley
μR/hr
pC
i/kg
Location
Potassium-40
Potassium-40 Exposure rate

0
2
4
6
8
10
12
14
16
18
0
5000
10000
15000
20000
25000
30000
35000
elkh
art
alm
a
sen
eca
elgi
n
hig
hla
nd
kin
gman
ple
vna
atla
nta
luca
s
atw
oo
d
ellis
map
leto
n
ott
awa
st f
ran
cis
abile
ne
gard
en c
ity
gre
ensb
urg
alto
n
han
sto
n
mo
nte
zum
a
oti
s
cald
wel
l
wal
lace
oak
ley
μR/hr
pC
i/kg
Location
Sum of all natural radionuclides per location
Summation Exposure rate

Appendix 6: Uranium Concentration Maps
USGS OF-2005-1413
Kansas uranium concentration

Appendix 7: Uranium Concentration with Exposure Rate
0
2
4
6
8
10
12
14
16
18
0
0.5
1
1.5
2
2.5
3
3.5
μR/hr
mg/
kg (
pp
m)
Location
Uranium content
Uranium content Exposure rate

Appendix 8: Effect of Elevation on Exposure Rates
0
2
4
6
8
10
12
14
16
18
0
200
400
600
800
1000
1200
μR/hr
Elev
atio
n in
fee
t
Location
Elevation
Elevation Exposure rate

Appendix 9: Kansas Radon Maps


