296
JASPERREPORTS SERVER USER GUIDE RELEASE 5.1 http://www.jaspersoft.com

Copyright © 2013 Jaspersoft Corporation. All rights reserved. Printed in the U.S.A. Jaspersoft, the Jaspersoftlogo, Jaspersoft iReport Designer, JasperReports Library, JasperReports Server, Jaspersoft OLAP, and JaspersoftETL are trademarks and/or registered trademarks of Jaspersoft Corporation in the United States and injurisdictions throughout the world. All other company and product names are or may be trade names ortrademarks of their respective owners.
This is version 0413-JSP51-19 of the JasperReports Server User Guide.
TABLE OF CONTENTS
Chapter 1 Introduction to JasperReports Server 91.1 Logging In 101.1.1 Logging into a Server with Multiple Organizations 12
1.2 TheGetting Started Page 121.3 The Library Page 141.3.1 Created vs. Modified Dates 15
1.4 Browsing the Repository 161.5 Searching the Repository 161.5.1 Searching the Entire Repository 161.5.2 Filtering Search Results 17
1.6 Using Repository Resources 201.7 Moving Folders 201.8 Sorting the Repository List 211.9 Mastering Report Design 211.9.1 Locating JasperReports Samples 221.9.2 Learning about the Samples 22
Chapter 2 Working with Jaspersoft Dashboards 232.1 Viewing a Dashboard 242.2 Creating a Dashboard 252.2.1 Dashboard Overview 252.2.2 Creating a Simple Dashboard 262.2.3 Adding Controls to a Dashboard 282.2.4 Localizing Controls 292.2.5 Adding a Custom URL to a Dashboard 302.2.6 Refining a Dashboard’s Layout 322.2.7 About Screen Sizes 33
2.3 Editing a Dashboard 342.4 Tips for Designing Dashboards 342.4.1 Input Control Tips 34
3
JasperReports Server User Guide
2.4.2 Miscellaneous Tips 35
Chapter 3 Running Reports and the Report Viewer 373.1 Overview of The Report Viewer 373.1.1 The Report Viewer Tool bar 383.1.2 ColumnMenu 393.1.3 Data Snapshots 40
3.2 Running or Creating a Simple Report 403.2.1 Running a Simple Report 403.2.2 Creating a Report 41
3.3 Getting New Perspectives on Data 423.3.1 Column Formatting 423.3.2 Conditional Formatting 433.3.3 Interactively Filtering Report Output 463.3.4 Interactively Sorting a Report 483.3.5 Moving, Resizing, and Hiding Columns 49
3.4 Navigating the Report 493.5 Exporting the Report 493.6 Running an HTML5Chart 503.7 Running a Flash Chart 513.8 Running a Report with Input Controls or Filters 533.8.1 Simple Input Controls 543.8.2 Cascading Input Controls 57
3.9 Scheduling Reports 583.9.1 Setting Up a Job 593.9.2 Setting Output Options 613.9.3 Viewing the List of Scheduled Jobs 633.9.4 Changing Job Schedules 643.9.5 Stopping a Job from Running 643.9.6 Running a Job Repeatedly 653.9.7 Running a Job in the Background 673.9.8 Adding a Date/Time Stamp to Scheduled Output 67
3.10 Event Messages 69
Chapter 4 Working with the Ad Hoc Editor 714.1 Overview of the Ad Hoc Editor 724.1.1 Ad Hoc Sources: Topics, Domains, andOLAP Connections 734.1.2 Ad Hoc View Types 744.1.3 The Data Source Selection Panel 784.1.4 The AdHoc View Panel 784.1.5 The Filters Panel 804.1.6 Saving an AdHoc View, Previewing and Creating a Report 80
4.2 Working with Tables 814.2.1 Using Fields in Tables 81
4.3 Working with Charts 864.3.1 Using Fields andMeasures in Charts 864.3.2 Selecting a Chart Type 90
4
4.3.3 Formatting Charts 924.3.4 Interacting with Charts 94
4.4 Working with Standard Crosstabs 964.4.1 Using Fields in Crosstabs 96
4.5 Working with OLAP Connection-based Crosstabs 994.5.1 Dimensions andMeasures 994.5.2 Drilling Through Data 1004.5.3 Sorting 1004.5.4 Viewing theMDX Query 1014.5.5 Working with Microsoft SSAS 101
4.6 Creating Custom Fields 1024.7 Using Filters and Input Controls 1054.7.1 Using Filters 1054.7.2 Using Input Controls 1104.7.3 Input Controls and Filters Availability 111
4.8 Creating a View from aDomain 1124.8.1 Using the Data ChooserWizard 113
4.9 Creating Topics 1174.9.1 Creating and Uploading a Topic 1174.9.2 Creating Topics from Domains 119
Chapter 5 Adding Reports Directly to the Repository 1235.1 Overview of a Report Unit 1245.2 Adding a Simple Report Unit to the Server 1255.2.1 Uploading theMain JRXML 1255.2.2 Uploading Suggested File Resources 1275.2.3 Defining the Data Source 1295.2.4 Defining the Query 1305.2.5 Saving the New Report Unit 132
5.3 Adding a Complex Report Unit to the Server 1335.3.1 Uploading Undetected File Resources 1365.3.2 Adding Input Controls 1385.3.3 Selecting a Data Source for Running the Complex Report 149
5.4 Adding Cascading Input Controls to a Report 1525.5 Editing JRXMLReport Units 1525.6 Localizing Reports 1545.6.1 Running a Localized Report 1545.6.2 AddingMulti-lingual Prompts to Input Controls 1565.6.3 Adding aMulti-Lingual Static List to an Input Control 1635.6.4 Reusing Resource Bundles 1735.6.5 Using Default Fonts in JasperReports Server 173
Chapter 6 Creating Domains 1756.1 Introduction to Domains 1756.1.1 Domain Use Cases 1766.1.2 Terminology 1776.1.3 Components of a Domain 177
5
JasperReports Server User Guide
6.1.4 Sample Domains 1786.1.5 Overview of Creating a Domain 178
6.2 Example of Creating a Domain 1796.3 Example of Creating a Domain Using a Virtual Data Source 1896.4 Using the Add New Domain Page 1966.4.1 Add Security File and Add Locale Bundle Options 1976.4.2 Selecting a Schema 199
6.5 Using the Domain Designer 2006.5.1 Tables Tab 2006.5.2 Manage Data Source Dialog Box 2016.5.3 Derived Tables Tab 2036.5.4 Joins Tab 2036.5.5 Calculated Fields Tab 2046.5.6 The Pre-filters Tab 2066.5.7 Display Tab 2076.5.8 The Properties Panel 2096.5.9 Designer Tool Bar 2126.5.10 Domain Validation 212
6.6 Editing a Domain 2136.6.1 Maintaining Referential Integrity 2156.6.2 Fixing Referential Integrity Problems 216
Chapter 7 Accessing Reports and Domains from iReport 2217.1 Plug-in Requirements 2227.2 Connecting to the Server from iReport 2227.3 Creating a Report Unit in the Repository from iReport 2247.3.1 Adding an Image and Subreport to the Report Unit 226
7.4 Managing Resources in the Repository from iReport 2307.5 Editing a Report in the Repository from iReport 2327.6 Running a Report from iReport 2337.7 Using the Domain Plug-in 2337.8 Creating and Uploading Chart Themes to the Server 237
Chapter 8 Advanced Domain Features 2418.1 The Domain Design File 2418.1.1 Exporting the Design File from aDomain 2428.1.2 WorkingWith a Design File 2438.1.3 Structure of the Design File 2448.1.4 Uploading a Design File to a Domain 258
8.2 The DomEL Syntax 2598.2.1 Datatypes 2598.2.2 Field References 2608.2.3 Operators and Functions 2618.2.4 Profile Attributes 2638.2.5 SQL Functions 2648.2.6 Complex Expressions 2648.2.7 Return Value 265
6
8.3 Security and Locale Information for a Domain 2668.4 The Domain Security File 2698.4.1 Row-Level Security 2728.4.2 Column-Level Security 274
8.5 Locale Bundles 2778.5.1 Defining the Internationalization Keys 2788.5.2 Creating Locale Bundle Files 279
8.6 Internationalized Databases 2818.7 Copying a Domain 2828.8 Switching the Data Source of a Domain 282
Index 287
7

JasperReports Server User Guide
8
CHAPTER 1 INTRODUCTION TO JASPERREPORTS SERVERThis section describes functionality that can be restricted by the software license for JasperReportsServer. If you don’t see some of the options described in this section, your license may prohibit youfrom using them. To find out what you're licensed to use, or to upgrade your license, contactJaspersoft.
JasperReports Server builds on JasperReports as a comprehensive family of Business Intelligence (BI)products, providing robust static and interactive reporting, report server, and data analysis capabilities.These capabilities are available as either stand-alone products, or as part of an integrated end-to-end BIsuite utilizing common metadata and provide shared services, such as security, a repository, andscheduling. The server exposes comprehensive public interfaces enabling seamless integration withother applications and the capability to easily add custom functionality.
The heart of the Jaspersoft BI Suite is the server, which provides the ability to:
• Easily create new reports based on views designed in an intuitive, web-based, drag and drop AdHoc Editor.
• Efficiently and securely manage many reports.
• Interact with reports, including sorting, changing formatting, entering parameters, and drilling ondata.
• Schedule reports for distribution through email and storage in the repository.
• Arrange reports and web content to create appealing, data-rich Jaspersoft Dashboards that quicklyconvey business trends.
For business intelligence users, Jaspersoft offers Jaspersoft OLAP, which runs on the server.
While the Ad Hoc Editor lets users create simple reports, more complex reports can be created outsideof the server. You can either use iReport Designer or manually write JRXML code to create a reportthat can be run in the server. Jaspersoft recommends that you use iReport unless you have a thoroughunderstanding of the JasperReports file structure. See “Adding Reports Directly to the Repository” onpage 123 and “Plug-in Requirements” on page 222 for more information.
Jaspersoft provides several other sources of information to help extend your knowledge ofJasperReports Server:
9
JasperReports Server User Guide
• Our Ultimate Guides document advanced features and configuration. They also include bestpractice recommendations and numerous examples. The guides are available as downloadablePDFs. Community project users can purchase individual guides or bundled documentation packsfrom the Jaspersoft online store. Commercial customers can download them freely from the supportportal.
• Our Online Learning Portal lets you learn at your own pace, and covers topics for developers,system administrators, business users, and data integration users. The Portal is available online fromProfessional Services section of our website.
• Our free samples, which are installed with JasperReports, iReport, and JasperReports Server, aredocumented online. For more information about the samples, see “Mastering Report Design” onpage 21.
JasperReports Server is a component of both a community project and commercial offerings. Eachintegrates the standard features such as security, scheduling, a web services interface, and much morefor running and sharing reports. Commercial editions provide additional features, including Ad Hoccharts, flash charts, dashboards, Domains, auditing, and a multi-organization architecture for hostinglarge BI deployments.
This chapter contains the following sections:
• Logging In
• The Getting Started Page
• The Library Page
• Browsing the Repository
• Searching the Repository
• Using Repository Resources
• Sorting the Repository List
• Mastering Report Design
1.1 Logging InTo protect the data that you can access through the server, all users are required to log in with apassword.
To log in to the server, Javascript and cookies must be enabled in your broswer.
To log in to the server:
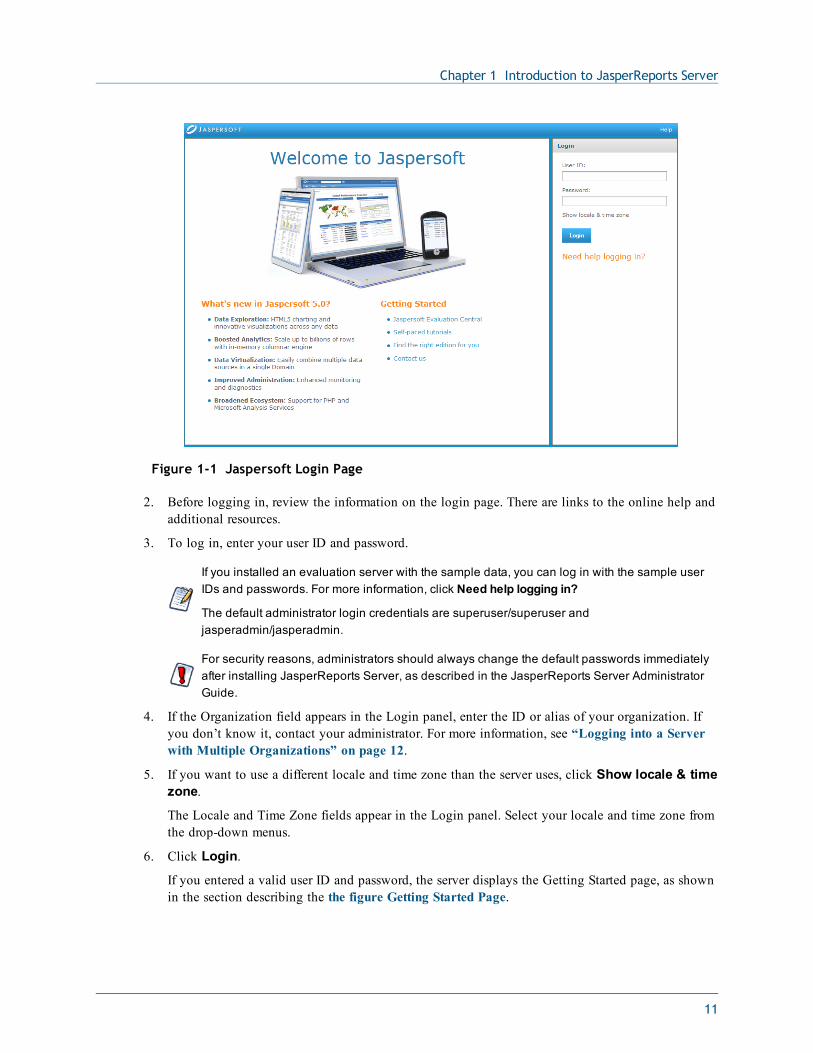
1. Enter http://<hostname>:8080/jasperserver-pro in a web browser, where <hostname> isthe name of the computer that hosts JasperReports Server. The Login page appears:
10
Chapter 1 Introduction to JasperReports Server
Figure 1-1 Jaspersoft Login Page
2. Before logging in, review the information on the login page. There are links to the online help andadditional resources.
3. To log in, enter your user ID and password.
If you installed an evaluation server with the sample data, you can log in with the sample userIDs and passwords. For more information, click Need help logging in?
The default administrator login credentials are superuser/superuser andjasperadmin/jasperadmin.
For security reasons, administrators should always change the default passwords immediatelyafter installing JasperReports Server, as described in the JasperReports Server AdministratorGuide.
4. If the Organization field appears in the Login panel, enter the ID or alias of your organization. Ifyou don’t know it, contact your administrator. For more information, see “Logging into a Serverwith Multiple Organizations” on page 12.
5. If you want to use a different locale and time zone than the server uses, click Show locale & timezone.
The Locale and Time Zone fields appear in the Login panel. Select your locale and time zone fromthe drop-down menus.
6. Click Login.
If you entered a valid user ID and password, the server displays the Getting Started page, as shownin the section describing the the figure Getting Started Page.
11
JasperReports Server User Guide
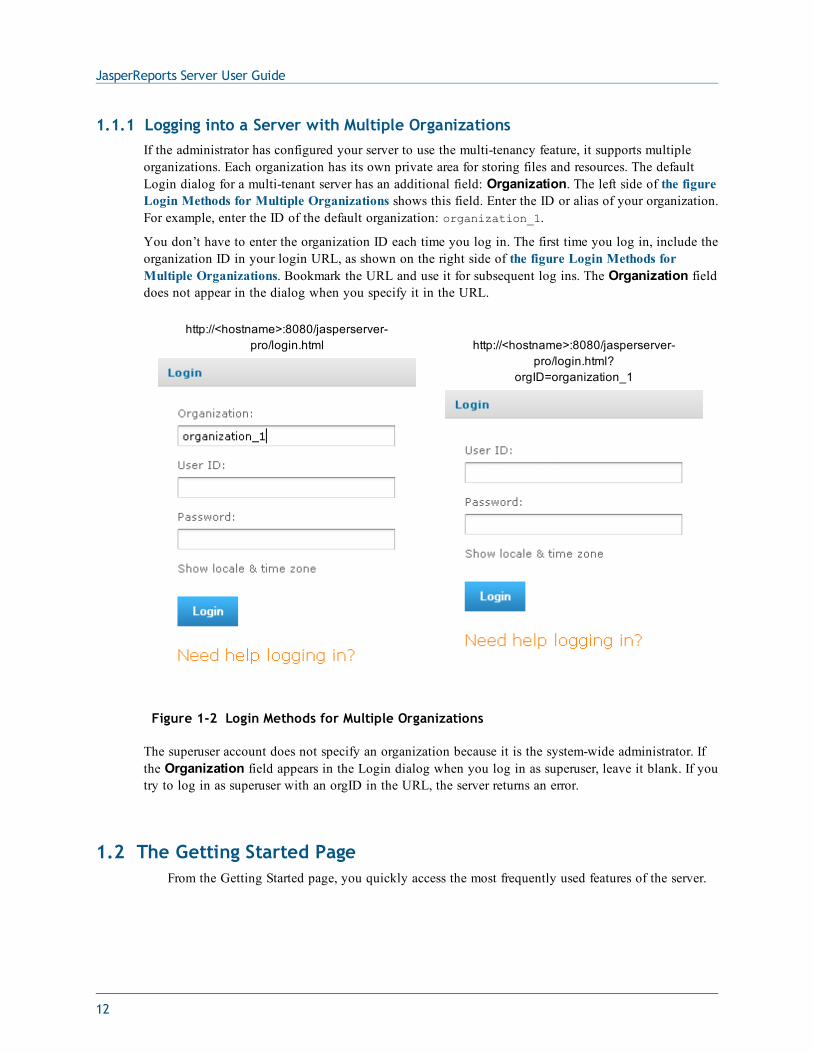
1.1.1 Logging into a Server with Multiple OrganizationsIf the administrator has configured your server to use the multi-tenancy feature, it supports multipleorganizations. Each organization has its own private area for storing files and resources. The defaultLogin dialog for a multi-tenant server has an additional field: Organization. The left side of the figureLogin Methods for Multiple Organizations shows this field. Enter the ID or alias of your organization.For example, enter the ID of the default organization: organization_1.
You don’t have to enter the organization ID each time you log in. The first time you log in, include theorganization ID in your login URL, as shown on the right side of the figure Login Methods forMultiple Organizations. Bookmark the URL and use it for subsequent log ins. The Organization fielddoes not appear in the dialog when you specify it in the URL.
http://<hostname>:8080/jasperserver-pro/login.html http://<hostname>:8080/jasperserver-
pro/login.html?orgID=organization_1
Figure 1-2 Login Methods for Multiple Organizations
The superuser account does not specify an organization because it is the system-wide administrator. Ifthe Organization field appears in the Login dialog when you log in as superuser, leave it blank. If youtry to log in as superuser with an orgID in the URL, the server returns an error.
1.2 The Getting Started PageFrom the Getting Started page, you quickly access the most frequently used features of the server.
12
Chapter 1 Introduction to JasperReports Server
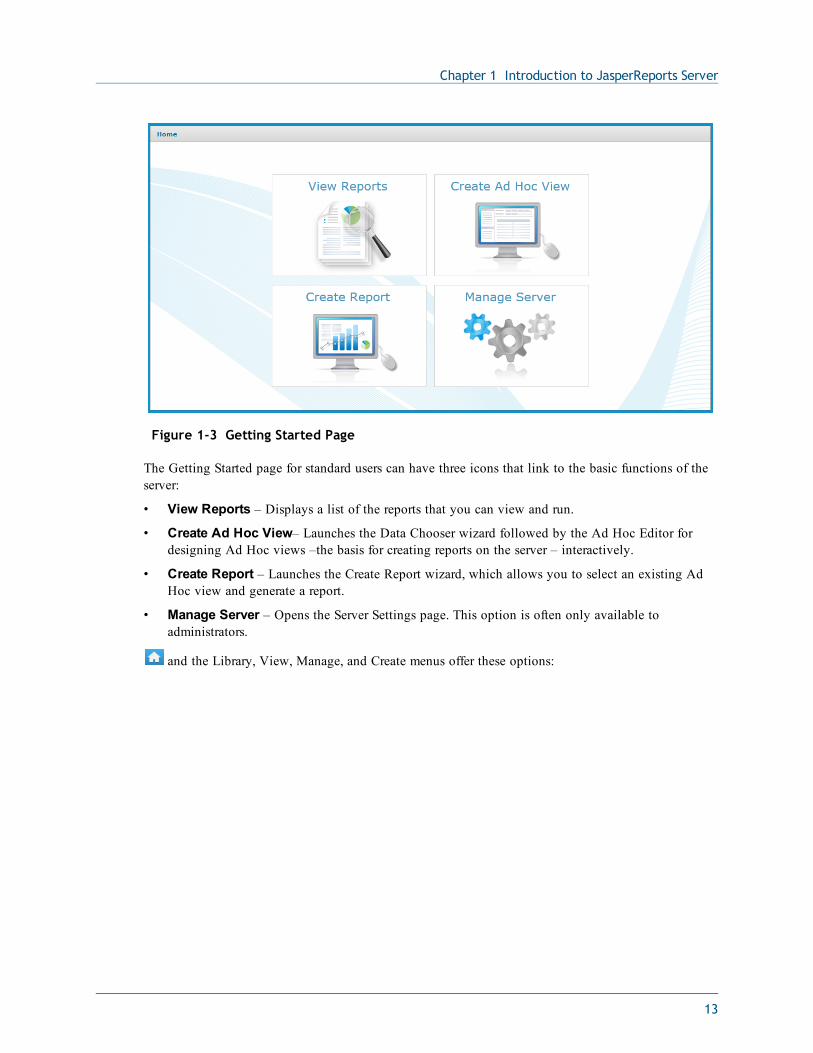
Figure 1-3 Getting Started Page
The Getting Started page for standard users can have three icons that link to the basic functions of theserver:
• View Reports – Displays a list of the reports that you can view and run.
• Create Ad Hoc View– Launches the Data Chooser wizard followed by the Ad Hoc Editor fordesigning Ad Hoc views –the basis for creating reports on the server – interactively.
• Create Report – Launches the Create Report wizard, which allows you to select an existing AdHoc view and generate a report.
• Manage Server – Opens the Server Settings page. This option is often only available toadministrators.
and the Library, View, Manage, and Create menus offer these options:
13
JasperReports Server User Guide
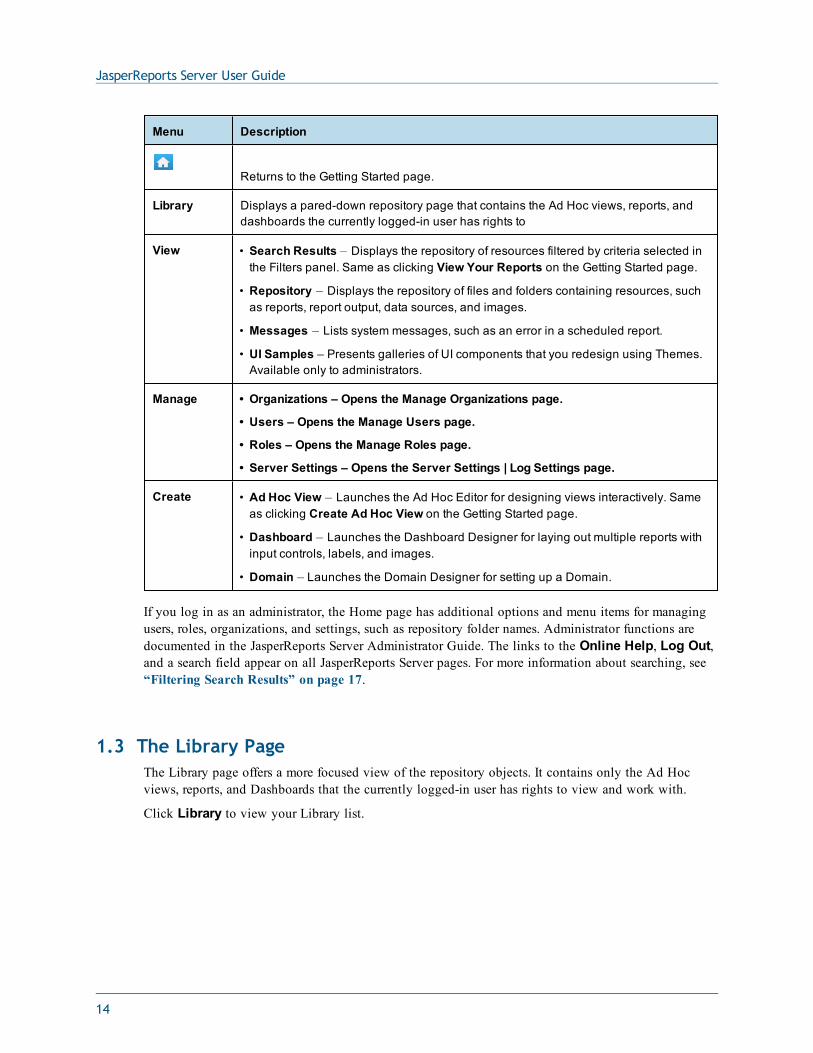
Menu Description
Returns to the Getting Started page.
Library Displays a pared-down repository page that contains the Ad Hoc views, reports, anddashboards the currently logged-in user has rights to
View • Search Results – Displays the repository of resources filtered by criteria selected inthe Filters panel. Same as clicking View Your Reports on the Getting Started page.
• Repository – Displays the repository of files and folders containing resources, suchas reports, report output, data sources, and images.
• Messages – Lists system messages, such as an error in a scheduled report.
• UI Samples – Presents galleries of UI components that you redesign using Themes.Available only to administrators.
Manage • Organizations – Opens the Manage Organizations page.
• Users – Opens the Manage Users page.
• Roles – Opens the Manage Roles page.
• Server Settings – Opens the Server Settings | Log Settings page.
Create • Ad Hoc View – Launches the Ad Hoc Editor for designing views interactively. Sameas clicking Create Ad Hoc View on the Getting Started page.
• Dashboard – Launches the Dashboard Designer for laying out multiple reports withinput controls, labels, and images.
• Domain – Launches the Domain Designer for setting up a Domain.
If you log in as an administrator, the Home page has additional options and menu items for managingusers, roles, organizations, and settings, such as repository folder names. Administrator functions aredocumented in the JasperReports Server Administrator Guide. The links to the Online Help, Log Out,and a search field appear on all JasperReports Server pages. For more information about searching, see“Filtering Search Results” on page 17.
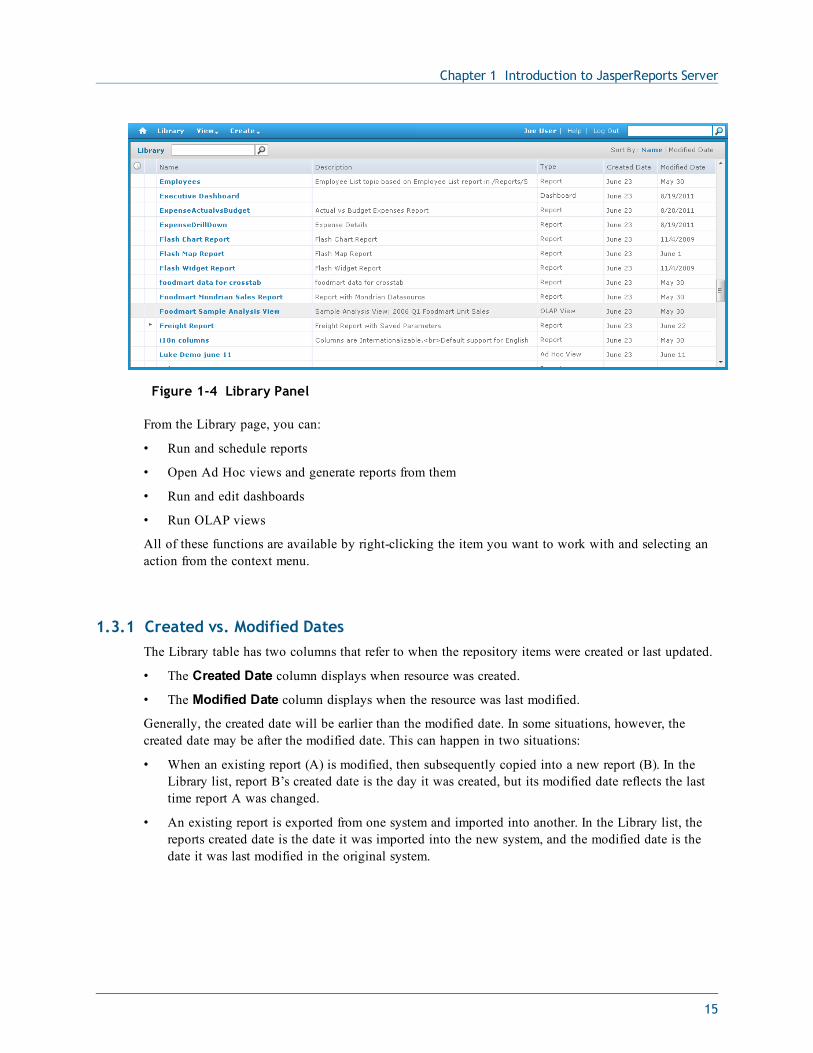
1.3 The Library PageThe Library page offers a more focused view of the repository objects. It contains only the Ad Hocviews, reports, and Dashboards that the currently logged-in user has rights to view and work with.
Click Library to view your Library list.
14
Chapter 1 Introduction to JasperReports Server
Figure 1-4 Library Panel
From the Library page, you can:
• Run and schedule reports
• Open Ad Hoc views and generate reports from them
• Run and edit dashboards
• Run OLAP views
All of these functions are available by right-clicking the item you want to work with and selecting anaction from the context menu.
1.3.1 Created vs. Modified DatesThe Library table has two columns that refer to when the repository items were created or last updated.
• The Created Date column displays when resource was created.
• The Modified Date column displays when the resource was last modified.
Generally, the created date will be earlier than the modified date. In some situations, however, thecreated date may be after the modified date. This can happen in two situations:
• When an existing report (A) is modified, then subsequently copied into a new report (B). In theLibrary list, report B’s created date is the day it was created, but its modified date reflects the lasttime report A was changed.
• An existing report is exported from one system and imported into another. In the Library list, thereports created date is the date it was imported into the new system, and the modified date is thedate it was last modified in the original system.
15
JasperReports Server User Guide
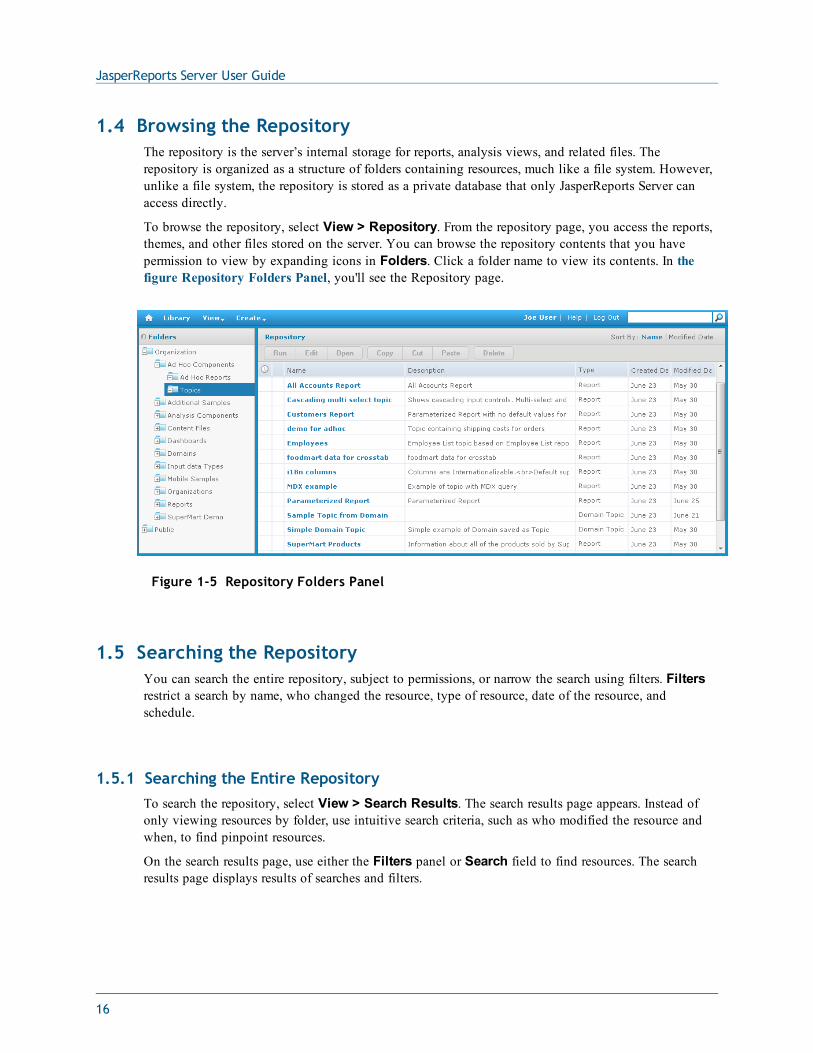
1.4 Browsing the RepositoryThe repository is the server’s internal storage for reports, analysis views, and related files. Therepository is organized as a structure of folders containing resources, much like a file system. However,unlike a file system, the repository is stored as a private database that only JasperReports Server canaccess directly.
To browse the repository, select View > Repository. From the repository page, you access the reports,themes, and other files stored on the server. You can browse the repository contents that you havepermission to view by expanding icons in Folders. Click a folder name to view its contents. In thefigure Repository Folders Panel, you'll see the Repository page.
Figure 1-5 Repository Folders Panel
1.5 Searching the RepositoryYou can search the entire repository, subject to permissions, or narrow the search using filters. Filtersrestrict a search by name, who changed the resource, type of resource, date of the resource, andschedule.
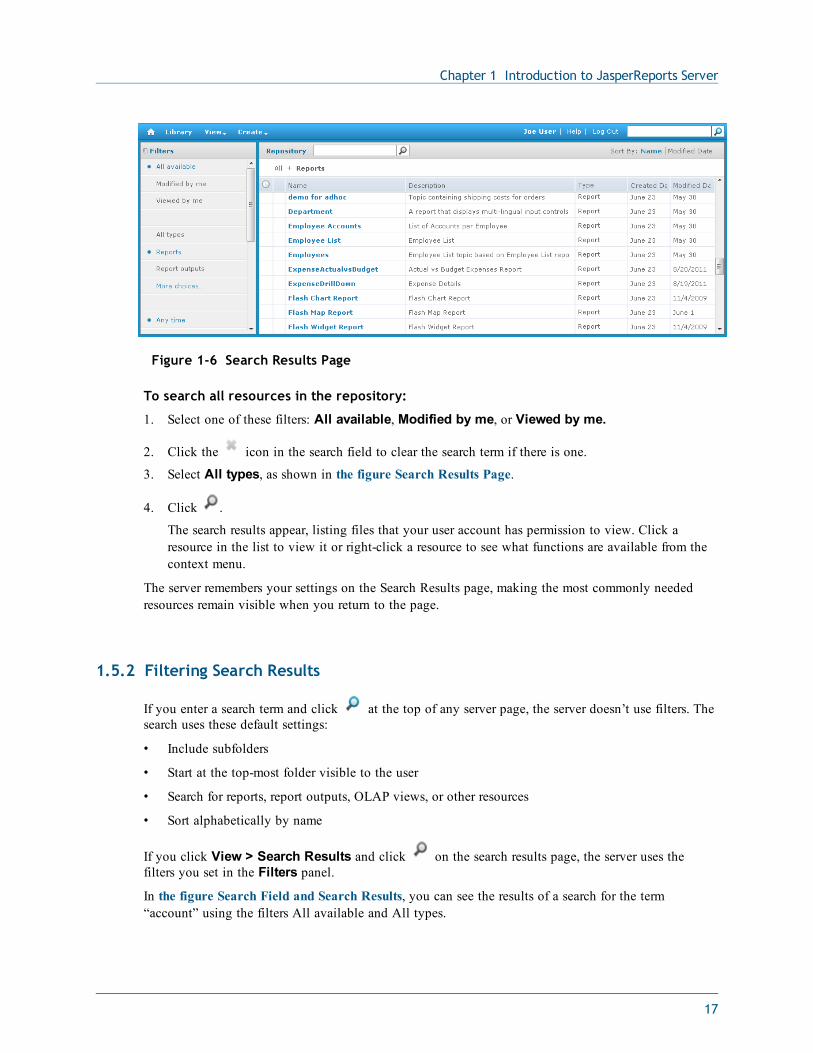
1.5.1 Searching the Entire RepositoryTo search the repository, select View > Search Results. The search results page appears. Instead ofonly viewing resources by folder, use intuitive search criteria, such as who modified the resource andwhen, to find pinpoint resources.
On the search results page, use either the Filters panel or Search field to find resources. The searchresults page displays results of searches and filters.
16
Chapter 1 Introduction to JasperReports Server
Figure 1-6 Search Results Page
To search all resources in the repository:
1. Select one of these filters: All available, Modified by me, or Viewed by me.
2. Click the icon in the search field to clear the search term if there is one.
3. Select All types, as shown in the figure Search Results Page.
4. Click .
The search results appear, listing files that your user account has permission to view. Click aresource in the list to view it or right-click a resource to see what functions are available from thecontext menu.
The server remembers your settings on the Search Results page, making the most commonly neededresources remain visible when you return to the page.
1.5.2 Filtering Search Results
If you enter a search term and click at the top of any server page, the server doesn’t use filters. Thesearch uses these default settings:
• Include subfolders
• Start at the top-most folder visible to the user
• Search for reports, report outputs, OLAP views, or other resources
• Sort alphabetically by name
If you click View > Search Results and click on the search results page, the server uses thefilters you set in the Filters panel.
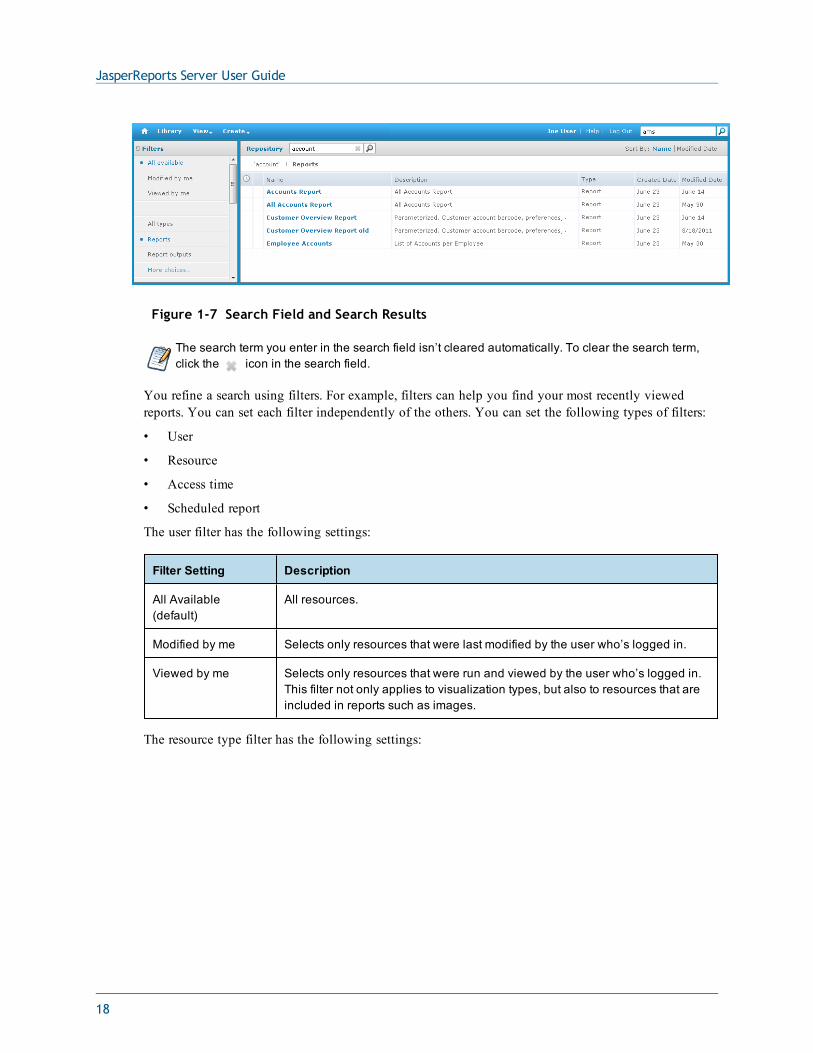
In the figure Search Field and Search Results, you can see the results of a search for the term“account” using the filters All available and All types.
17
JasperReports Server User Guide
Figure 1-7 Search Field and Search Results
The search term you enter in the search field isn’t cleared automatically. To clear the search term,click the icon in the search field.
You refine a search using filters. For example, filters can help you find your most recently viewedreports. You can set each filter independently of the others. You can set the following types of filters:
• User
• Resource
• Access time
• Scheduled report
The user filter has the following settings:
Filter Setting Description
All Available(default)
All resources.
Modified by me Selects only resources that were last modified by the user who’s logged in.
Viewed by me Selects only resources that were run and viewed by the user who’s logged in.This filter not only applies to visualization types, but also to resources that areincluded in reports such as images.
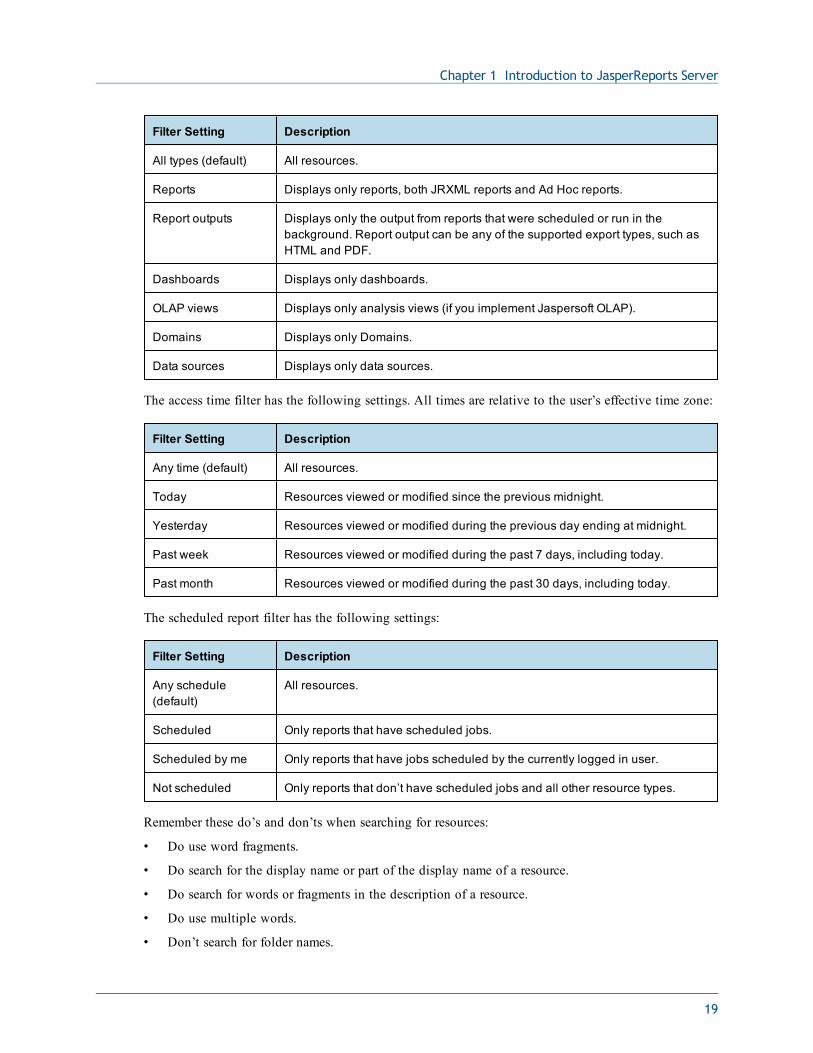
The resource type filter has the following settings:
18
Chapter 1 Introduction to JasperReports Server
Filter Setting Description
All types (default) All resources.
Reports Displays only reports, both JRXML reports and Ad Hoc reports.
Report outputs Displays only the output from reports that were scheduled or run in thebackground. Report output can be any of the supported export types, such asHTML and PDF.
Dashboards Displays only dashboards.
OLAP views Displays only analysis views (if you implement Jaspersoft OLAP).
Domains Displays only Domains.
Data sources Displays only data sources.
The access time filter has the following settings. All times are relative to the user’s effective time zone:
Filter Setting Description
Any time (default) All resources.
Today Resources viewed or modified since the previous midnight.
Yesterday Resources viewed or modified during the previous day ending at midnight.
Past week Resources viewed or modified during the past 7 days, including today.
Past month Resources viewed or modified during the past 30 days, including today.
The scheduled report filter has the following settings:
Filter Setting Description
Any schedule(default)
All resources.
Scheduled Only reports that have scheduled jobs.
Scheduled by me Only reports that have jobs scheduled by the currently logged in user.
Not scheduled Only reports that don’t have scheduled jobs and all other resource types.
Remember these do’s and don’ts when searching for resources:
• Do use word fragments.
• Do search for the display name or part of the display name of a resource.
• Do search for words or fragments in the description of a resource.
• Do use multiple words.
• Don’t search for folder names.
19
JasperReports Server User Guide
• Don’t enter quotes around terms or symbols between terms.
• Don’t worry about using upper- or lower-case letters in search terms.
1.6 Using Repository ResourcesAfter finding a resource in the repository, naturally you want to do something with it. Options are:
• Click the name of a report to run and view it.
• Right-click the name of a resource to access other operations on the context menu, for exampleEdit or Open in Designer. Items appear on the context menu according to the permissionsgranted to the user.
• Click anywhere in the row except the resource name to select a resource. Ctrl-click anywhere in therows to select multiple resources. Use the context menu or buttons above the results list: Run,Edit, Open, Copy, Cut (move), or Delete. If the button is unavailable, the resource doesn’tsupport the operation or you don’t have permission to do this operation. For example, the Openbutton is available when you select a dashboard or an Ad Hoc report if you have permission towrite to it.
You might also need permission to access the folder or dependent file, such as an image, of aresource. For example, to schedule a report, you need to have read/write/delete permission on thefolder where server saves the report output. For more information about permissions, see theJasperReports Server Administrator Guide.
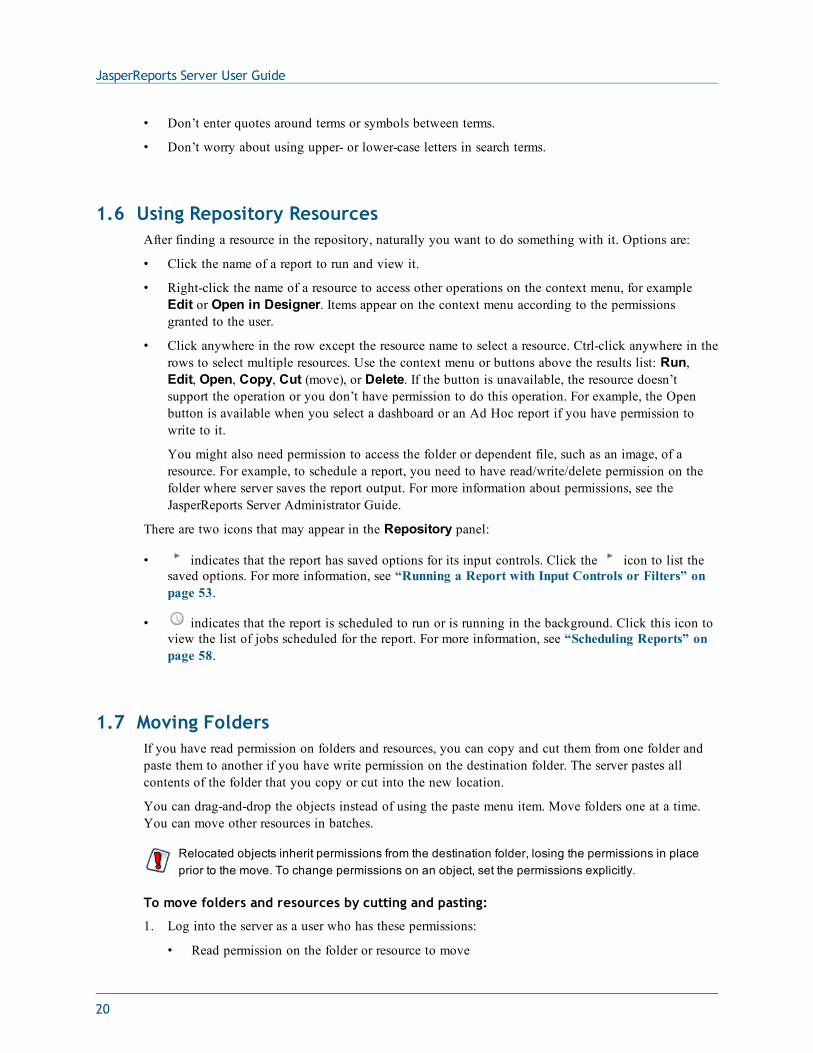
There are two icons that may appear in the Repository panel:
• indicates that the report has saved options for its input controls. Click the icon to list thesaved options. For more information, see “Running a Report with Input Controls or Filters” onpage 53.
• indicates that the report is scheduled to run or is running in the background. Click this icon toview the list of jobs scheduled for the report. For more information, see “Scheduling Reports” onpage 58.
1.7 Moving FoldersIf you have read permission on folders and resources, you can copy and cut them from one folder andpaste them to another if you have write permission on the destination folder. The server pastes allcontents of the folder that you copy or cut into the new location.
You can drag-and-drop the objects instead of using the paste menu item. Move folders one at a time.You can move other resources in batches.
Relocated objects inherit permissions from the destination folder, losing the permissions in placeprior to the move. To change permissions on an object, set the permissions explicitly.
To move folders and resources by cutting and pasting:
1. Log into the server as a user who has these permissions:
• Read permission on the folder or resource to move
20
Chapter 1 Introduction to JasperReports Server
• Write permission on the destination folder
For example, log in as joeuser (use the password, joeuser).
2. Click View > Repository.
3. In the Folders panel, right-click Reports > Samples, and select Add Folder.
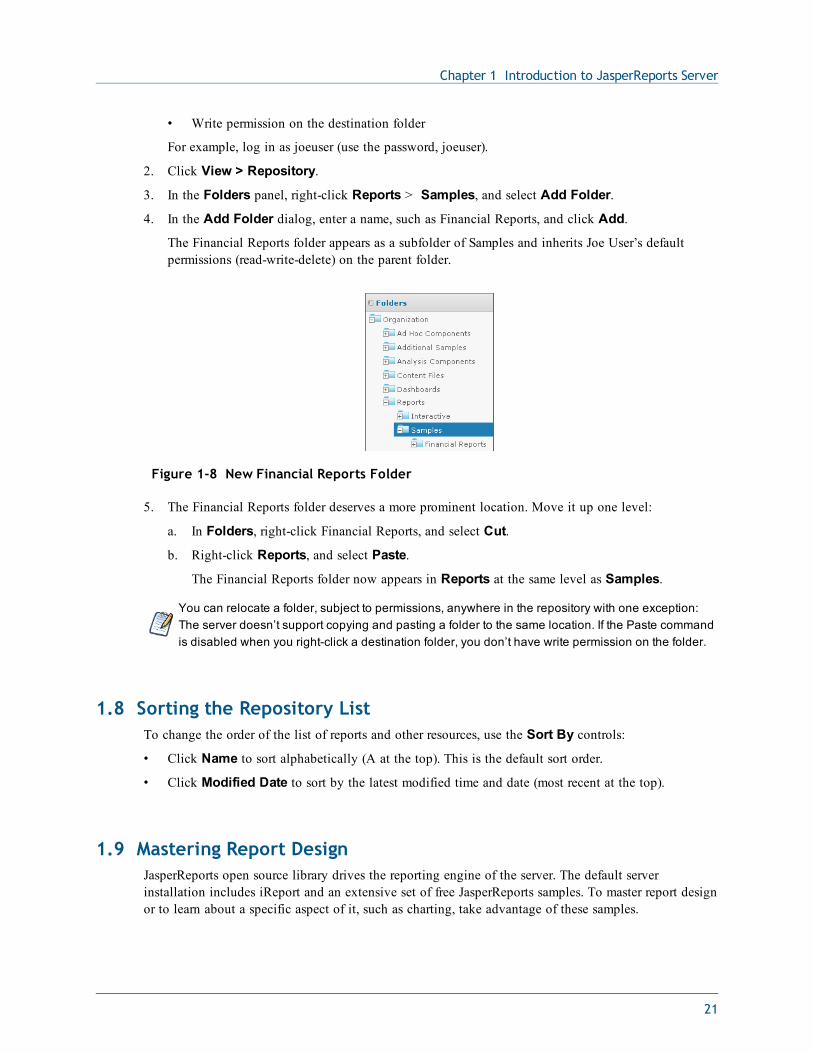
4. In the Add Folder dialog, enter a name, such as Financial Reports, and click Add.
The Financial Reports folder appears as a subfolder of Samples and inherits Joe User’s defaultpermissions (read-write-delete) on the parent folder.
Figure 1-8 New Financial Reports Folder
5. The Financial Reports folder deserves a more prominent location. Move it up one level:
a. In Folders, right-click Financial Reports, and select Cut.
b. Right-click Reports, and select Paste.
The Financial Reports folder now appears in Reports at the same level as Samples.
You can relocate a folder, subject to permissions, anywhere in the repository with one exception:The server doesn’t support copying and pasting a folder to the same location. If the Paste commandis disabled when you right-click a destination folder, you don’t have write permission on the folder.
1.8 Sorting the Repository ListTo change the order of the list of reports and other resources, use the Sort By controls:
• Click Name to sort alphabetically (A at the top). This is the default sort order.
• Click Modified Date to sort by the latest modified time and date (most recent at the top).
1.9 Mastering Report DesignJasperReports open source library drives the reporting engine of the server. The default serverinstallation includes iReport and an extensive set of free JasperReports samples. To master report designor to learn about a specific aspect of it, such as charting, take advantage of these samples.
21
JasperReports Server User Guide
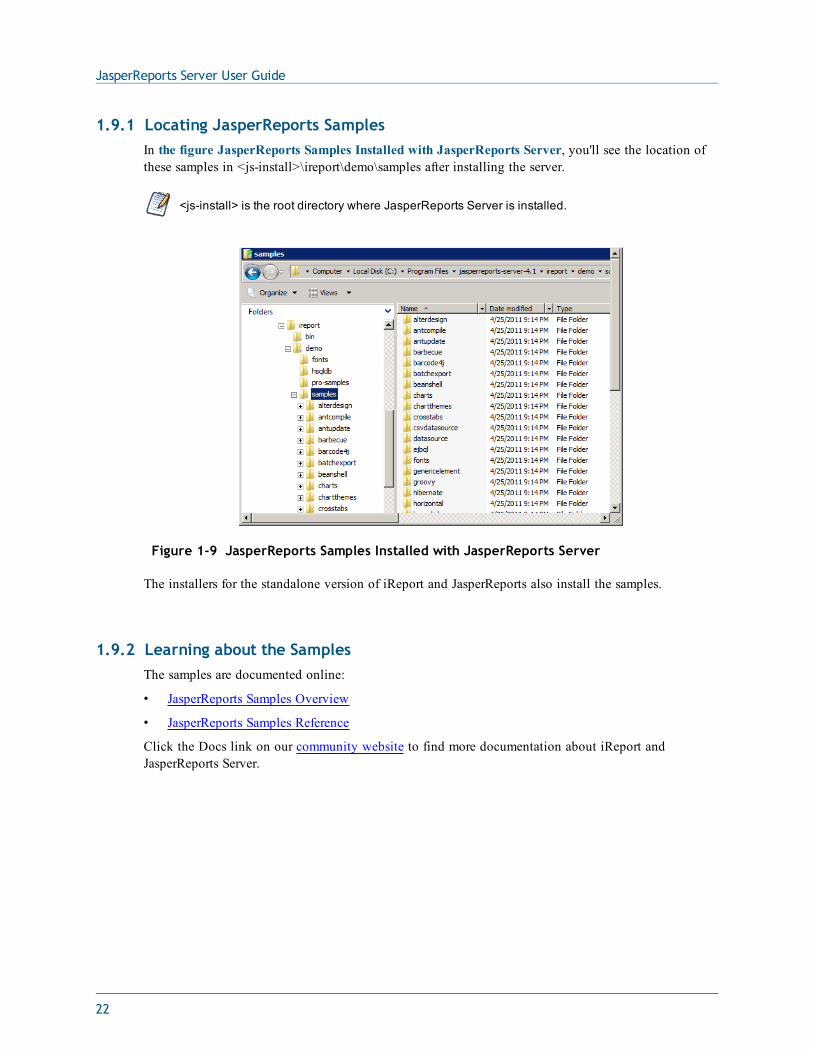
1.9.1 Locating JasperReports SamplesIn the figure JasperReports Samples Installed with JasperReports Server, you'll see the location ofthese samples in <js-install>\ireport\demo\samples after installing the server.
<js-install> is the root directory where JasperReports Server is installed.
Figure 1-9 JasperReports Samples Installed with JasperReports Server
The installers for the standalone version of iReport and JasperReports also install the samples.
1.9.2 Learning about the SamplesThe samples are documented online:
• JasperReports Samples Overview
• JasperReports Samples Reference
Click the Docs link on our community website to find more documentation about iReport andJasperReports Server.
22
CHAPTER 2 WORKING WITH JASPERSOFT DASHBOARDSThis section describes functionality that can be restricted by the software license for JasperReportsServer. If you don’t see some of the options described in this section, your license may prohibit youfrom using them. To find out what you're licensed to use, or to upgrade your license, contactJaspersoft.
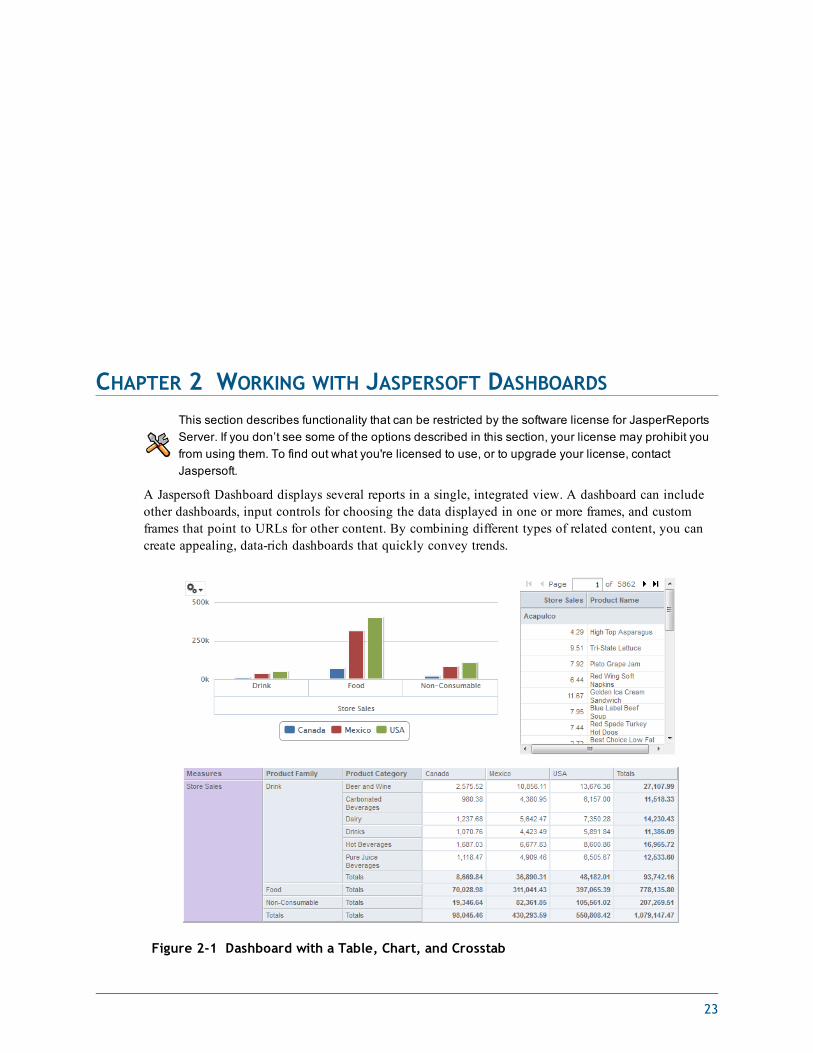
A Jaspersoft Dashboard displays several reports in a single, integrated view. A dashboard can includeother dashboards, input controls for choosing the data displayed in one or more frames, and customframes that point to URLs for other content. By combining different types of related content, you cancreate appealing, data-rich dashboards that quickly convey trends.
Figure 2-1 Dashboard with a Table, Chart, and Crosstab
23
JasperReports Server User Guide
This chapter contains the following sections:
• Viewing a Dashboard
• Creating a Dashboard
• Editing a Dashboard
• Tips for Designing Dashboards
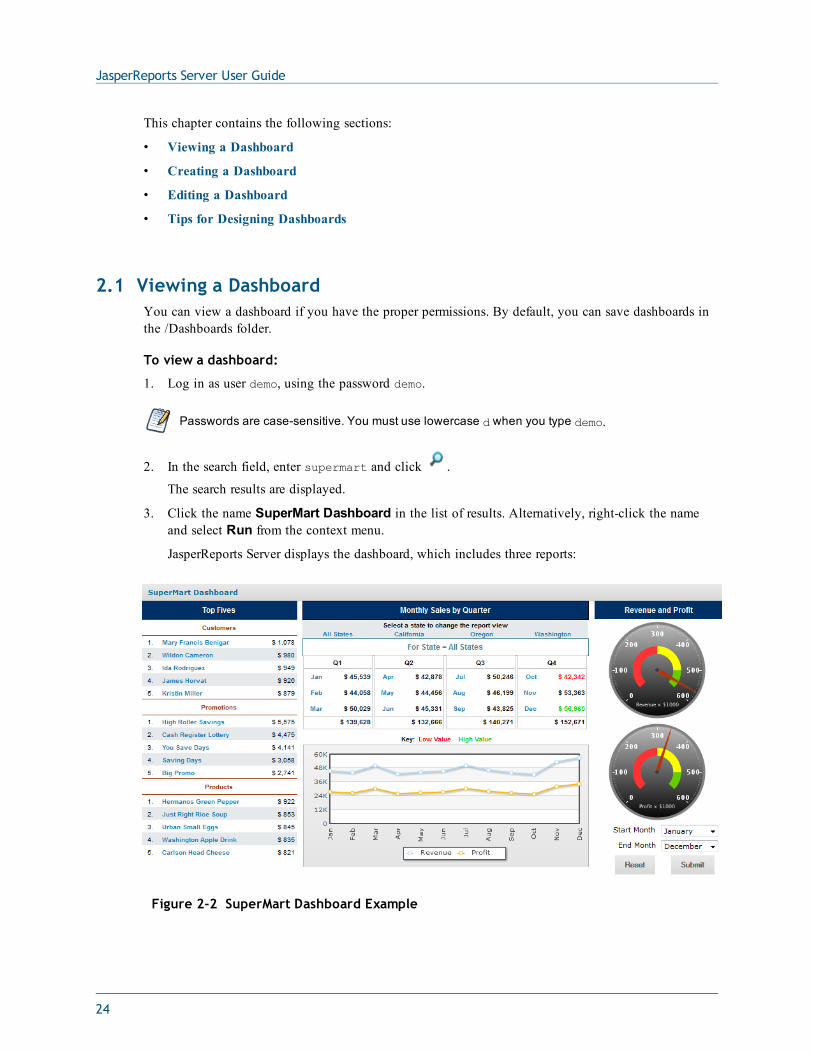
2.1 Viewing a DashboardYou can view a dashboard if you have the proper permissions. By default, you can save dashboards inthe /Dashboards folder.
To view a dashboard:
1. Log in as user demo, using the password demo.
Passwords are case-sensitive. You must use lowercase d when you type demo.
2. In the search field, enter supermart and click .
The search results are displayed.
3. Click the name SuperMart Dashboard in the list of results. Alternatively, right-click the nameand select Run from the context menu.
JasperReports Server displays the dashboard, which includes three reports:
Figure 2-2 SuperMart Dashboard Example
24
Chapter 2 Working with Jaspersoft Dashboards
4. When you hover your cursor over each report, controls appear for that individual report:Click Refresh to refresh the report content, and click Open in a new window to open the reportin a new window.
5. Select new values from the Start Month and End Month drop-downs and click Submit to changethe data displayed.
All three reports update to display data for the months you indicate.
6. Click Reset to set the input controls to the last values saved and return the dashboard to its initialview.
7. When done, click View > Repository to go back to the repository page.
Keep these points in mind when viewing a dashboard that has input controls:
• An input control may appear as a text field, a drop-down, a check box, a multi-select list box, or acalendar icon.
• If one of the frames in a dashboard does not refer to an input control, that frame does not updatewhen you change that input control’s value. Only reports that refer to the input control reflect thechange.
If a dashboard includes a Print View button, click it to display the dashboard without JasperReportsServer's header and footer; depending on your web browser, this also opens your browser's Printwindow.
2.2 Creating a DashboardAs a user, you can create a dashboard, though your permissions to access the repository may limit thecontent you can add and the location where you can save the dashboard.
This section includes:
• Dashboard Overview
• Creating a Simple Dashboard
• Adding Controls to a Dashboard
• Localizing Controls
• Adding a Custom URL to a Dashboard
• Refining a Dashboard’s Layout
• About Screen Sizes
2.2.1 Dashboard OverviewA dashboard can include the following content:
• Reports in the repository.
• Special content:
25
JasperReports Server User Guide
• Custom URL. Any URL-addressable web content. The dashboard can point to web contentand include it in a frame in a web page. For example, you might include a frame that points tothe logo on your corporate website; when that logo changes, the dashboard automaticallyupdates to reflect the branding change. A complex example is described in “Adding a CustomURL to a Dashboard” on page 30.
• Free Text. A free-form text entry field. Resizing this type of item changes the size of the fontin the label. Use free text items to add titles and instructional text to the dashboard.
• Single Controls and Multiple Controls. If a report you include on the dashboard is designedto use input controls or filters, you can add that capability to the dashboard. The server mapsinput controls to one or more frames. For example, if multiple reports include the sameparameter, the server automatically maps the corresponding control to each of those reportswhen you add the input control to the dashboard. Controls can also be manually mapped tocustom URL frames.
Multiple controls are those used by more than one report. Single controls are those used by asingle report.
• Dashboard Controls:
• Submit. Applies the values in the dashboard input controls to the reports that refer to eachinput control. The server refreshes these reports to display the new set of data. If thedashboard doesn’t include a Submit button, changes to input control values are reflectedimmediately.
• Reset. Resets the values of the input controls to the last value selected when thedashboard was saved.
• Print View. Displays the dashboard without buttons or the server’s header and footer, and(depending on the browser) opens the browser’s Print window.
• Text Label. Identifies an input control. When you add an input control to the dashboard,the server automatically adds a text label for it. Resizing this type of item only changesthe size of the label itself; the font size in the label is fixed.
2.2.2 Creating a Simple DashboardThis section describes the creation of a dashboard.
To add a report to a dashboard, you must have permission to view the report.
To create a simple dashboard:
1. Click Create > Dashboard.
The dashboard designer appears, displaying the list of available content and the canvas.
2. In Available Content, navigate to the /Reports/Samples folder, right-click the Freight Report.
3. Select Add to Dashboard:
26
Chapter 2 Working with Jaspersoft Dashboards
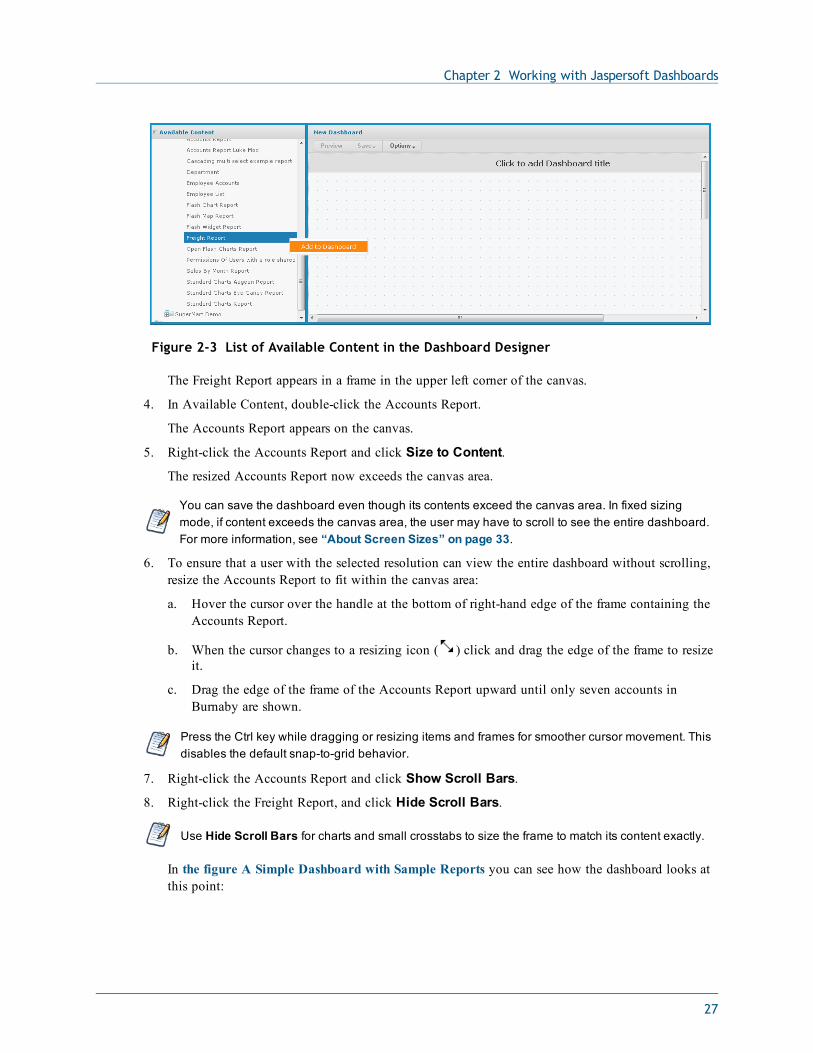
Figure 2-3 List of Available Content in the Dashboard Designer
The Freight Report appears in a frame in the upper left corner of the canvas.
4. In Available Content, double-click the Accounts Report.
The Accounts Report appears on the canvas.
5. Right-click the Accounts Report and click Size to Content.
The resized Accounts Report now exceeds the canvas area.
You can save the dashboard even though its contents exceed the canvas area. In fixed sizingmode, if content exceeds the canvas area, the user may have to scroll to see the entire dashboard.For more information, see “About Screen Sizes” on page 33.
6. To ensure that a user with the selected resolution can view the entire dashboard without scrolling,resize the Accounts Report to fit within the canvas area:
a. Hover the cursor over the handle at the bottom of right-hand edge of the frame containing theAccounts Report.
b. When the cursor changes to a resizing icon ( ) click and drag the edge of the frame to resizeit.
c. Drag the edge of the frame of the Accounts Report upward until only seven accounts inBurnaby are shown.
Press the Ctrl key while dragging or resizing items and frames for smoother cursor movement. Thisdisables the default snap-to-grid behavior.
7. Right-click the Accounts Report and click Show Scroll Bars.
8. Right-click the Freight Report, and click Hide Scroll Bars.
Use Hide Scroll Bars for charts and small crosstabs to size the frame to match its content exactly.
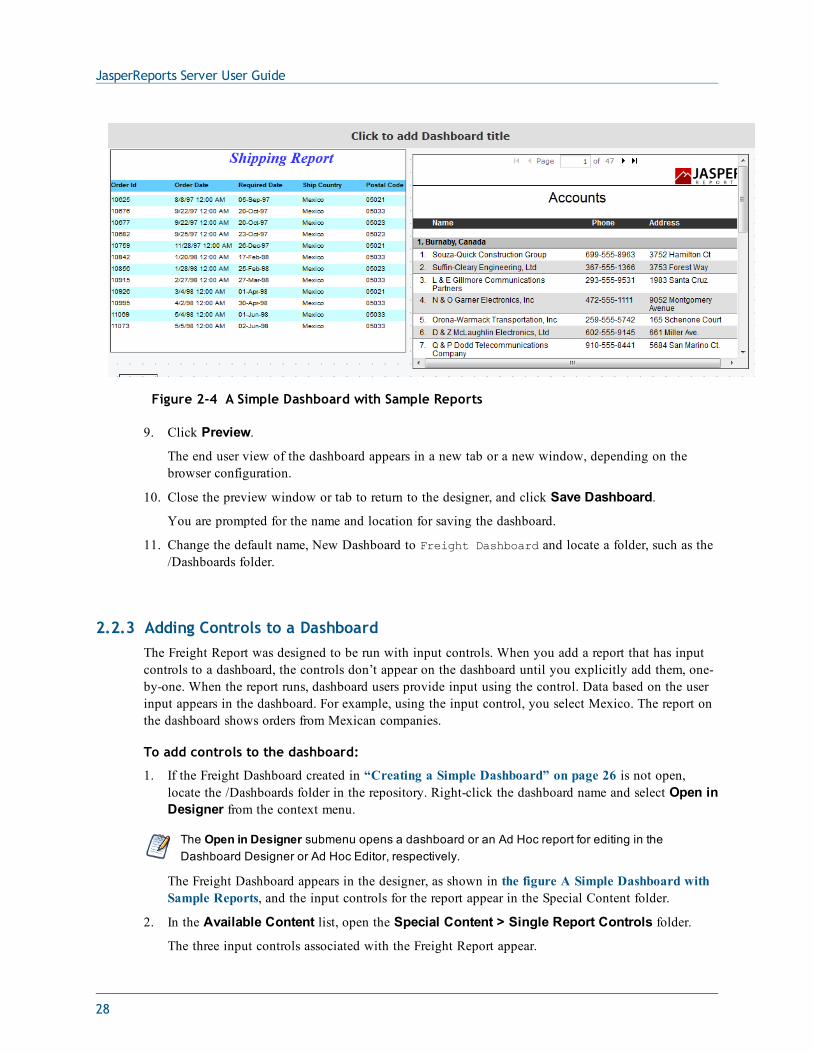
In the figure A Simple Dashboard with Sample Reports you can see how the dashboard looks atthis point:
27
JasperReports Server User Guide
Figure 2-4 A Simple Dashboard with Sample Reports
9. Click Preview.
The end user view of the dashboard appears in a new tab or a new window, depending on thebrowser configuration.
10. Close the preview window or tab to return to the designer, and click Save Dashboard.
You are prompted for the name and location for saving the dashboard.
11. Change the default name, New Dashboard to Freight Dashboard and locate a folder, such as the/Dashboards folder.
2.2.3 Adding Controls to a DashboardThe Freight Report was designed to be run with input controls. When you add a report that has inputcontrols to a dashboard, the controls don’t appear on the dashboard until you explicitly add them, one-by-one. When the report runs, dashboard users provide input using the control. Data based on the userinput appears in the dashboard. For example, using the input control, you select Mexico. The report onthe dashboard shows orders from Mexican companies.
To add controls to the dashboard:
1. If the Freight Dashboard created in “Creating a Simple Dashboard” on page 26 is not open,locate the /Dashboards folder in the repository. Right-click the dashboard name and select Open inDesigner from the context menu.
The Open in Designer submenu opens a dashboard or an Ad Hoc report for editing in theDashboard Designer or Ad Hoc Editor, respectively.
The Freight Dashboard appears in the designer, as shown in the figure A Simple Dashboard withSample Reports, and the input controls for the report appear in the Special Content folder.
2. In the Available Content list, open the Special Content > Single Report Controls folder.
The three input controls associated with the Freight Report appear.
28

Chapter 2 Working with Jaspersoft Dashboards
3. Right-click Country and select Add to Dashboard.
The Country input control and its label appear above the Freight Report on the canvas.
If you want to place the input control in a location other than above the report, drag it from theAvailable Content list to the desired location. You can delete, reposition, and resize the inputcontrol or its label independently.
4. Select a new value from the Country input control.
The data displayed in the Freight Report changes, but not in the Account report. The Accountreport does not refer to an input control named Country.
5. Add the OrderID and RequestDate controls to the dashboard. In the Available Content list,right-click RequestDate, and select Add to Dashboard. Right-click OrderID, and select Add toDashboard.
6. Ctrl-click to select the input controls and their labels.
You can use a selection rectangle or Ctrl-click to select multiple frames and items on the canvas.
7. Drag the controls below the Freight Report.
8. Draw a selection rectangle to select the OrderID input control and its label, and drag them directlybeneath the Country input control.
9. Draw a selection rectangle to select the RequestDate input control and its label, and drag themdirectly beneath the OrderID input control.
10. Click the OrderID label, and change it to Order.Change the RequestDate label to Date.
11. In the Available Content list, navigate to Special Content > Dashboard Controls, and dragthe Submit and Reset buttons underneath the input controls on the canvas.
By default, a dashboard automatically updates when you change the values in its input controls.When the dashboard includes the Submit button, the server doesn’t update the dashboard until youclick the Submit button.
12. Click Save.
The dashboard is saved to the repository.
2.2.4 Localizing ControlsYou can design dashboard controls to accommodate different languages. First, use the $R syntax todefine prompts and static lists of values. Next, attach resource bundles to the report that containtranslations of the prompts and lists of values. Finally, add the report to the dashboard. For moreinformation about how to localize input controls, see “Localizing Reports” on page 154.
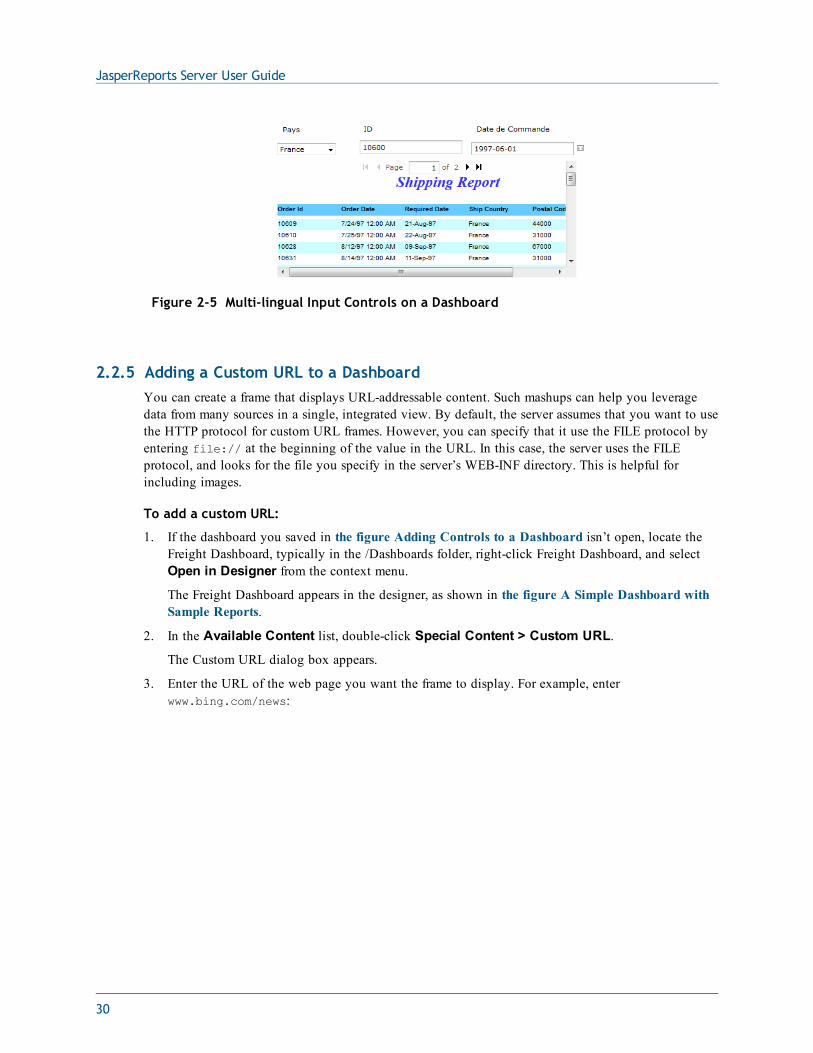
In the figure Multi-lingual Input Controls on a Dashboard , you can see an example of a dashboardthat contains localized controls for the Freight Report. The Dashboard Viewer prompts for input inFrench when the user logs in using the French locale setting.
29
JasperReports Server User Guide
Figure 2-5 Multi-lingual Input Controls on a Dashboard
2.2.5 Adding a Custom URL to a DashboardYou can create a frame that displays URL-addressable content. Such mashups can help you leveragedata from many sources in a single, integrated view. By default, the server assumes that you want to usethe HTTP protocol for custom URL frames. However, you can specify that it use the FILE protocol byentering file:// at the beginning of the value in the URL. In this case, the server uses the FILEprotocol, and looks for the file you specify in the server’s WEB-INF directory. This is helpful forincluding images.
To add a custom URL:
1. If the dashboard you saved in the figure Adding Controls to a Dashboard isn’t open, locate theFreight Dashboard, typically in the /Dashboards folder, right-click Freight Dashboard, and selectOpen in Designer from the context menu.
The Freight Dashboard appears in the designer, as shown in the figure A Simple Dashboard withSample Reports.
2. In the Available Content list, double-click Special Content > Custom URL.
The Custom URL dialog box appears.
3. Enter the URL of the web page you want the frame to display. For example, enterwww.bing.com/news:
30
Chapter 2 Working with Jaspersoft Dashboards
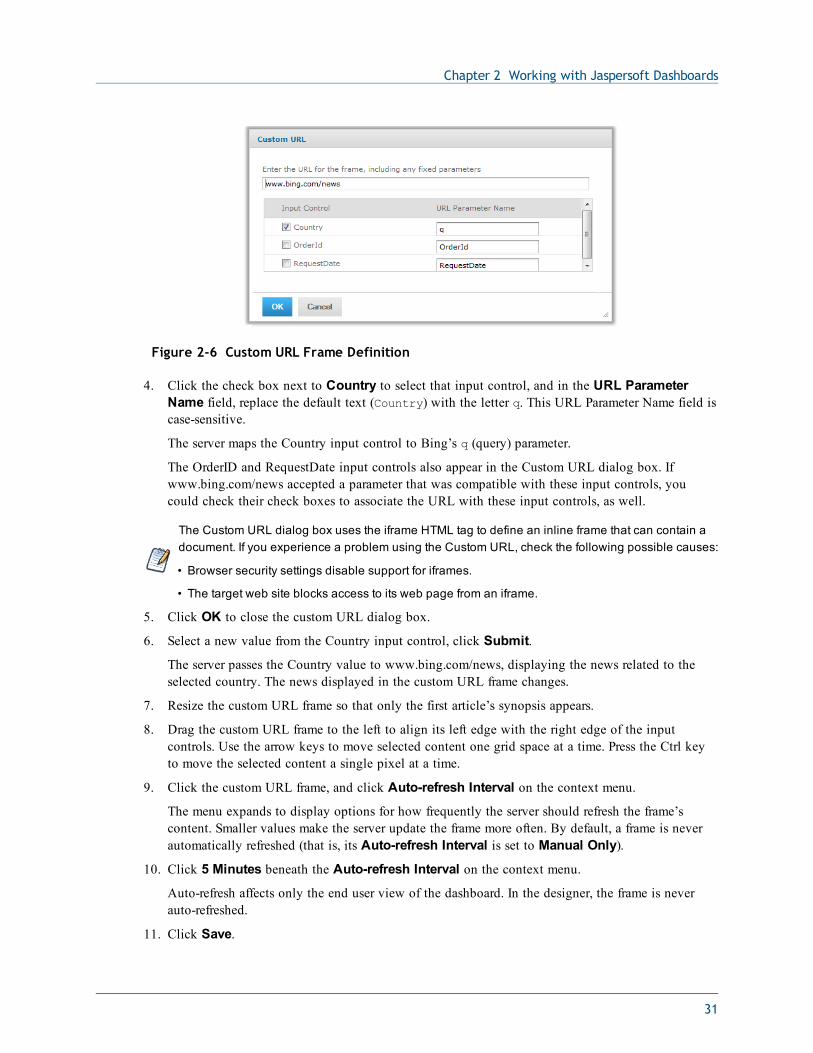
Figure 2-6 Custom URL Frame Definition
4. Click the check box next to Country to select that input control, and in the URL ParameterName field, replace the default text (Country) with the letter q. This URL Parameter Name field iscase-sensitive.
The server maps the Country input control to Bing’s q (query) parameter.
The OrderID and RequestDate input controls also appear in the Custom URL dialog box. Ifwww.bing.com/news accepted a parameter that was compatible with these input controls, youcould check their check boxes to associate the URL with these input controls, as well.
The Custom URL dialog box uses the iframe HTML tag to define an inline frame that can contain adocument. If you experience a problem using the Custom URL, check the following possible causes:
• Browser security settings disable support for iframes.
• The target web site blocks access to its web page from an iframe.
5. Click OK to close the custom URL dialog box.
6. Select a new value from the Country input control, click Submit.
The server passes the Country value to www.bing.com/news, displaying the news related to theselected country. The news displayed in the custom URL frame changes.
7. Resize the custom URL frame so that only the first article’s synopsis appears.
8. Drag the custom URL frame to the left to align its left edge with the right edge of the inputcontrols. Use the arrow keys to move selected content one grid space at a time. Press the Ctrl keyto move the selected content a single pixel at a time.
9. Click the custom URL frame, and click Auto-refresh Interval on the context menu.
The menu expands to display options for how frequently the server should refresh the frame’scontent. Smaller values make the server update the frame more often. By default, a frame is neverautomatically refreshed (that is, its Auto-refresh Interval is set to Manual Only).
10. Click 5 Minutes beneath the Auto-refresh Interval on the context menu.
Auto-refresh affects only the end user view of the dashboard. In the designer, the frame is neverauto-refreshed.
11. Click Save.
31
JasperReports Server User Guide
The dashboard is saved to the repository.
2.2.6 Refining a Dashboard’s LayoutAfter completing the layout, refine the look and feel of the dashboard.
To refine the dashboard’s layout:
1. If it isn’t open, locate the Freight Dashboard saved in “Adding a Custom URL to a Dashboard”on page 30, typically in the /Dashboards folder.
2. Right-click the dashboard name, select Open in Designer from the context menu, and clickPreview.
The end user’s view of the dashboard appears. If the dashboard is already open in the browser, theserver updates that page rather than opening a new window or tab.
3. In the Country field, select a new value.
The Freight Report and custom URL frames do not update because the dashboard includes theSubmit button.
4. Return to the dashboard designer and, on the canvas, hover the cursor over the Submit button.Click the hover border when it appears.
5. From the context menu, click Delete Item.
The Submit button disappears.
6. Reposition the Reset button to center it in the available space, then click Click to adddashboard title.
The title becomes editable.
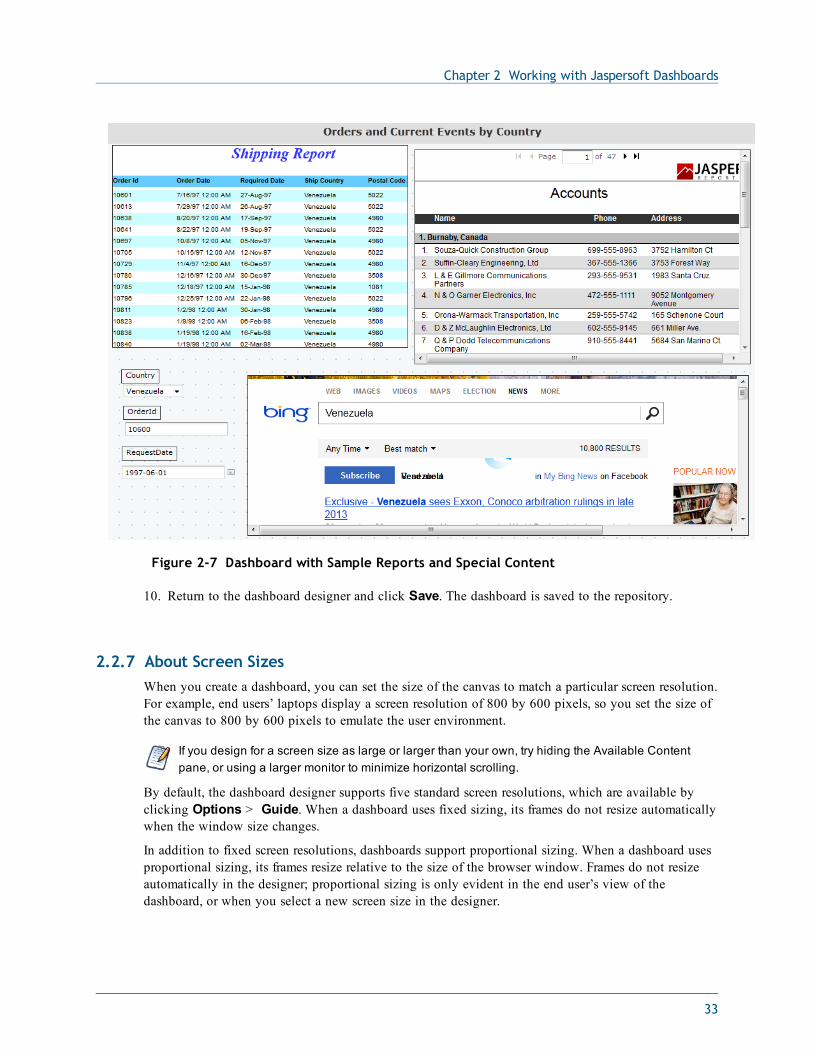
7. Enter Orders and Current Events by Country.
8. Click Preview.
The end user view of the dashboard appears.
9. Change the value in the Country input control.
The dashboard reflects the change immediately:
32
Chapter 2 Working with Jaspersoft Dashboards
Figure 2-7 Dashboard with Sample Reports and Special Content
10. Return to the dashboard designer and click Save. The dashboard is saved to the repository.
2.2.7 About Screen SizesWhen you create a dashboard, you can set the size of the canvas to match a particular screen resolution.For example, end users’ laptops display a screen resolution of 800 by 600 pixels, so you set the size ofthe canvas to 800 by 600 pixels to emulate the user environment.
If you design for a screen size as large or larger than your own, try hiding the Available Contentpane, or using a larger monitor to minimize horizontal scrolling.
By default, the dashboard designer supports five standard screen resolutions, which are available byclicking Options > Guide. When a dashboard uses fixed sizing, its frames do not resize automaticallywhen the window size changes.
In addition to fixed screen resolutions, dashboards support proportional sizing. When a dashboard usesproportional sizing, its frames resize relative to the size of the browser window. Frames do not resizeautomatically in the designer; proportional sizing is only evident in the end user’s view of thedashboard, or when you select a new screen size in the designer.
33
JasperReports Server User Guide
If a dashboard that uses proportional sizing is larger than the specified screen size, when the dashboardis viewed, Jaspersoft resizes the frames to fit in the window. No scrolling is required. This may result ina change to the shape of the frames.
Jaspersoft recommends that you design dashboards using fixed sizing mode, then switch toproportional sizing before you save.
In proportional sizing, note that:
• You can resize free text items to a smaller size, but you can’t make them larger.
• The grid turns red when any content hangs over the edge of the canvas.
2.3 Editing a DashboardYou can edit a dashboard if you have the proper permissions.
To edit a dashboard:
1. Select View > Repository and search or browse for the Dashboard you want to modify.
By default, the repository includes the /Dashboards folder where you can store dashboards.
2. Right-click the dashboard and select Open in Designer from the context menu.
The designer appears, displaying the dashboard.
3. Edit the dashboard by adding, removing, resizing, or dragging content. Drag an item from theAvailable Content list and drop it on an existing frame to replace the existing content.
For more information about working with dashboard content, see “Creating a Dashboard” onpage 25.
4. When you are satisfied with the dashboard, click Save.
5. To create a new version of the dashboard, select Save As from the Dashboard Selector contextmenu, and specify a new name.
2.4 Tips for Designing DashboardsCharts and small crosstabs are best suited to dashboards. However, you can design table reports thatwork well in the dashboard. Such reports tend to be very narrow and are typically used with inputcontrols to limit the number of rows they return.
Keep reports small because dashboards typically contain more than one. In particular, reports shouldn’tbe too wide, as horizontal room is always at a premium in a dashboard. The server strips margins froman Ad Hoc report when displaying the report on a dashboard.
2.4.1 Input Control TipsWhen designing input controls for a dashboard, keep these guidelines in mind:
34
Chapter 2 Working with Jaspersoft Dashboards
• If you want a single input control on the dashboard to control the data displayed in multiplereports, the reports themselves need parameters with the same name as the input control. Forexample, you might have a query-based list of employee names that can be used in both salesreports and human resources report.
• When defining a parameter in a report, give it a meaningful name that can be reused in otherreports. Then, when two reports that include this parameter are added to the dashboard, their inputcontrols appear as Special Content in the Available Content list. Storing such input controls inthe repository encourages reuse in other reports as they are designed and added to the repository.
• Consider the ramifications of designing input controls to use radio buttons. A report’s input controlthat displays as a radio button set appears as drop-down on a dashboard.
• To pass a value to an external URL, the URL Parameter Name you give to the input controlmust match the name of a parameter that the URL can accept. The value of the input control mustalso be a value the URL can accept. The target URL is likely to have additional requirements andlimitations. For example, the name of the parameter may be case-sensitive; in this case, the valueyou enter in the URL Parameter Name field is also case-sensitive. This is the case for Bing’s qparameter that is referenced in “Adding a Custom URL to a Dashboard” on page 30.
The input control must pass data that the URL can accept. Otherwise, the server may be unable toretrieve the correct data from the external URL.
2.4.2 Miscellaneous TipsWhen you create or edit a dashboard, keep these tips in mind:
• Alignment of items:
• You can use the computer’s arrow keys to move selected content one grid space at a time.
• Press the Ctrl key to move the selected content a single pixel at a time.
• Selection of items:
• The items on the context menu change depending on your selection. For example, the contextmenu might include the Delete Item or Delete Frame option, depending on whether youselected a button or a frame.
• If you select multiple items or frames, the context menu includes only options that apply to allselected items. For example, if you select a frame and a button, the context menu includes onlythe Delete Items option.
• When you select multiple frames, the context menu includes several options that can apply tothe frames as a group, such as Hide All Scroll Bars and Delete Items.
• Select multiple frames to change their sizes all at once. When you drag the edge of one frame,the other frames resize as well.
• Relocated or deleted reports in dashboards:
• When you delete a report with input controls from the dashboard, the controls are also deleted,but their labels remain. Delete labels manually.
• If a custom URL frame is mapped to a deleted input control, the server shows the default URLbut does not pass the parameter.
35
JasperReports Server User Guide
• Keep track of reports used in dashboards to prevent inadvertent deletion. The server deletes areport from a dashboard when you delete it from the repository or move it to a new location.
• Embedded dashboards:
• A dashboard can include other dashboards, unless this creates a circular dependency. Do notattempt to add a dashboard to itself.
• Multiple reports in a dashboard that refer to the same input control are controlled by thatsingle input control. If you want users to set the input controls separately for each report,create two dashboards, both of which refer to the input control; then, create a third dashboardthat includes the other two.
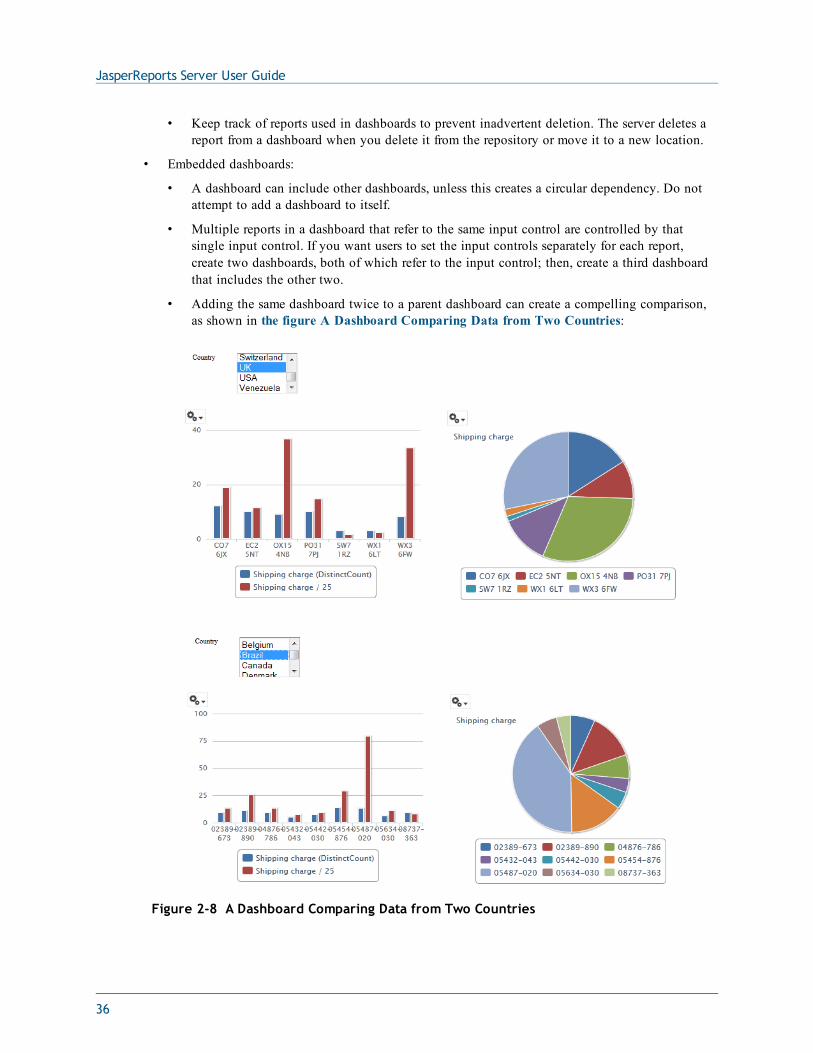
• Adding the same dashboard twice to a parent dashboard can create a compelling comparison,as shown in the figure A Dashboard Comparing Data from Two Countries:
Figure 2-8 A Dashboard Comparing Data from Two Countries
36
CHAPTER 3 RUNNING REPORTS AND THE REPORT VIEWER
JasperReports Server makes it easy to run reports. When you run a report, it opens in the interactiveReport Viewer. With the Viewer, you can personalize and refine the displayed report data. If the reporthas input controls, you run the report with one set of data and then another. Using the report scheduler,you can run reports repeatedly and unattended during off hours or at other times.
This chapter contains the following sections:
• Overview of The Report Viewer
• Running or Creating a Simple Report
• Running a Flash Chart
• Running a Report with Input Controls or Filters
• Scheduling Reports
• Event Messages
The tutorials in this chapter and throughout this guide assume you’ve installed the sample dataprovided with the server.
3.1 Overview of The Report ViewerThe Report Viewer allows you to view a report, export content to various output formats, and applyformatting, sorting, and filters to control how the data is displayed.
This section describes the functions available in the Report Viewer. You can find more detailedinformation about using this functionality throughout this chapter.
To open a report in the Report Viewer:
1. Locate your report in the library or repository.
2. Click the report name, or right-click the report name and select Run. In the repository, you canalso click the report row and select Run from the tool bar.
The report opens in the Report Viewer.
37
JasperReports Server User Guide
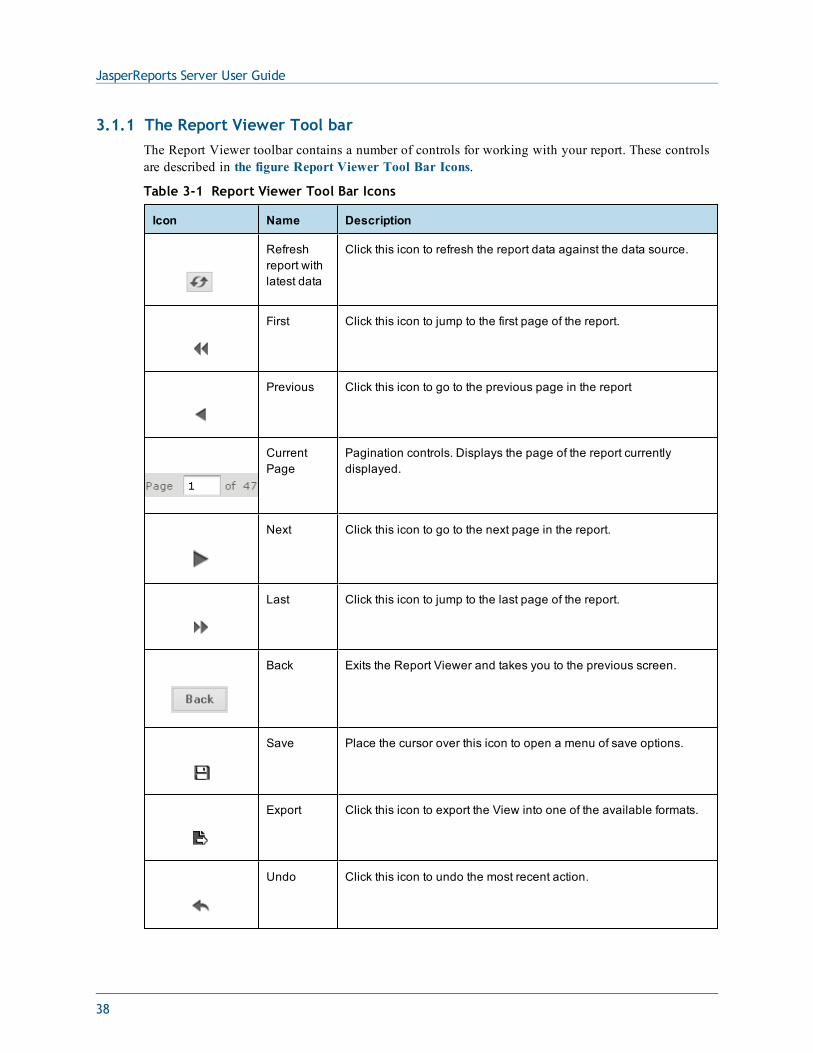
3.1.1 The Report Viewer Tool barThe Report Viewer toolbar contains a number of controls for working with your report. These controlsare described in the figure Report Viewer Tool Bar Icons.
Icon Name Description
Refreshreport withlatest data
Click this icon to refresh the report data against the data source.
First Click this icon to jump to the first page of the report.
Previous Click this icon to go to the previous page in the report
CurrentPage
Pagination controls. Displays the page of the report currentlydisplayed.
Next Click this icon to go to the next page in the report.
Last Click this icon to jump to the last page of the report.
Back Exits the Report Viewer and takes you to the previous screen.
Save Place the cursor over this icon to open a menu of save options.
Export Click this icon to export the View into one of the available formats.
Undo Click this icon to undo the most recent action.
Table 3-1 Report Viewer Tool Bar Icons
38
Chapter 3 Running Reports and the Report Viewer
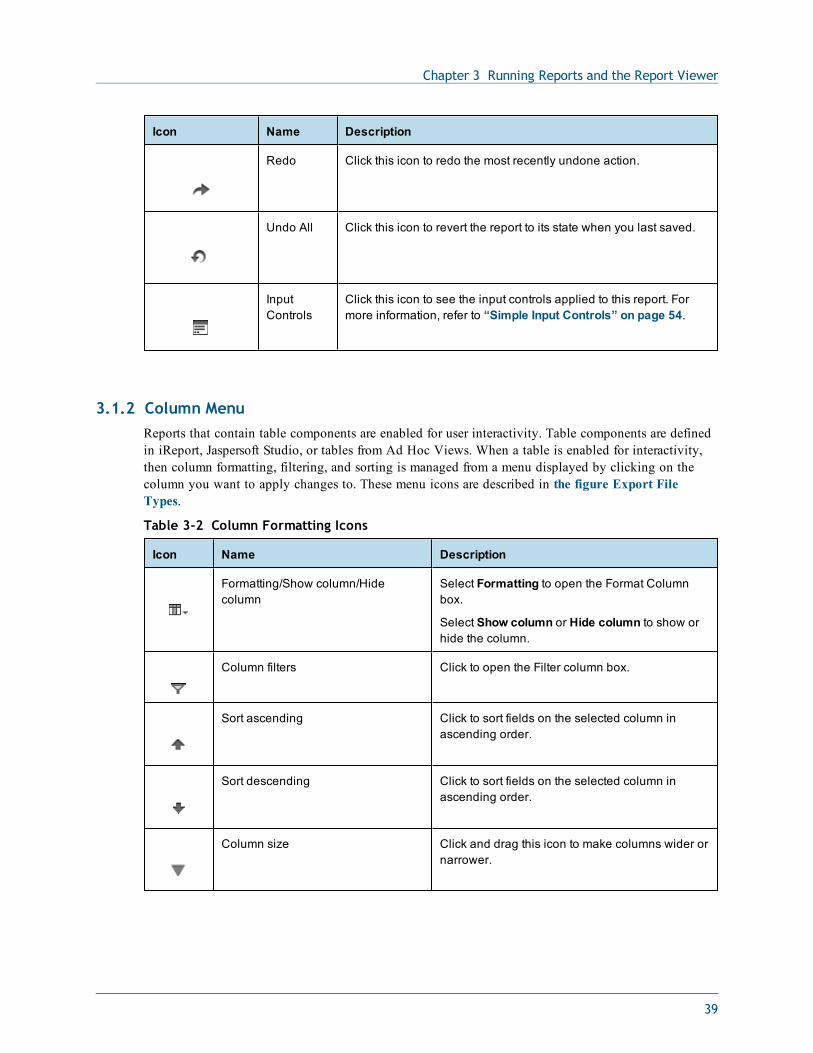
Icon Name Description
Redo Click this icon to redo the most recently undone action.
Undo All Click this icon to revert the report to its state when you last saved.
InputControls
Click this icon to see the input controls applied to this report. Formore information, refer to “Simple Input Controls” on page 54.
3.1.2 Column MenuReports that contain table components are enabled for user interactivity. Table components are definedin iReport, Jaspersoft Studio, or tables from Ad Hoc Views. When a table is enabled for interactivity,then column formatting, filtering, and sorting is managed from a menu displayed by clicking on thecolumn you want to apply changes to. These menu icons are described in the figure Export FileTypes.
Icon Name Description
Formatting/Show column/Hidecolumn
Select Formatting to open the Format Columnbox.
Select Show column or Hide column to show orhide the column.
Column filters Click to open the Filter column box.
Sort ascending Click to sort fields on the selected column inascending order.
Sort descending Click to sort fields on the selected column inascending order.
Column size Click and drag this icon to make columns wider ornarrower.
Table 3-2 Column Formatting Icons
39
JasperReports Server User Guide
3.1.3 Data SnapshotsSome reports have an optional Data Snapshot feature enabled. A Data Snapshot is a cached copy of thedata included in a specific report. Data Snapshots allow you to access a report's data (including inputcontrol settings) without having to retrieve it from the data source, which in some cases can save asignificant amount of time.
When a report is opened in the Report Viewer, data is retrieved from the Data Snapshot. If the Snapshotdoes not exist, then a live query is made to the data source. A Snapshot is created when a report issaved from the viewer, or via the scheduler. The Report Viewer UI displays a date and time stamp thatindicates when the report data was last refreshed with live source data.
The system administrator can enable or disable the Data Snapshot feature.
It should be noted that a report can have only one Snapshot. For instance, if you edit and save a reportthat already has a Snapshot associated with it, a new Snapshot is created. that Snapshot overwrites theexisting, previously-created Snapshot.
3.2 Running or Creating a Simple ReportYou can view and work on a report in the Report Viewer in a number of ways:
• Running an instance of an existing report
• Creating a new report from an existing Ad Hoc view
3.2.1 Running a Simple ReportThis section describes how to run a tabular report that lists account data.
To run a report:
1. Log into the server as an administrator, such as jasperadmin.
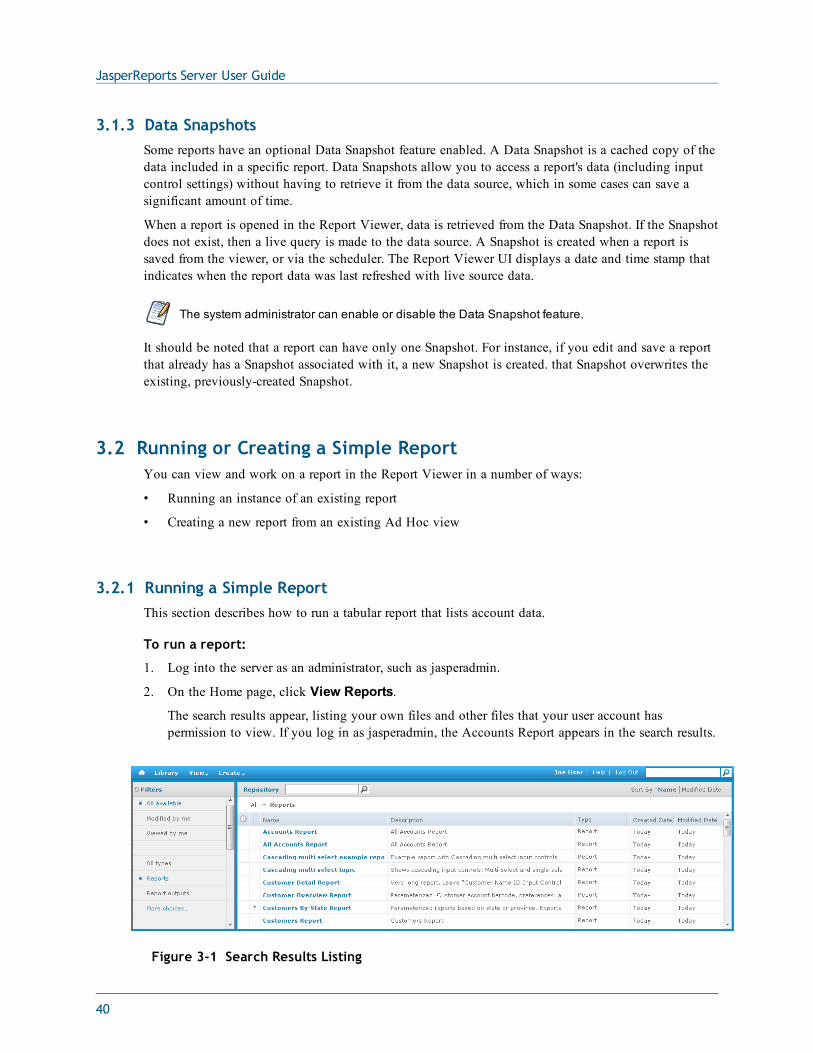
2. On the Home page, click View Reports.
The search results appear, listing your own files and other files that your user account haspermission to view. If you log in as jasperadmin, the Accounts Report appears in the search results.
Figure 3-1 Search Results Listing
40
Chapter 3 Running Reports and the Report Viewer
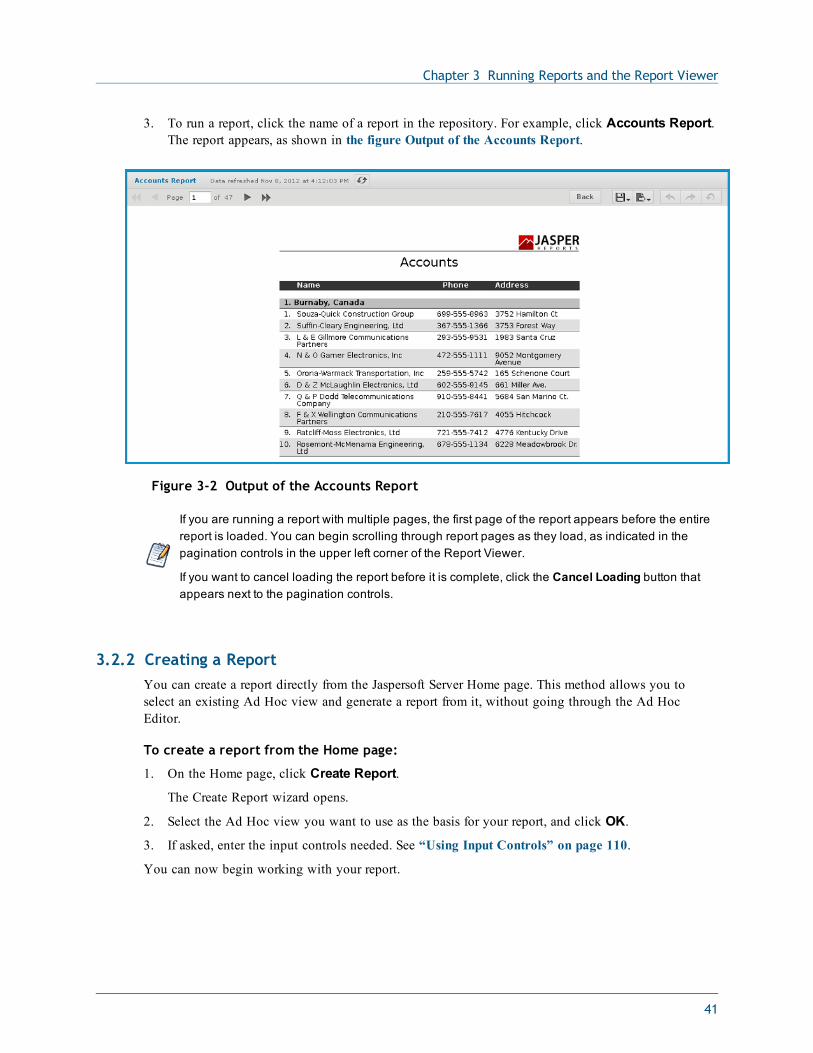
3. To run a report, click the name of a report in the repository. For example, click Accounts Report.The report appears, as shown in the figure Output of the Accounts Report.
Figure 3-2 Output of the Accounts Report
If you are running a report with multiple pages, the first page of the report appears before the entirereport is loaded. You can begin scrolling through report pages as they load, as indicated in thepagination controls in the upper left corner of the Report Viewer.
If you want to cancel loading the report before it is complete, click the Cancel Loading button thatappears next to the pagination controls.
3.2.2 Creating a ReportYou can create a report directly from the Jaspersoft Server Home page. This method allows you toselect an existing Ad Hoc view and generate a report from it, without going through the Ad HocEditor.
To create a report from the Home page:
1. On the Home page, click Create Report.
The Create Report wizard opens.
2. Select the Ad Hoc view you want to use as the basis for your report, and click OK.
3. If asked, enter the input controls needed. See “Using Input Controls” on page 110.
You can now begin working with your report.
41
JasperReports Server User Guide
3.3 Getting New Perspectives on DataThe report shown in the figure Output of the Accounts Report was created in iReport using the TableComponent. As this type of report runs, you can interact with it in the Report Viewer to visualize thedata in different ways. Column formatting allows you to highlight certain columns and fields, andfiltering and sorting report output on-the-fly can provide timely views of the data that answer yourquestions. For example, suppose you’re running the Accounts Report and want to know how manyaccounts have offices nearby. Highlighting the phone number column with red text and filtering it toshow only accounts in your area code would reveal this data.
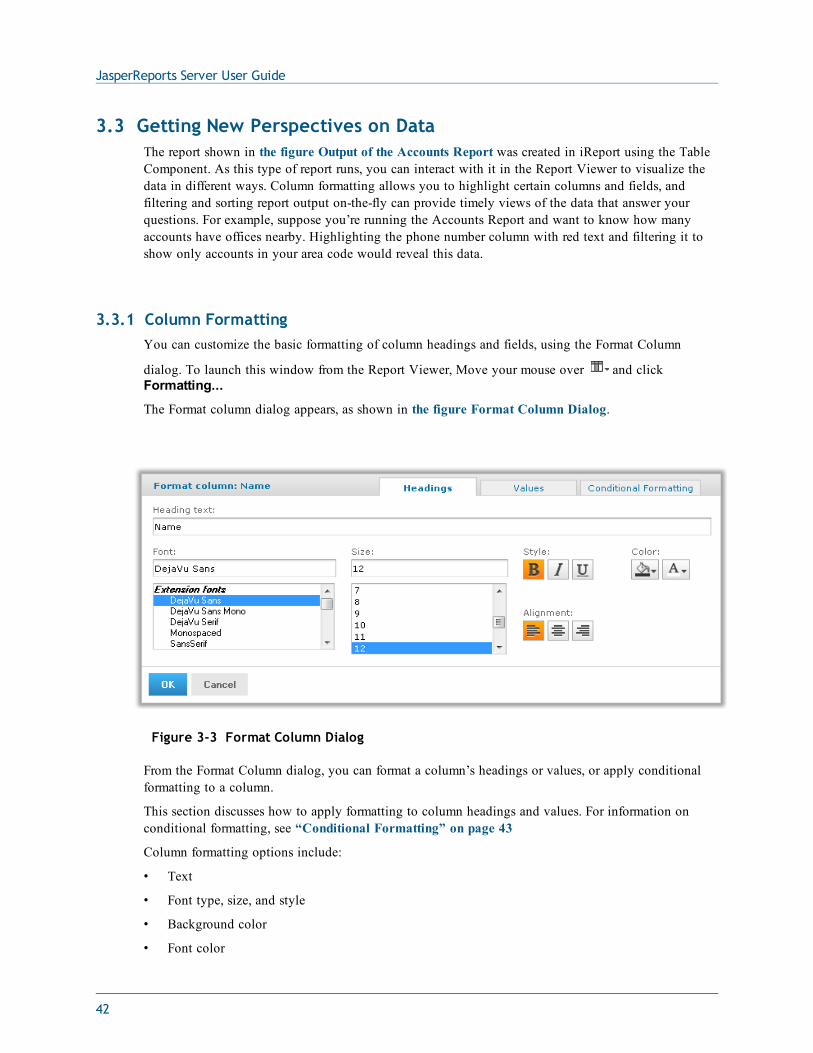
3.3.1 Column FormattingYou can customize the basic formatting of column headings and fields, using the Format Column
dialog. To launch this window from the Report Viewer, Move your mouse over and clickFormatting...
The Format column dialog appears, as shown in the figure Format Column Dialog.
Figure 3-3 Format Column Dialog
From the Format Column dialog, you can format a column’s headings or values, or apply conditionalformatting to a column.
This section discusses how to apply formatting to column headings and values. For information onconditional formatting, see “Conditional Formatting” on page 43
Column formatting options include:
• Text
• Font type, size, and style
• Background color
• Font color
42
Chapter 3 Running Reports and the Report Viewer
• Text alignment
To customize your column formatting:
1. Run your report, so it opens in the Report Viewer.
2. Click the header or field of the column you want to format.
3. Move your mouse over and click Formatting...4. To format a column’s heading, click the Headings tab, and change the following options if
needed:
• Heading text – Type new heading text to replace the current text.
• Font – Scroll through the menu to select a font.
• Size – Scroll through the menu to select a font size.
• Style – Click to select Bold, Italic, or Underlined text.• Background Color – Click to open the background color picker, then click to select the background
color.
• Font Color – Click to open the font color picker, then click to select the text color.
• Alignment – Click to select Left, Center, or Right alignment.
5. To format the text in a column’s fields, click the Values tab, and change the following options ifneeded:
• Font – Scroll through the menu to select a font.
• Size – Scroll through the menu to select a font size.• Background Color – Click to open the background color picker, then click to select the background
color.
• Font Color – Click to open the font color picker, then click to select the text color.
• Alignment – Click to select Left, Center, or Right alignment.
6. Click OK.
3.3.2 Conditional FormattingThe Report Viewer allows you to format column headings and fields, to highlight data that meetsspecific criteria. For instance, if you want to call out fields for store sales above $100,000, you can doso by applying text and background formatting to those stores that meet those numbers.
With conditional formatting, you can apply the formatting options listed in “Column Formatting” onpage 42. However, it is a slightly more complex process than applying formatting options to entirecolumns. This section describes those complexities, including:
• Condition hierarchy
• Condition button states
• Applying conditional formatting
43
JasperReports Server User Guide
3.3.2.1 Condition Hierarchy
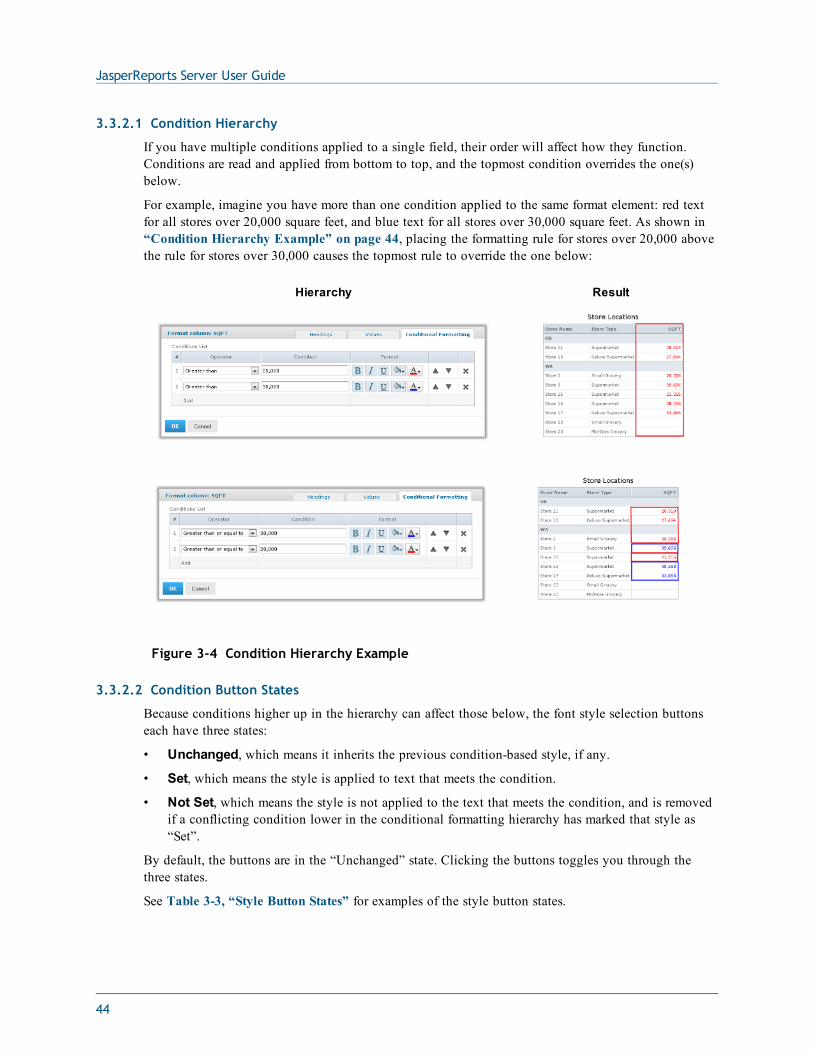
If you have multiple conditions applied to a single field, their order will affect how they function.Conditions are read and applied from bottom to top, and the topmost condition overrides the one(s)below.
For example, imagine you have more than one condition applied to the same format element: red textfor all stores over 20,000 square feet, and blue text for all stores over 30,000 square feet. As shown in“Condition Hierarchy Example” on page 44, placing the formatting rule for stores over 20,000 abovethe rule for stores over 30,000 causes the topmost rule to override the one below:
Hierarchy Result
Figure 3-4 Condition Hierarchy Example
3.3.2.2 Condition Button States
Because conditions higher up in the hierarchy can affect those below, the font style selection buttonseach have three states:
• Unchanged, which means it inherits the previous condition-based style, if any.
• Set, which means the style is applied to text that meets the condition.
• Not Set, which means the style is not applied to the text that meets the condition, and is removedif a conflicting condition lower in the conditional formatting hierarchy has marked that style as“Set”.
By default, the buttons are in the “Unchanged” state. Clicking the buttons toggles you through thethree states.
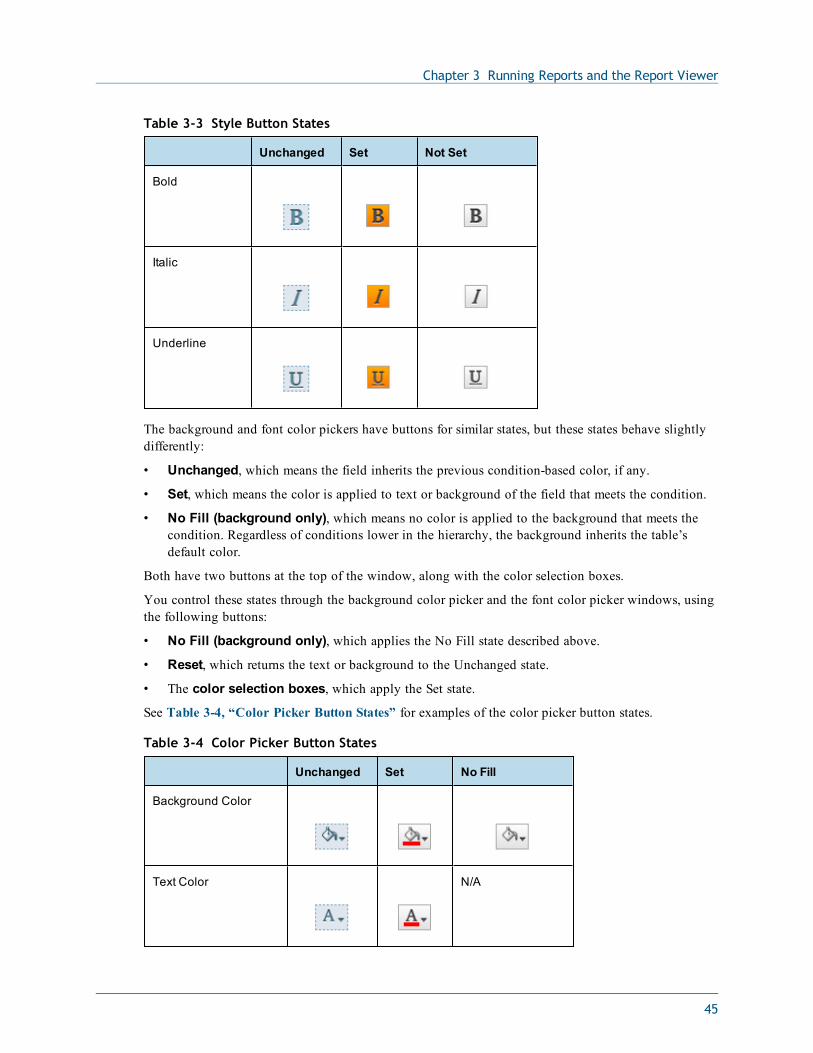
See Table 3-3, “Style Button States” for examples of the style button states.
44
Chapter 3 Running Reports and the Report Viewer
Unchanged Set Not Set
Bold
Italic
Underline
Table 3-3 Style Button States
The background and font color pickers have buttons for similar states, but these states behave slightlydifferently:
• Unchanged, which means the field inherits the previous condition-based color, if any.
• Set, which means the color is applied to text or background of the field that meets the condition.
• No Fill (background only), which means no color is applied to the background that meets thecondition. Regardless of conditions lower in the hierarchy, the background inherits the table’sdefault color.
Both have two buttons at the top of the window, along with the color selection boxes.
You control these states through the background color picker and the font color picker windows, usingthe following buttons:
• No Fill (background only), which applies the No Fill state described above.
• Reset, which returns the text or background to the Unchanged state.
• The color selection boxes, which apply the Set state.
See Table 3-4, “Color Picker Button States” for examples of the color picker button states.
Unchanged Set No Fill
Background Color
Text Color N/A
Table 3-4 Color Picker Button States
45
JasperReports Server User Guide
3.3.2.3 Applying Conditional Formatting
You apply conditional formatting much like you do standard column formatting, as described in“Column Formatting” on page 42 with the extra step of creating the condition by which theformatting is applied.
To create a condition:
1. Run your report, so it opens in the Report Viewer.
2. Click the header or field of the column you want to format.
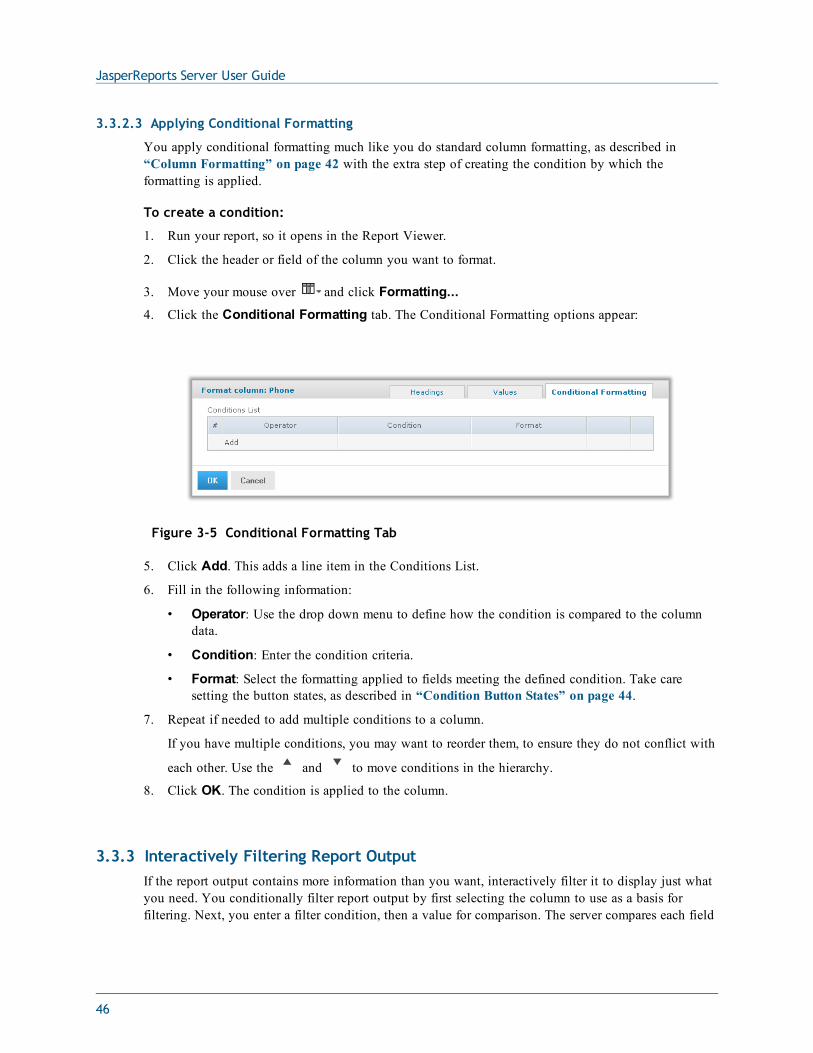
3. Move your mouse over and click Formatting...4. Click the Conditional Formatting tab. The Conditional Formatting options appear:
Figure 3-5 Conditional Formatting Tab
5. Click Add. This adds a line item in the Conditions List.
6. Fill in the following information:
• Operator: Use the drop down menu to define how the condition is compared to the columndata.
• Condition: Enter the condition criteria.
• Format: Select the formatting applied to fields meeting the defined condition. Take caresetting the button states, as described in “Condition Button States” on page 44.
7. Repeat if needed to add multiple conditions to a column.
If you have multiple conditions, you may want to reorder them, to ensure they do not conflict with
each other. Use the and to move conditions in the hierarchy.
8. Click OK. The condition is applied to the column.
3.3.3 Interactively Filtering Report OutputIf the report output contains more information than you want, interactively filter it to display just whatyou need. You conditionally filter report output by first selecting the column to use as a basis forfiltering. Next, you enter a filter condition, then a value for comparison. The server compares each field
46
Chapter 3 Running Reports and the Report Viewer
of the column to the value that meets the condition. In the figure Interactive Filtering Conditions youcan see the conditions available for each type of column: numeric, date, and text.
Numeric Date Text
Equals Equals Equals
Does not equal Is not equal to Is not equal to
Greater than Is between Contains
Greater than or equal to Is not between Does not contain
Less than Is on or before Starts with
Less than or equal to Is before Does not start with
Is between Is on or after Ends with
Is not between Is after Does not end with
Table 3-5 Interactive Filtering Conditions
To interactively filter report data:
1. As you run the type of report shown in the figure Output of the Accounts Report, click thecolumn you want to use for filtering the report. Continuing with the example in “Running orCreating a Simple Report” on page 40, click the Phone column in the Accounts report.
2. Click the .
The Filter column dialog appears, as shown in the figure Filter Column Dialog. By default,Show all rows is selected.
3. To build your filter, click the radio button to select Show only rows where.
the comparison operator drop-down and value entry box become active.
4. Select a comparison operator from the drop-down. For example, select Starts with to comparephone numbers starting with certain numbers.
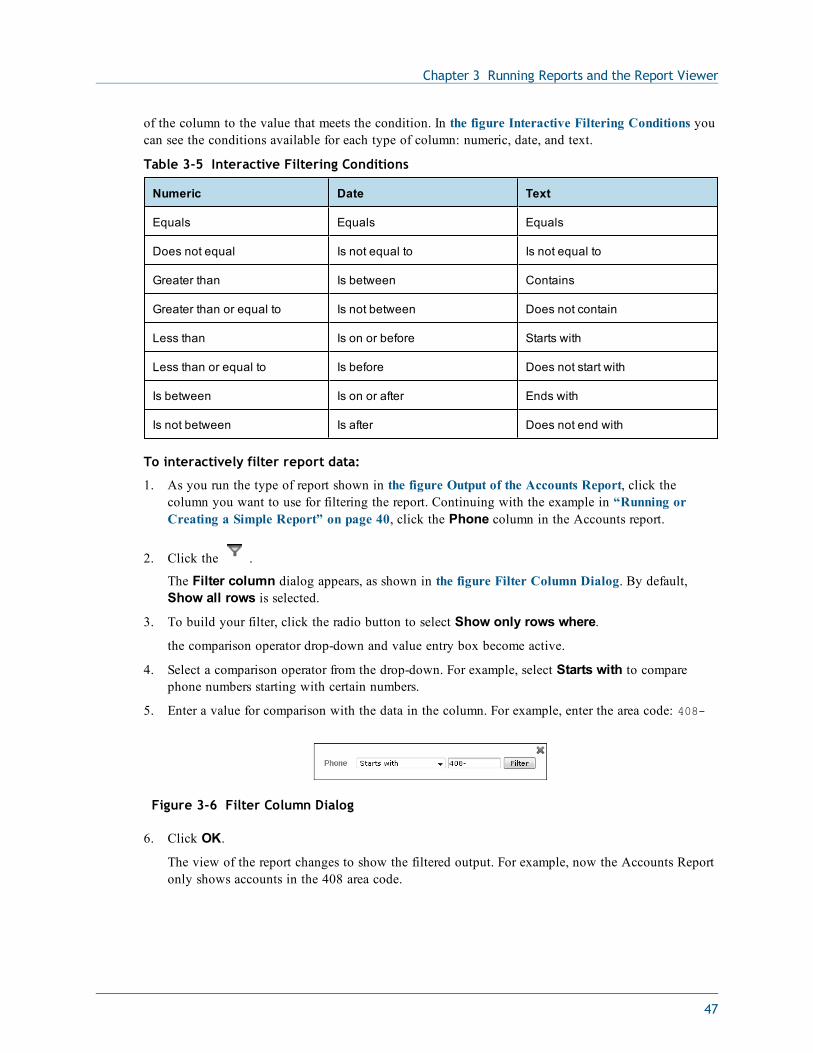
5. Enter a value for comparison with the data in the column. For example, enter the area code: 408-
Figure 3-6 Filter Column Dialog
6. Click OK.
The view of the report changes to show the filtered output. For example, now the Accounts Reportonly shows accounts in the 408 area code.
47
JasperReports Server User Guide
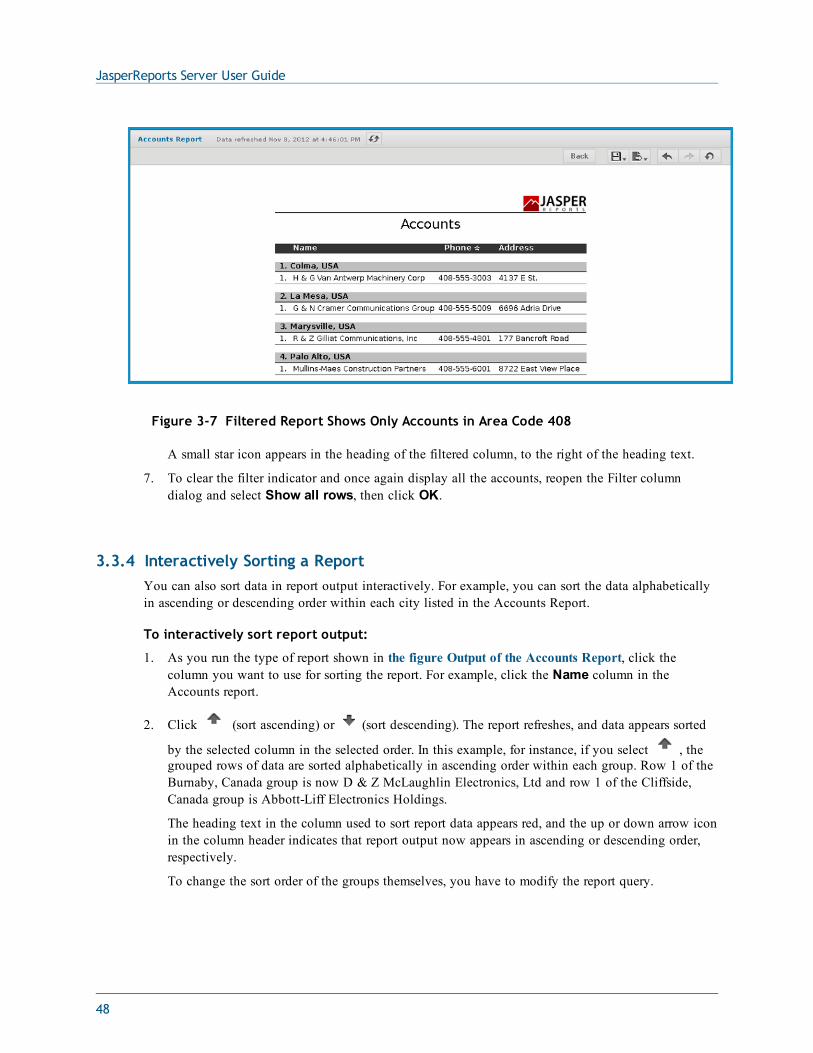
Figure 3-7 Filtered Report Shows Only Accounts in Area Code 408
A small star icon appears in the heading of the filtered column, to the right of the heading text.
7. To clear the filter indicator and once again display all the accounts, reopen the Filter columndialog and select Show all rows, then click OK.
3.3.4 Interactively Sorting a ReportYou can also sort data in report output interactively. For example, you can sort the data alphabeticallyin ascending or descending order within each city listed in the Accounts Report.
To interactively sort report output:
1. As you run the type of report shown in the figure Output of the Accounts Report, click thecolumn you want to use for sorting the report. For example, click the Name column in theAccounts report.
2. Click (sort ascending) or (sort descending). The report refreshes, and data appears sorted
by the selected column in the selected order. In this example, for instance, if you select , thegrouped rows of data are sorted alphabetically in ascending order within each group. Row 1 of theBurnaby, Canada group is now D & Z McLaughlin Electronics, Ltd and row 1 of the Cliffside,Canada group is Abbott-Liff Electronics Holdings.
The heading text in the column used to sort report data appears red, and the up or down arrow iconin the column header indicates that report output now appears in ascending or descending order,respectively.
To change the sort order of the groups themselves, you have to modify the report query.
48
Chapter 3 Running Reports and the Report Viewer
3.3.5 Moving, Resizing, and Hiding ColumnsColumns are easily moved, resized, and hidden in your report.
• To move a column, click the column you want to move, then drag the column left or right into the
new position. The indicates where the column is placed.
• To resize a column, click the column you want to resize, then drag the until the column is thesize you want.
• To hide a column, click the column you want to hide, then move your mouse over the andselect Hide column.
3.4 Navigating the ReportIf your report has multiple pages, you can use the pagination controls to move through the reportquickly.
To navigate the published report:
• Use at the top of the Report Viewer to navigate to the previous page.
• Use to navigate to the next page.
• Use to go to the end of the report.
• Use to go to the beginning of the report.
• If you know the number of the page you want to view, enter the page number in the Current Pageindicator box.
3.5 Exporting the Report
To export the report:
1. To view and save the report in other formats, click the Export button.
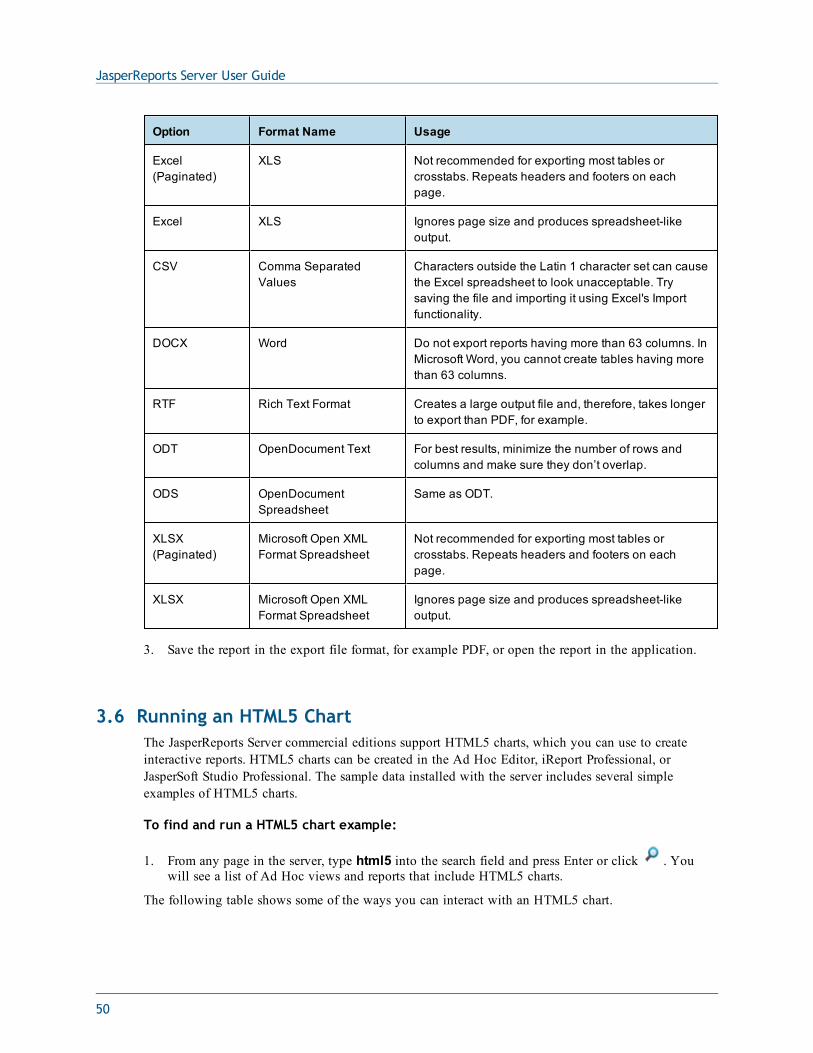
2. Select an export format from the drop-down. The export options are listed in the figure Export FileTypes.
Option Format Name Usage
PDF Adobe Acrobat To prevent horizontal truncation of an Ad Hoc reportwhen exported, set the Actual Size option in the AdHoc Editor.
Table 3-6 Export File Types
49
JasperReports Server User Guide
Option Format Name Usage
Excel(Paginated)
XLS Not recommended for exporting most tables orcrosstabs. Repeats headers and footers on eachpage.
Excel XLS Ignores page size and produces spreadsheet-likeoutput.
CSV Comma SeparatedValues
Characters outside the Latin 1 character set can causethe Excel spreadsheet to look unacceptable. Trysaving the file and importing it using Excel's Importfunctionality.
DOCX Word Do not export reports having more than 63 columns. InMicrosoft Word, you cannot create tables having morethan 63 columns.
RTF Rich Text Format Creates a large output file and, therefore, takes longerto export than PDF, for example.
ODT OpenDocument Text For best results, minimize the number of rows andcolumns and make sure they don’t overlap.
ODS OpenDocumentSpreadsheet
Same as ODT.
XLSX(Paginated)
Microsoft Open XMLFormat Spreadsheet
Not recommended for exporting most tables orcrosstabs. Repeats headers and footers on eachpage.
XLSX Microsoft Open XMLFormat Spreadsheet
Ignores page size and produces spreadsheet-likeoutput.
3. Save the report in the export file format, for example PDF, or open the report in the application.
3.6 Running an HTML5 ChartThe JasperReports Server commercial editions support HTML5 charts, which you can use to createinteractive reports. HTML5 charts can be created in the Ad Hoc Editor, iReport Professional, orJasperSoft Studio Professional. The sample data installed with the server includes several simpleexamples of HTML5 charts.
To find and run a HTML5 chart example:
1. From any page in the server, type html5 into the search field and press Enter or click . Youwill see a list of Ad Hoc views and reports that include HTML5 charts.
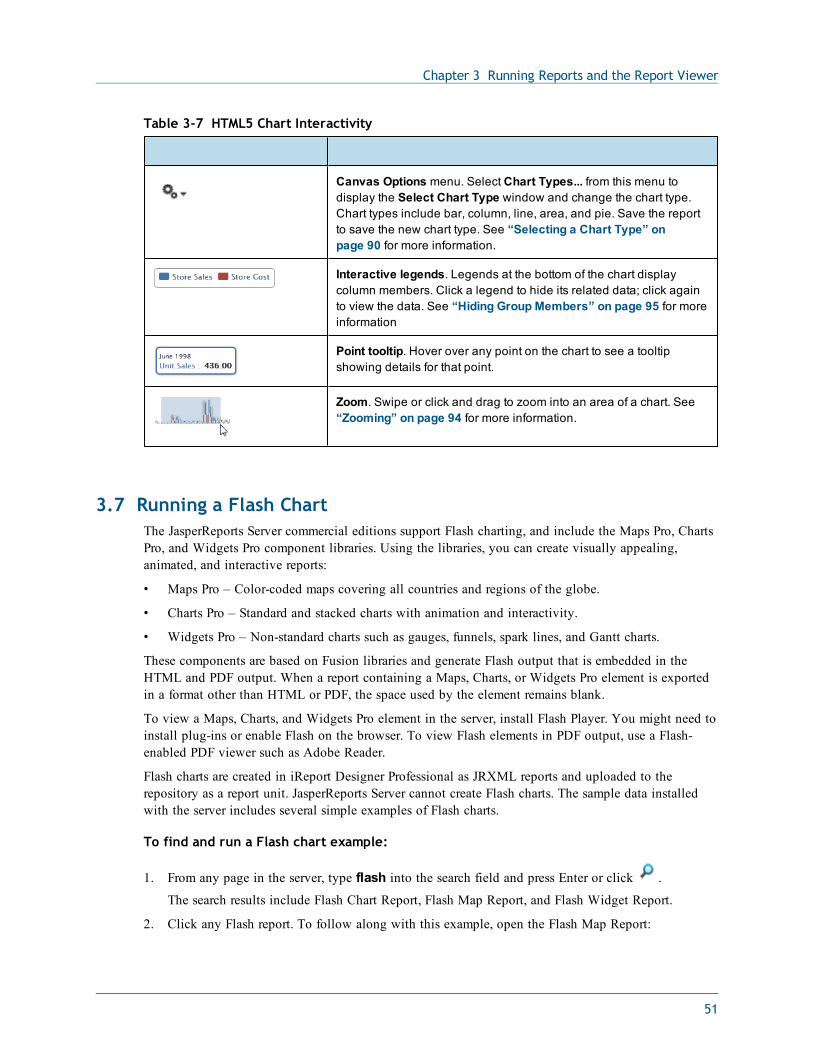
The following table shows some of the ways you can interact with an HTML5 chart.
50
Chapter 3 Running Reports and the Report Viewer
Canvas Options menu. Select Chart Types... from this menu todisplay the Select Chart Type window and change the chart type.Chart types include bar, column, line, area, and pie. Save the reportto save the new chart type. See “Selecting a Chart Type” onpage 90 for more information.
Interactive legends. Legends at the bottom of the chart displaycolumn members. Click a legend to hide its related data; click againto view the data. See “Hiding Group Members” on page 95 for moreinformation
Point tooltip. Hover over any point on the chart to see a tooltipshowing details for that point.
Zoom. Swipe or click and drag to zoom into an area of a chart. See“Zooming” on page 94 for more information.
Table 3-7 HTML5 Chart Interactivity
3.7 Running a Flash ChartThe JasperReports Server commercial editions support Flash charting, and include the Maps Pro, ChartsPro, and Widgets Pro component libraries. Using the libraries, you can create visually appealing,animated, and interactive reports:
• Maps Pro – Color-coded maps covering all countries and regions of the globe.
• Charts Pro – Standard and stacked charts with animation and interactivity.
• Widgets Pro – Non-standard charts such as gauges, funnels, spark lines, and Gantt charts.
These components are based on Fusion libraries and generate Flash output that is embedded in theHTML and PDF output. When a report containing a Maps, Charts, or Widgets Pro element is exportedin a format other than HTML or PDF, the space used by the element remains blank.
To view a Maps, Charts, and Widgets Pro element in the server, install Flash Player. You might need toinstall plug-ins or enable Flash on the browser. To view Flash elements in PDF output, use a Flash-enabled PDF viewer such as Adobe Reader.
Flash charts are created in iReport Designer Professional as JRXML reports and uploaded to therepository as a report unit. JasperReports Server cannot create Flash charts. The sample data installedwith the server includes several simple examples of Flash charts.
To find and run a Flash chart example:
1. From any page in the server, type flash into the search field and press Enter or click .
The search results include Flash Chart Report, Flash Map Report, and Flash Widget Report.
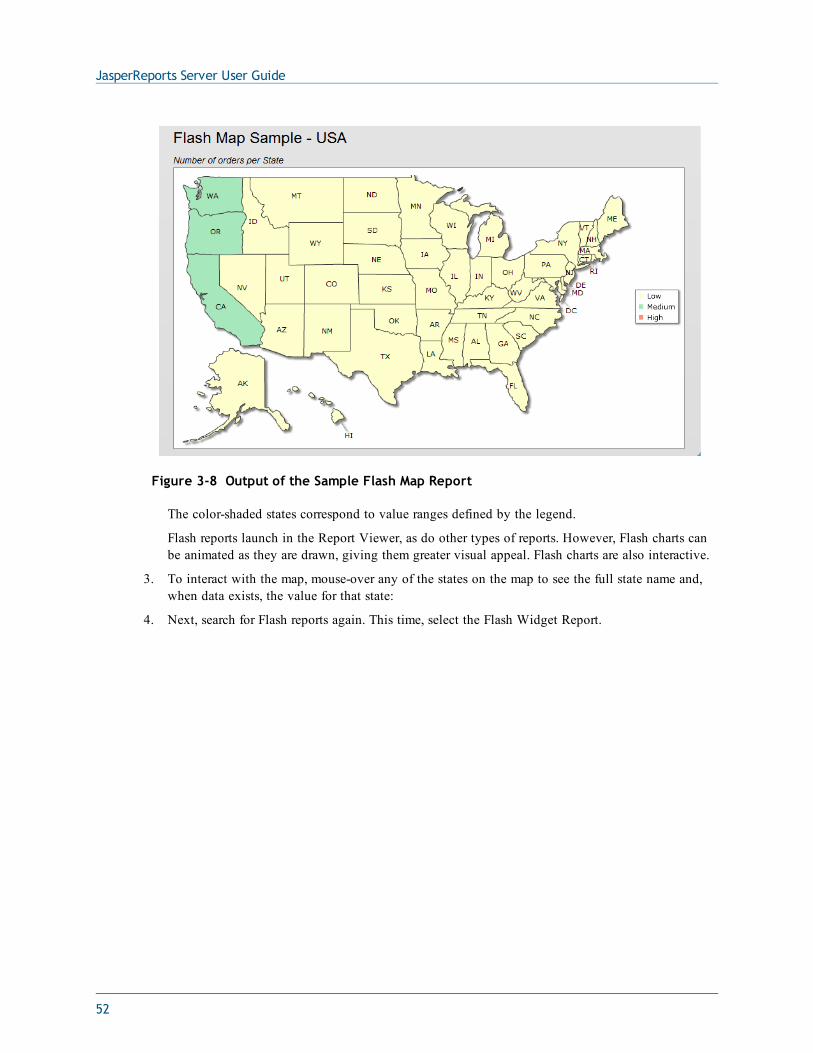
2. Click any Flash report. To follow along with this example, open the Flash Map Report:
51
JasperReports Server User Guide
Figure 3-8 Output of the Sample Flash Map Report
The color-shaded states correspond to value ranges defined by the legend.
Flash reports launch in the Report Viewer, as do other types of reports. However, Flash charts canbe animated as they are drawn, giving them greater visual appeal. Flash charts are also interactive.
3. To interact with the map, mouse-over any of the states on the map to see the full state name and,when data exists, the value for that state:
4. Next, search for Flash reports again. This time, select the Flash Widget Report.
52
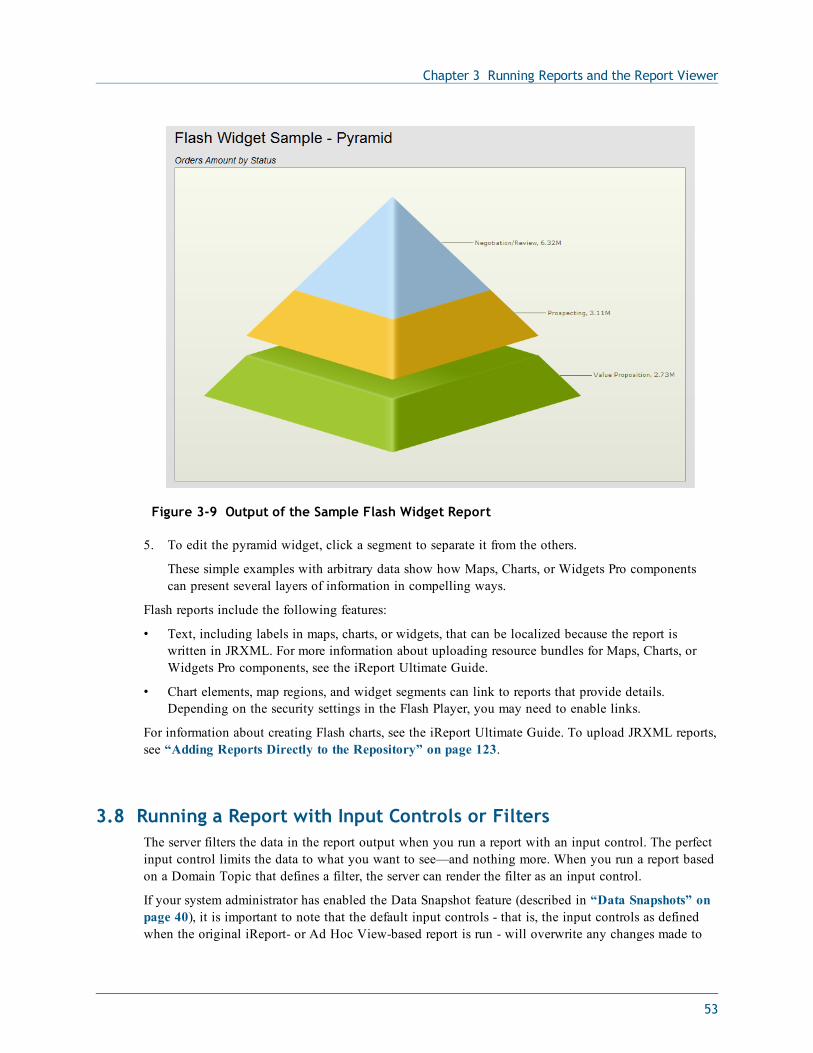
Chapter 3 Running Reports and the Report Viewer
Figure 3-9 Output of the Sample Flash Widget Report
5. To edit the pyramid widget, click a segment to separate it from the others.
These simple examples with arbitrary data show how Maps, Charts, or Widgets Pro componentscan present several layers of information in compelling ways.
Flash reports include the following features:
• Text, including labels in maps, charts, or widgets, that can be localized because the report iswritten in JRXML. For more information about uploading resource bundles for Maps, Charts, orWidgets Pro components, see the iReport Ultimate Guide.
• Chart elements, map regions, and widget segments can link to reports that provide details.Depending on the security settings in the Flash Player, you may need to enable links.
For information about creating Flash charts, see the iReport Ultimate Guide. To upload JRXML reports,see “Adding Reports Directly to the Repository” on page 123.
3.8 Running a Report with Input Controls or FiltersThe server filters the data in the report output when you run a report with an input control. The perfectinput control limits the data to what you want to see—and nothing more. When you run a report basedon a Domain Topic that defines a filter, the server can render the filter as an input control.
If your system administrator has enabled the Data Snapshot feature (described in “Data Snapshots” onpage 40), it is important to note that the default input controls - that is, the input controls as definedwhen the original iReport- or Ad Hoc View-based report is run - will overwrite any changes made to
53
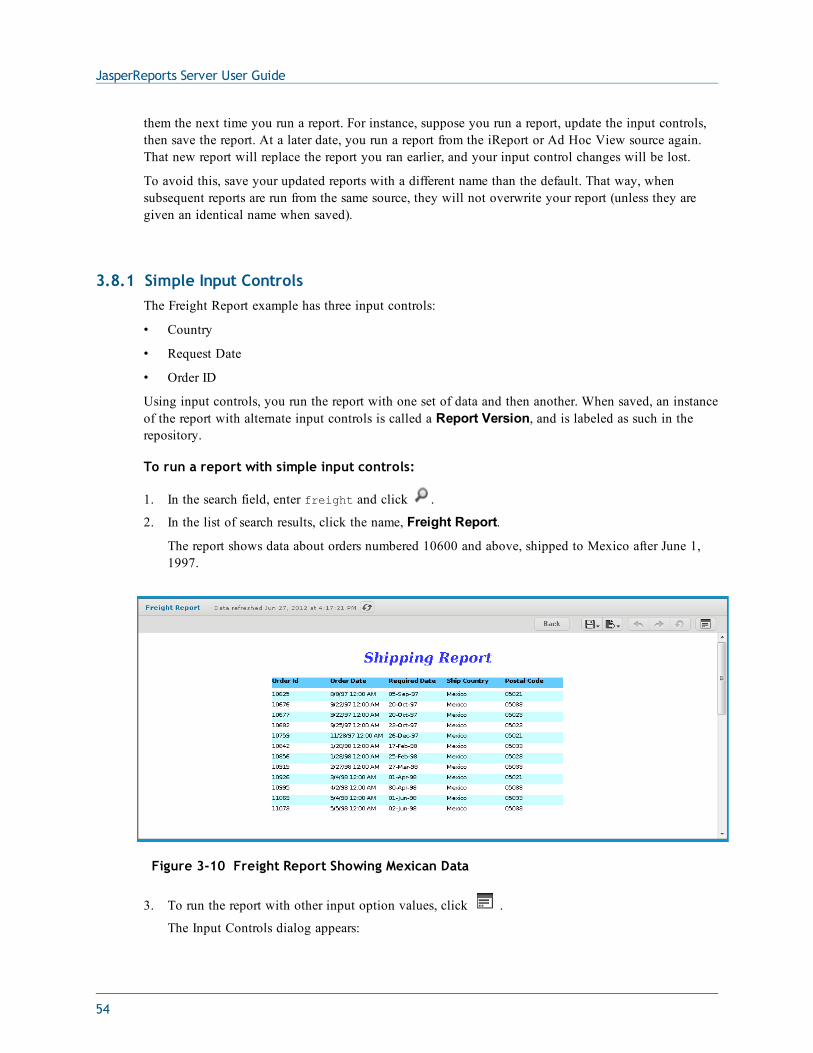
JasperReports Server User Guide
them the next time you run a report. For instance, suppose you run a report, update the input controls,then save the report. At a later date, you run a report from the iReport or Ad Hoc View source again.That new report will replace the report you ran earlier, and your input control changes will be lost.
To avoid this, save your updated reports with a different name than the default. That way, whensubsequent reports are run from the same source, they will not overwrite your report (unless they aregiven an identical name when saved).
3.8.1 Simple Input ControlsThe Freight Report example has three input controls:
• Country
• Request Date
• Order ID
Using input controls, you run the report with one set of data and then another. When saved, an instanceof the report with alternate input controls is called a Report Version, and is labeled as such in therepository.
To run a report with simple input controls:
1. In the search field, enter freight and click .
2. In the list of search results, click the name, Freight Report.
The report shows data about orders numbered 10600 and above, shipped to Mexico after June 1,1997.
Figure 3-10 Freight Report Showing Mexican Data
3. To run the report with other input option values, click .
The Input Controls dialog appears:
54
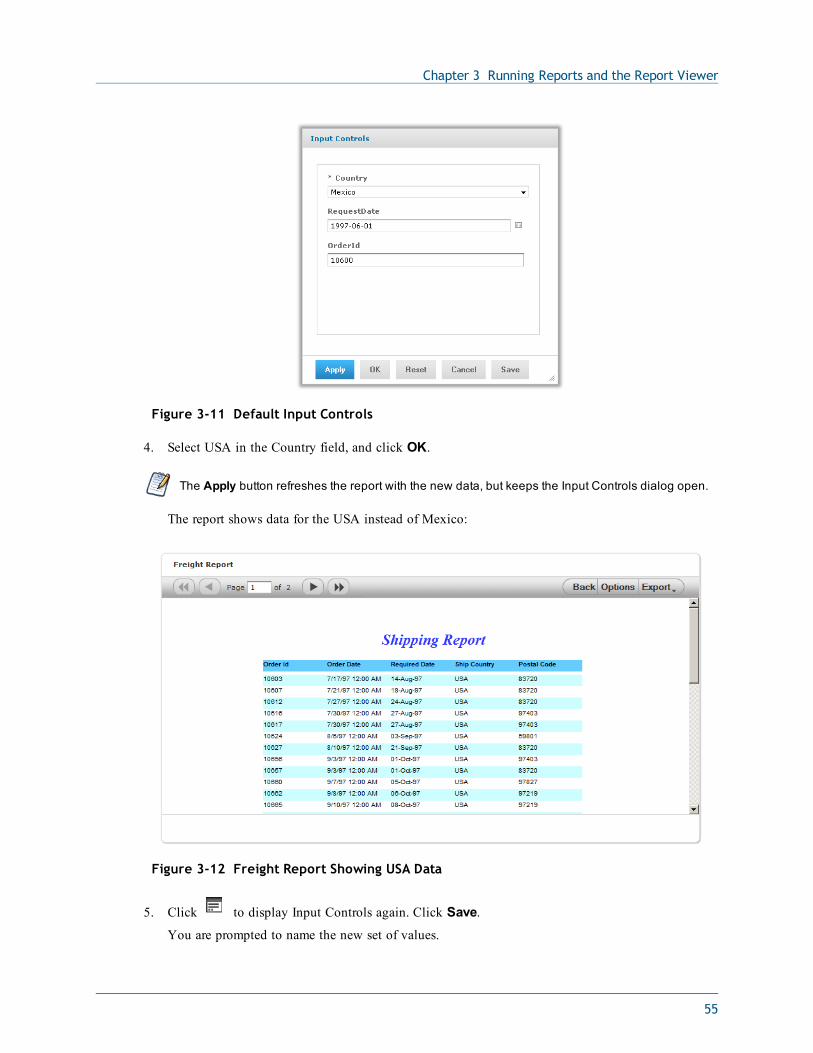
Chapter 3 Running Reports and the Report Viewer
Figure 3-11 Default Input Controls
4. Select USA in the Country field, and click OK.
The Apply button refreshes the report with the new data, but keeps the Input Controls dialog open.
The report shows data for the USA instead of Mexico:
Figure 3-12 Freight Report Showing USA Data
5. Click to display Input Controls again. Click Save.You are prompted to name the new set of values.
55
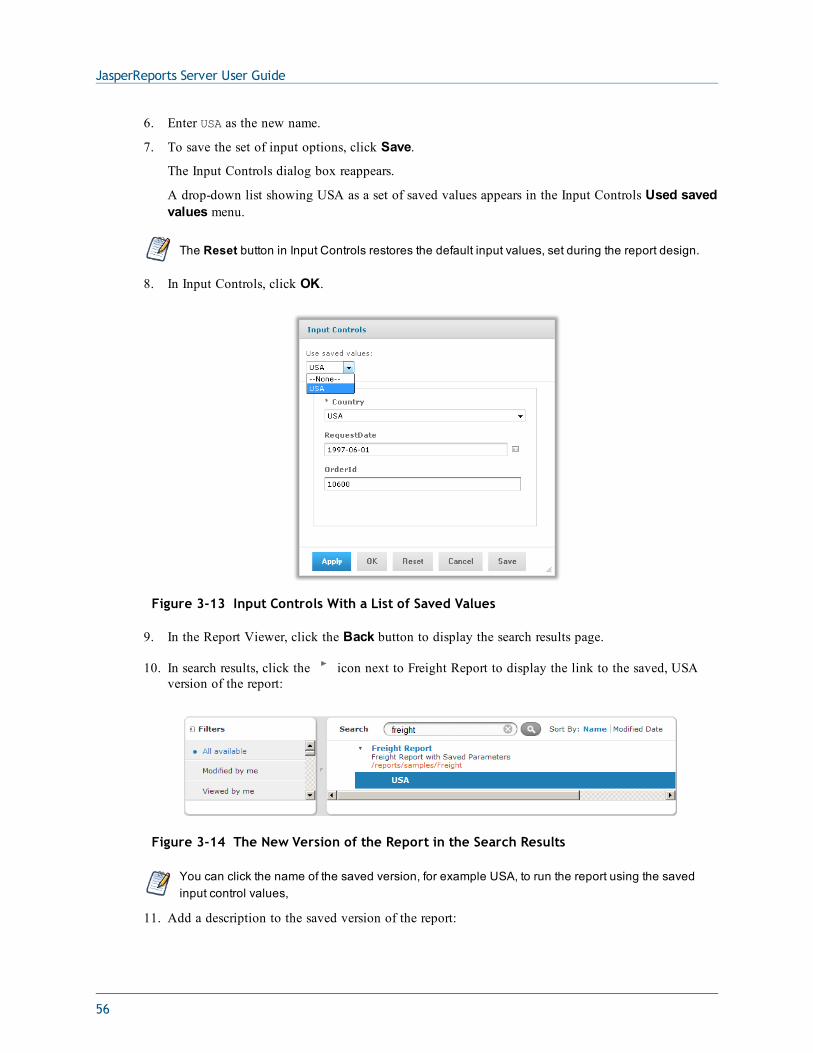
JasperReports Server User Guide
6. Enter USA as the new name.
7. To save the set of input options, click Save.
The Input Controls dialog box reappears.
A drop-down list showing USA as a set of saved values appears in the Input Controls Used savedvalues menu.
The Reset button in Input Controls restores the default input values, set during the report design.
8. In Input Controls, click OK.
Figure 3-13 Input Controls With a List of Saved Values
9. In the Report Viewer, click the Back button to display the search results page.
10. In search results, click the icon next to Freight Report to display the link to the saved, USAversion of the report:
Figure 3-14 The New Version of the Report in the Search Results
You can click the name of the saved version, for example USA, to run the report using the savedinput control values,
11. Add a description to the saved version of the report:
56
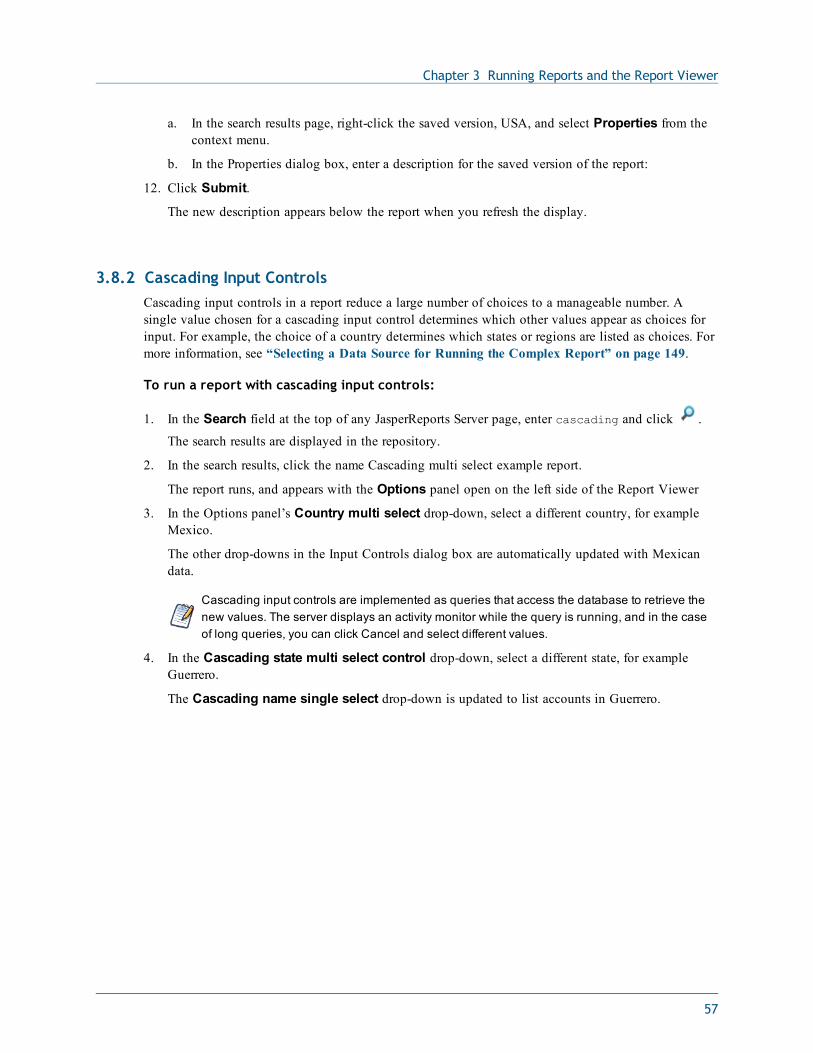
Chapter 3 Running Reports and the Report Viewer
a. In the search results page, right-click the saved version, USA, and select Properties from thecontext menu.
b. In the Properties dialog box, enter a description for the saved version of the report:
12. Click Submit.
The new description appears below the report when you refresh the display.
3.8.2 Cascading Input ControlsCascading input controls in a report reduce a large number of choices to a manageable number. Asingle value chosen for a cascading input control determines which other values appear as choices forinput. For example, the choice of a country determines which states or regions are listed as choices. Formore information, see “Selecting a Data Source for Running the Complex Report” on page 149.
To run a report with cascading input controls:
1. In the Search field at the top of any JasperReports Server page, enter cascading and click .
The search results are displayed in the repository.
2. In the search results, click the name Cascading multi select example report.
The report runs, and appears with the Options panel open on the left side of the Report Viewer
3. In the Options panel’s Country multi select drop-down, select a different country, for exampleMexico.
The other drop-downs in the Input Controls dialog box are automatically updated with Mexicandata.
Cascading input controls are implemented as queries that access the database to retrieve thenew values. The server displays an activity monitor while the query is running, and in the caseof long queries, you can click Cancel and select different values.
4. In the Cascading state multi select control drop-down, select a different state, for exampleGuerrero.
The Cascading name single select drop-down is updated to list accounts in Guerrero.
57
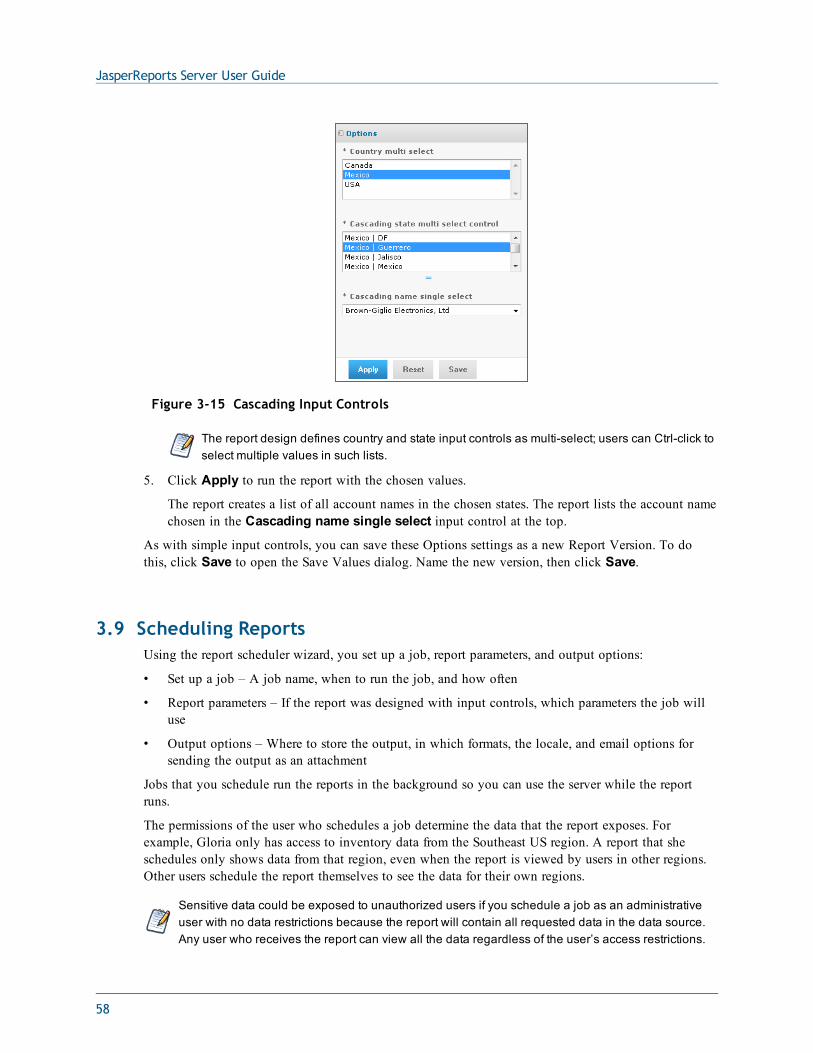
JasperReports Server User Guide
Figure 3-15 Cascading Input Controls
The report design defines country and state input controls as multi-select; users can Ctrl-click toselect multiple values in such lists.
5. Click Apply to run the report with the chosen values.
The report creates a list of all account names in the chosen states. The report lists the account namechosen in the Cascading name single select input control at the top.
As with simple input controls, you can save these Options settings as a new Report Version. To dothis, click Save to open the Save Values dialog. Name the new version, then click Save.
3.9 Scheduling ReportsUsing the report scheduler wizard, you set up a job, report parameters, and output options:
• Set up a job – A job name, when to run the job, and how often
• Report parameters – If the report was designed with input controls, which parameters the job willuse
• Output options – Where to store the output, in which formats, the locale, and email options forsending the output as an attachment
Jobs that you schedule run the reports in the background so you can use the server while the reportruns.
The permissions of the user who schedules a job determine the data that the report exposes. Forexample, Gloria only has access to inventory data from the Southeast US region. A report that sheschedules only shows data from that region, even when the report is viewed by users in other regions.Other users schedule the report themselves to see the data for their own regions.
Sensitive data could be exposed to unauthorized users if you schedule a job as an administrativeuser with no data restrictions because the report will contain all requested data in the data source.Any user who receives the report can view all the data regardless of the user’s access restrictions.
58
Chapter 3 Running Reports and the Report Viewer
3.9.1 Setting Up a Job
To set up a job:
1. On the Home page, click View Reports; or from any page, click View > Repository.
2. Use the search field or browse the list of reports to find the report you want to schedule.
If the report already has a schedule that you want to add, modify, or delete, click beside the
report name.
3. Right-click the report and select Schedule... from the context menu.
The Scheduled Jobs page appears, as shown in the figure The Scheduled Jobs Page for theFreight Report.
4. Click Schedule Job.
The Set Up the Job page of the Scheduler wizard appears.
5. In the Job Name field, enter a name for the job, for example, Weekly Report. The description isoptional.
6. Set these schedule attributes:
• Start: Immediately or in the future. Click to select a future start date and time. If you don’tspecify recurrence, the start date and time determines when the report runs. If you specifyrecurrence, you may still want to delay the first report date, for example a weekday report thatyou want to start next week.
• Time Zone: Specify the time zone for the schedule. The default time zone is the time zone ofthe server, the time zone you entered at log in. If you’re in a different time zone, set this fieldaccordingly.
• Recurrence: Choose one of the following settings:
• None: Run the report once.
• Simple: Schedule the job to recur at an hourly, daily, or weekly interval.
• Calendar: Schedule the job to recur on days of the week or days of the month.
A job set to run immediately, with no recurrence, appears, as seen in the figure Set Up the JobPage:
59
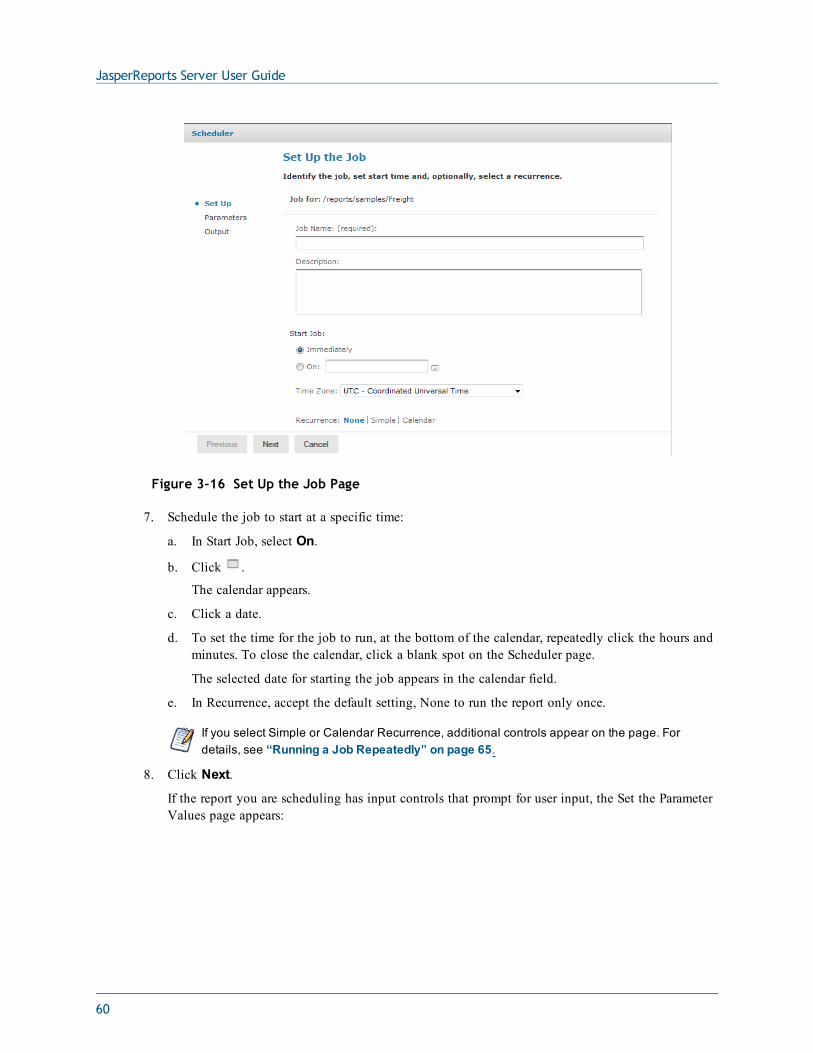
JasperReports Server User Guide
Figure 3-16 Set Up the Job Page
7. Schedule the job to start at a specific time:
a. In Start Job, select On.
b. Click .
The calendar appears.
c. Click a date.
d. To set the time for the job to run, at the bottom of the calendar, repeatedly click the hours andminutes. To close the calendar, click a blank spot on the Scheduler page.
The selected date for starting the job appears in the calendar field.
e. In Recurrence, accept the default setting, None to run the report only once.
If you select Simple or Calendar Recurrence, additional controls appear on the page. Fordetails, see “Running a Job Repeatedly” on page 65.
8. Click Next.
If the report you are scheduling has input controls that prompt for user input, the Set the ParameterValues page appears:
60
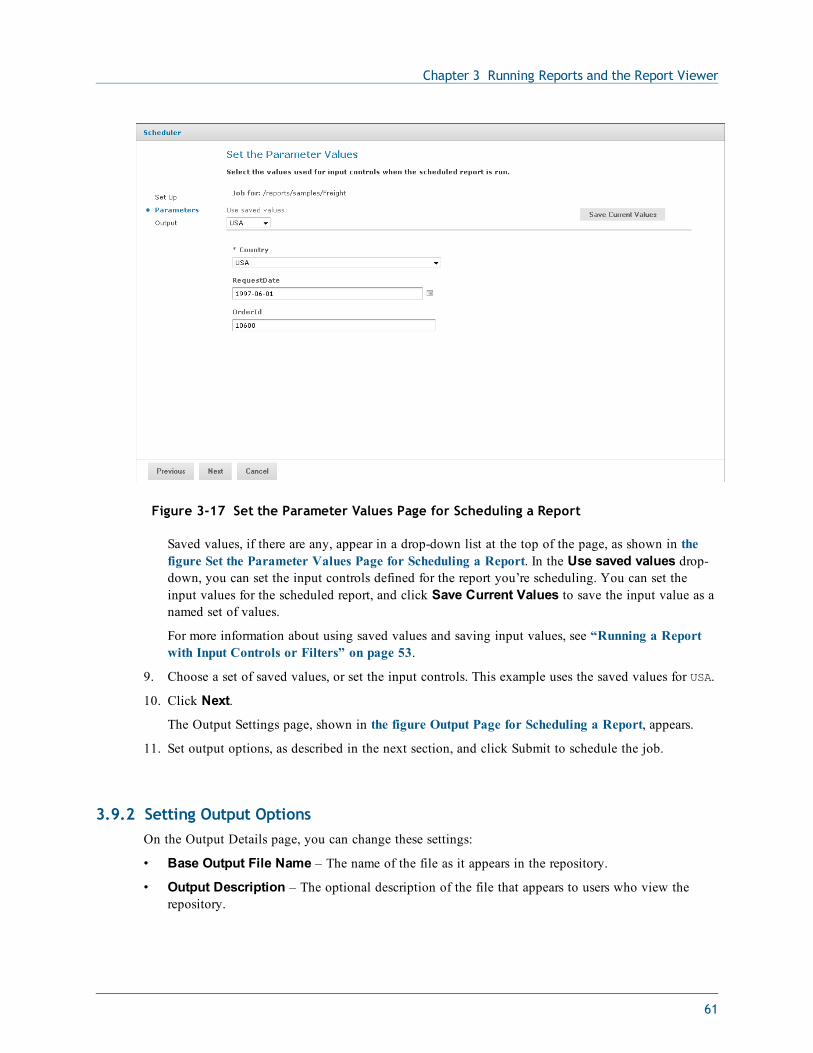
Chapter 3 Running Reports and the Report Viewer
Figure 3-17 Set the Parameter Values Page for Scheduling a Report
Saved values, if there are any, appear in a drop-down list at the top of the page, as shown in thefigure Set the Parameter Values Page for Scheduling a Report. In the Use saved values drop-down, you can set the input controls defined for the report you’re scheduling. You can set theinput values for the scheduled report, and click Save Current Values to save the input value as anamed set of values.
For more information about using saved values and saving input values, see “Running a Reportwith Input Controls or Filters” on page 53.
9. Choose a set of saved values, or set the input controls. This example uses the saved values for USA.
10. Click Next.
The Output Settings page, shown in the figure Output Page for Scheduling a Report, appears.
11. Set output options, as described in the next section, and click Submit to schedule the job.
3.9.2 Setting Output OptionsOn the Output Details page, you can change these settings:
• Base Output File Name – The name of the file as it appears in the repository.
• Output Description – The optional description of the file that appears to users who view therepository.
61
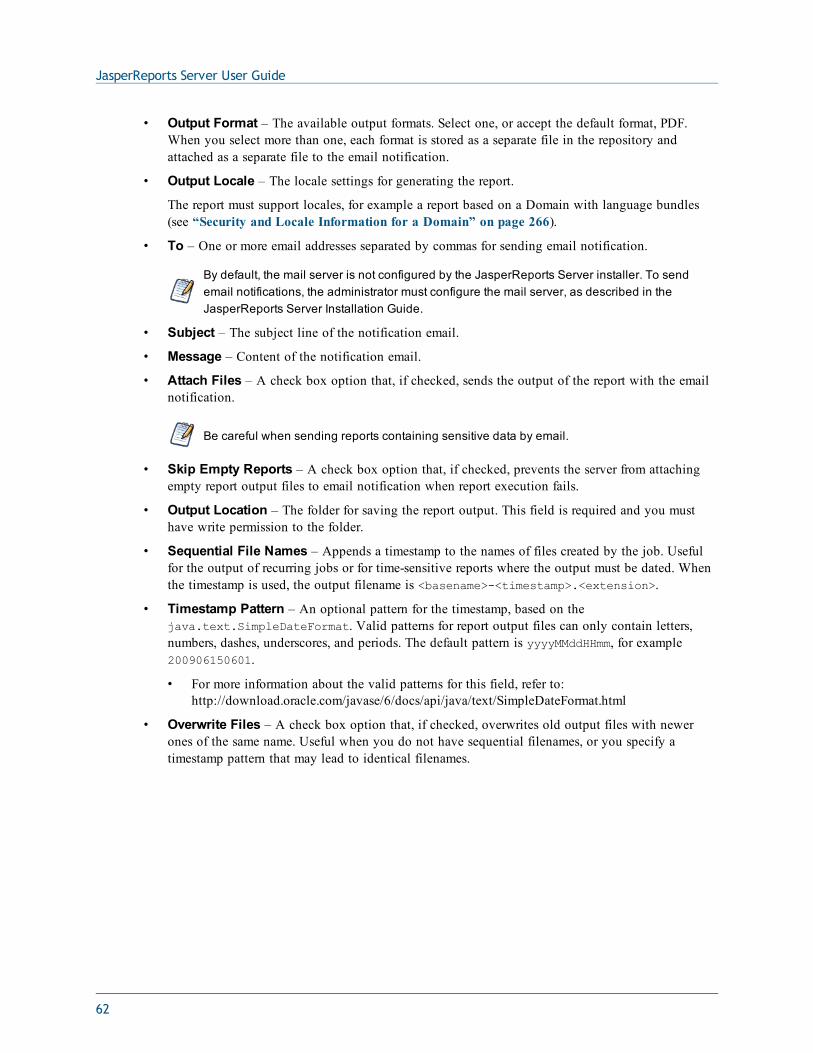
JasperReports Server User Guide
• Output Format – The available output formats. Select one, or accept the default format, PDF.When you select more than one, each format is stored as a separate file in the repository andattached as a separate file to the email notification.
• Output Locale – The locale settings for generating the report.
The report must support locales, for example a report based on a Domain with language bundles(see “Security and Locale Information for a Domain” on page 266).
• To – One or more email addresses separated by commas for sending email notification.
By default, the mail server is not configured by the JasperReports Server installer. To sendemail notifications, the administrator must configure the mail server, as described in theJasperReports Server Installation Guide.
• Subject – The subject line of the notification email.
• Message – Content of the notification email.
• Attach Files – A check box option that, if checked, sends the output of the report with the emailnotification.
Be careful when sending reports containing sensitive data by email.
• Skip Empty Reports – A check box option that, if checked, prevents the server from attachingempty report output files to email notification when report execution fails.
• Output Location – The folder for saving the report output. This field is required and you musthave write permission to the folder.
• Sequential File Names – Appends a timestamp to the names of files created by the job. Usefulfor the output of recurring jobs or for time-sensitive reports where the output must be dated. Whenthe timestamp is used, the output filename is <basename>-<timestamp>.<extension>.
• Timestamp Pattern – An optional pattern for the timestamp, based on thejava.text.SimpleDateFormat. Valid patterns for report output files can only contain letters,numbers, dashes, underscores, and periods. The default pattern is yyyyMMddHHmm, for example200906150601.
• For more information about the valid patterns for this field, refer to:http://download.oracle.com/javase/6/docs/api/java/text/SimpleDateFormat.html
• Overwrite Files – A check box option that, if checked, overwrites old output files with newerones of the same name. Useful when you do not have sequential filenames, or you specify atimestamp pattern that may lead to identical filenames.
62
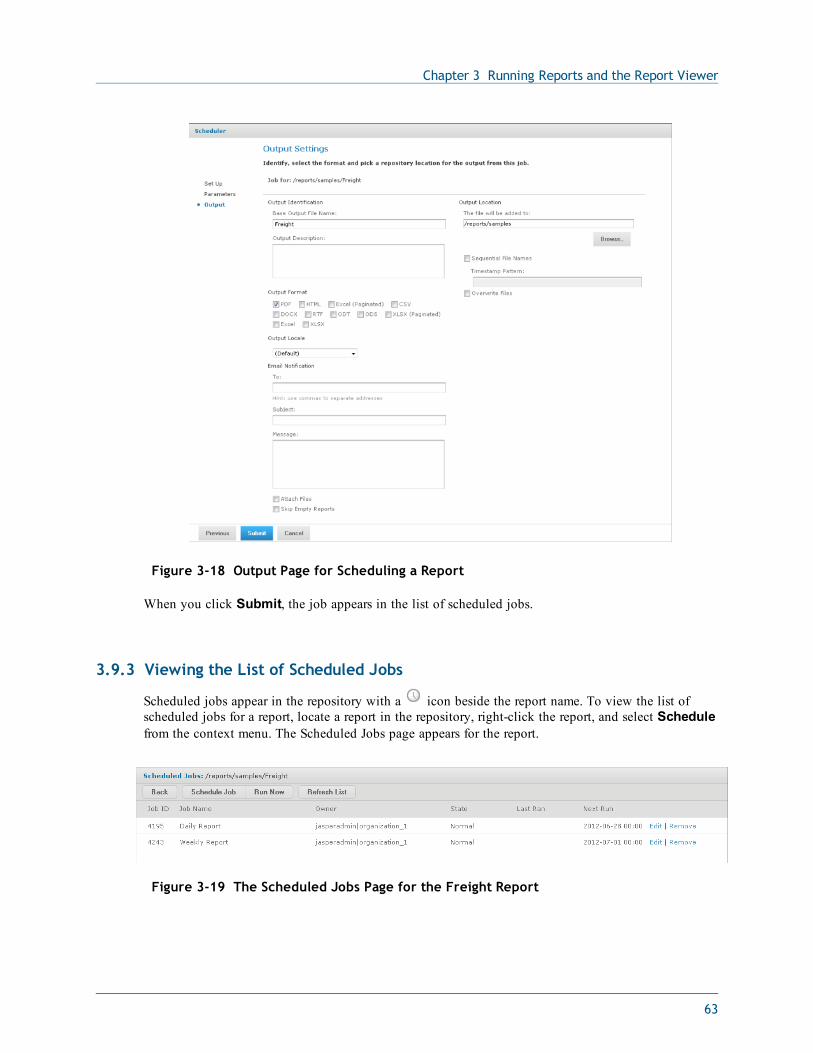
Chapter 3 Running Reports and the Report Viewer
Figure 3-18 Output Page for Scheduling a Report
When you click Submit, the job appears in the list of scheduled jobs.
3.9.3 Viewing the List of Scheduled Jobs
Scheduled jobs appear in the repository with a icon beside the report name. To view the list ofscheduled jobs for a report, locate a report in the repository, right-click the report, and select Schedulefrom the context menu. The Scheduled Jobs page appears for the report.
Figure 3-19 The Scheduled Jobs Page for the Freight Report
63
JasperReports Server User Guide
Typical users only see the jobs that they have defined themselves; administrators see the jobs definedby all users. In the figure The Scheduled Jobs Page for the Freight Report, Joe User has scheduledtwo jobs for the Employees Report.
The Scheduled Jobs page shows the internal ID number of the job, the user (owner) who created thejob, and the state of the job. Job states are:
• Normal – The job is scheduled.
• Running – The server is generating the report output.
• Complete – The server has finished running the job and placed output to the repository.
• Error – The scheduler encountered an error while scheduling or triggering the job. This doesn’tinclude cases where the job is successfully triggered, but an error occurs while it runs.
The Scheduled Jobs page includes two controls:
• Edit – Changes the schedule.
• Remove – Cancels the scheduled job.
When the server receives a request to delete a job that is running, the server completes running thejob before deleting it.
Buttons on the Scheduled Jobs page include:
Button Description
Back Returns to the list of reports.
Schedule Job Opens the Job Details page to define a new job.
Run Now Runs the report in the background, allowing you to continue working in the server.See “Running a Job in the Background” on page 67.
Refresh List Refreshes the list of jobs, for example to see if a job has finished running.
3.9.4 Changing Job SchedulesWhen the start date for a job has passed, start a new job rather than changing the start date.
To edit a scheduled job:
1. Open the Scheduled Jobs page for the report, as described in “Setting Up a Job” on page 59.
2. Click Edit in the row of the job you want to change.
3. Make the changes on the Job Details, Schedule, Parameters, and Output pages.
4. Click Save. The update occurs immediately.
3.9.5 Stopping a Job from RunningTo stop a job from running, delete it.
64
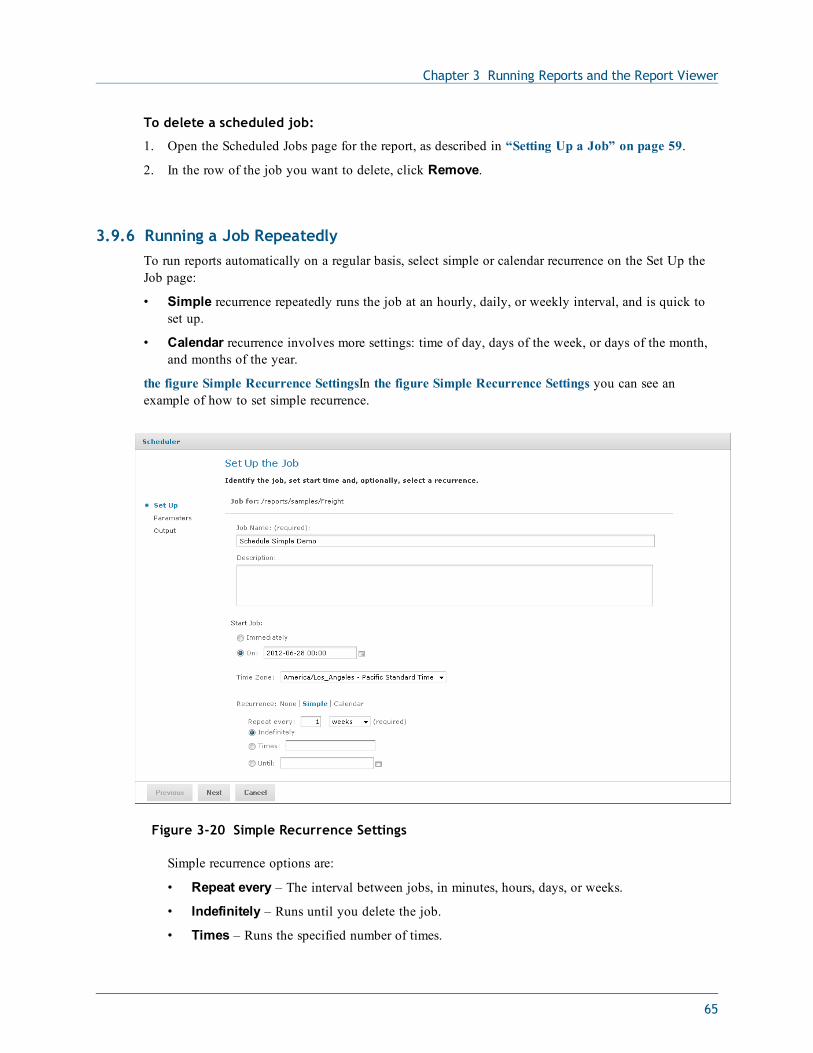
Chapter 3 Running Reports and the Report Viewer
To delete a scheduled job:
1. Open the Scheduled Jobs page for the report, as described in “Setting Up a Job” on page 59.
2. In the row of the job you want to delete, click Remove.
3.9.6 Running a Job RepeatedlyTo run reports automatically on a regular basis, select simple or calendar recurrence on the Set Up theJob page:
• Simple recurrence repeatedly runs the job at an hourly, daily, or weekly interval, and is quick toset up.
• Calendar recurrence involves more settings: time of day, days of the week, or days of the month,and months of the year.
the figure Simple Recurrence SettingsIn the figure Simple Recurrence Settings you can see anexample of how to set simple recurrence.
Figure 3-20 Simple Recurrence Settings
Simple recurrence options are:
• Repeat every – The interval between jobs, in minutes, hours, days, or weeks.
• Indefinitely – Runs until you delete the job.
• Times – Runs the specified number of times.
65
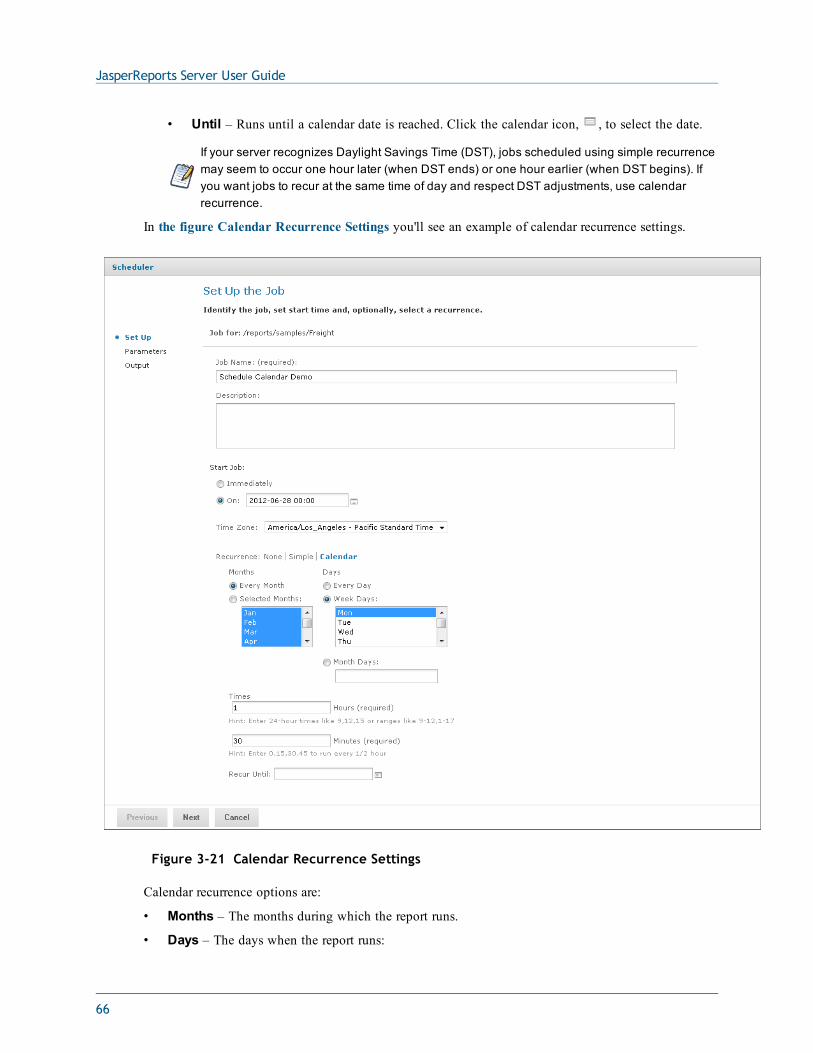
JasperReports Server User Guide
• Until – Runs until a calendar date is reached. Click the calendar icon, , to select the date.
If your server recognizes Daylight Savings Time (DST), jobs scheduled using simple recurrencemay seem to occur one hour later (when DST ends) or one hour earlier (when DST begins). Ifyou want jobs to recur at the same time of day and respect DST adjustments, use calendarrecurrence.
In the figure Calendar Recurrence Settings you'll see an example of calendar recurrence settings.
Figure 3-21 Calendar Recurrence Settings
Calendar recurrence options are:
• Months – The months during which the report runs.
• Days – The days when the report runs:
66
Chapter 3 Running Reports and the Report Viewer
• Every Day
• Week Days
• Month Days – Enter dates or date ranges separated by commas, for example: 1, 15.
• Times – The time of day in minutes and hours when the job should run. The hours use 24-hourformat.
You can also enter multiple minutes or hours, and ranges, separated by commas. For example,entering 0, 15, 30, 45 for the minutes, and 9-17 for the hours, runs the report every 15 minutesfrom 9:00 a.m. to 5:45 p.m. Enter an asterisk (*) to run the job every minute or every hour.
• Recur Until – Calendar recurrence runs until a calendar date is reached. Click to select thedate.
3.9.7 Running a Job in the BackgroundRunning a job in the background generates a report, potentially long-running, without affectingperformance. You can keep working in the server as the job runs. When the job completes, you canexport the report directly to any format and save it in the repository. You can share a report with othersby sending the generated report by email.
Running a job in the background is equivalent to scheduling the report to run immediately withoutrecurrence.
To run a job in the background:
1. On the Home page, click View Your Reports; or from any page, click View > Reports.
2. Use the search field or Filters to find the report you want to run.
3. Right-click the report and select Run in Background from the context menu.
If the report you’re running has input controls or filters that prompt for user input, a pageappears for setting parameter values, as shown in Figure 3-17, “Set the Parameter ValuesPage for Scheduling a Report”.
4. Choose a set of saved values, or set the fields one at a time.
5. Click Next.
The Output page appears as shown in the figure Output Page for Scheduling a Report.
6. Enter the information as described in “Setting Output Options” on page 61.
7. Click Save.
The report begins to run immediately.
3.9.8 Adding a Date/Time Stamp to Scheduled OutputWhen you add a parameter named _ScheduledTime to a JRXML report design in iReport Designer,and then schedule the report to run in the server, the output includes a date/time stamp showing whenthe report ran. The following procedure describes how to set up and use this parameter:
To display the date/time that the report ran:
67
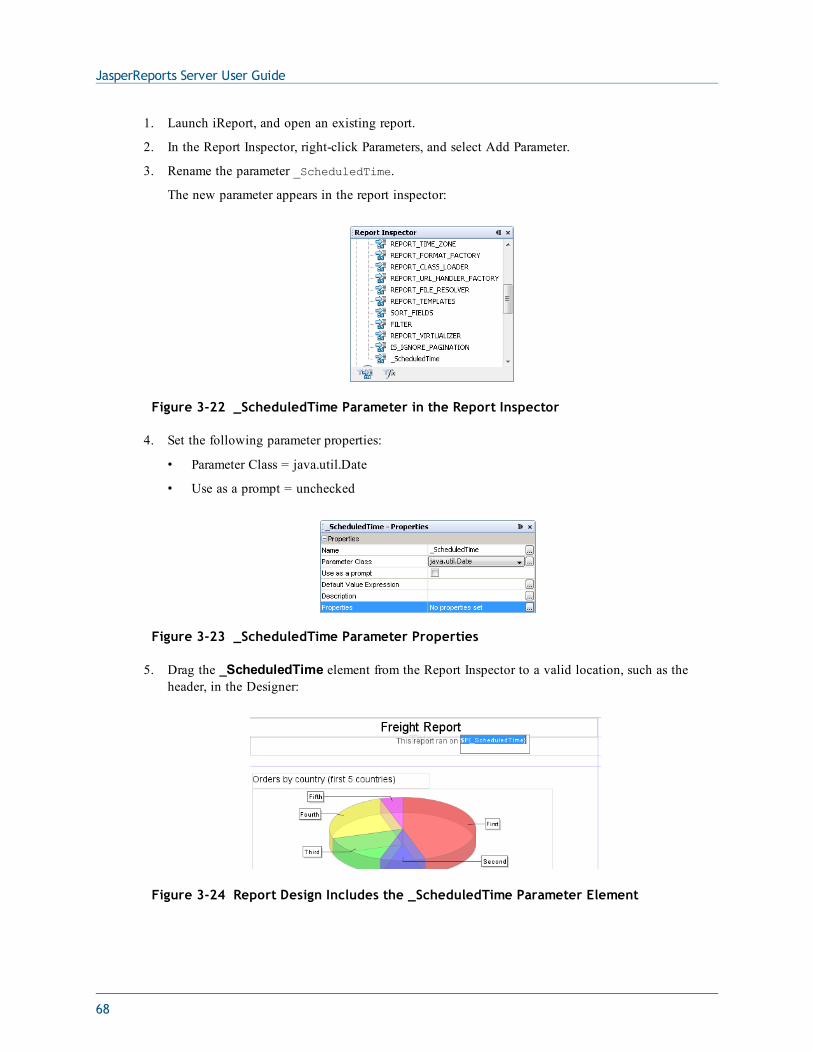
JasperReports Server User Guide
1. Launch iReport, and open an existing report.
2. In the Report Inspector, right-click Parameters, and select Add Parameter.
3. Rename the parameter _ScheduledTime.
The new parameter appears in the report inspector:
Figure 3-22 _ScheduledTime Parameter in the Report Inspector
4. Set the following parameter properties:
• Parameter Class = java.util.Date
• Use as a prompt = unchecked
Figure 3-23 _ScheduledTime Parameter Properties
5. Drag the _ScheduledTime element from the Report Inspector to a valid location, such as theheader, in the Designer:
Figure 3-24 Report Design Includes the _ScheduledTime Parameter Element
68
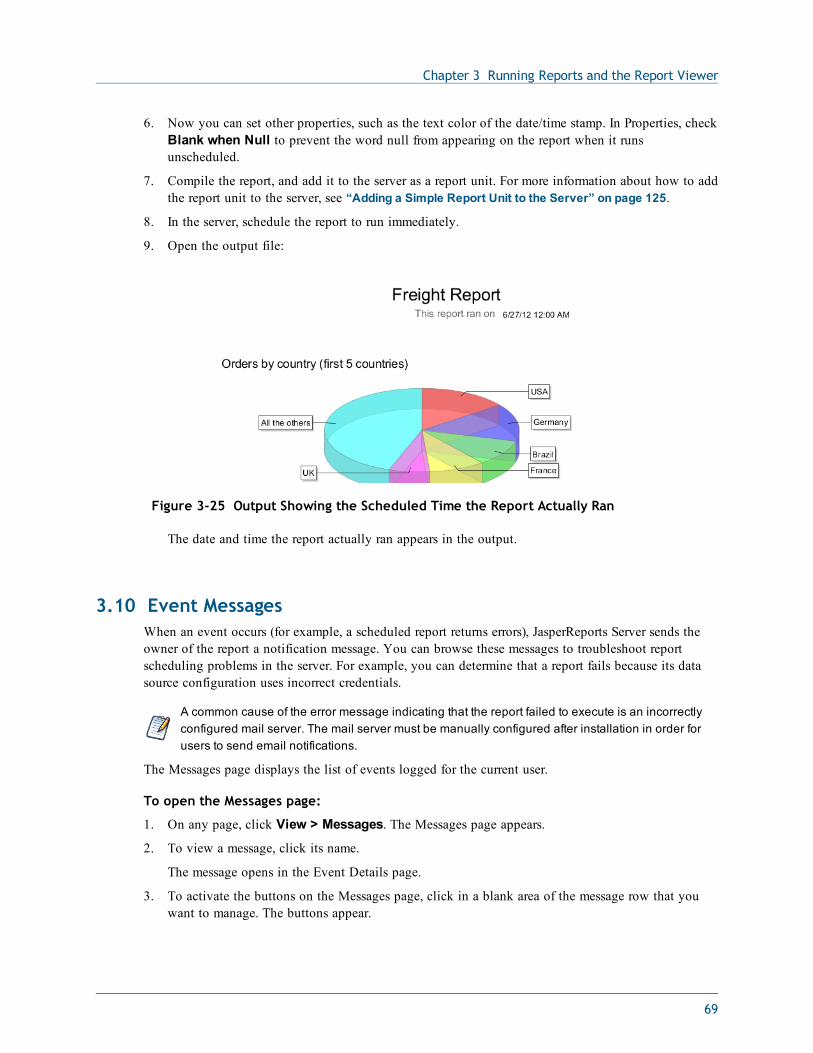
Chapter 3 Running Reports and the Report Viewer
6. Now you can set other properties, such as the text color of the date/time stamp. In Properties, checkBlank when Null to prevent the word null from appearing on the report when it runsunscheduled.
7. Compile the report, and add it to the server as a report unit. For more information about how to addthe report unit to the server, see “Adding a Simple Report Unit to the Server” on page 125.
8. In the server, schedule the report to run immediately.
9. Open the output file:
Figure 3-25 Output Showing the Scheduled Time the Report Actually Ran
The date and time the report actually ran appears in the output.
3.10 Event MessagesWhen an event occurs (for example, a scheduled report returns errors), JasperReports Server sends theowner of the report a notification message. You can browse these messages to troubleshoot reportscheduling problems in the server. For example, you can determine that a report fails because its datasource configuration uses incorrect credentials.
A common cause of the error message indicating that the report failed to execute is an incorrectlyconfigured mail server. The mail server must be manually configured after installation in order forusers to send email notifications.
The Messages page displays the list of events logged for the current user.
To open the Messages page:
1. On any page, click View > Messages. The Messages page appears.
2. To view a message, click its name.
The message opens in the Event Details page.
3. To activate the buttons on the Messages page, click in a blank area of the message row that youwant to manage. The buttons appear.
69
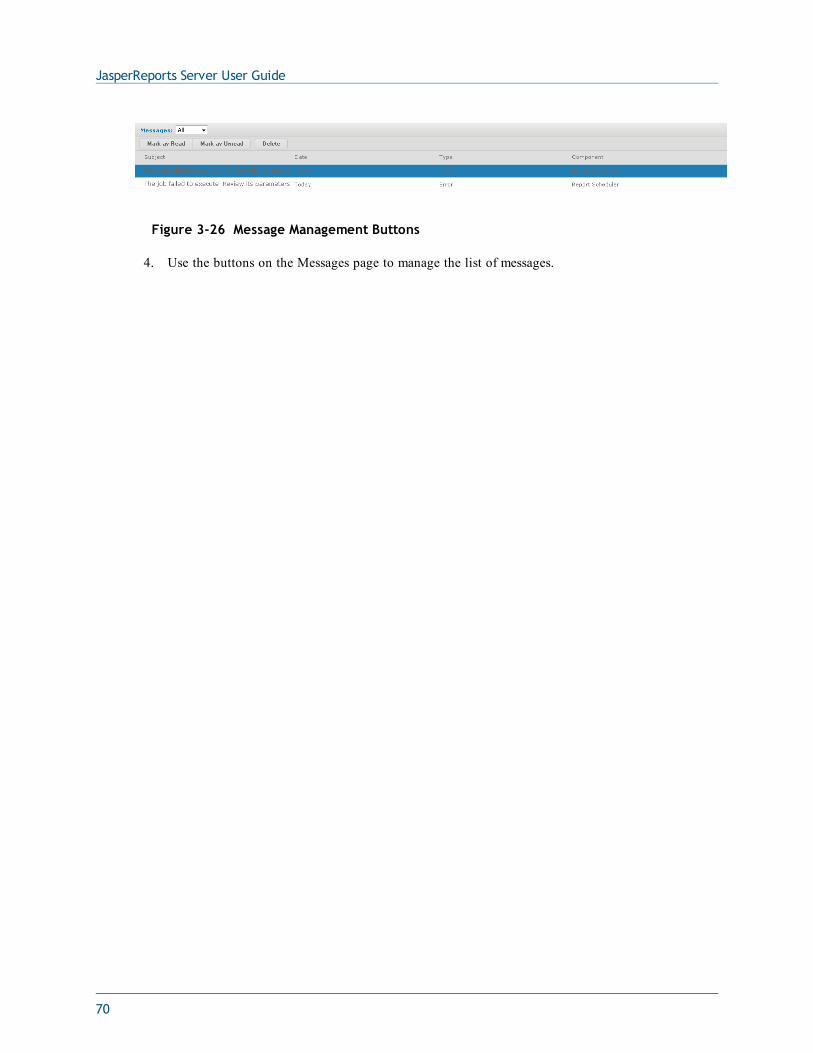
JasperReports Server User Guide
Figure 3-26 Message Management Buttons
4. Use the buttons on the Messages page to manage the list of messages.
70
CHAPTER 4 WORKING WITH THE AD HOC EDITORThis section describes functionality that can be restricted by the software license for JasperReportsServer. If you don’t see some of the options described in this section, your license may prohibit youfrom using them. To find out what you're licensed to use, or to upgrade your license, contactJaspersoft.
The Ad Hoc Editor is the interactive designer for creating and editing an Ad Hoc view, where you canexplore and analyze data from your Topic, Domain, or OLAP data source. Ad Hoc views can also beused to create content for reports.
This chapter discusses the Ad Hoc Editor and Ad Hoc views, and includes the following sections:
• Overview of the Ad Hoc Editor
• Working with Tables
• Working with Charts
• Working with Standard Crosstabs
• Working with OLAP Connection-based Crosstabs
• Creating Custom Fields
• Using Filters and Input Controls
• Creating a View from a Domain
• Creating Topics
After you create an Ad Hoc view, you - and other users with the proper permissions - can run thereport, then further refine the displayed information and personalize the look of the report in the reportviewer. For more information on that process, see “Running Reports and the Report Viewer” onpage 37.
71
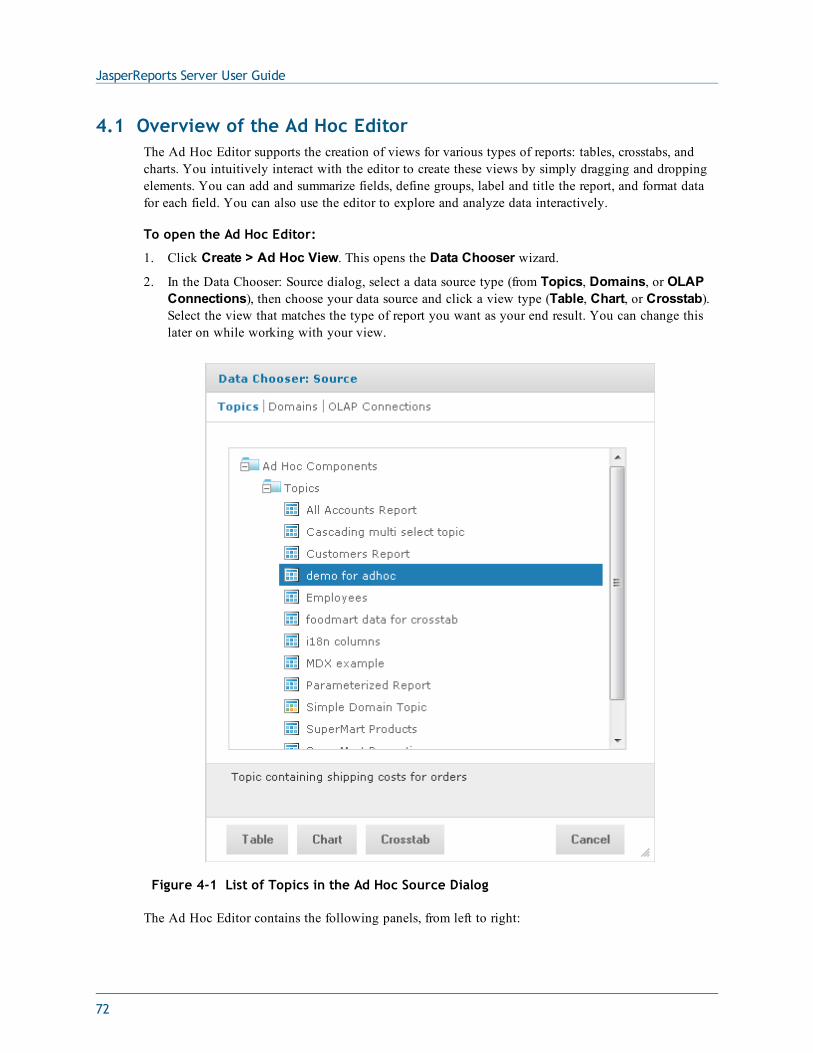
JasperReports Server User Guide
4.1 Overview of the Ad Hoc EditorThe Ad Hoc Editor supports the creation of views for various types of reports: tables, crosstabs, andcharts. You intuitively interact with the editor to create these views by simply dragging and droppingelements. You can add and summarize fields, define groups, label and title the report, and format datafor each field. You can also use the editor to explore and analyze data interactively.
To open the Ad Hoc Editor:
1. Click Create > Ad Hoc View. This opens the Data Chooser wizard.
2. In the Data Chooser: Source dialog, select a data source type (from Topics, Domains, or OLAPConnections), then choose your data source and click a view type (Table, Chart, or Crosstab).Select the view that matches the type of report you want as your end result. You can change thislater on while working with your view.
Figure 4-1 List of Topics in the Ad Hoc Source Dialog
The Ad Hoc Editor contains the following panels, from left to right:
72
Chapter 4 Working with the Ad Hoc Editor
• Data Source Selection, which contains the fields, dimensions, and measures available in thesource Domain, Topic, or OLAP connection.
• Ad Hoc View, the main view design panel.
• Filters, which defines a subset of data to retrieve from the data source.
We’ll discuss how to use these panels to create an Ad Hoc view later in this section.
4.1.1 Ad Hoc Sources: Topics, Domains, and OLAP ConnectionsThe following repository objects provide a prepared connection to a data source for Ad Hoc viewcreation:
• Topics, JRMXL files created externally and uploaded to JasperReports Server as a basis for Ad Hocviews.
• Domains, virtual views of a data source that present the data in business terms, allow forlocalization, and provide data-level security.
• OLAP Connections, multi-dimensional views of data that allow users to analyze a large number ofaggregate data levels.
You can also open and edit an existing Ad Hoc view to create a new Ad Hoc view.
4.1.1.1 Topics
Generally, an administrator or iReport user creates a Topic as a JRXML file. The JRXML topic is thenassociated with a data source in the server. A Topic can also be created from a Domain in the server.Both types of topics appear in the Data Chooser wizard when you create an Ad Hoc view.
Using a Topic as your source generates an empty view, which allows you to begin adding data to yourview right away, without choosing, pre-filtering, or changing display names of the data (all of whichare required steps when creating a Domain-based view).
To begin designing a Topic-based view:
1. Launch the Ad Hoc Editor by clicking Create > Ad Hoc View.
2. In the Data Chooser, select the Topics option at the top of the dialog window.
3. Expand the Topics folder and select a topic.
4. Select the type of view you intend to create: table, chart, or crosstab. For an overview of viewtypes, see “Ad Hoc View Types” on page 74.
You can now begin working on your view in the Ad Hoc Editor.
4.1.1.2 Domains
Administrators create Domains that typically filter the data, create input controls, and manage the list ofavailable fields and measures. A Domain specifies tables in the database, join clauses, calculated fields,display names, and default properties, all of which define items and sets of items for creating Ad Hocviews.
To begin designing a Domain-based view:
1. Launch the Ad Hoc Editor by clicking Create > Ad Hoc View.
73
JasperReports Server User Guide
2. In the Data Chooser, select the Domains option at the top of the dialog window.
3. Expand the Domains folder and select a domain.
4. Click Choose Data..., and click the options on the left of the window to perform the followingtasks:
• Click Fields to select fields of data to use in the view.
• Click Pre-filters to create filters to limit the data available in the Ad Hoc Editor.
• Click Display to change the fields’ display names.
• Click Save as Topic to save the customized topic for later use.
5. Select the type of view you want to create: table, chart, or crosstab. For an overview of view types,see “Ad Hoc View Types” on page 74.
You can now begin working on your view in the Ad Hoc Editor.
4.1.1.3 OLAP Connections
Administrators create OLAP client connections that expose transactional data and define how the datacan be seen as a multidimensional cube. An OLAP connection can expose multiple cubes in a singleOLAP connection.
With OLAP connections, you can create chart and crosstab views only.
To begin designing an OLAP connection-based view:
1. Launch the Ad Hoc Editor by clicking Create > Ad Hoc View.
2. In the Data Chooser, select the OLAP Connections option at the top of the dialog window.
3. Expand the Analysis Components | Analysis Connections folder and select a connection.
4. Select Chart or Crosstab as the type of view you want to create.
You can now begin working on your view in the Ad Hoc Editor.
For more information about OLAP-based view functionality, refer to the following sections:
• “Working with OLAP Connection-based Crosstabs” on page 99
• “Creating Topics” on page 117
4.1.2 Ad Hoc View TypesThe Ad Hoc Editor allows you to select from three view types:
• Tables, which are used to view values in the database and to summarize the values in columns.
• Charts, which compare one or more measures across multiple sets of related fields.
• Crosstabs, which aggregates data across multiple dimensions.
This section provides an overview of each view type. The design and content tasks for working witheach type of view is discussed in more detail in the following sections:
• For more information on table views, see “Working with Tables” on page 81.
74
Chapter 4 Working with the Ad Hoc Editor
• For more information on chart views, see “Working with Charts” on page 86.
• For more information on crosstab views, see “Working with Standard Crosstabs” on page 96.
4.1.2.1 Tables
The architecture of a table view consists of columns, rows, and groups.
Columns in a table correspond to the columns in the data source. They are included by adding fields ormeasures to the table in the Ad Hoc view.
Rows correspond to rows in the database. The information in each row depends on what columns areincluded in the table.
Using groups, rows can be grouped by identical values in any field with intermediate summaries foreach grouped value. For example, a table view of product orders might contain columns to show thedates and amounts of each order, and its rows might be grouped by city and product:
75
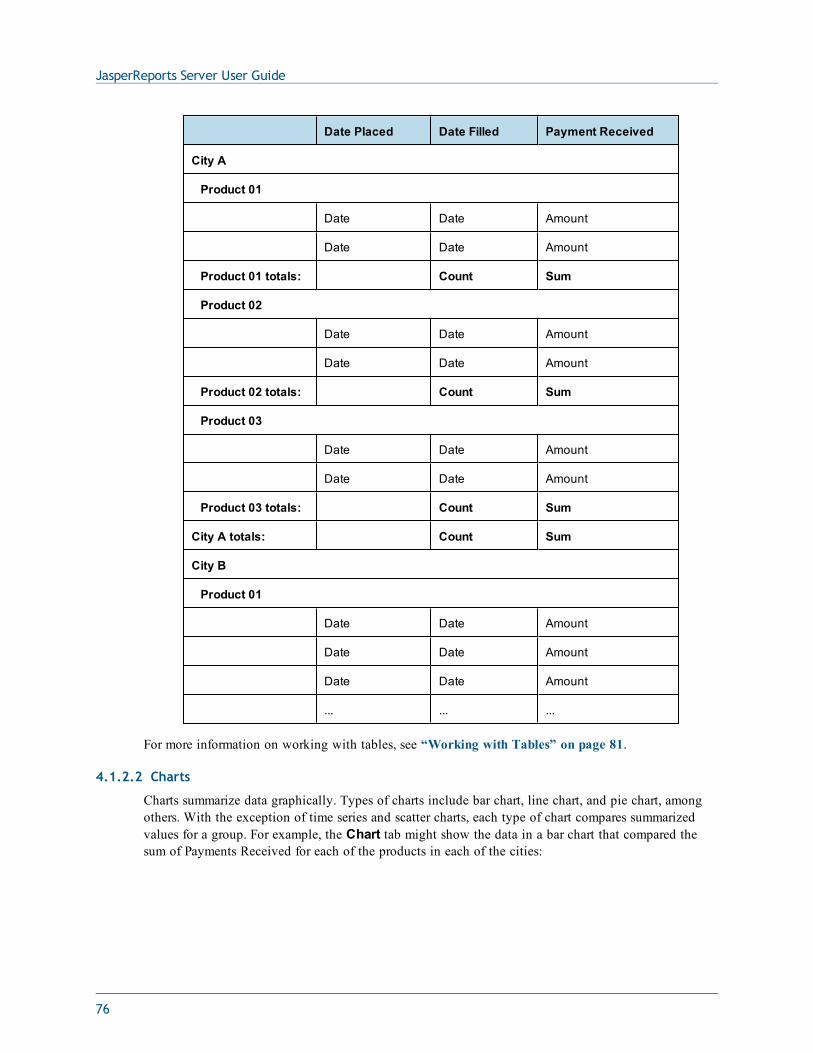
JasperReports Server User Guide
Date Placed Date Filled Payment Received
City A
Product 01
Date Date Amount
Date Date Amount
Product 01 totals: Count Sum
Product 02
Date Date Amount
Date Date Amount
Product 02 totals: Count Sum
Product 03
Date Date Amount
Date Date Amount
Product 03 totals: Count Sum
City A totals: Count Sum
City B
Product 01
Date Date Amount
Date Date Amount
Date Date Amount
... ... ...
For more information on working with tables, see “Working with Tables” on page 81.
4.1.2.2 Charts
Charts summarize data graphically. Types of charts include bar chart, line chart, and pie chart, amongothers. With the exception of time series and scatter charts, each type of chart compares summarizedvalues for a group. For example, the Chart tab might show the data in a bar chart that compared thesum of Payments Received for each of the products in each of the cities:
76
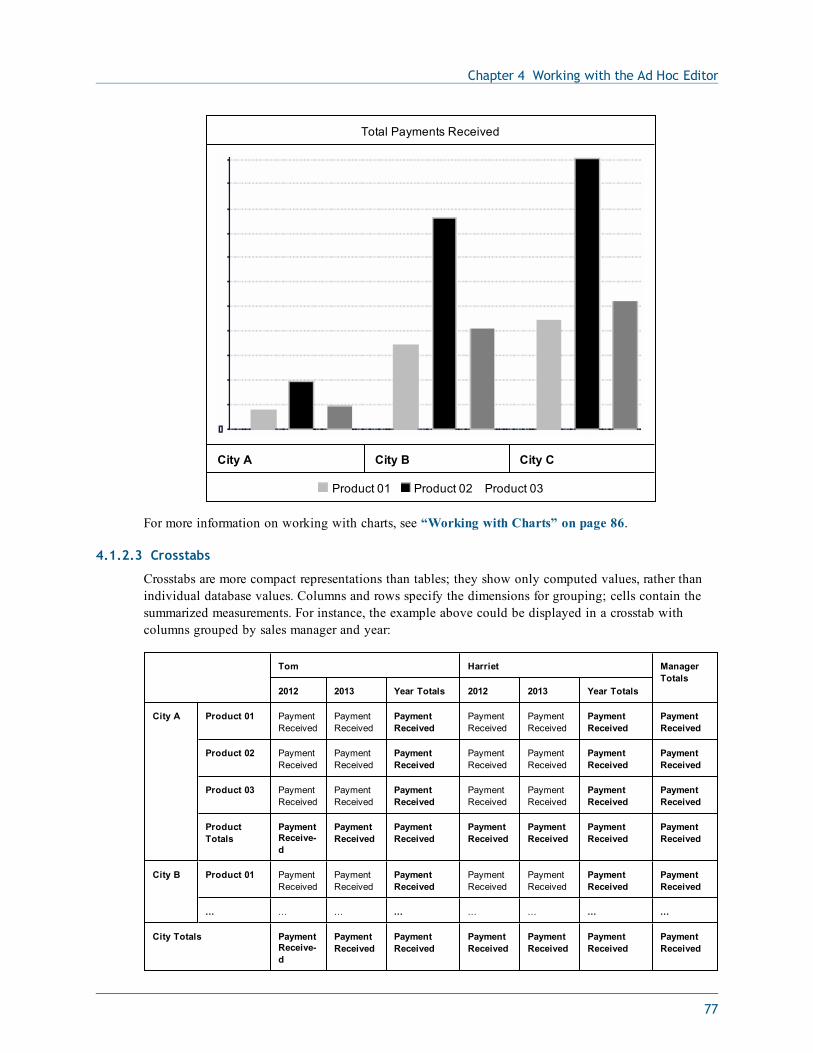
Chapter 4 Working with the Ad Hoc Editor
Total Payments Received
City A City B City C
Product 01 Product 02 Product 03
For more information on working with charts, see “Working with Charts” on page 86.
4.1.2.3 Crosstabs
Crosstabs are more compact representations than tables; they show only computed values, rather thanindividual database values. Columns and rows specify the dimensions for grouping; cells contain thesummarized measurements. For instance, the example above could be displayed in a crosstab withcolumns grouped by sales manager and year:
Tom Harriet ManagerTotals
2012 2013 Year Totals 2012 2013 Year Totals
City A Product 01 PaymentReceived
PaymentReceived
PaymentReceived
PaymentReceived
PaymentReceived
PaymentReceived
PaymentReceived
Product 02 PaymentReceived
PaymentReceived
PaymentReceived
PaymentReceived
PaymentReceived
PaymentReceived
PaymentReceived
Product 03 PaymentReceived
PaymentReceived
PaymentReceived
PaymentReceived
PaymentReceived
PaymentReceived
PaymentReceived
ProductTotals
PaymentReceive-d
PaymentReceived
PaymentReceived
PaymentReceived
PaymentReceived
PaymentReceived
PaymentReceived
City B Product 01 PaymentReceived
PaymentReceived
PaymentReceived
PaymentReceived
PaymentReceived
PaymentReceived
PaymentReceived
... ... ... ... ... ... ... ...
City Totals PaymentReceive-d
PaymentReceived
PaymentReceived
PaymentReceived
PaymentReceived
PaymentReceived
PaymentReceived
77
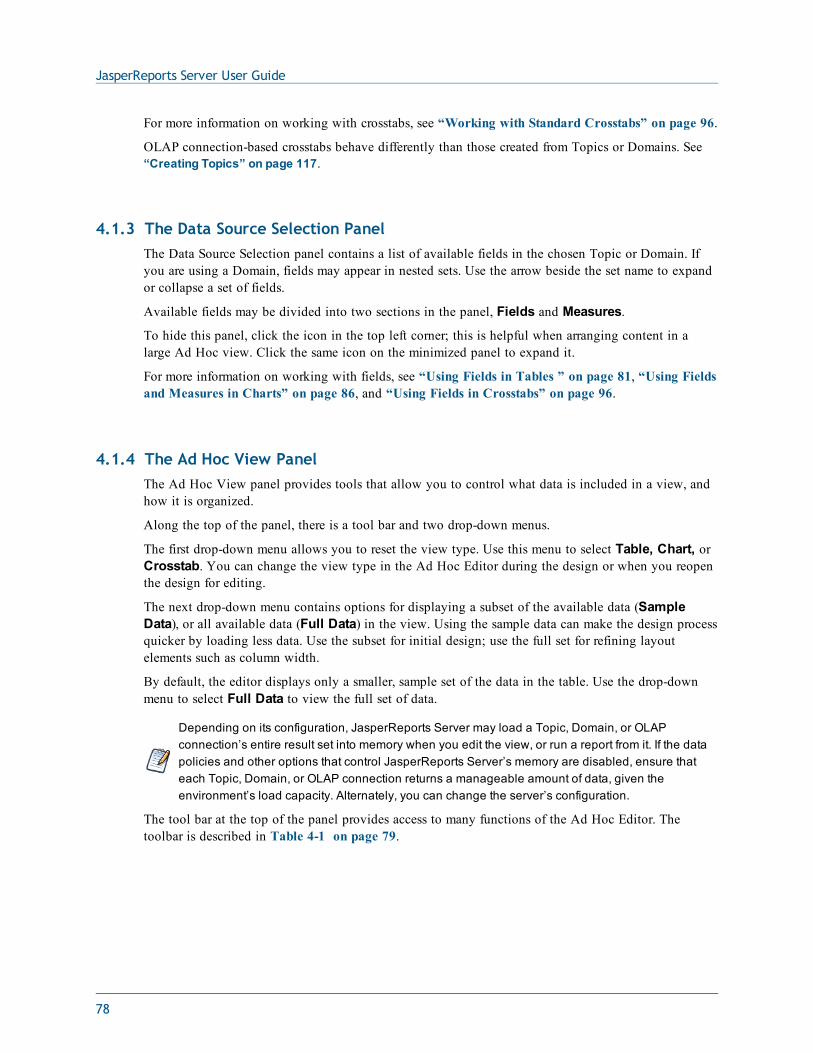
JasperReports Server User Guide
For more information on working with crosstabs, see “Working with Standard Crosstabs” on page 96.
OLAP connection-based crosstabs behave differently than those created from Topics or Domains. See“Creating Topics” on page 117.
4.1.3 The Data Source Selection PanelThe Data Source Selection panel contains a list of available fields in the chosen Topic or Domain. Ifyou are using a Domain, fields may appear in nested sets. Use the arrow beside the set name to expandor collapse a set of fields.
Available fields may be divided into two sections in the panel, Fields and Measures.
To hide this panel, click the icon in the top left corner; this is helpful when arranging content in alarge Ad Hoc view. Click the same icon on the minimized panel to expand it.
For more information on working with fields, see “Using Fields in Tables ” on page 81, “Using Fieldsand Measures in Charts” on page 86, and “Using Fields in Crosstabs” on page 96.
4.1.4 The Ad Hoc View PanelThe Ad Hoc View panel provides tools that allow you to control what data is included in a view, andhow it is organized.
Along the top of the panel, there is a tool bar and two drop-down menus.
The first drop-down menu allows you to reset the view type. Use this menu to select Table, Chart, orCrosstab. You can change the view type in the Ad Hoc Editor during the design or when you reopenthe design for editing.
The next drop-down menu contains options for displaying a subset of the available data (SampleData), or all available data (Full Data) in the view. Using the sample data can make the design processquicker by loading less data. Use the subset for initial design; use the full set for refining layoutelements such as column width.
By default, the editor displays only a smaller, sample set of the data in the table. Use the drop-downmenu to select Full Data to view the full set of data.
Depending on its configuration, JasperReports Server may load a Topic, Domain, or OLAPconnection’s entire result set into memory when you edit the view, or run a report from it. If the datapolicies and other options that control JasperReports Server’s memory are disabled, ensure thateach Topic, Domain, or OLAP connection returns a manageable amount of data, given theenvironment’s load capacity. Alternately, you can change the server’s configuration.
The tool bar at the top of the panel provides access to many functions of the Ad Hoc Editor. Thetoolbar is described in Table 4-1 on page 79.
78
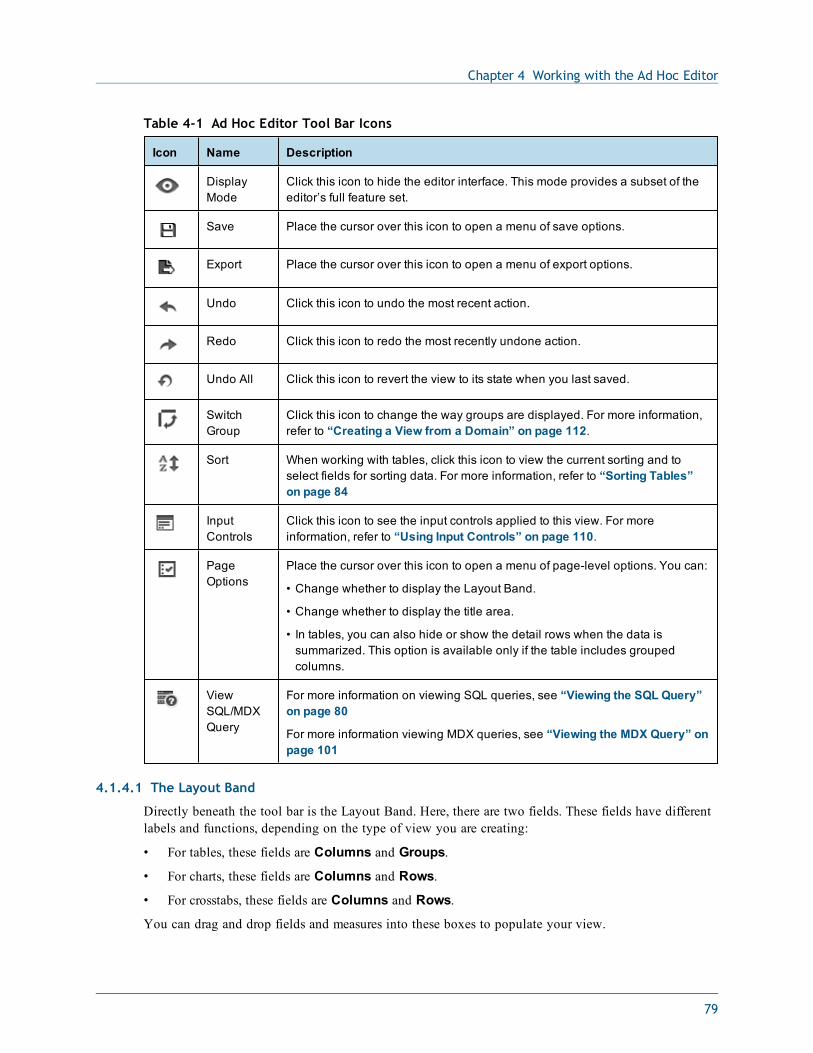
Chapter 4 Working with the Ad Hoc Editor
Icon Name Description
DisplayMode
Click this icon to hide the editor interface. This mode provides a subset of theeditor’s full feature set.
Save Place the cursor over this icon to open a menu of save options.
Export Place the cursor over this icon to open a menu of export options.
Undo Click this icon to undo the most recent action.
Redo Click this icon to redo the most recently undone action.
Undo All Click this icon to revert the view to its state when you last saved.
SwitchGroup
Click this icon to change the way groups are displayed. For more information,refer to “Creating a View from a Domain” on page 112.
Sort When working with tables, click this icon to view the current sorting and toselect fields for sorting data. For more information, refer to “Sorting Tables”on page 84
InputControls
Click this icon to see the input controls applied to this view. For moreinformation, refer to “Using Input Controls” on page 110.
PageOptions
Place the cursor over this icon to open a menu of page-level options. You can:
• Change whether to display the Layout Band.
• Change whether to display the title area.
• In tables, you can also hide or show the detail rows when the data issummarized. This option is available only if the table includes groupedcolumns.
ViewSQL/MDXQuery
For more information on viewing SQL queries, see “Viewing the SQL Query”on page 80
For more information viewing MDX queries, see “Viewing the MDX Query” onpage 101
Table 4-1 Ad Hoc Editor Tool Bar Icons
4.1.4.1 The Layout Band
Directly beneath the tool bar is the Layout Band. Here, there are two fields. These fields have differentlabels and functions, depending on the type of view you are creating:
• For tables, these fields are Columns and Groups.
• For charts, these fields are Columns and Rows.
• For crosstabs, these fields are Columns and Rows.
You can drag and drop fields and measures into these boxes to populate your view.
79
JasperReports Server User Guide
4.1.4.2 Managing Canvas Options
When working with a table or chart view, the Canvas Options selector appears below the Layout Band,to the left of the view title. This tool allows you to control the level of detail displayed in your table or
chart. Click to display the options available for your Ad Hoc view type.
For tables, the Canvas Options selector includes the following options:
• Detailed Data displays table detail only.
• Totals Data displays table totals only.
• Details and Totals displays both details and totals.
For charts, the Canvas Options selector includes the following options:
• Chart Types displays the available chart types.
• Chart Format displays formatting options.
4.1.4.3 Viewing the SQL Query
You may want to look at the SQL query for your view, to verify what data users are hitting. If youhave the proper permissions, you can do this in the Ad Hoc Editor with the View Query button.
The query is read-only, but can be copied onto a clipboard or other document for review.
To view the SQL query:
• In the tool bar, click .
The View Query window opens, displaying the SQL query.
4.1.5 The Filters PanelThe Filters panel displays any filters defined for the view. You can set the filter values and see theresulting change in the Ad Hoc View panel. To hide the Filters panel, click the icon in the top leftcorner of the panel. Click the same icon on the minimized panel to expand it again.
For more information on working with filters, see “Using Filters and Input Controls” on page 105.
4.1.6 Saving an Ad Hoc View, Previewing and Creating a ReportAfter you create a compelling table, chart, or crosstab, you can save the view in the repository forfuture use.
To save an Ad Hoc view:
1. Hover your mouse over .
2. Select Save Ad Hoc View or Save Ad Hoc View As.
3. Name the view as needed, and click
The view is saved in the repository.
80
Chapter 4 Working with the Ad Hoc Editor
You can also save an Ad Hoc view as a report. Typically, a report is created when you want to:
• See data in the interactive report viewer.
• Perform additional formatting of the table data.
• Embed the data content into a dashboard.
Create a report from the view by selecting Save Ad Hoc View and Create Report; you can alsocreate and run a report directly from the repository. For more information, see “Running or Creating aSimple Report” on page 40. When you run the report, it is displayed as a JasperReport.
4.1.6.1 Dependent Reports
When you create a report from an Ad Hoc view, the report is considered “dependent” on that view.
When you save an Ad Hoc view its dependent reports are not updated. For example, if you open an AdHoc view in the Editor and add a column to it, that column will not show up in previous reportscreated from that view. In such a case, you may want to save the updated view with a differentfilename to avoid confusion.
4.2 Working with TablesThe following sections explain how to populate, edit, and format your table-type view.
4.2.1 Using Fields in TablesInsert data into your table by adding fields. All available fields are listed in the Data SourceSelection panel, on the left side of the Ad Hoc Editor.
The available fields are divided into two sections in the panel:
• Fields, which can be added to the table as columns or groups.
• Measures, which are specialized fields that contain data values.
To add fields and measures as columns to a table:
1. In the Data Source Selection panel, click to select the field or measure you want to add to thetable. Use Ctrl-click to select multiple items.
2. Drag the selected item into the Columns box in the Layout Band.
The field is added to the view as a column in the table.
To remove a field or measure from a table:
• In the Layout Band, click the x next to the field or measure’s name.
4.2.1.1 Groups
Groups allow you to create detailed data rows. For example, if you have a table that lists the suppliersfor a national restaurant chain, you can group the suppliers by the State field. The suppliers’ names arethen rearranged so that all suppliers located in Maine, for instance, are located under a “Maine” headerrow; suppliers in Maryland are together under a “Maryland” header row, and so on.
81
JasperReports Server User Guide
You can use multiple fields to make more specific nested groups. By adding a group based on the“City” field to the table described above, the restaurant suppliers are arranged by City within the Stategroups. Under the “Maine” header row, new header rows for Augusta, Bangor, and Portland are added,and the names of the Maine-based suppliers appear under their respective cities. Under the “Maryland”header row, header rows for Annapolis, Baltimore, and Silver Spring are added, and the names ofMaryland-based suppliers appear under those headers, and so on.
Only fields can be applied to a table as a group; measures cannot.
Data is grouped in the table according to the order they have defined. You can change the order bydragging the groups into position if needed.
To create a group:
1. In the Data Source Selection panel, click to select the field you want to add to the table as agroup.
2. Drag the field to the Groups box in the Layout Band.
The Ad Hoc view refreshes and displays the data grouped under a new header row.
You can also add a group to the table by right-clicking a field and selecting Add as Group.
To remove a group:
• In the Layout Band, click the x next to the field’s name in the Groups box.
To move a the grouping order up or down in a table:
• In the Layout Band, drag the name of the group you want to move into its new position.
4.2.1.2 Summaries
You can display summary data for any column in your table.Summary data may be in the form ofvarious functions, such as:
• Sum
• Count
• Distinct Count
• Average
For example, in a table with a list of stores, grouped by City and Country, you can display the numberof stores in each City, and in each Country, using this function.
By default, the summary function for each field is defined by the data source, OLAP, or domaindefinition.
To add a summary to a specific column::
• In the table, right-click the column you want to calculate a summary for, and select AddSummary.
The summary information is added to the group header, or is added to the bottom of a column if nogroups are included in the table.
To remove a summary from a specific column:
82
Chapter 4 Working with the Ad Hoc Editor
• In the table, right-click the column with the summary you want to remove, and select RemoveSummary.
The summary information is removed from the table.
To add or remove summaries from all columns:
• Click and select Detailed Data.
4.2.1.3 Column and Header Labels
You can edit a column or header label directly in the Ad Hoc Editor.
To edit a column or header label:
1. On the Ad Hoc view panel, right-click the column or group header you want to rename.
2. Select Edit Label from the context menu.
The Edit Label window opens.
3. In the text entry box, delete the existing name and enter the new name.
4. Click Submit.
If space is at a premium, you can remove labels from the view. When you delete a label, it still appearswhen you look at the view in the Ad Hoc Editor, but does not appear when you run the report.
To delete a column or header label:
1. On the Ad Hoc view, right-click the column or header label you want to remove.
2. Select Delete Label from the context menu.
To re-apply a label::
1. Right-click the column or header label you want to replace.
2. Select Add Label from the context menu.
The Edit Label window opens.
3. Enter the label name, if needed.
4. Click Submit.
4.2.1.4 Managing Column Size and Spacing
You can change the size of, and spaces between, columns to manage the appearance of your table, touse space more efficiently.
Select the columns you want to adjust by clicking anywhere in the column.
To resize a column:
1. In the Ad Hoc View panel, click to select the column you want to resize.
2. Move the cursor to the right edge of the column.
3. When the cursor changes to the resize icon ( ), click and drag the column edge right or left untilthe column is the needed size.
Spacers can be added to a table to arrange columns farther apart, or add margins to a table.
83
JasperReports Server User Guide
To change the spacing between columns:
1. In the Data Source Selection panel, in the Measures section, click Spacer.
2. Drag the spacer into the Columns box in the Layout Band between names of the two columnsyou want to move apart.
A spacer column, labeled , appears in the table.
3. Repeat this action to add space between each of the columns.
4. To remove a spacer, right-click the spacer column and select Remove from Table.
To use spacers to create table margins:
1. In the Data Source Selection panel, click to select Spacer.
2. Drag the spacer into the Columns box in the Layout Band.
3. Repeat as needed until the margins are as wide as needed.
4. Repeat the steps above, adding the spacer to the right edge of the table.
4.2.1.5 Reordering Columns
You can move columns to the right or left to reorder data in your table.
To reorder a column:
1. In the Ad Hoc View panel, right-click the column you want to move.
2. Select Move Right or Move Left from the context menu.
4.2.1.6 Sorting Tables
In the Ad Hoc Editor, you can sort the rows of a table by any field, using a number of differentmethods.
To sort a table:
1. Click .
The Sort window appears. If the table is already sorted, the window shows the fields that are used.
2. To add a field to sort on, double-click the field in Available Fields.
The Available Fields panel now lists only fields that are not already in Sort On.
3. Select one or more fields to sort by. You can also use Ctrl-click to select multiple fields.
4. Click .
5. To arrange the sorting precedence of the fields, select each field in the Sort window and click
Move to top, Move up, Move down, or Move to bottom: , , , and .
6. To remove a field, select it and click .
7. Click OK. The table updates to display the rows sorted by the selected fields.
84
Chapter 4 Working with the Ad Hoc Editor
You can also sort a table using the following methods:
• Right-click a field in the Fields section of the Data Source Selection panel, and select Use forSorting from the context menu. In this case, the table is sorted by a field that isn’t in the table;you may want to note the sorting fields in the title.
• Right-click a column header on the Canvas of the Ad Hoc View panel, and select Use forSorting from the context menu.
If a column is already being used and you want to stop using it or change the sorting, right-click thecolumn and select Change Sorting from the context menu.
4.2.1.7 Adding a Title
1. Above the table, click the text Click to add a title.
2. Enter the new table title in the text entry box.
4.2.1.8 Changing the Data Format
You can change the formatting for columns containing numeric data, such as dates and monetaryamounts.
To change the data format for a column:
1. In the Ad Hoc view, right-click the column for which you want to change the data format.
2. Select Change Data Format from the context menu.
3. Select the format you want to use. These options vary, depending on the type of numeric datacontained in the column.
The data in the column now appears in the new format.
4.2.1.9 Changing the Data Source
You may need to select a new data source for your table. This is a simple task, but you should keep inmind that all view data and formatting are lost when you select a new Topic, Domain, or OLAPconnection. Any changes to the view are also lost if you navigate to another page using the browsernavigation buttons, the main menu, or the Search field. To preserve changes, accept the current Topicor click Cancel.
To change the table’s data source:
1. At the top of the Data Source Selection panel, click and select Change Source.2. Select a different Topic, Domain, or OLAP connection.
3. Click Table to apply the new data source.
Click Cancel to return to the editor without changing the Topic.
4.2.1.10 Showing and Hiding Detail Rows
You can simplify or expand the information in your table by hiding or showing detail rows.
To hide detail rows in a table:
1. Place the cursor over .
85
JasperReports Server User Guide
2. Select Hide Detail Rows to show only the summarized totals for each group.
The Ad Hoc Editor applies a summary to each field depending on its datatype.
To show detail rows in a table:
1. Place the cursor over .
2. Select Show Detail Rows to display the detailed information for each group.
The Ad Hoc Editor displays the complete information in each row.
4.2.1.11 Controlling the Data Set
You can control the data displayed in the grid by using the Grid Detail Selector. The Grid DetailSelector options are:
• Detailed Data, which displays table detail only. For instance, in a table listing sales in dollars forall stores in a region for a given month, the amount sold by each store that month is displayed.
• Totals Data, which displays the table totals only. In the table described above, the total amount ofall sales at all regional stores that month is displayed.
• Details and Totals, which displays both the individual store sales numbers, as well as the totalsales numbers at the bottom of the store sales column.
To change displayed table details:
1. Place your cursor over .
2. Click to select the menu option, described above, you want applied to your table.
The Ad Hoc Editor displays the data as requested.
4.3 Working with ChartsAd Hoc charts are a flexible, interactive way to explore your data graphically. You can choose differentlevels of aggregation for rows and columns, change a field from a column to a row, pivot the entirechart, hide chart values, and zoom in to see chart details.
The following sections explain how to populate, edit, and format an Ad Hoc chart. Many tasks relatedto working with charts are identical (or very similar) to those for tables and crosstabs. For any tasks notdiscussed in this section, see the information in “Working with Tables” on page 81.
4.3.1 Using Fields and Measures in ChartsYou must add at least one measure to view a chart. Before any measures are added to the chart, the AdHoc Editor displays a placeholder with the legend displaying a single entry: Add a measure tocontinue. As you add measures, the editor displays the grand total of each measure in the chart.
The initial display only reflects the measures you add; it does not change when you add fields ordimensions. For example, for each measure you add to a bar chart, you see a bar with the total value ofthe measure, regardless of how many fields you add. This means you can add, remove, and arrange
86
Chapter 4 Working with the Ad Hoc Editor
measures and fields without waiting for the display to update. Once you have the fields and measuresyou want, you can use the sliders on the right to select the level of detail you want. See the figureEffect of the Slider on a Chart for more information.
All available fields are listed in the Data Selection panel, as either standard fields or measures.
• Standard fields can be added to a column or a row.
• Measures contain summarized values. They are typically numeric fields that determine the length ofbars, size of pie slices, location of points (in line charts), and height of areas. They can be added torows or columns, but must all be in the same target — that is, you can add one or more measures tothe chart as columns, or add one or more measures to the chart as rows, but you cannot have onemeasure as a column and another as a row in the same chart.
When creating a chart, keep in mind that row and column groups are arranged in hierarchies, with thehighest member of the hierarchy on the left. For an Ad Hoc view based on an OLAP data source, youcan change the order of distinct dimensions by dragging, but you cannot change the order of levelswithin a dimension. For an Ad Hoc view based on a non-OLAP data source, you can drag the fieldheadings to rearrange the hierarchy; the highest level in a group should appear to the left; the lowestlevel in a group should appear to the right. For example, it doesn’t make sense to group first by postalcode then by country, because each postal code belongs to only one country.
To add a field or measure to a row or column:
1. In the Data Selection panel, select the field you want to add to the chart as a group. Use Ctrl-click to select multiple items.
2. Drag the selected item into the Columns or Rows box in the Layout Band.
4.3.1.1 Setting Levels
When you add a field or dimension to a column or row, a multi-level slider located at the top of theFilters pane allows you to set the level of aggregation to use for viewing the data. The number of fieldsor dimensions in the row or column determines the number of levels on the slider; measures are notreflected in the slider.
The following figure shows the effect of the slider on a chart with one level of aggregation for bothrows and columns.
87
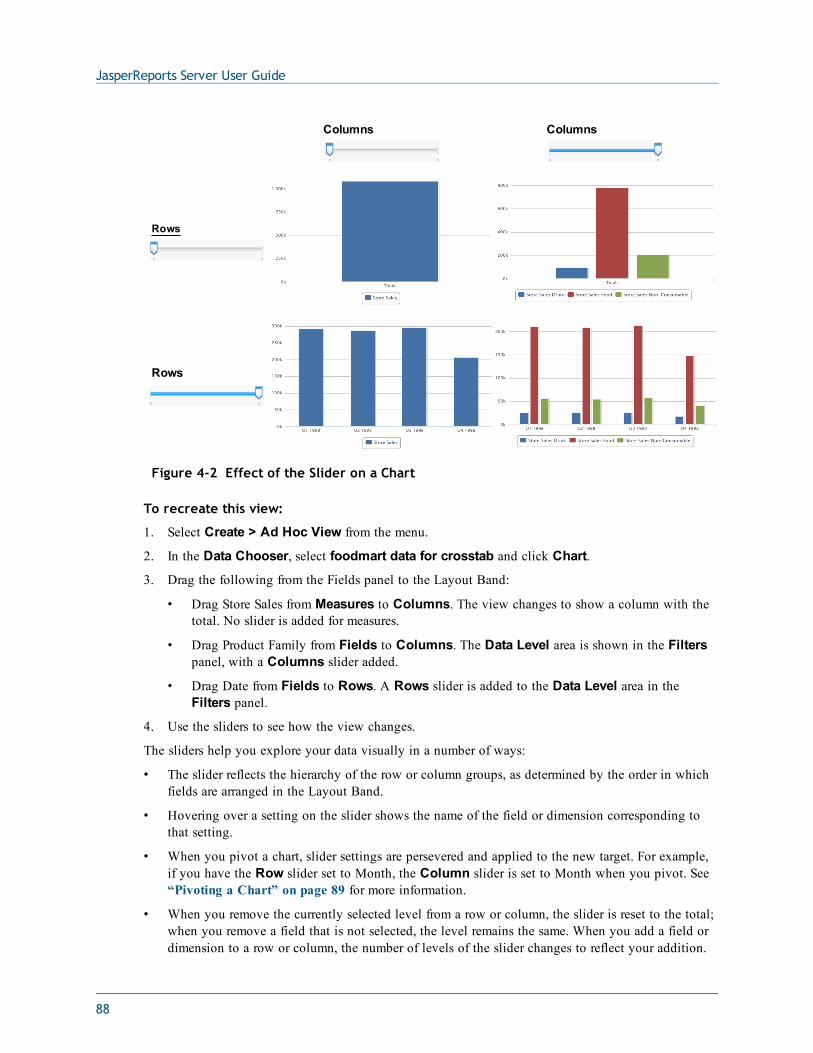
JasperReports Server User Guide
Columns Columns
Rows
Rows
Figure 4-2 Effect of the Slider on a Chart
To recreate this view:
1. Select Create > Ad Hoc View from the menu.
2. In the Data Chooser, select foodmart data for crosstab and click Chart.
3. Drag the following from the Fields panel to the Layout Band:
• Drag Store Sales from Measures to Columns. The view changes to show a column with thetotal. No slider is added for measures.
• Drag Product Family from Fields to Columns. The Data Level area is shown in the Filterspanel, with a Columns slider added.
• Drag Date from Fields to Rows. A Rows slider is added to the Data Level area in theFilters panel.
4. Use the sliders to see how the view changes.
The sliders help you explore your data visually in a number of ways:
• The slider reflects the hierarchy of the row or column groups, as determined by the order in whichfields are arranged in the Layout Band.
• Hovering over a setting on the slider shows the name of the field or dimension corresponding tothat setting.
• When you pivot a chart, slider settings are persevered and applied to the new target. For example,if you have the Row slider set to Month, the Column slider is set to Month when you pivot. See“Pivoting a Chart” on page 89 for more information.
• When you remove the currently selected level from a row or column, the slider is reset to the total;when you remove a field that is not selected, the level remains the same. When you add a field ordimension to a row or column, the number of levels of the slider changes to reflect your addition.
88
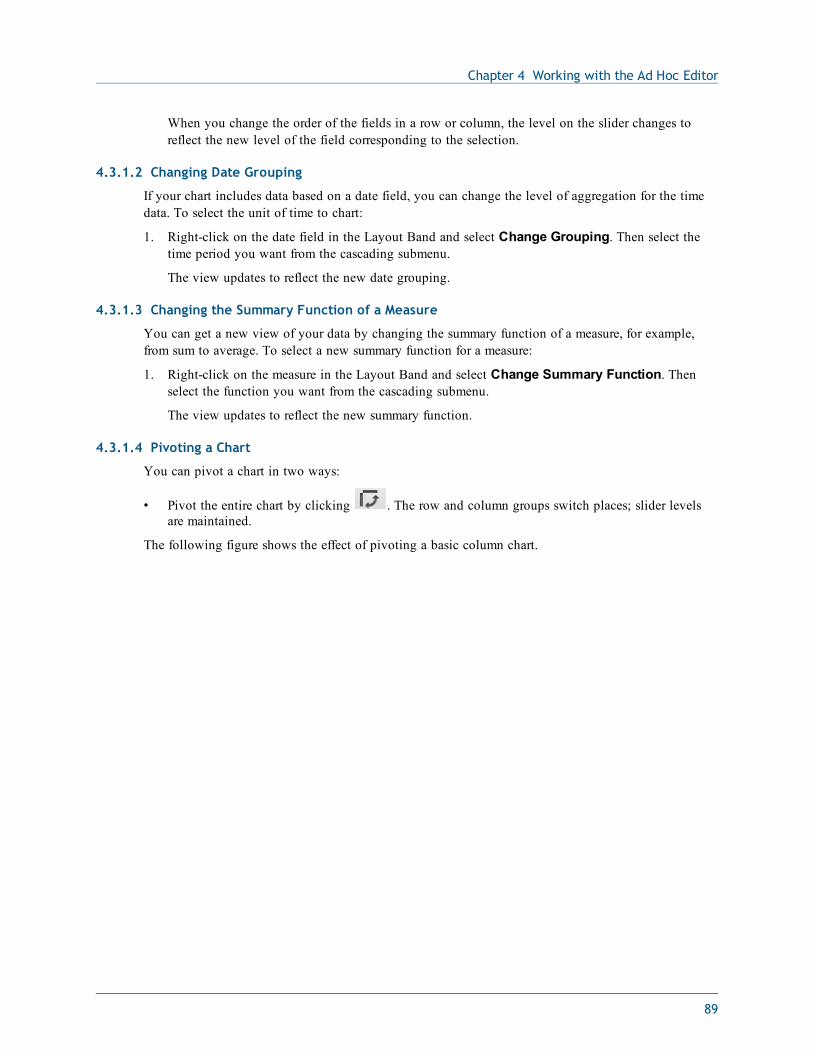
Chapter 4 Working with the Ad Hoc Editor
When you change the order of the fields in a row or column, the level on the slider changes toreflect the new level of the field corresponding to the selection.
4.3.1.2 Changing Date Grouping
If your chart includes data based on a date field, you can change the level of aggregation for the timedata. To select the unit of time to chart:
1. Right-click on the date field in the Layout Band and select Change Grouping. Then select thetime period you want from the cascading submenu.
The view updates to reflect the new date grouping.
4.3.1.3 Changing the Summary Function of a Measure
You can get a new view of your data by changing the summary function of a measure, for example,from sum to average. To select a new summary function for a measure:
1. Right-click on the measure in the Layout Band and select Change Summary Function. Thenselect the function you want from the cascading submenu.
The view updates to reflect the new summary function.
4.3.1.4 Pivoting a Chart
You can pivot a chart in two ways:
• Pivot the entire chart by clicking . The row and column groups switch places; slider levelsare maintained.
The following figure shows the effect of pivoting a basic column chart.
89
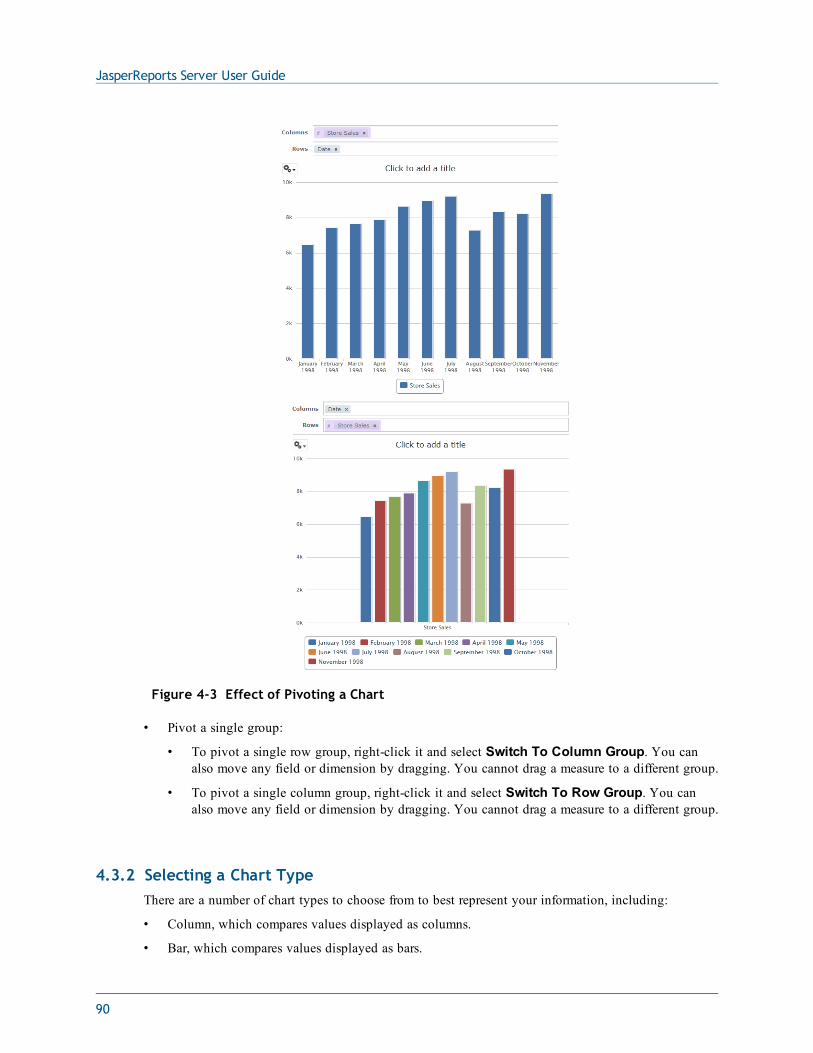
JasperReports Server User Guide
Figure 4-3 Effect of Pivoting a Chart
• Pivot a single group:
• To pivot a single row group, right-click it and select Switch To Column Group. You canalso move any field or dimension by dragging. You cannot drag a measure to a different group.
• To pivot a single column group, right-click it and select Switch To Row Group. You canalso move any field or dimension by dragging. You cannot drag a measure to a different group.
4.3.2 Selecting a Chart TypeThere are a number of chart types to choose from to best represent your information, including:
• Column, which compares values displayed as columns.
• Bar, which compares values displayed as bars.
90
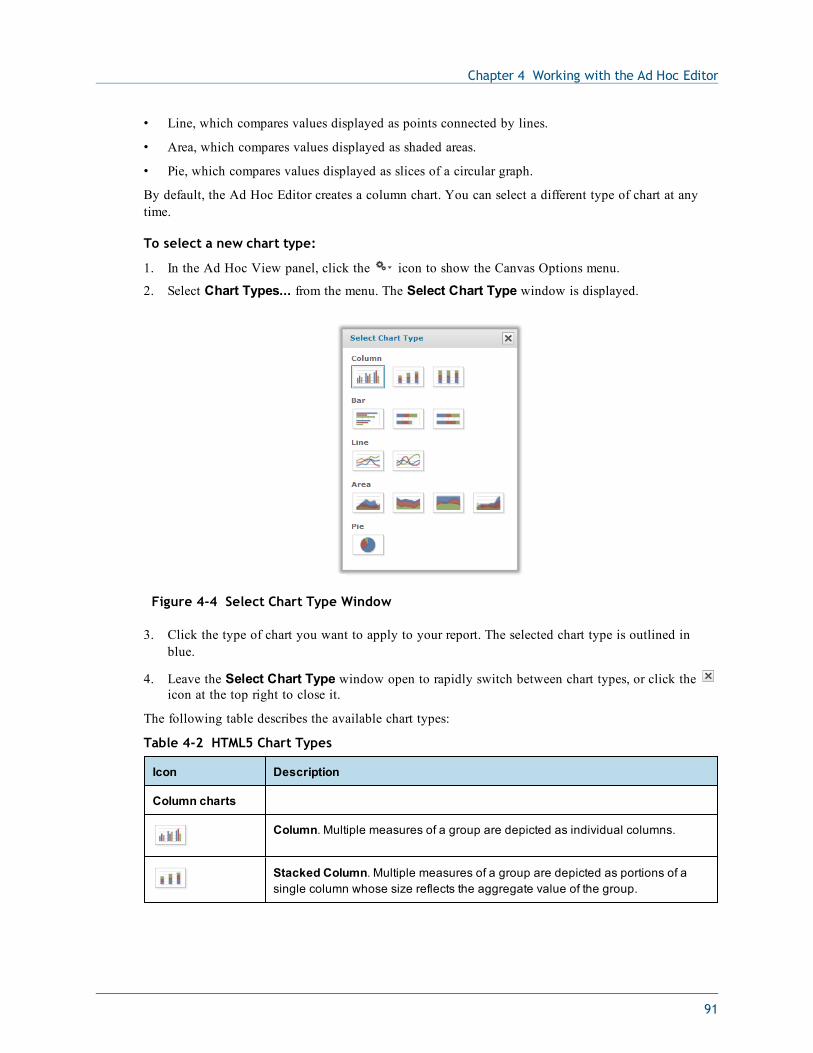
Chapter 4 Working with the Ad Hoc Editor
• Line, which compares values displayed as points connected by lines.
• Area, which compares values displayed as shaded areas.
• Pie, which compares values displayed as slices of a circular graph.
By default, the Ad Hoc Editor creates a column chart. You can select a different type of chart at anytime.
To select a new chart type:
1. In the Ad Hoc View panel, click the icon to show the Canvas Options menu.
2. Select Chart Types... from the menu. The Select Chart Type window is displayed.
Figure 4-4 Select Chart Type Window
3. Click the type of chart you want to apply to your report. The selected chart type is outlined inblue.
4. Leave the Select Chart Type window open to rapidly switch between chart types, or click theicon at the top right to close it.
The following table describes the available chart types:
Icon Description
Column charts
Column. Multiple measures of a group are depicted as individual columns.
Stacked Column. Multiple measures of a group are depicted as portions of asingle column whose size reflects the aggregate value of the group.
Table 4-2 HTML5 Chart Types
91
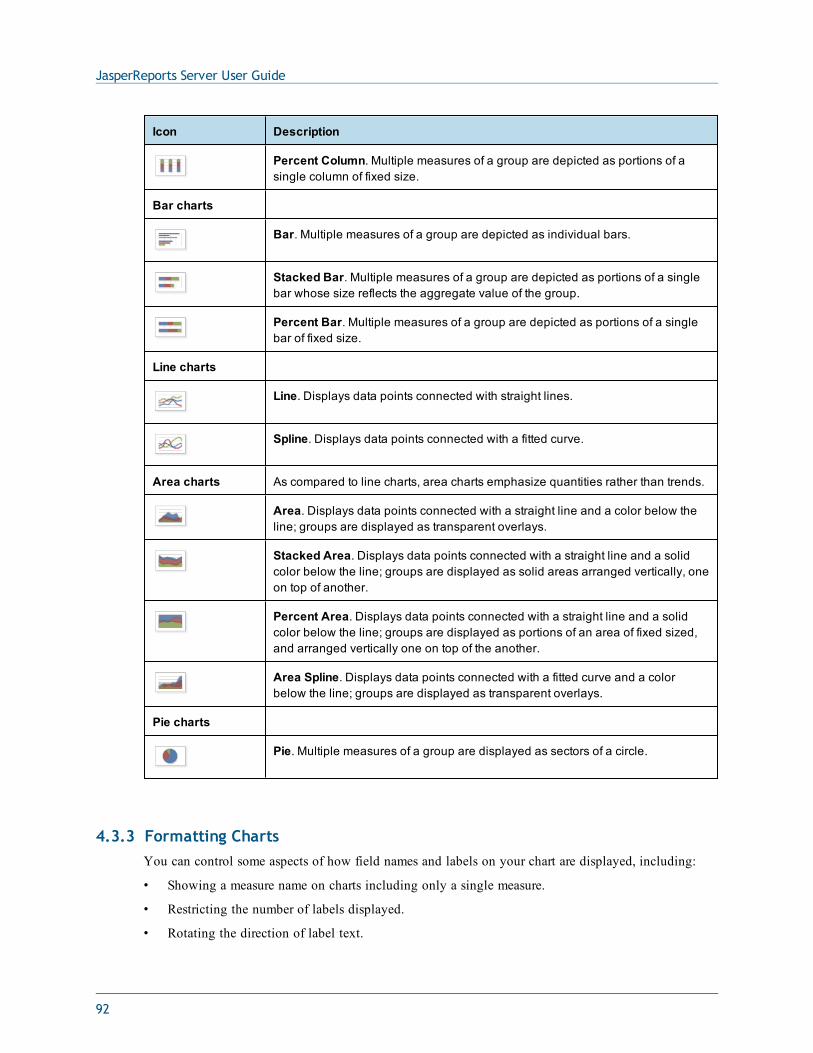
JasperReports Server User Guide
Icon Description
Percent Column. Multiple measures of a group are depicted as portions of asingle column of fixed size.
Bar charts
Bar. Multiple measures of a group are depicted as individual bars.
Stacked Bar. Multiple measures of a group are depicted as portions of a singlebar whose size reflects the aggregate value of the group.
Percent Bar. Multiple measures of a group are depicted as portions of a singlebar of fixed size.
Line charts
Line. Displays data points connected with straight lines.
Spline. Displays data points connected with a fitted curve.
Area charts As compared to line charts, area charts emphasize quantities rather than trends.
Area. Displays data points connected with a straight line and a color below theline; groups are displayed as transparent overlays.
Stacked Area. Displays data points connected with a straight line and a solidcolor below the line; groups are displayed as solid areas arranged vertically, oneon top of another.
Percent Area. Displays data points connected with a straight line and a solidcolor below the line; groups are displayed as portions of an area of fixed sized,and arranged vertically one on top of the another.
Area Spline. Displays data points connected with a fitted curve and a colorbelow the line; groups are displayed as transparent overlays.
Pie charts
Pie. Multiple measures of a group are displayed as sectors of a circle.
4.3.3 Formatting ChartsYou can control some aspects of how field names and labels on your chart are displayed, including:
• Showing a measure name on charts including only a single measure.
• Restricting the number of labels displayed.
• Rotating the direction of label text.
92
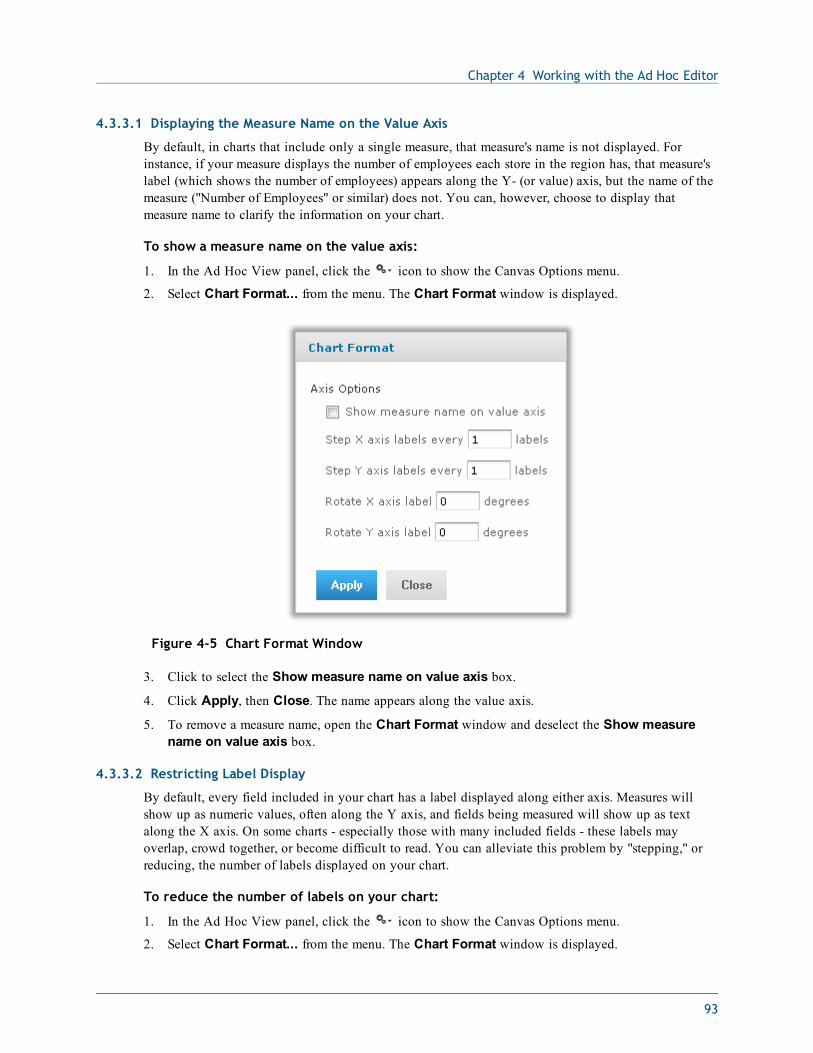
Chapter 4 Working with the Ad Hoc Editor
4.3.3.1 Displaying the Measure Name on the Value Axis
By default, in charts that include only a single measure, that measure's name is not displayed. Forinstance, if your measure displays the number of employees each store in the region has, that measure'slabel (which shows the number of employees) appears along the Y- (or value) axis, but the name of themeasure ("Number of Employees" or similar) does not. You can, however, choose to display thatmeasure name to clarify the information on your chart.
To show a measure name on the value axis:
1. In the Ad Hoc View panel, click the icon to show the Canvas Options menu.
2. Select Chart Format... from the menu. The Chart Format window is displayed.
Figure 4-5 Chart Format Window
3. Click to select the Show measure name on value axis box.
4. Click Apply, then Close. The name appears along the value axis.
5. To remove a measure name, open the Chart Format window and deselect the Show measurename on value axis box.
4.3.3.2 Restricting Label Display
By default, every field included in your chart has a label displayed along either axis. Measures willshow up as numeric values, often along the Y axis, and fields being measured will show up as textalong the X axis. On some charts - especially those with many included fields - these labels mayoverlap, crowd together, or become difficult to read. You can alleviate this problem by "stepping," orreducing, the number of labels displayed on your chart.
To reduce the number of labels on your chart:
1. In the Ad Hoc View panel, click the icon to show the Canvas Options menu.
2. Select Chart Format... from the menu. The Chart Format window is displayed.
93
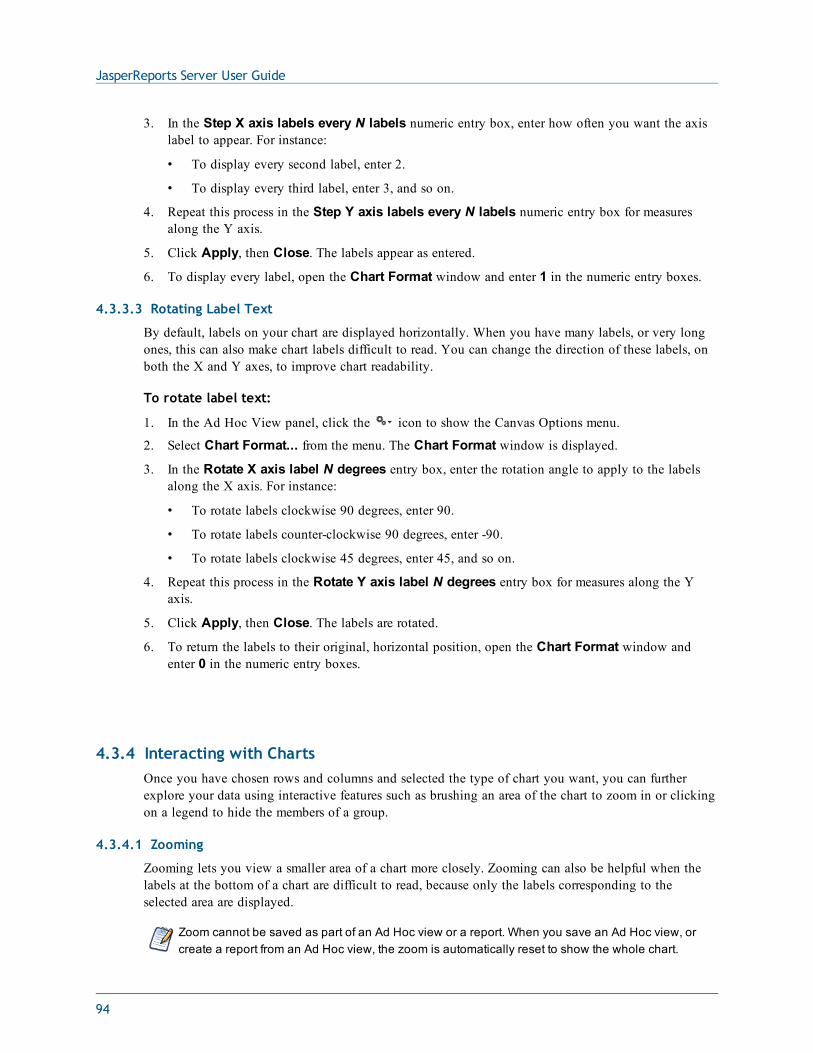
JasperReports Server User Guide
3. In the Step X axis labels every N labels numeric entry box, enter how often you want the axislabel to appear. For instance:
• To display every second label, enter 2.
• To display every third label, enter 3, and so on.
4. Repeat this process in the Step Y axis labels every N labels numeric entry box for measuresalong the Y axis.
5. Click Apply, then Close. The labels appear as entered.
6. To display every label, open the Chart Format window and enter 1 in the numeric entry boxes.
4.3.3.3 Rotating Label Text
By default, labels on your chart are displayed horizontally. When you have many labels, or very longones, this can also make chart labels difficult to read. You can change the direction of these labels, onboth the X and Y axes, to improve chart readability.
To rotate label text:
1. In the Ad Hoc View panel, click the icon to show the Canvas Options menu.
2. Select Chart Format... from the menu. The Chart Format window is displayed.
3. In the Rotate X axis label N degrees entry box, enter the rotation angle to apply to the labelsalong the X axis. For instance:
• To rotate labels clockwise 90 degrees, enter 90.
• To rotate labels counter-clockwise 90 degrees, enter -90.
• To rotate labels clockwise 45 degrees, enter 45, and so on.
4. Repeat this process in the Rotate Y axis label N degrees entry box for measures along the Yaxis.
5. Click Apply, then Close. The labels are rotated.
6. To return the labels to their original, horizontal position, open the Chart Format window andenter 0 in the numeric entry boxes.
4.3.4 Interacting with ChartsOnce you have chosen rows and columns and selected the type of chart you want, you can furtherexplore your data using interactive features such as brushing an area of the chart to zoom in or clickingon a legend to hide the members of a group.
4.3.4.1 Zooming
Zooming lets you view a smaller area of a chart more closely. Zooming can also be helpful when thelabels at the bottom of a chart are difficult to read, because only the labels corresponding to theselected area are displayed.
Zoom cannot be saved as part of an Ad Hoc view or a report. When you save an Ad Hoc view, orcreate a report from an Ad Hoc view, the zoom is automatically reset to show the whole chart.
94
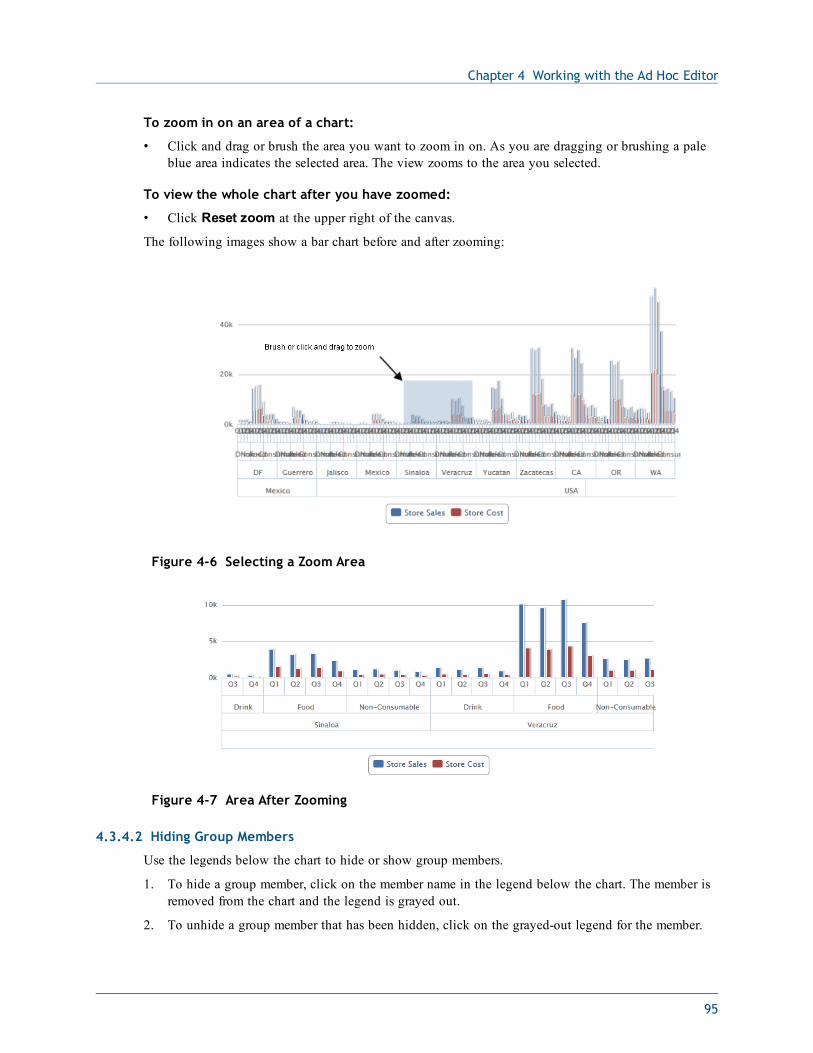
Chapter 4 Working with the Ad Hoc Editor
To zoom in on an area of a chart:
• Click and drag or brush the area you want to zoom in on. As you are dragging or brushing a paleblue area indicates the selected area. The view zooms to the area you selected.
To view the whole chart after you have zoomed:
• Click Reset zoom at the upper right of the canvas.
The following images show a bar chart before and after zooming:
Figure 4-6 Selecting a Zoom Area
Figure 4-7 Area After Zooming
4.3.4.2 Hiding Group Members
Use the legends below the chart to hide or show group members.
1. To hide a group member, click on the member name in the legend below the chart. The member isremoved from the chart and the legend is grayed out.
2. To unhide a group member that has been hidden, click on the grayed-out legend for the member.
95
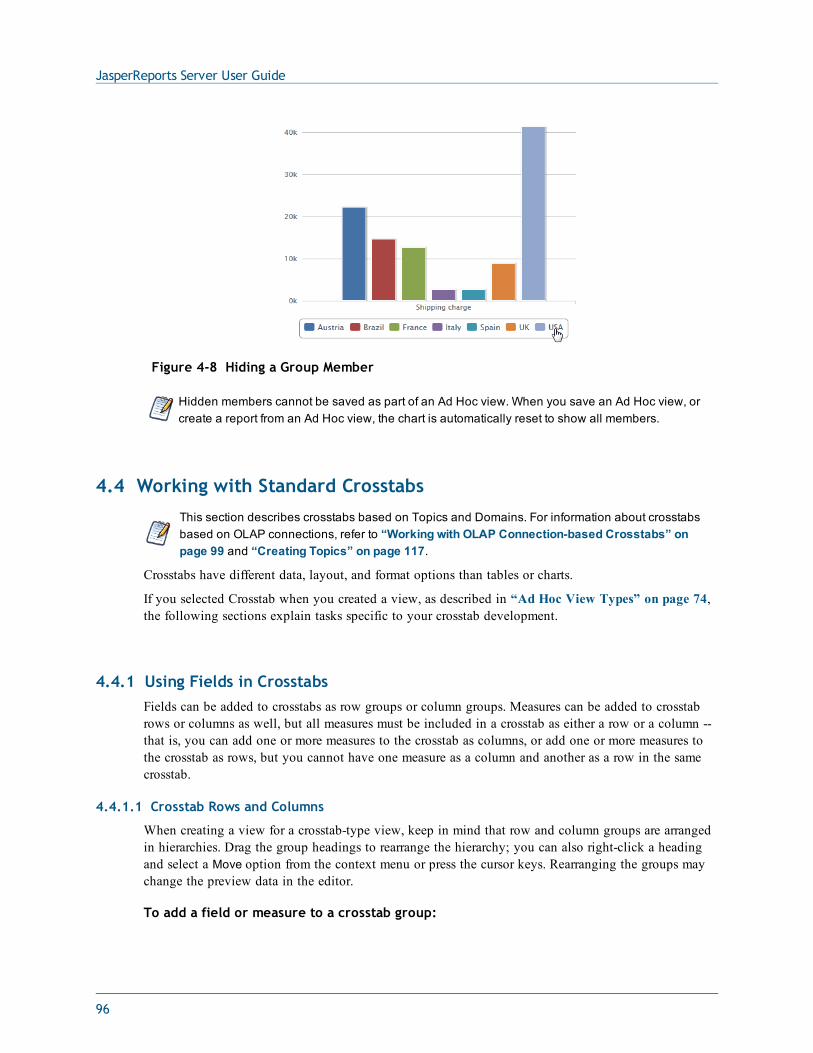
JasperReports Server User Guide
Figure 4-8 Hiding a Group Member
Hidden members cannot be saved as part of an Ad Hoc view. When you save an Ad Hoc view, orcreate a report from an Ad Hoc view, the chart is automatically reset to show all members.
4.4 Working with Standard CrosstabsThis section describes crosstabs based on Topics and Domains. For information about crosstabsbased on OLAP connections, refer to “Working with OLAP Connection-based Crosstabs” onpage 99 and “Creating Topics” on page 117.
Crosstabs have different data, layout, and format options than tables or charts.
If you selected Crosstab when you created a view, as described in “Ad Hoc View Types” on page 74,the following sections explain tasks specific to your crosstab development.
4.4.1 Using Fields in CrosstabsFields can be added to crosstabs as row groups or column groups. Measures can be added to crosstabrows or columns as well, but all measures must be included in a crosstab as either a row or a column --that is, you can add one or more measures to the crosstab as columns, or add one or more measures tothe crosstab as rows, but you cannot have one measure as a column and another as a row in the samecrosstab.
4.4.1.1 Crosstab Rows and Columns
When creating a view for a crosstab-type view, keep in mind that row and column groups are arrangedin hierarchies. Drag the group headings to rearrange the hierarchy; you can also right-click a headingand select a Move option from the context menu or press the cursor keys. Rearranging the groups maychange the preview data in the editor.
To add a field or measure to a crosstab group:
96
Chapter 4 Working with the Ad Hoc Editor
1. In the Data Source Selection panel, click to select the field you want to add to the crosstab as agroup. Use Ctrl-click to select multiple items.
2. Drag the selected item into the Columns or Rows box in the Layout Band.
4.4.1.2 Crosstab Measures
Measure labels are displayed in the crosstab based on their status as a row or column:
• Measures included as rows appear in the crosstab below the Measures heading.
• Measures included as columns appear in the crosstab to the right of the Measures heading.
You can right-click a measure in the crosstab to open a context menu that provides these options:• Change Summary Function• Change Data Format• Remove From Crosstab• Create Filter
• Move Up or Move Down
Measures are arranged in cells. You can add any number of measures. All the measures appear togetherin every cell. To rearrange the measures, drag them in the measure label area.
4.4.1.3 Pivoting
You can pivot a crosstab in two ways:
• Pivot the entire crosstab by clicking . The row and column groups switch places. For moreinformation, see “Creating a View from a Domain” on page 112.
• Pivot a single group:
• To pivot a single row group, right-click it and select Switch To Column Group.
• To pivot a single column group, right-click it and select Switch To Row Group.
Pivoting removes any custom sorting applied to headings in your crosstab. It does not affect columnor row sorts.
4.4.1.4 Slicing
The slice feature lets you keep or exclude group members in a crosstab. To slice, right-click a groupmember and select:
• Keep Only to remove all groups except the selected one from the crosstab.
• Exclude to remove this group from the crosstab.
Use Ctrl-click and Shift-click to select multiple groups to keep or exclude.
You can select multiple row groups or multiple column groups; you can't slice by both row groupsand column groups at once. Compare slice to drill-through, drill to details, and filtering.
For more information about filtering, see “Using Filters and Input Controls” on page 105.
4.4.1.5 Summarizing
All row and column groups are summarized automatically:
97
JasperReports Server User Guide
• To turn off a group summary, right-click any heading in the group and select Delete RowSummary or Delete Column Summary from the context menu. To reapply the summary, right-click the heading and select Add Row Summary or Add Column Summary.
The Delete Summary option is available only for the outermost group on either axis (that is, eitherthe outermost row group or the outermost column group)
• To select the summary function and data format for a measure, right-click the measure label andselect from the context menu. Note that you can’t change the summary function on custom fieldsthat calculate percents (Percent of Total, Percent of Column Group Parent, and Percent of RowGroup Parent).
• The summary functions for numeric fields are Sum, Average, Maximum, Minimum, Distinct Count,and Count All. Distinct Count is the number of different items in the row or column; Count All isthe total number of items. For instance, if there are 3 widgets of type A and 3 widgets of type B,Distinct Count is 2 and Count All is 6.
4.4.1.6 Collapsing and Expanding Members
By default, the editor displays each row and column group of a crosstab in a collapsed state. Thismeans that you can see the totals for the group, but not the measures for its individual members. To seemeasures for a group’s members, right-click the group label and select Expand Members.
When a group’s members are expanded, select Collapse Members from the same menu to hide themeasures. Collapsing an outer group also collapses its inner groups. The Expand Members andCollapse Members options are only available for outermost groups, or for inner groups nested in anexpanded outer group.
When you collapse a group, its summary is automatically displayed; this prevents invalid crosstablayouts in which there is nothing to display for some totals if the summary has been deleted previously.
4.4.1.7 Sorting
By default, the rows and columns of a crosstab are sorted in alphabetical order of the group names.
To change how your crosstab is sorted:
1. Right-click the heading you want to use to sort your crosstab.
2. In the context menu, select the sorting option to apply:• Sort Ascending• Sort Descending
The crosstab is updated to reflect your sorting option. A blue dot appears in the context menu nextto the currently applied sort option.
When the crosstab includes more than one row group or more than one column group, the inner groupsare also sorted according to your selection. Only one measure can be used for sorting at any one time;changing the sort order for another measure resets all others to the default.
4.4.1.8 Resizing and Layout
Many of the layout and formatting options that are set manually in tables are set automatically incrosstabs. In particular, row and column sizes are fixed and no spacer is available.
98

Chapter 4 Working with the Ad Hoc Editor
4.4.1.9 Drilling Through Data
Drill-through functionality is available for crosstab data. A drill-through table displays the supportingdetails for the selected roll-up value.
To view the drill-through table for a value in your crosstab:
• Click hyperlinked data to display additional columns from that specific fact data.
By default, the drill-through table opens in its own window or tab, depending on your browser settings.
4.5 Working with OLAP Connection-based CrosstabsAn OLAP connection is a definition for retrieving OLAP data for use in Ad Hoc views and reports. AnOLAP connection is either a direct Java connection (Mondrian connection) or an XML-based APIconnection (XML/A connection). You must create OLAP client connections in order to use thisfunctionality, which may be restricted by your license. For more information on creating OLAP clientconnections, as well as other administrative tasks regarding OLAP, refer to the Jaspersoft OLAP UserGuide.
The Ad Hoc Editor displays a more focused tool bar when your Ad Hoc view is based on an OLAPconnection. It contains a subset of the options available in the standard tool bar, including DisplayMode, Redo, Undo All, Switch Group, Display Options, and View MDX Query. For a description ofthese options, see the figure Ad Hoc Editor Tool Bar Icons.
4.5.1 Dimensions and MeasuresWhen you create a view based on an OLAP connection, the cube metadata defined in the connection’sOLAP schema is automatically applied to your data: the dimensions and measures in the cube areshown in the Data Source Selection panel.
Dimensions and measures describe your data in terms of these organizing principles and facts:
• Dimension: A categorization of the data in a cube. For example, a cube that stores data about salesfigures might include dimensions such as time, product, region, and customer’s industry. Adimension is a hierarchical series of relationships in which each level has a parent and may alsohave children. Note that a level is a particular location within the dimension, whereas a member isa specific data element at a particular level. For example, if the dimension is Geography, then oneof its levels might be Country; at the Country level, USA might be a member.
Some dimensions include a special level at the top of the hierarchy that includes every level in thedimension. This All member is used to display the summarized data across the dimension. The Allmember of dimensions is a common feature in many OLAP solutions.
• Measure: A field that displays the facts that constitute the quantitative data in a cube. Forexample, a cube that stores data about sales figures might include measures such as unit sales, storesales revenue, and store sales cost.
The items in the Dimensions section of the Data Source Selection panel may appear in a multi-leveltree structure. You can add the entire dimension tree, or any sub-trees, to your crosstab by dragging thetop-level name into the Layout Band. Individual items can be added to the crosstab in the samemanner.
99
JasperReports Server User Guide
Items in the Measures section are organized into a single-level list. Any calculated measures areindicated with a calculation icon .
When working with OLAP connections, the Layout Band at the top of the Ad Hoc View panel allowsyou to drag and drop dimensions and measures into the crosstab. As you add columns and rows, thecrosstab automatically builds on the panel. In the Columns and Rows fields, each item in yourcrosstab is represented as a token; drag tokens left and right to change their position on an axis or dragthem between the fields to pivot them.
The cube metadata applied to your view provides structure to your crosstab: you can add a dimensionwith any number of levels, but it must follow the hierarchy defined in the cube. For example, if adimension’s levels are Country, State, and City, you can place any one of them in the crosstab, but ifyou add two or more, their order (defined in the OLAP schema) is enforced. For example:
Possible Impossible
Country, State, City State, Country, City
Country, City City, Country
State, City City, State
Country, State State, Country
In addition, you can’t mix members from different dimensions. For example, consider a crosstab thatincludes both a Geography dimension (Country, State, and City) and a Time dimension (Year, Quarter,and Month): you can’t insert the Year level between the Country and State levels. The levels of eachdimension are always kept together.
All measures in the crosstab must be either rows or columns. You can’t have measures on both axes atthe same time. To move measures between dimensions, right-click and select Switch To ColumnGroup or Switch To Row Group. All the measures move to the other axis.
4.5.2 Drilling Through DataDrill-through functionality is available for crosstab data. A drill-through table displays the supportingdetails for the selected roll-up value.
To view the drill-through table for a value in your crosstab:
1. Click hyperlinked data to display additional columns related to that information.
2. Use the page controls to navigate the table.
The drill-through table opens in its own window or tab, depending on your browser settings.
4.5.3 SortingLike standard crosstabs, the rows and columns of an OLAP crosstab are sorted in alphabetical order ofthe group names.
To change how your OLAP crosstab is sorted:
100
Chapter 4 Working with the Ad Hoc Editor
1. Right-click the heading you want to use to sort your crosstab.
2. In the context menu, select the sorting option to apply:• Sort Ascending• Sort Descending
The crosstab is updated to reflect your sorting option. A blue dot appears in the context menu nextto the currently applied sort option.
When the crosstab includes more than one row group or more than one column group, the inner groupsare also sorted according to your selection. Only one measure can be used for sorting at any one time;changing the sort order for another measure resets all others to the default.
4.5.4 Viewing the MDX QueryYou may want to view the MDX query created for the OLAP connection used with your crosstab, toverify what data users are hitting. If this option is enabled, you can do this in the Ad Hoc Editor withthe View Query button.
The query is read-only, but can be copied onto a clipboard or other document for review.
To view the MDX query:
• In the tool bar, click . The View Query window opens, displaying the query.
4.5.5 Working with Microsoft SSASThe Ad Hoc Editor allows you to view data from Microsoft SQL Server Analytical Services (SSAS) topopulate views and reports with multi-dimensional OLAP data. XML/A connections that point to yourSSAS data are listed with the other OLAP connections when you create an Ad Hoc view, as in thefollowing chart
example:
101
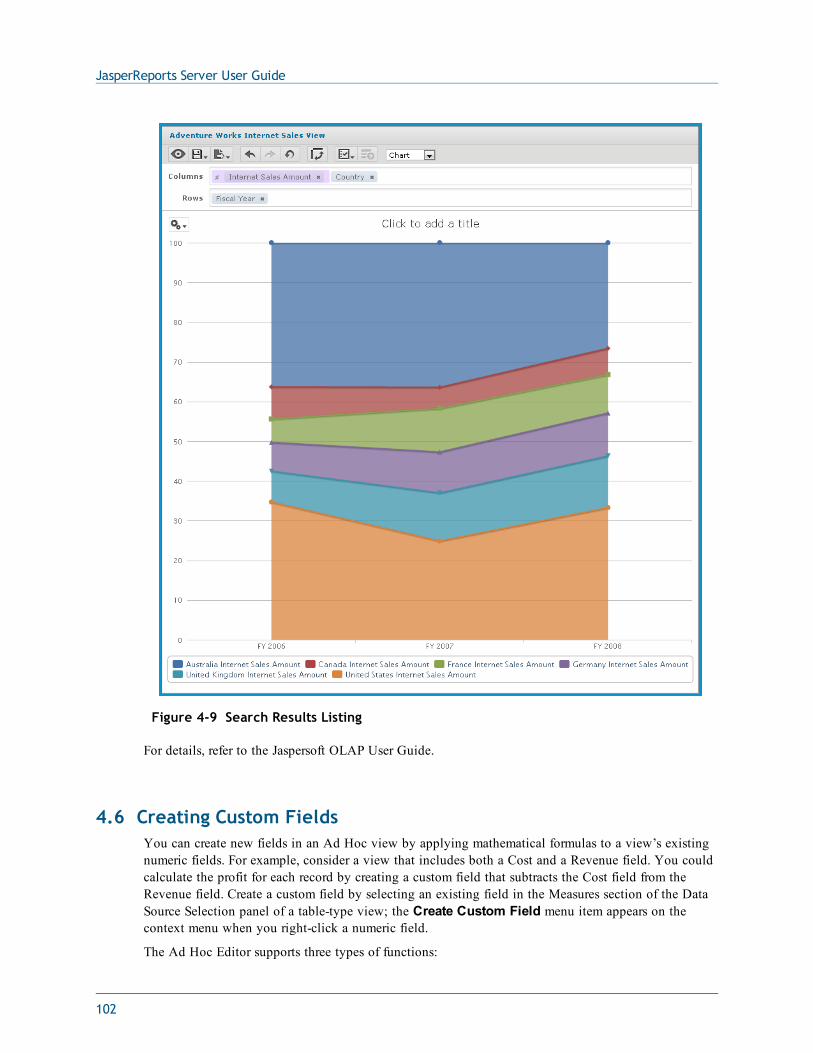
JasperReports Server User Guide
Figure 4-9 Search Results Listing
For details, refer to the Jaspersoft OLAP User Guide.
4.6 Creating Custom FieldsYou can create new fields in an Ad Hoc view by applying mathematical formulas to a view’s existingnumeric fields. For example, consider a view that includes both a Cost and a Revenue field. You couldcalculate the profit for each record by creating a custom field that subtracts the Cost field from theRevenue field. Create a custom field by selecting an existing field in the Measures section of the DataSource Selection panel of a table-type view; the Create Custom Field menu item appears on thecontext menu when you right-click a numeric field.
The Ad Hoc Editor supports three types of functions:
102
Chapter 4 Working with the Ad Hoc Editor
• Basic functions include addition, subtraction, multiplication, and division. You can use thesefunctions with a constant (such as multiplying the cost by two to calculate a standard 50%markup), or you can use them with multiple fields. Select multiple fields using Ctrl-click; thecolumns’ borders change color to indicate that multiple fields are selected; right-click to open thecontext menu and create a custom field.
• Advanced functions include round, rank, percent of total, percent of row group, and percent ofcolumn group. These functions don’t take constants, nor do they support multiple fields.
• Date functions can calculate the difference between two dates in a number of intervals, such asyears, weeks, days, and seconds.
A custom field can include only a single function. To use more than one function, create two customfields, with one building on the other. In this case, pay special attention to the order in which youcreate the custom fields, as this may affect the results; for example, rounding then multiplying isdifferent from multiplying then rounding.
Because custom fields can build upon one another, you can create complex calculations. For example,you can divide the Profit custom field in the previous example by the Revenue field to express eachrecord’s margin as a percent. When a custom field is the basis of another field, you can’t delete it untilyou delete the one that builds on it.
When working with multiple fields:
• You can only select basic functions and date differences.
• You can multiply or add any number of fields, but ordered functions (subtract and divide) and datefunctions can only be used with two fields at a time.
• For ordered operations, the order in which you select fields matters. For example, to calculate profitin the example above, click Revenue first, then Ctrl-click Cost. When you right-click, selectCreate Custom Field and choose subtraction, the Ad Hoc Editor assumes you are subtracting theCost field from the Revenue field. You can always change the order of fields by clicking Swap.
To create a custom field based on one field:
1. In the Measures section of the Data Source Selection panel, right-click a numeric field and selectCreate Custom Field from the context menu.
2. Depending on the type of function you want to create, select options in Basic Functions orAdvanced Functions.
3. In Basic Functions, you can add, subtract, multiply, or divide the field values by a constant,which you enter as a number in the selected field; this number is the constant to use in the formula.
4. If you selected a basic function, click Swap to put the constant before the field in the formula; thisis only useful in conjunction with ordered operations.
5. Click Create Field.
The custom field appears in the list of available measures.
To create a custom field based on multiple numeric fields:
1. In the Measures section of the Data Source Selection panel, Ctrl-click two or more numeric fields,right-click one of the selected fields, and select Create Custom Field from the context menu.
2. Select from the following options:
• If you selected just two fields, choose +, -, *, or /.
103
JasperReports Server User Guide
• If you selected more than two fields, choose Add All or Multiply All.
3. Click Swap from the context menu to change the order of the fields in the formula; this is onlyuseful in conjunction with ordered functions.
4. Click Create Field.
The custom field appears in the list of available measures.
To create a custom field based on two date fields:
1. In the Data Source Selection panel, Ctrl-click two date fields.
2. Right-click, and select Create Custom Field from the context menu.
3. Select one of the Date Difference intervals.
You can compare dates only when exactly two date fields are selected.
4. Click Create Field.
The custom field appears in the list of available measures.
Keep the following in mind when creating custom fields:
• To edit an existing custom field, right-click it and select Edit Formula from the context menu.You can then choose a different function, or enter a different value (if you are editing a basicfunction).
• When you create a custom field based on a field on the panel, the new field appears in the panel;when you create a custom field from a field in Data Selection, it appears at the bottom of the list.
• The percent of group functions are unique among the custom functions in that they calculatevalues based on the grouping defined in the view. Thus, the following limitations apply:
• The percent of column group functions are meaningless in charts and tables. In these contexts,these functions always return 100.
• Custom fields using the special percent functions cannot be used as a group, as a filter, nor asthe basis for other custom fields.
• The summary function for custom fields using the percent functions is always Sum; this cannotbe modified. Furthermore, the percentage is always calculated on the sum of the original field,regardless of the summary function applied to the field in the table or crosstab, if any.
• The Round function uses the standard method of rounding (arithmetic rounding), in which decimalvalues greater than 0.5 are rounded to the next largest whole number, and values less than 0.5 arerounded down.
• A custom field’s label is determined by the fields, constants, and functions it includes; for example,the default label for the Profit field in the example above is Store Sales - Store Cost. Right-click thecolumn and select Edit Label to enter a more compelling name.
• By default, the Ad Hoc Editor supports only two decimal places. If the custom fields return datathat are significant to the third decimal place, you can add new masking options by editingconfiguration files. For more information, refer to the JasperReports Server Administrator Guide.
• You can’t delete a custom field that is used in the Ad Hoc View panel. First, remove the customfield from the Ad Hoc View panel and then delete it from the Data Source Selection panel.
104
Chapter 4 Working with the Ad Hoc Editor
4.7 Using Filters and Input ControlsJRXML Topics, Domains, and OLAP connections use different mechanisms for screening the data theyreturn:
• JRXML Topics can contain Parameterized queries. The parameters can be mapped to input controlsthat allow users to select the data they want to include.
• Domains (and Domain Topics) can be filtered by selecting fields in the Domain and specifyingcomparison values. The filters can be configured for users to select the data to include.
• Within the Domain design, filters based on conditions can also be defined; these filters are notdisplayed in the report viewer when the report runs.
• OLAP connections rely on XML schemas to filter the data in an underlying transactional database.Input controls are never generated directly from the OLAP schema.
You can define filters in the Ad Hoc Editor regardless of whether you are working with data from aDomain, Topic, or OLAP connection. Such filters can be helpful in improving the view's initialperformance by reducing the amount of data the view returns by default. For more information, see“Input Controls and Filters Availability” on page 111. To prevent users from seeing the full dataset,you can also use input controls in a JRXML Topic or filters defined in the Domain design, which canbe hidden from end users.
If you want to return different data to different users of the same view, define data-level security basedon a user roles and profile attributes. This is available for reports based on a Domain, Domain Topic, orOLAP client connection. For more information, refer to the Jaspersoft OLAP User Guide. For moreinformation, refer to “The Domain Security File” on page 269 and to the Jaspersoft OLAP UserGuide.
Input controls and filters interact seamlessly. For example, you can create filters in an Ad Hoc view thatgets data from a JRXML Topic that includes input controls.
The server refreshes the editor against both the filters and the input controls. Because somecombinations of input controls and filters don’t return data, this can result in an empty view.
If the result set is empty, check for an incompatible combination of filters and input controls, such asa standard filter (set to Mexico against a Country field) and a Keep Only filter (set to Canada againsta Country field), or an incorrectly-defined advanced filter expression (data must meet all criteria inmultiple filters, rather than meeting criteria in a subset of those filters). See “Advanced Filtering” onpage 107 for information on advanced filter expressions.
In rare cases, filters can conflict with view parameters, and you’ll need to rename the field causing theconflict by editing the JRXML file. Refer to the iReport Ultimate Guide for more information aboutediting JRXML files.
For more information about:
• JRXML Topics and input controls, see “Adding Input Controls” on page 138.
• Domain Topic filters, see “Creating Topics from Domains” on page 119.
• Localizing input control prompts and lists of values, see “Localizing Reports” on page 154.
4.7.1 Using FiltersFilters can be defined at three levels:
105
JasperReports Server User Guide
• In the Domain Designer.
• When creating a view from a Domain (in the Data Chooser).
• In the Ad Hoc Editor (even when the view is based on a JRXML Topic or OLAP connection).
In this section, we discuss how to define filters in the Ad Hoc Editor. For information on definingfilters in the Domain Designer, see “The Pre-filters Tab” on page 206. For information on definingfilters in the Data Chooser, see “The Pre-filters Page” on page 114.
In addition, you can control how and what filters are applied to a field or fields by using advancedexpressions. For more information, see “Advanced Filtering” on page 107.
To create a filter in the Ad Hoc Editor:
1. Right-click a field in the Data Source Selection panel and select Create Filter.
A new filter appears in the Filters panel. If the Filters panel was hidden, it appears when you createa new filter.
If the results are empty and you don’t understand why, check for an incompatible combination offilters and input controls. Click to compare input controls with the filters in the Filters panel.
2. Use the fields in the filter to change its value. Depending on the datatype of the field you selected,the filter maybe multi-select, single-select, or text input.
3. Click and select Minimize All Filters or Maximize All Filters to toggle expansion of theitems in the filter.
4. Click and select Remove All Filters to remove the filters.
5. Click to hide the filter’s details. Click to display them again.
6. Click the Select All check box (if it appears in the Filters panel) to select all values currentlyavailable in the dataset. The Select All check box does not appear in the Filters panel for numbersand dates.
Note that the Select All check box doesn’t guarantee that all values are selected every time thereport runs. Instead, the check box is a shortcut to help you quickly select all the values currentlyavailable in the dataset. To ensure that all values appear in the view whenever it is edited or areport is run, remove the filter entirely. On the panel, you can also create a filter from the right-click context menu of a column in a table. On the Chart tab, you must right-click the field in theData Source Selection panel.
When you change a filter, the server uses the filter's new value to determine what data to display. Ifyou change only the operator in a filter, you must deselect the value in that filter, then reselect it toapply the updated filter.
For filters with multiple values, you do not need to reselect all values. After changing the operator, useCtrl-click to deselect just one of the values, then Ctrl-click to reselect that value.
4.7.1.1 Relative Dates
You can filter information in your view based on a date range relative to the current system date. Youcan accomplish this using date-based filters, and entering a text expression describing the relative dateor date span you want to display, using the format <Keyword>+/-<Number>.
• Keyword indicates the time span you want to use. Options include: DAY, WEEK, QUARTER,SEMI, and YEAR.
106
Chapter 4 Working with the Ad Hoc Editor
• + or - indicates whether the time span occurs before or after the chosen date.
• Number indicates the number of the above-mentioned time spans you want to include in the filter.
For example, if you want to look at all Sales for the prior week, your expression would be: WEEK-1.
To create a relative date filter:
1. Following the instructions in “Using Filters” on page 105, create a filter based on a date field.The filter appears in the Filters panel.
2. In the filter’s first text entry box, enter an expression describing the relative date or date span youwant to display.
3. In the filter’s second text entry box, enter the date you want to base your filter on.
For instance, if you want to display all the sales numbers for the month prior to the current date,the expression in the first text entry box would say MONTH-1, and in the second box you wouldenter today’s date.
When you right-click a group member in a crosstab and select Keep Only or Exclude, you createcomplex filters. When you create a filter against an inner group, the filter that appears may becreated as a complex filter; a complex filter can’t be edited but it can be removed. Complex filtersalso appear in the Ad Hoc Editor if a Data Chooser wizard filter was created and locked.
4.7.1.2 Advanced Filtering
When you create multiple filters, they are, by default, connected with an implicit AND operator; thatis, the data displayed in your table, chart, or crosstab is what remains after all your filters are applied.
However, with the advanced filter functionality, you can exercise greater control over the displayeddata by applying an advanced expression that includes more complex, nested AND, OR, and NOToperators, as well as by applying multiple filters to a single field.
Advanced filters are not available for Ad Hoc views created from OLAP connections.
Advanced filters are useful in a number of situations, including:
• When using the AND operator isn’t sufficient. Consider an international company that wants toview data for stores located on the Pacific Rim; they may create an advanced expression with thefollowing criteria:
• Country is USA
AND
• State is California OR Washington OR Oregon OR Hawaii OR Alaska.
OR
• Country is Japan OR Indonesia
Using the AND operator for all of these criteria returns an empty view, as no store is located in allof those areas.
• When you need to eliminate some results in a field. For example, if your food and beveragedistribution company wants to view sales for all drinks except for high-price items, you mightinclude the following criteria in an advanced expression:
• Product Group is Beverages
107
JasperReports Server User Guide
NOT
• Price is greater than 39.99
This filter displays all items in the Beverage Product Group, but filters out those with prices over$39.99
These are only two scenarios where advanced filters can hone your results and make your view moreprecise. There are, of course, many other situations where they can be applied.
In this section, we take you through these tasks:
• Creating an advanced expression
• Editing an advanced expression
• Removing an advanced expression
• Applying multiple filters to a single field
Advanced filters are applied to views, but filter details don’t appear on previews, or on the reportgenerated from that view.
To create and apply an advanced filter:
1. Create two or more filters for your data, as described in “Using Filters” on page 105. These can bestandard field-based filters, or Keep Only and Exclude filters.
Note that, as you create the filters for use in an advanced expression, you may find that the data inyour view disappears, since most (if not all) of the data won’t meet all of the filter criteria. Whenyou create your advanced expression and change some of the ANDs to ORs and NOTs, datareappears in the panel.
2. At the top of the Filters panel, click in the upper right-corner and select Show Expression todisplay the Filter Expression, for pane. The Filter Expression, for pane is empty by default.
3. In the Filter Expression, for pane, click the Edit button. The Edit Advanced Filters dialogappears.
4. In the Edit Advanced Filters dialog, use the filter preview window to locate the filters, and notethe letter designations they have been given.
Filter letter designations are case sensitive, and must be CAPITALIZED.
5. Enter a filter expression using the letter designations, and including the following operators:
• AND narrows your results and includes only fields that meet the criteria of both filters beforeand after the operator.
• OR broadens your results and includes fields that meet the criteria of either filter before or afterthe operator.
• NOT excludes results that match the criteria.
• Parentheses combines multiple filters into a single item in the expression.
6. Check your expression by clicking the Validate button. If your expression works with the availablefilters, you receive a green “Success” validation message; an incorrect expression receives a redinvalid message with a brief description of the problem.
108
Chapter 4 Working with the Ad Hoc Editor
7. When your expression is validated successfully, click Submit. Your view is updated to reflect thenewly-applied filter criteria.
After creating an advanced filter, you may want to add another filter to the expression, or remove onealready included in the expression.
If the simple filter you want to delete is part of an advanced filter, you must first remove it fromthe advanced filter expression; otherwise, deleting the filter deletes the advanced filterexpression.
To add a new filter to an existing advanced expression:
1. If necessary, create the new filter in the Filter panel.
2. In the Filter Expression, for pane, click Edit to open the Edit Advanced Filters dialog.
3. In the Edit Advanced Filters dialog, add the new filter to the expression. Any unused filters appearin the filter preview window highlighted in gray.
4. Click Validate to check the integrity of the new expression.
5. When your expression is validated successfully, click Submit.
To remove a filter from an advanced expression:
1. In the Filter Expression, for pane, click Edit to open the Edit Advanced Filters dialog.
2. In the Edit Advanced Filters dialog, remove the unwanted filter from the expression, and adjust theexpression as needed.
3. Click Validate to check the integrity of the new expression.
4. When your expression is validated successfully, click Submit.
When working with advanced expressions, you may decide to delete an expression and create a newone.
To remove an advanced expression from a view:
1. In the Filter Expression, for pane, click Edit to open the Edit Advanced Filters dialog.
2. Clear the expression from the Filter Expression text box.
3. Click Submit. The expression is removed, leaving the remaining filters intact.
When you refine your advanced expression, you may also want to delete unused filters from the Filterspanel.
• If the filter you want to remove isn’t part of the advanced filter, hover your mouse over in thefilter’s title bar and select Remove Filter.
• If you want to remove all existing filters, including the advanced expression, hover your mouseover in the upper right corner of the Filters panhandle select Remove All Filters.
You can apply multiple simple filters to a single field, if needed, to further refine your advanced filterresults. For example, a user may want to view the data in the Shipping Cost field, but only when itmeets certain criteria combinations:
• When shipping costs to French cities with postal codes that begin with the number 5 are under fiveEuros
109
JasperReports Server User Guide
• When shipping costs to German cities with postal codes that begin with the number 1 are underfive Euros
You can recreate the scenario below using the demo for adhoc topic.
In the following example a user has a table including the following columns:
• Country
• Postal Code
• Shipping Charge
To analyze the specific shipping costs described above, the user creates the following (simple) filters -including two filters each for the Country and Postal code fields:
• A. Country equals France
• B. Postal code starts with 5
• C. Country equals Germany
• D. Postal code starts with 1
• E. Shipping Charge is less than 5
Then, to display only the information she needs, she creates the following advanced expression:
• ((A and B) or (C and D)) and E
This translates to:
• ((FRANCE and POSTAL CODES THAT START WITH 5) or (GERMANY and POSTAL CODESTHAT START WITH 1)) and SHIPPING CHARGES LESS THAN 5 EUROS.
4.7.2 Using Input ControlsIn the Ad Hoc Editor, you can display the input controls defined in the Topic as visible to users. Youcan accept the controls’ default values or enter other values. The Ad Hoc Editor indicates that the view
has input controls by displaying as active on the tool bar. Click this icon to select new values or tosave values as the new defaults for this view. The following procedure steps through these tasks.
To add an input control to the view using a filter:
1. Create a new filter, or use an existing one in the Filters panel.
2. In Filters, click beside the new filter, and select Show Operator.The filter’s operator appears in a drop-down.
3. Select an operator from the drop-down and enter the in the text box below the drop-down.
The filter appears as an input control when the view is used to run the report.
4. Place your cursor over , select Save Ad Hoc View as....5. Name the view, select a location, and click Save.
6. On the tool bar, click .
110
Chapter 4 Working with the Ad Hoc Editor
Only the input controls defined in the topic appear here. Again, if no input controls were definedin the topic, the button appears inactive. You can create a report and open it in the report viewer tosee a filter listed as an input control.
To edit the values for a view’s input controls:
1. On the tool bar, click .
A window listing the input controls defined in the Topic appears.
The Parameterized Report Topic already includes three input controls, created when the reportwas uploaded: Country, RequestDate, and OrderId.
2. Select new values. For example, select USA from the Country drop-down.
3. To change default values of input controls, select the check box, Set these values as defaultswhen saving your view.
The selected values become the default values when you save the view.
4. Click OK.
The Ad Hoc view shows USA data.
4.7.3 Input Controls and Filters AvailabilityInput controls and filters can appear in the Editor and when a report runs:
• Input controls can be set to be visible or invisible when you edit a view:
• Input controls set to Always prompt are displayed in the editor and always appear before thereport is run.
• Input controls that aren’t set to Always prompt are always hidden in the editor and hiddenwhen the report is run.
• Filters defined in the Domain design are always hidden in the editor and when the report is run.
• Filters created in the Data Chooser wizard can be locked or unlocked:
• Filters that are unlocked display filter information in the editor and are available from theOptions button when the report is run.
• Filters that are locked display input controls in the editor when you click to see the viewin display mode but are not available from the Options button when the report is run. Userscan remove the filter while in the editor, allowing them to see all the data unfiltered when thereport is run.
• You can’t change whether the filter is displayed after the report is created.
• Filters defined in the editor are always available in the Filters panel of the editor and from theOptions button when the report is run.
When setting up input controls for a huge view that takes a long time to run, consider setting the viewto Always prompt. Before a report is run, the report viewer prompts you to provide the input options,preventing the report from running using the default input options.
111
JasperReports Server User Guide
Filters that are unlocked are available. When input controls or filters don’t appear in the report viewer,click the Options button to view them. You can learn more about how filters and input controlsinteract in the editor by walking through the data exploration tutorial with the Filters panel open.
To set an input control to always prompt:
1. Locate a Topic, such as the Parameterized Report Topic, in the repository and click Edit.
2. On the Controls & Resources page of the JasperReport wizard, under Input Control Options, selectAlways prompt:
To determine whether an input control is visible:
1. Locate a Topic, such as the Parameterized Report Topic, in the repository and click Edit.
2. On the Controls & Resources page, click the name of an input control, such as Country.
3. On the Locate Input Control page, click Next.
At the bottom of the Create Input Control page, if the Visible check box is selected, the inputcontrol appears on the report when it runs. For more information, see “Adding Input Controls” onpage 138.
If you don’t provide a default value for the input control, users are prompted to select a valuewhen they create a view based on the Topic.
To lock a filter:
1. Click Create > Ad Hoc View.
2. In the Data Chooser wizard, click Domains to create a new view based on a Domain.
3. Click Choose Data.
4. In Fields, move tables and fields from Source to Selected Fields.
5. Click Pre-filters.
6. Double-click a field in the Fields panel.
7. In the Filters panel, define a filter as described in “The Pre-filters Page” on page 114.
8. Check the Locked check box, and click OK.
9. Click Table to open the Ad Hoc Editor.
In the Filters panel, the name of the filter and a note about the lock appears under the headingLocked.
4.8 Creating a View from a DomainLike Topics and OLAP connections, administrators and data analysts create Domains for reuse tosimplify access to data during view design. Domains give view makers more flexibility than Topics inchoosing fields from the database and allow filtering of the data before it is included in a view and thesubsequent report.
A view based on a Domain can prompt the user for input that determines what data is presented. Forexample, if a Domain includes all sales data for a company, the view can present detailed information
112
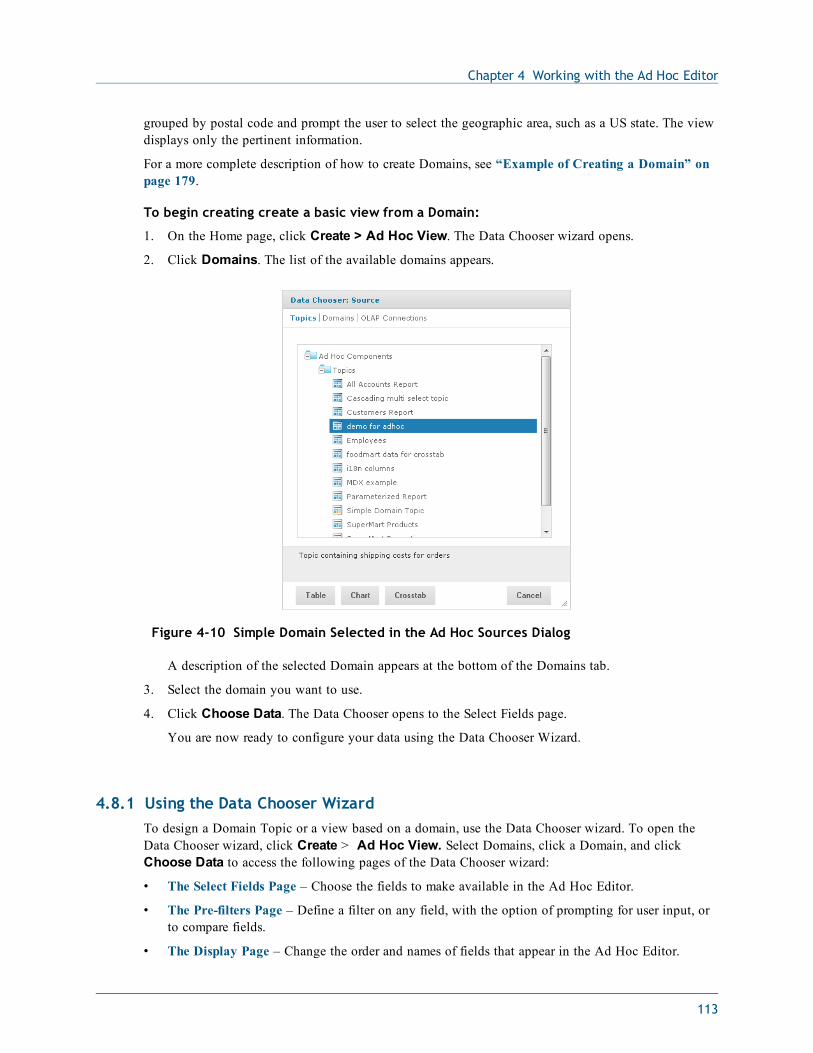
Chapter 4 Working with the Ad Hoc Editor
grouped by postal code and prompt the user to select the geographic area, such as a US state. The viewdisplays only the pertinent information.
For a more complete description of how to create Domains, see “Example of Creating a Domain” onpage 179.
To begin creating create a basic view from a Domain:
1. On the Home page, click Create > Ad Hoc View. The Data Chooser wizard opens.
2. Click Domains. The list of the available domains appears.
Figure 4-10 Simple Domain Selected in the Ad Hoc Sources Dialog
A description of the selected Domain appears at the bottom of the Domains tab.
3. Select the domain you want to use.
4. Click Choose Data. The Data Chooser opens to the Select Fields page.
You are now ready to configure your data using the Data Chooser Wizard.
4.8.1 Using the Data Chooser WizardTo design a Domain Topic or a view based on a domain, use the Data Chooser wizard. To open theData Chooser wizard, click Create > Ad Hoc View. Select Domains, click a Domain, and clickChoose Data to access the following pages of the Data Chooser wizard:
• The Select Fields Page – Choose the fields to make available in the Ad Hoc Editor.
• The Pre-filters Page – Define a filter on any field, with the option of prompting for user input, orto compare fields.
• The Display Page – Change the order and names of fields that appear in the Ad Hoc Editor.
113
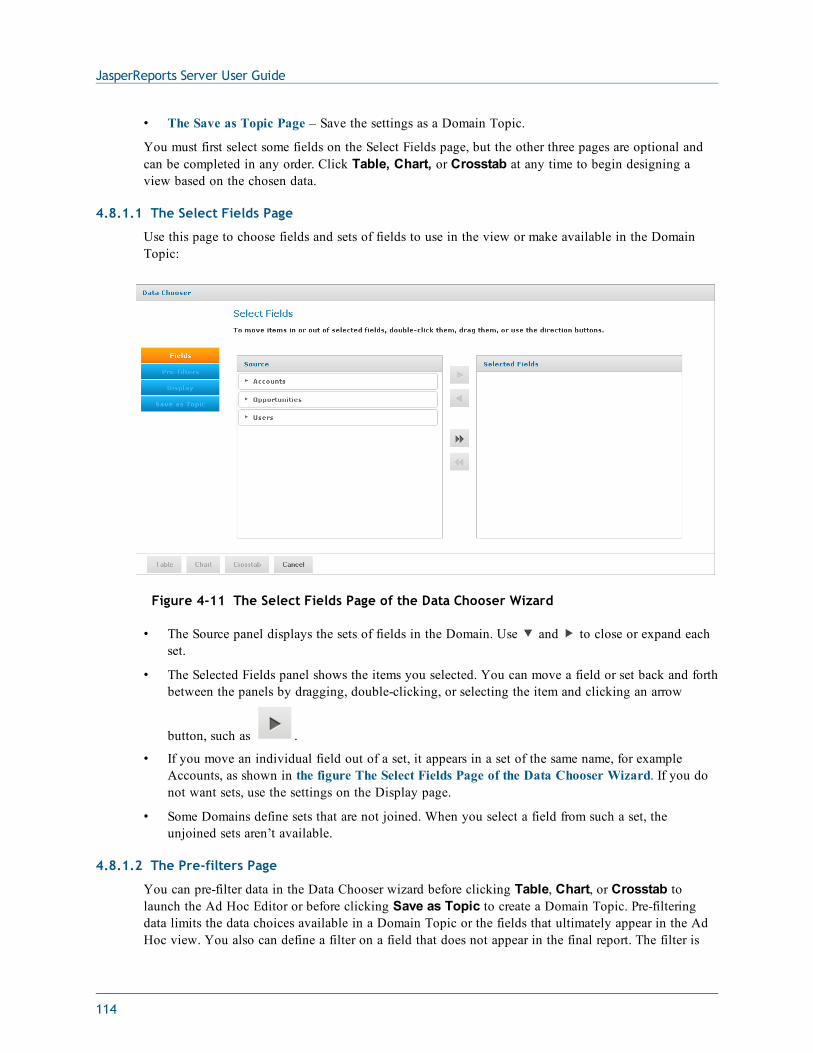
JasperReports Server User Guide
• The Save as Topic Page – Save the settings as a Domain Topic.
You must first select some fields on the Select Fields page, but the other three pages are optional andcan be completed in any order. Click Table, Chart, or Crosstab at any time to begin designing aview based on the chosen data.
4.8.1.1 The Select Fields Page
Use this page to choose fields and sets of fields to use in the view or make available in the DomainTopic:
Figure 4-11 The Select Fields Page of the Data Chooser Wizard
• The Source panel displays the sets of fields in the Domain. Use and to close or expand eachset.
• The Selected Fields panel shows the items you selected. You can move a field or set back and forthbetween the panels by dragging, double-clicking, or selecting the item and clicking an arrow
button, such as .
• If you move an individual field out of a set, it appears in a set of the same name, for exampleAccounts, as shown in the figure The Select Fields Page of the Data Chooser Wizard. If you donot want sets, use the settings on the Display page.
• Some Domains define sets that are not joined. When you select a field from such a set, theunjoined sets aren’t available.
4.8.1.2 The Pre-filters Page
You can pre-filter data in the Data Chooser wizard before clicking Table, Chart, or Crosstab tolaunch the Ad Hoc Editor or before clicking Save as Topic to create a Domain Topic. Pre-filteringdata limits the data choices available in a Domain Topic or the fields that ultimately appear in the AdHoc view. You also can define a filter on a field that does not appear in the final report. The filter is
114
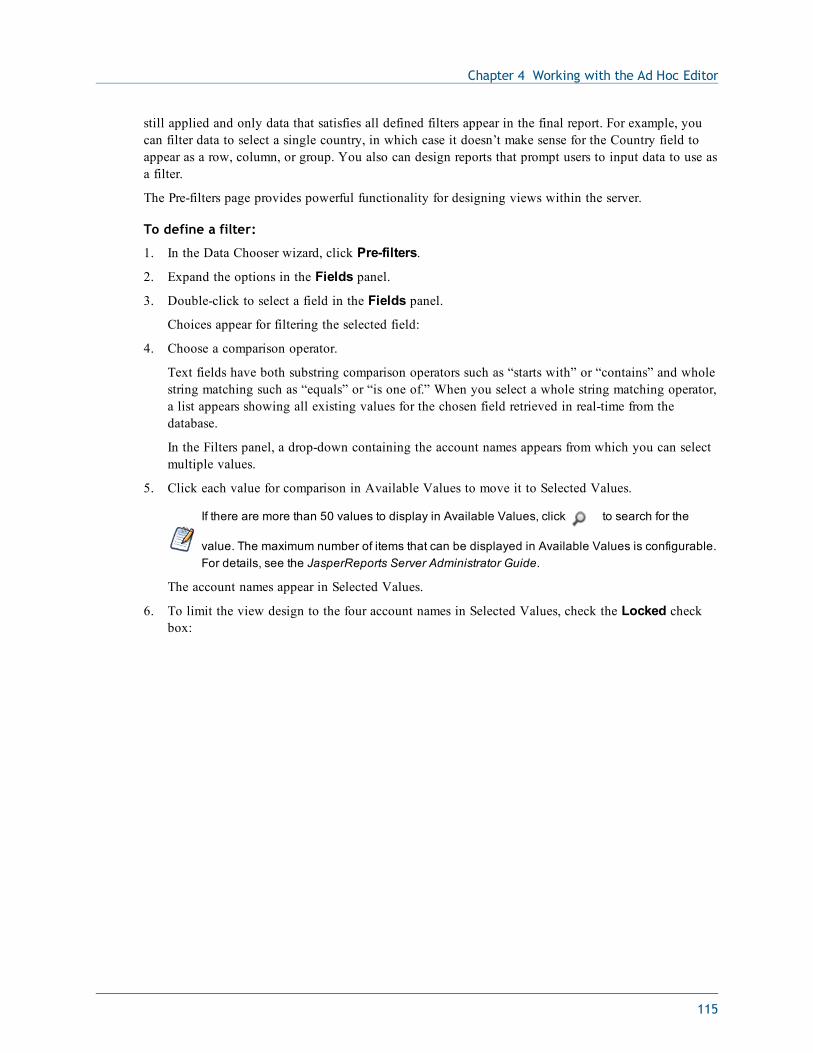
Chapter 4 Working with the Ad Hoc Editor
still applied and only data that satisfies all defined filters appear in the final report. For example, youcan filter data to select a single country, in which case it doesn’t make sense for the Country field toappear as a row, column, or group. You also can design reports that prompt users to input data to use asa filter.
The Pre-filters page provides powerful functionality for designing views within the server.
To define a filter:
1. In the Data Chooser wizard, click Pre-filters.
2. Expand the options in the Fields panel.
3. Double-click to select a field in the Fields panel.
Choices appear for filtering the selected field:
4. Choose a comparison operator.
Text fields have both substring comparison operators such as “starts with” or “contains” and wholestring matching such as “equals” or “is one of.” When you select a whole string matching operator,a list appears showing all existing values for the chosen field retrieved in real-time from thedatabase.
In the Filters panel, a drop-down containing the account names appears from which you can selectmultiple values.
5. Click each value for comparison in Available Values to move it to Selected Values.
If there are more than 50 values to display in Available Values, click to search for the
value. The maximum number of items that can be displayed in Available Values is configurable.For details, see the JasperReports Server Administrator Guide.
The account names appear in Selected Values.
6. To limit the view design to the four account names in Selected Values, check the Locked checkbox:
115
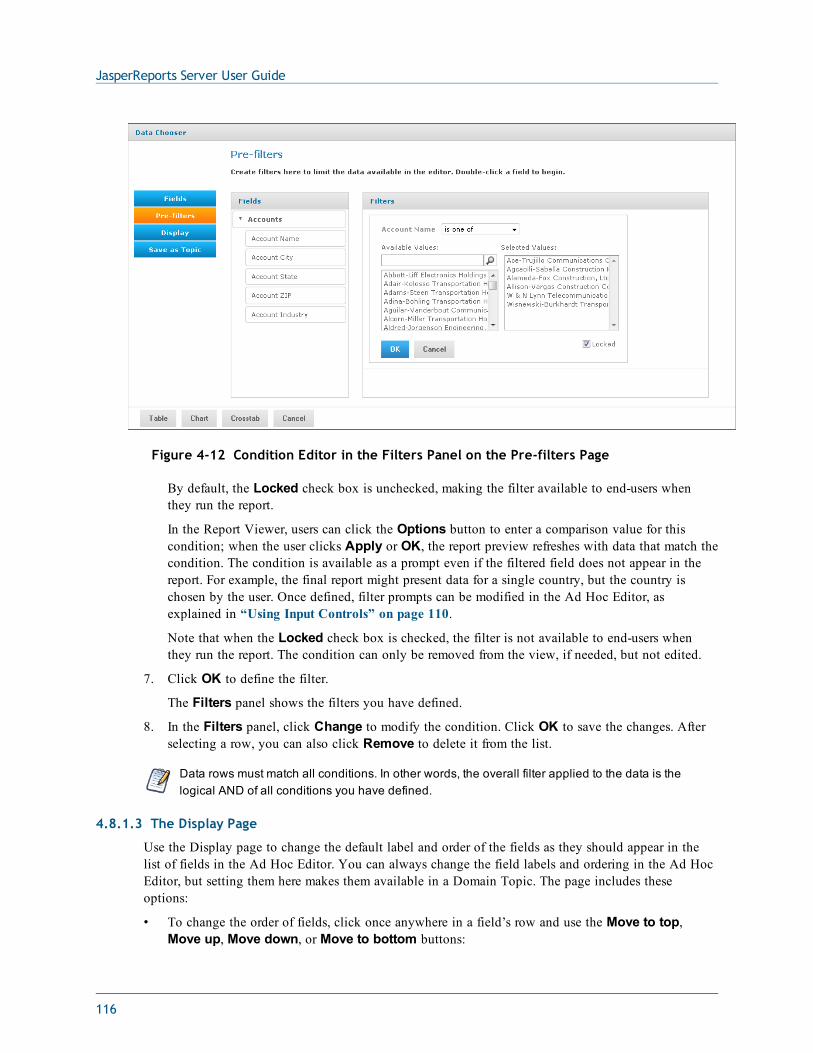
JasperReports Server User Guide
Figure 4-12 Condition Editor in the Filters Panel on the Pre-filters Page
By default, the Locked check box is unchecked, making the filter available to end-users whenthey run the report.
In the Report Viewer, users can click the Options button to enter a comparison value for thiscondition; when the user clicks Apply or OK, the report preview refreshes with data that match thecondition. The condition is available as a prompt even if the filtered field does not appear in thereport. For example, the final report might present data for a single country, but the country ischosen by the user. Once defined, filter prompts can be modified in the Ad Hoc Editor, asexplained in “Using Input Controls” on page 110.
Note that when the Locked check box is checked, the filter is not available to end-users whenthey run the report. The condition can only be removed from the view, if needed, but not edited.
7. Click OK to define the filter.
The Filters panel shows the filters you have defined.
8. In the Filters panel, click Change to modify the condition. Click OK to save the changes. Afterselecting a row, you can also click Remove to delete it from the list.
Data rows must match all conditions. In other words, the overall filter applied to the data is thelogical AND of all conditions you have defined.
4.8.1.3 The Display Page
Use the Display page to change the default label and order of the fields as they should appear in thelist of fields in the Ad Hoc Editor. You can always change the field labels and ordering in the Ad HocEditor, but setting them here makes them available in a Domain Topic. The page includes theseoptions:
• To change the order of fields, click once anywhere in a field’s row and use the Move to top,Move up, Move down, or Move to bottom buttons:
116
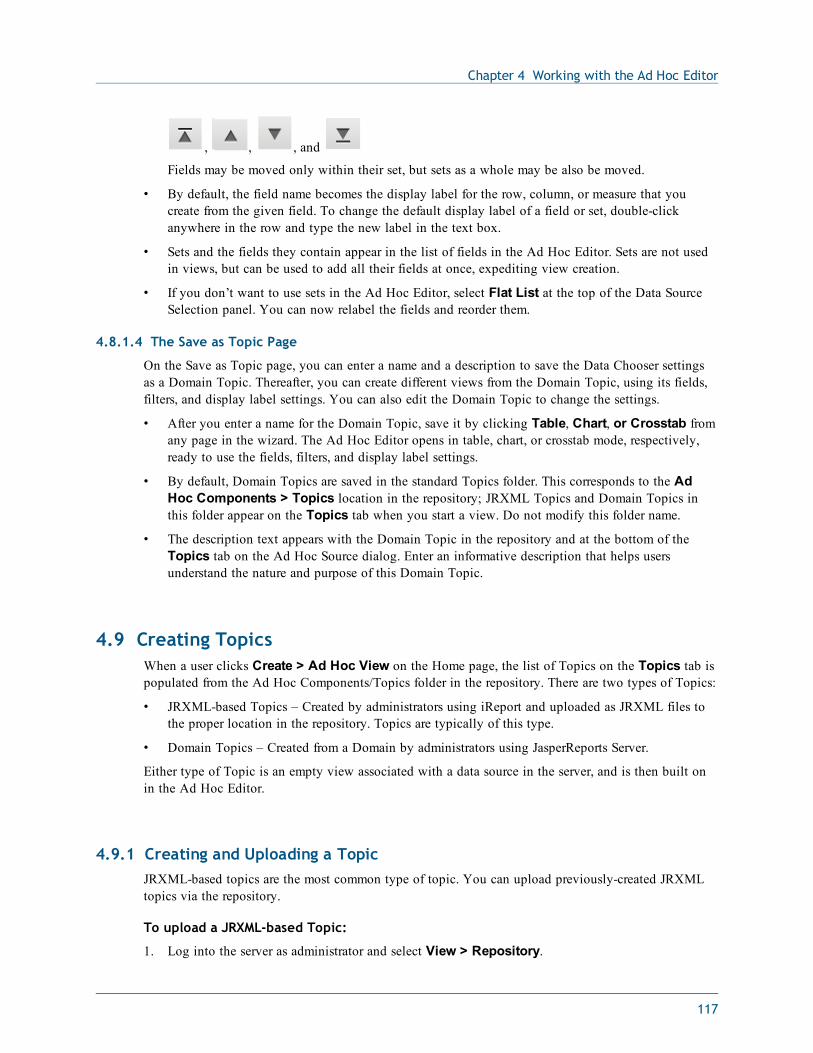
Chapter 4 Working with the Ad Hoc Editor
, , , and
Fields may be moved only within their set, but sets as a whole may be also be moved.
• By default, the field name becomes the display label for the row, column, or measure that youcreate from the given field. To change the default display label of a field or set, double-clickanywhere in the row and type the new label in the text box.
• Sets and the fields they contain appear in the list of fields in the Ad Hoc Editor. Sets are not usedin views, but can be used to add all their fields at once, expediting view creation.
• If you don’t want to use sets in the Ad Hoc Editor, select Flat List at the top of the Data SourceSelection panel. You can now relabel the fields and reorder them.
4.8.1.4 The Save as Topic Page
On the Save as Topic page, you can enter a name and a description to save the Data Chooser settingsas a Domain Topic. Thereafter, you can create different views from the Domain Topic, using its fields,filters, and display label settings. You can also edit the Domain Topic to change the settings.
• After you enter a name for the Domain Topic, save it by clicking Table, Chart, or Crosstab fromany page in the wizard. The Ad Hoc Editor opens in table, chart, or crosstab mode, respectively,ready to use the fields, filters, and display label settings.
• By default, Domain Topics are saved in the standard Topics folder. This corresponds to the AdHoc Components > Topics location in the repository; JRXML Topics and Domain Topics inthis folder appear on the Topics tab when you start a view. Do not modify this folder name.
• The description text appears with the Domain Topic in the repository and at the bottom of theTopics tab on the Ad Hoc Source dialog. Enter an informative description that helps usersunderstand the nature and purpose of this Domain Topic.
4.9 Creating TopicsWhen a user clicks Create > Ad Hoc View on the Home page, the list of Topics on the Topics tab ispopulated from the Ad Hoc Components/Topics folder in the repository. There are two types of Topics:
• JRXML-based Topics – Created by administrators using iReport and uploaded as JRXML files tothe proper location in the repository. Topics are typically of this type.
• Domain Topics – Created from a Domain by administrators using JasperReports Server.
Either type of Topic is an empty view associated with a data source in the server, and is then built onin the Ad Hoc Editor.
4.9.1 Creating and Uploading a TopicJRXML-based topics are the most common type of topic. You can upload previously-created JRXMLtopics via the repository.
To upload a JRXML-based Topic:
1. Log into the server as administrator and select View > Repository.
117
JasperReports Server User Guide
While any user with sufficient repository permissions can upload a Topic to the server, thisexample requires an administrator login to access the JServer Jdbc data source.
2. Locate the folder where Topics are stored. The location of the Topics folder depends on yoursystem configuration; by default, Topics are in the Ad Hoc Components > Topics folder.
3. Right-click the Topics folder and select Add Resource > JasperReport from the context menu.
Add Resource appears on the context menu only if your login account has write privilege to thefolder.
After selecting Add Resource > JasperReport, the Set Up the Report page of the JasperReportwizard appears.
4. In the Set Up the Report page, give the Topic a name, a Resource ID, and an optional description,then click Next.
• The Name field is the visible name of the file in the repository, such as Example Topic.
• The Resource ID field is the internal ID of the object, such as Example_Topic. The serverdoes not accept spaces in an internal ID.
• The Description field, such as Topic uploaded for User Guide example, helps usersunderstand the purpose of the file.
5. In the Locate the JRXML File section, select Upload a Local File, and click Browse to locatethe file and upload the Topic from the file system. In this example, the file is <js-install>/samples/adhoc/topics/adhoc_sample.jrxml.
To locate adhoc_sample.jrxml, you need access to the server host file system.
6. Click Data Source.
Because this is a simple Topic without parameters, there are no controls and resourcesassociated with it. If the Topic has a Parameterized query, you can create input controls for it.See “Selecting a Data Source for Running the Complex Report” on page 149. Such inputcontrols can appear in the Ad Hoc Editor and when the report is run.
7. Click Select data source from repository and Browse to locate the data source named DataSources/JServer Jdbc data source.
Topics must be associated with the data source that they were designed for.
8. Click Next.
9. In Locate Query, click Submit.
Topics usually do not need a query or customization, but you can define them.
When you select Create > Ad Hoc View, the Example Topic appears on the Topics tab of the DataChooser wizard. If you select the Example Topic, you can create a report using the columns availablein the data source selected in step 7.
When you create a JRXML file for use as a Topic, you can specify the name to display for each fieldthat the Topic returns. To do so, define a field property named adhoc.display for each field declaredin the JRXML. The adhoc.display field property must have the following syntax:<property name=”adhoc.display” value=”Any Name”/>
For example, this JRXML code declares a StoreState field that is displayed in reports as Store State:
118
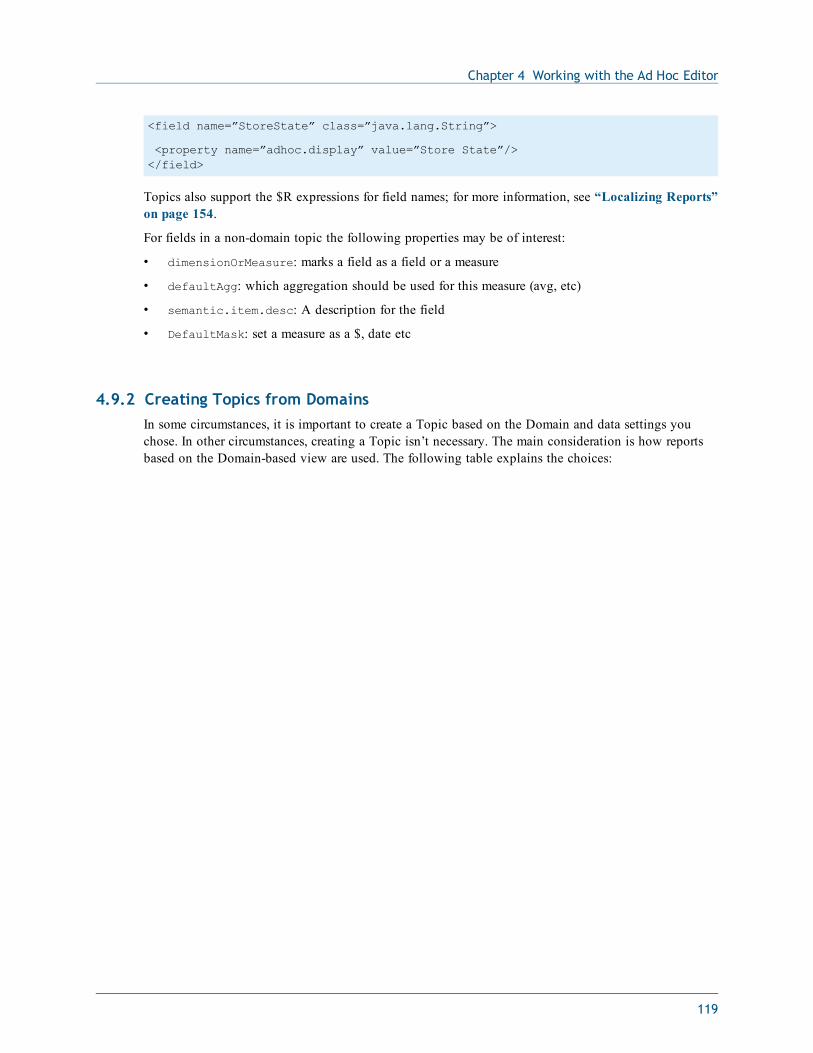
Chapter 4 Working with the Ad Hoc Editor
<field name=”StoreState” class=”java.lang.String”>
<property name=”adhoc.display” value=”Store State”/></field>
Topics also support the $R expressions for field names; for more information, see “Localizing Reports”on page 154.
For fields in a non-domain topic the following properties may be of interest:
• dimensionOrMeasure: marks a field as a field or a measure
• defaultAgg: which aggregation should be used for this measure (avg, etc)
• semantic.item.desc: A description for the field
• DefaultMask: set a measure as a $, date etc
4.9.2 Creating Topics from DomainsIn some circumstances, it is important to create a Topic based on the Domain and data settings youchose. In other circumstances, creating a Topic isn’t necessary. The main consideration is how reportsbased on the Domain-based view are used. The following table explains the choices:
119
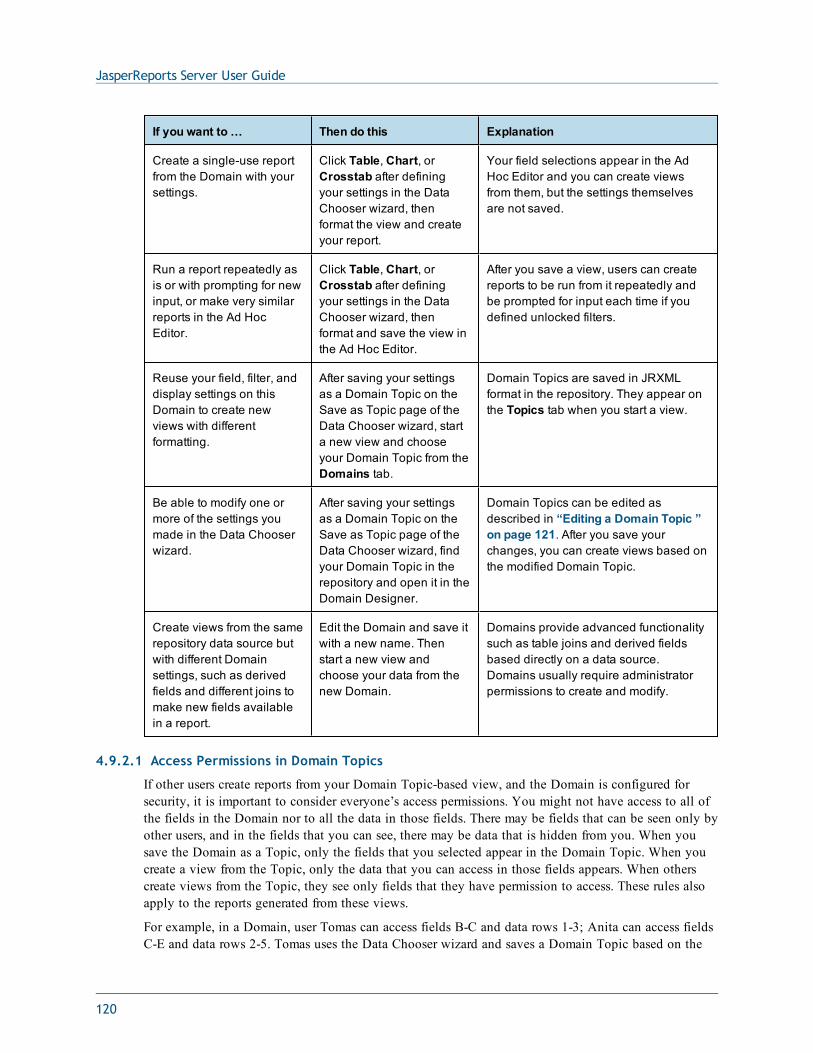
JasperReports Server User Guide
If you want to… Then do this Explanation
Create a single-use reportfrom the Domain with yoursettings.
Click Table, Chart, orCrosstab after definingyour settings in the DataChooser wizard, thenformat the view and createyour report.
Your field selections appear in the AdHoc Editor and you can create viewsfrom them, but the settings themselvesare not saved.
Run a report repeatedly asis or with prompting for newinput, or make very similarreports in the Ad HocEditor.
Click Table, Chart, orCrosstab after definingyour settings in the DataChooser wizard, thenformat and save the view inthe Ad Hoc Editor.
After you save a view, users can createreports to be run from it repeatedly andbe prompted for input each time if youdefined unlocked filters.
Reuse your field, filter, anddisplay settings on thisDomain to create newviews with differentformatting.
After saving your settingsas a Domain Topic on theSave as Topic page of theData Chooser wizard, starta new view and chooseyour Domain Topic from theDomains tab.
Domain Topics are saved in JRXMLformat in the repository. They appear onthe Topics tab when you start a view.
Be able to modify one ormore of the settings youmade in the Data Chooserwizard.
After saving your settingsas a Domain Topic on theSave as Topic page of theData Chooser wizard, findyour Domain Topic in therepository and open it in theDomain Designer.
Domain Topics can be edited asdescribed in “Editing a Domain Topic ”on page 121. After you save yourchanges, you can create views based onthe modified Domain Topic.
Create views from the samerepository data source butwith different Domainsettings, such as derivedfields and different joins tomake new fields availablein a report.
Edit the Domain and save itwith a new name. Thenstart a new view andchoose your data from thenew Domain.
Domains provide advanced functionalitysuch as table joins and derived fieldsbased directly on a data source.Domains usually require administratorpermissions to create and modify.
4.9.2.1 Access Permissions in Domain Topics
If other users create reports from your Domain Topic-based view, and the Domain is configured forsecurity, it is important to consider everyone’s access permissions. You might not have access to all ofthe fields in the Domain nor to all the data in those fields. There may be fields that can be seen only byother users, and in the fields that you can see, there may be data that is hidden from you. When yousave the Domain as a Topic, only the fields that you selected appear in the Domain Topic. When youcreate a view from the Topic, only the data that you can access in those fields appears. When otherscreate views from the Topic, they see only fields that they have permission to access. These rules alsoapply to the reports generated from these views.
For example, in a Domain, user Tomas can access fields B-C and data rows 1-3; Anita can access fieldsC-E and data rows 2-5. Tomas uses the Data Chooser wizard and saves a Domain Topic based on the
120
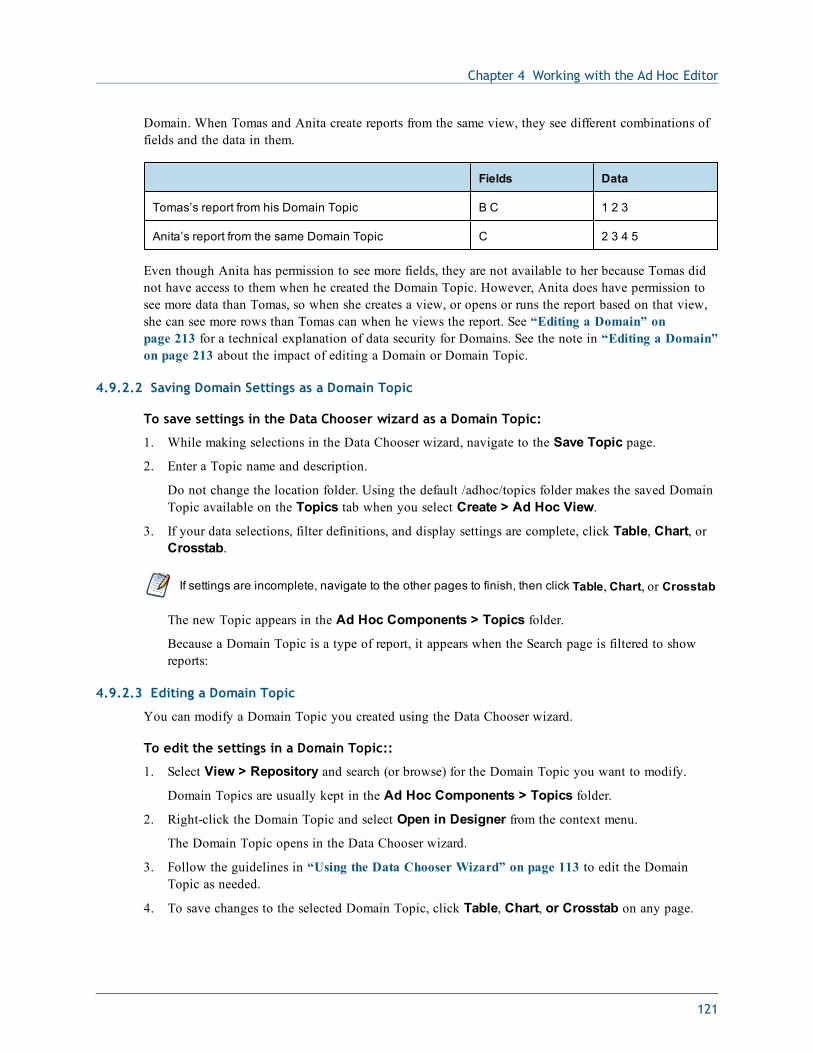
Chapter 4 Working with the Ad Hoc Editor
Domain. When Tomas and Anita create reports from the same view, they see different combinations offields and the data in them.
Fields Data
Tomas’s report from his Domain Topic B C 1 2 3
Anita’s report from the same Domain Topic C 2 3 4 5
Even though Anita has permission to see more fields, they are not available to her because Tomas didnot have access to them when he created the Domain Topic. However, Anita does have permission tosee more data than Tomas, so when she creates a view, or opens or runs the report based on that view,she can see more rows than Tomas can when he views the report. See “Editing a Domain” onpage 213 for a technical explanation of data security for Domains. See the note in “Editing a Domain”on page 213 about the impact of editing a Domain or Domain Topic.
4.9.2.2 Saving Domain Settings as a Domain Topic
To save settings in the Data Chooser wizard as a Domain Topic:
1. While making selections in the Data Chooser wizard, navigate to the Save Topic page.
2. Enter a Topic name and description.
Do not change the location folder. Using the default /adhoc/topics folder makes the saved DomainTopic available on the Topics tab when you select Create > Ad Hoc View.
3. If your data selections, filter definitions, and display settings are complete, click Table, Chart, orCrosstab.
If settings are incomplete, navigate to the other pages to finish, then click Table, Chart, or Crosstab
The new Topic appears in the Ad Hoc Components > Topics folder.
Because a Domain Topic is a type of report, it appears when the Search page is filtered to showreports:
4.9.2.3 Editing a Domain Topic
You can modify a Domain Topic you created using the Data Chooser wizard.
To edit the settings in a Domain Topic::
1. Select View > Repository and search (or browse) for the Domain Topic you want to modify.
Domain Topics are usually kept in the Ad Hoc Components > Topics folder.
2. Right-click the Domain Topic and select Open in Designer from the context menu.
The Domain Topic opens in the Data Chooser wizard.
3. Follow the guidelines in “Using the Data Chooser Wizard” on page 113 to edit the DomainTopic as needed.
4. To save changes to the selected Domain Topic, click Table, Chart, or Crosstab on any page.
121

JasperReports Server User Guide
Use caution when editing Domain Topics that may have been used to create other views. Userswho relied on the Domain Topic might receive unexpected data or errors. It is safer to save changesas a new Domain Topic.
To save changes as a new Domain Topic, navigate to the Save as Topic page and enter identifyinginformation for the new Topic, then click Table, Chart, or Crosstab.
122
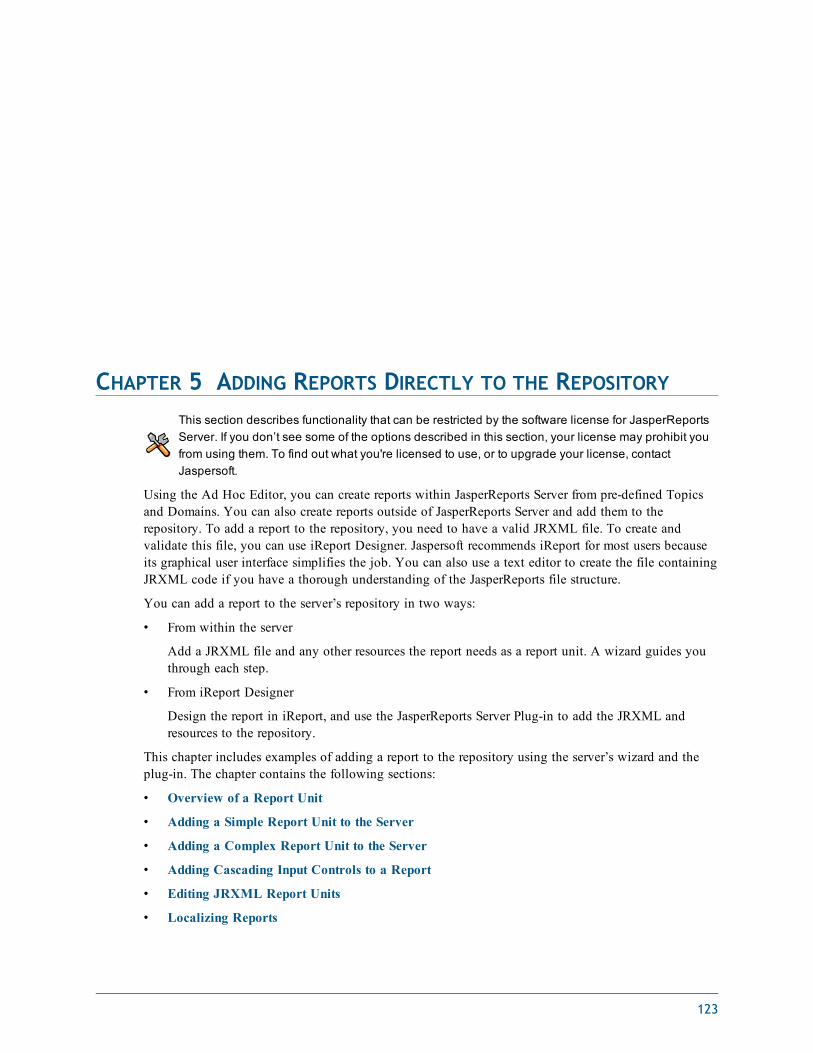
CHAPTER 5 ADDING REPORTS DIRECTLY TO THE REPOSITORYThis section describes functionality that can be restricted by the software license for JasperReportsServer. If you don’t see some of the options described in this section, your license may prohibit youfrom using them. To find out what you're licensed to use, or to upgrade your license, contactJaspersoft.
Using the Ad Hoc Editor, you can create reports within JasperReports Server from pre-defined Topicsand Domains. You can also create reports outside of JasperReports Server and add them to therepository. To add a report to the repository, you need to have a valid JRXML file. To create andvalidate this file, you can use iReport Designer. Jaspersoft recommends iReport for most users becauseits graphical user interface simplifies the job. You can also use a text editor to create the file containingJRXML code if you have a thorough understanding of the JasperReports file structure.
You can add a report to the server’s repository in two ways:
• From within the server
Add a JRXML file and any other resources the report needs as a report unit. A wizard guides youthrough each step.
• From iReport Designer
Design the report in iReport, and use the JasperReports Server Plug-in to add the JRXML andresources to the repository.
This chapter includes examples of adding a report to the repository using the server’s wizard and theplug-in. The chapter contains the following sections:
• Overview of a Report Unit
• Adding a Simple Report Unit to the Server
• Adding a Complex Report Unit to the Server
• Adding Cascading Input Controls to a Report
• Editing JRXML Report Units
• Localizing Reports
123
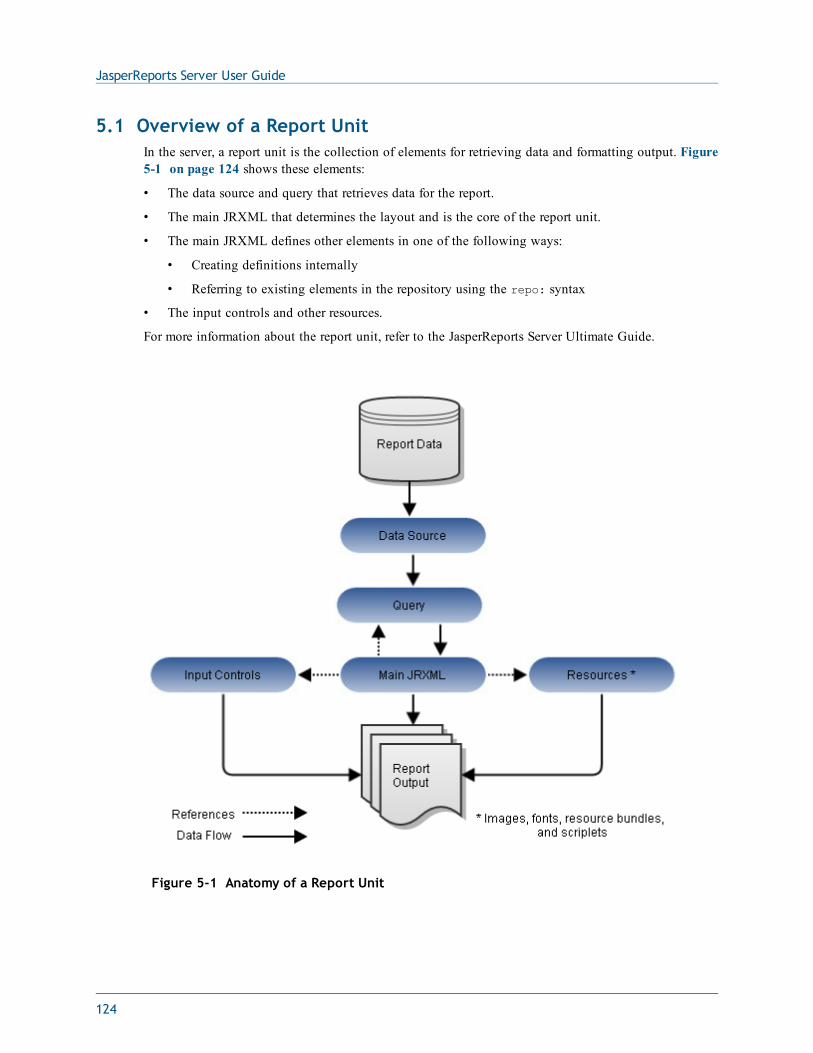
JasperReports Server User Guide
5.1 Overview of a Report UnitIn the server, a report unit is the collection of elements for retrieving data and formatting output. Figure5-1 on page 124 shows these elements:
• The data source and query that retrieves data for the report.
• The main JRXML that determines the layout and is the core of the report unit.
• The main JRXML defines other elements in one of the following ways:
• Creating definitions internally
• Referring to existing elements in the repository using the repo: syntax
• The input controls and other resources.
For more information about the report unit, refer to the JasperReports Server Ultimate Guide.
Figure 5-1 Anatomy of a Report Unit
124
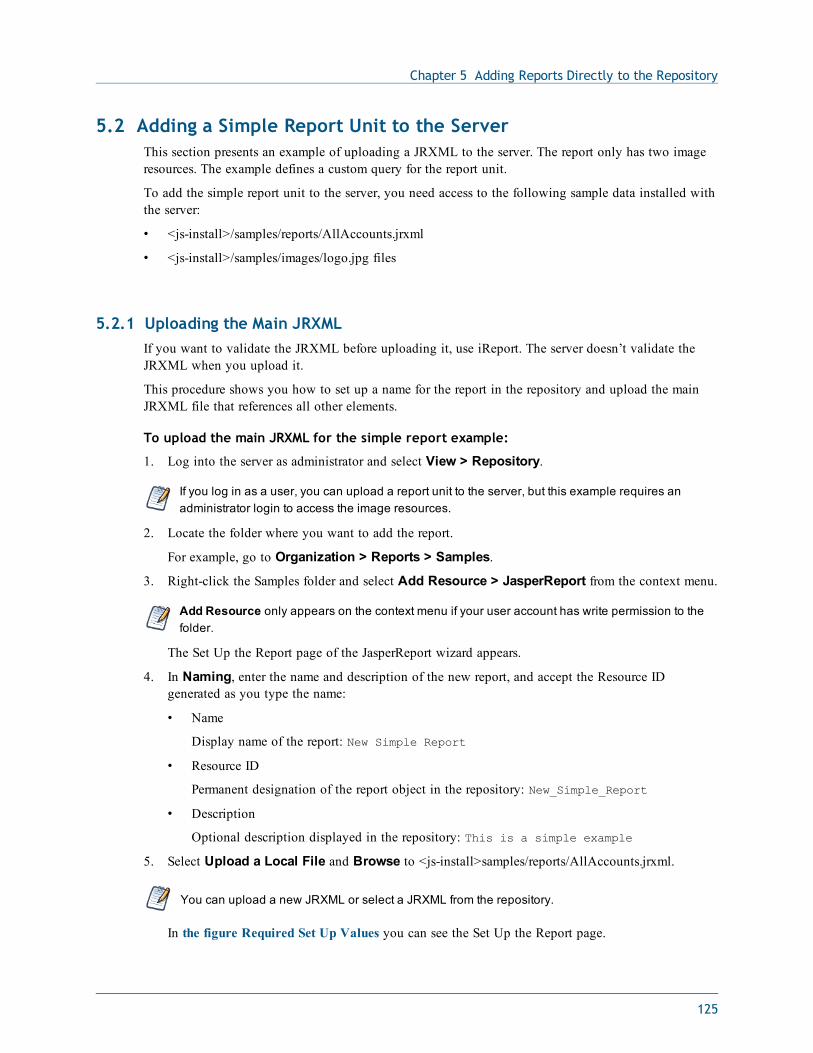
Chapter 5 Adding Reports Directly to the Repository
5.2 Adding a Simple Report Unit to the ServerThis section presents an example of uploading a JRXML to the server. The report only has two imageresources. The example defines a custom query for the report unit.
To add the simple report unit to the server, you need access to the following sample data installed withthe server:
• <js-install>/samples/reports/AllAccounts.jrxml
• <js-install>/samples/images/logo.jpg files
5.2.1 Uploading the Main JRXMLIf you want to validate the JRXML before uploading it, use iReport. The server doesn’t validate theJRXML when you upload it.
This procedure shows you how to set up a name for the report in the repository and upload the mainJRXML file that references all other elements.
To upload the main JRXML for the simple report example:
1. Log into the server as administrator and select View > Repository.
If you log in as a user, you can upload a report unit to the server, but this example requires anadministrator login to access the image resources.
2. Locate the folder where you want to add the report.
For example, go to Organization > Reports > Samples.
3. Right-click the Samples folder and select Add Resource > JasperReport from the context menu.
Add Resource only appears on the context menu if your user account has write permission to thefolder.
The Set Up the Report page of the JasperReport wizard appears.
4. In Naming, enter the name and description of the new report, and accept the Resource IDgenerated as you type the name:
• Name
Display name of the report: New Simple Report
• Resource ID
Permanent designation of the report object in the repository: New_Simple_Report
• Description
Optional description displayed in the repository: This is a simple example
5. Select Upload a Local File and Browse to <js-install>samples/reports/AllAccounts.jrxml.
You can upload a new JRXML or select a JRXML from the repository.
In the figure Required Set Up Values you can see the Set Up the Report page.
125
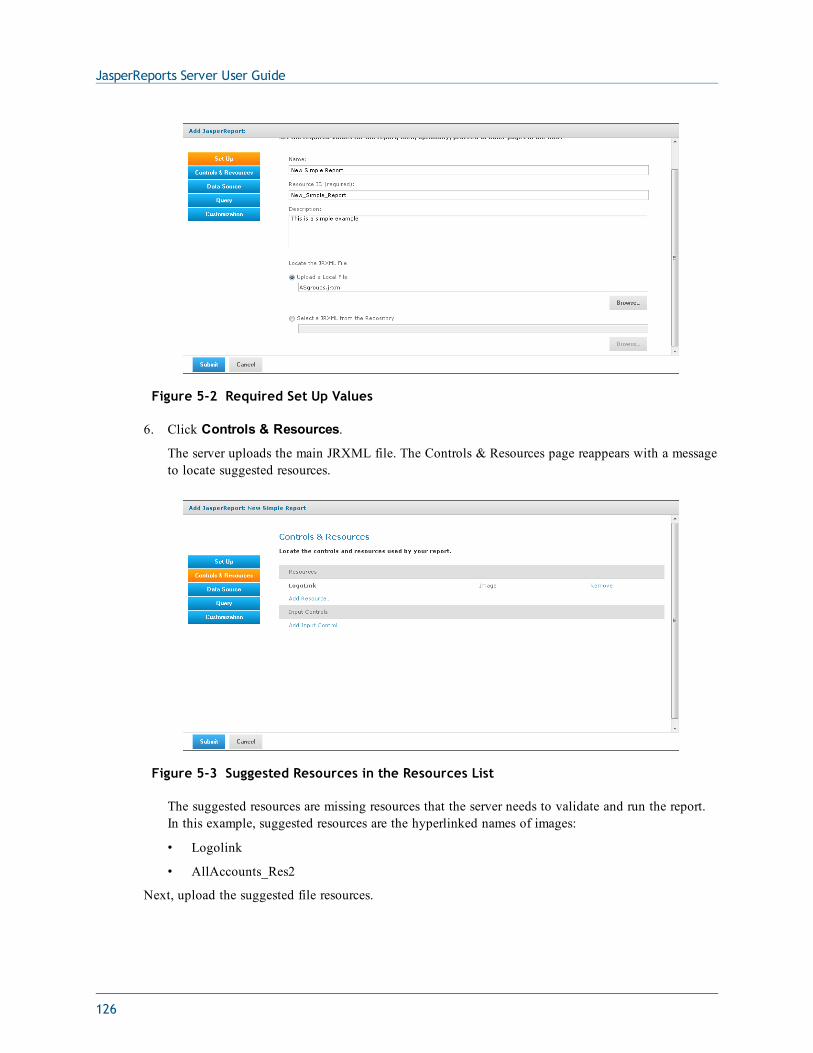
JasperReports Server User Guide
Figure 5-2 Required Set Up Values
6. Click Controls & Resources.
The server uploads the main JRXML file. The Controls & Resources page reappears with a messageto locate suggested resources.
Figure 5-3 Suggested Resources in the Resources List
The suggested resources are missing resources that the server needs to validate and run the report.In this example, suggested resources are the hyperlinked names of images:
• Logolink
• AllAccounts_Res2
Next, upload the suggested file resources.
126
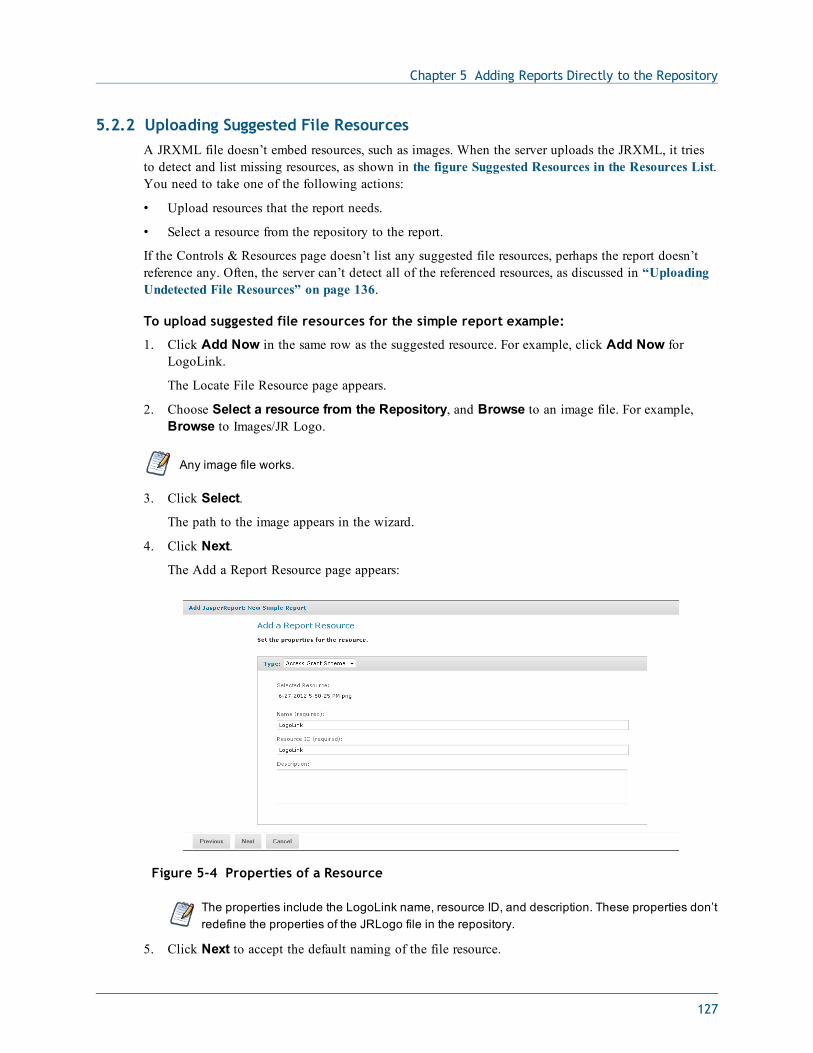
Chapter 5 Adding Reports Directly to the Repository
5.2.2 Uploading Suggested File ResourcesA JRXML file doesn’t embed resources, such as images. When the server uploads the JRXML, it triesto detect and list missing resources, as shown in the figure Suggested Resources in the Resources List.You need to take one of the following actions:
• Upload resources that the report needs.
• Select a resource from the repository to the report.
If the Controls & Resources page doesn’t list any suggested file resources, perhaps the report doesn’treference any. Often, the server can’t detect all of the referenced resources, as discussed in “UploadingUndetected File Resources” on page 136.
To upload suggested file resources for the simple report example:
1. Click Add Now in the same row as the suggested resource. For example, click Add Now forLogoLink.
The Locate File Resource page appears.
2. Choose Select a resource from the Repository, and Browse to an image file. For example,Browse to Images/JR Logo.
Any image file works.
3. Click Select.
The path to the image appears in the wizard.
4. Click Next.
The Add a Report Resource page appears:
Figure 5-4 Properties of a Resource
The properties include the LogoLink name, resource ID, and description. These properties don’tredefine the properties of the JRLogo file in the repository.
5. Click Next to accept the default naming of the file resource.
127
JasperReports Server User Guide
The Controls & Resources page appears again, showing that the LogoLink resource was added.
6. On Controls and Resources, click Add Now in the AllAccounts_Res2 row.
The Locate File Resource page appears again.
7. Select Upload a Local File, and Browse to <js-install>/samples/images/logo.jpg.
8. Open logo.jpg, and click Next.
The server uploads the file.
The Add a Report Resource page appears, showing the properties of the file resource.
The properties include the AllAccounts_Res2 name, resource ID, and description.
9. Click Next to accept the default naming of the file resource.
The Controls & Resources page reappears, showing the addition of both resources referenced in themain JRXML.
10. Click Data Source and define a data source as described in the next section.
5.2.2.1 Referencing Styles
You can apply a style to your report by referencing a property sheet, created in iReport, that containsinformation on a style.
To do this, you will need to edit the Styles.jrxml file and change the <templates> statement.
To reference styles from an external property sheet:
1. Locate and open the Styles.jrxml file.
2. In the JRXML file, declare <template>"repo:styles"</template> (do not include the .jrtxextension).
3. Save the JRXML file.
4. Log into the sever as an administrator, and select View > Repository.
5. Expand the Organization > Reports folder.
6. Right-click the Samples folder and select Add Resource > JasperReport to open the AddJasperReport wizard.
7. On the Set Up page, enter the required information.
8. Select Upload a Local File and click Browse...
9. Locate Styles.jrxml, and click Open.
10. Click Submit.
11. Copy the base_styles.jrtx file from the directory:
<jrs-install>\ireport\demo\samples\templates\reports
and place into the C:\ directory.
12. Edit the styles.jrtx file and add C:\\ before base_styles.jrtx.
13. Back on the server, select View > Repository, then expand the Organization folder.
14. Right-click Images, and select Add Resource > File > Style Template.
128
Chapter 5 Adding Reports Directly to the Repository
15. Under Path to File,click Browse... then locate the style.jrtx file.
16. Enter a Name (Styles) and click Submit.
17. In the repository, open the Reports > Styles folder, then right click on Styles report and select Edit.
18. Click Control & Resources, then click the Add Resource... link.
19. Select Select a resource from the Repository radio button, Browse...
20. Locate Organization > Images > Styles, and click Select.
21. Click Next button
22. On the Add a Report Resource screen, enter Name: Styles, then click Next.
23. Click Submit
5.2.3 Defining the Data SourceData sources belong to the report engine, JasperReports Server, and are not defined in the mainJRXML. The JRXML does not retain any data source defined in iReport when you add the JRXML tothe server. You need to define a data source in the server that the report unit can use. From the DataSource page, select a data source in the repository or create a new data source on-the-fly. The datasource can be different from the database configured for JasperReports Server if the application servercan find its driver. For example, in a default installation of JasperReports Server, Tomcat looks for datasource drivers in <js-install>/apache-tomcat/lib. Put a copy of the driver in this location.
To define the data source for the simple report example:
1. In the JasperReport wizard, click Data Source.
The Link a Data Source to the Report page presents these choices:
• Do not link a data source – Select or define the data source at a later time. You see an error ifyou run the report in this state.
• Click here to create a new data source – Define a new data source that is only available toyour report.
• Select data source from repository – Select an existing data source from the repository.
2. Choose Select data source from the Repository and Browse to /Data Sources/JServer JNDIData Source. Click Select. The path to the data source appears.
129
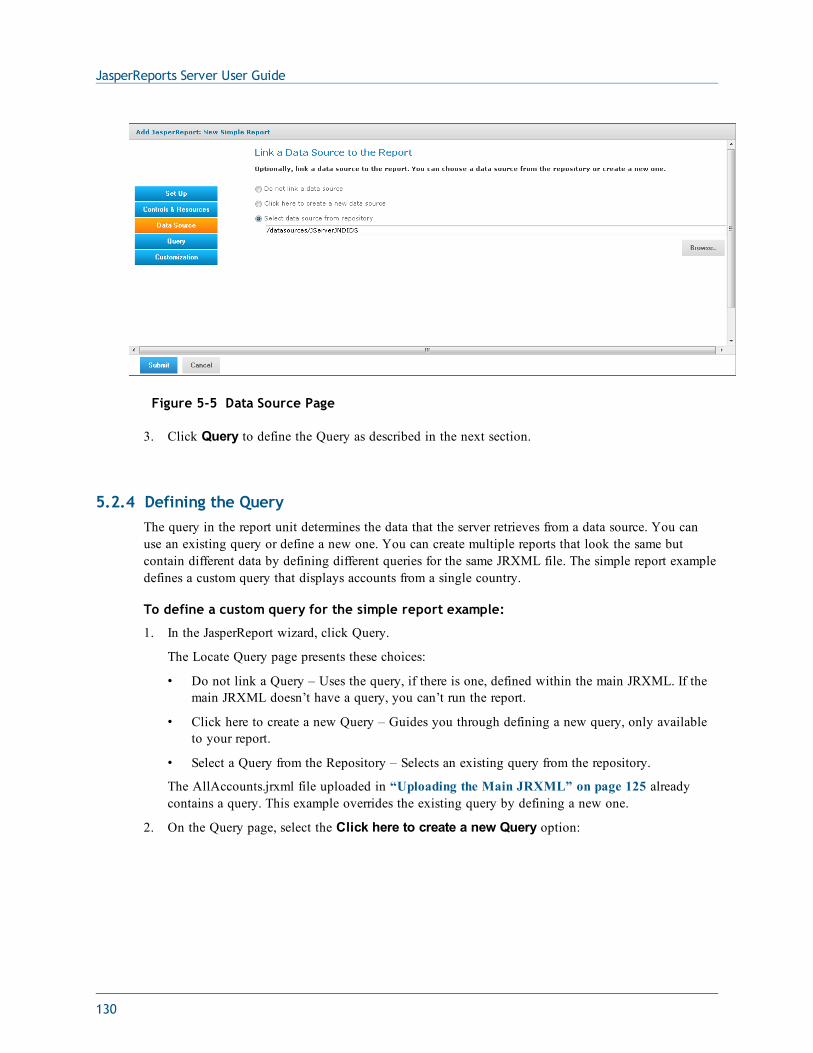
JasperReports Server User Guide
Figure 5-5 Data Source Page
3. Click Query to define the Query as described in the next section.
5.2.4 Defining the QueryThe query in the report unit determines the data that the server retrieves from a data source. You canuse an existing query or define a new one. You can create multiple reports that look the same butcontain different data by defining different queries for the same JRXML file. The simple report exampledefines a custom query that displays accounts from a single country.
To define a custom query for the simple report example:
1. In the JasperReport wizard, click Query.
The Locate Query page presents these choices:
• Do not link a Query – Uses the query, if there is one, defined within the main JRXML. If themain JRXML doesn’t have a query, you can’t run the report.
• Click here to create a new Query – Guides you through defining a new query, only availableto your report.
• Select a Query from the Repository – Selects an existing query from the repository.
The AllAccounts.jrxml file uploaded in “Uploading the Main JRXML” on page 125 alreadycontains a query. This example overrides the existing query by defining a new one.
2. On the Query page, select the Click here to create a new Query option:
130
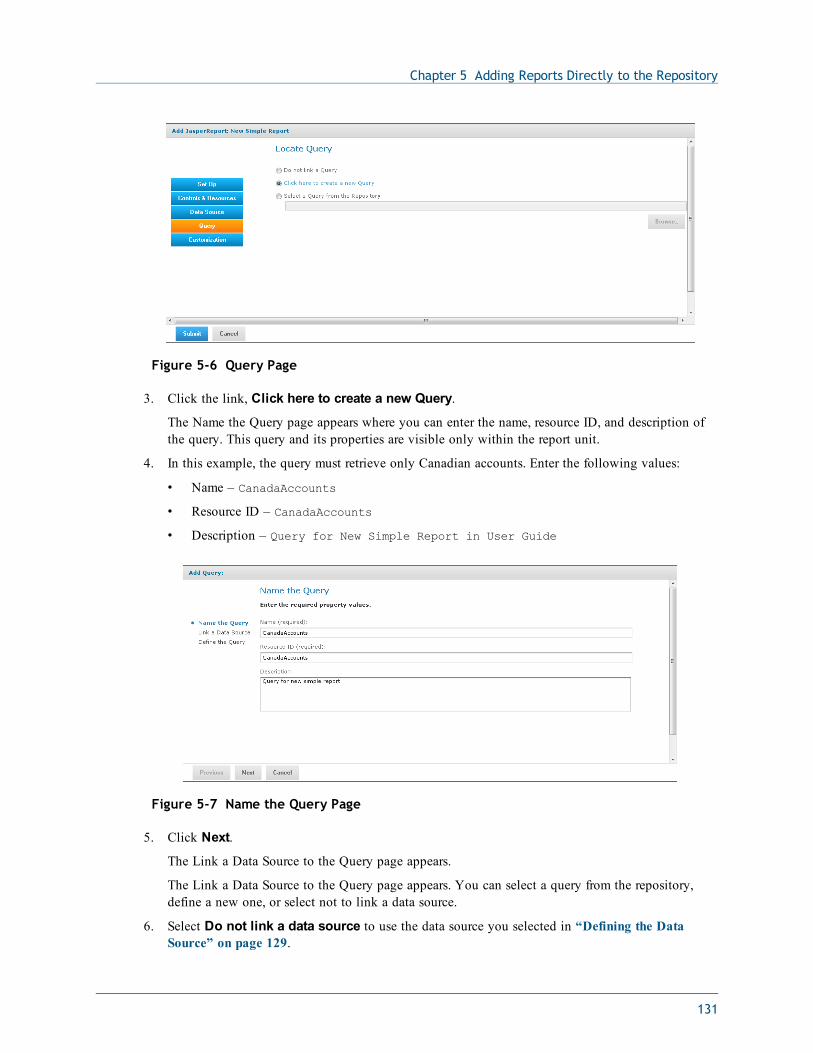
Chapter 5 Adding Reports Directly to the Repository
Figure 5-6 Query Page
3. Click the link, Click here to create a new Query.
The Name the Query page appears where you can enter the name, resource ID, and description ofthe query. This query and its properties are visible only within the report unit.
4. In this example, the query must retrieve only Canadian accounts. Enter the following values:
• Name – CanadaAccounts
• Resource ID – CanadaAccounts
• Description – Query for New Simple Report in User Guide
Figure 5-7 Name the Query Page
5. Click Next.
The Link a Data Source to the Query page appears.
The Link a Data Source to the Query page appears. You can select a query from the repository,define a new one, or select not to link a data source.
6. Select Do not link a data source to use the data source you selected in “Defining the DataSource” on page 129.
131
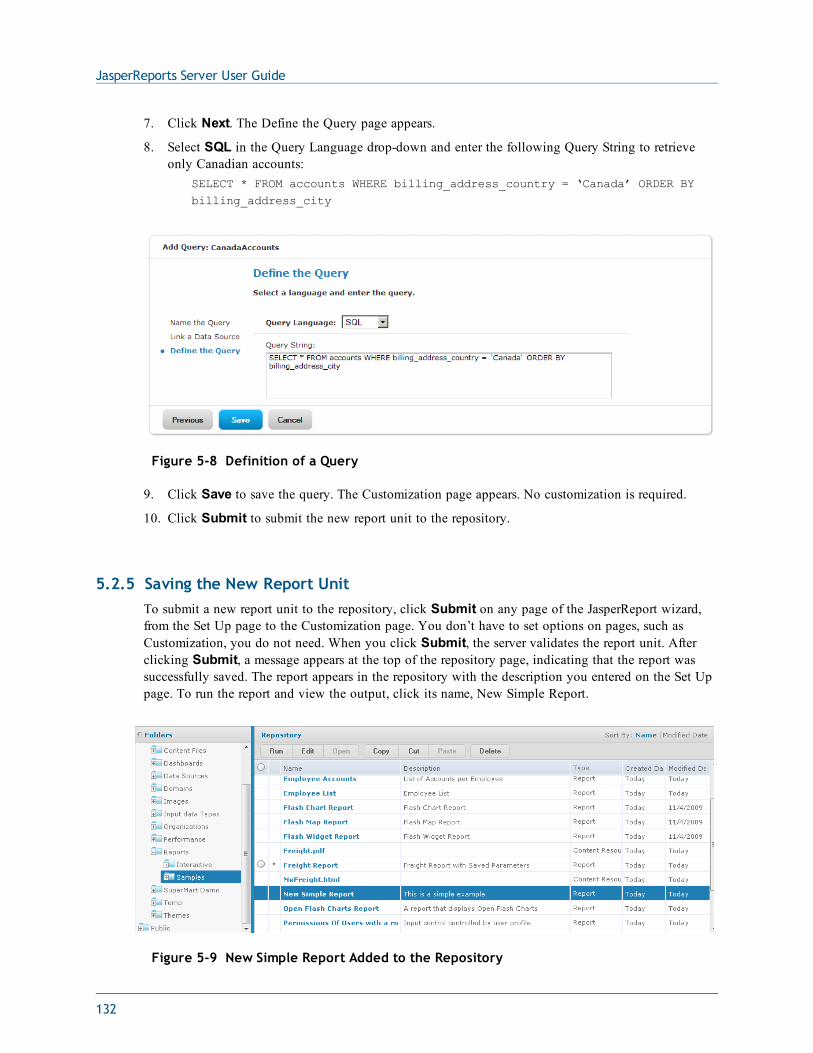
JasperReports Server User Guide
7. Click Next. The Define the Query page appears.
8. Select SQL in the Query Language drop-down and enter the following Query String to retrieveonly Canadian accounts:
SELECT * FROM accounts WHERE billing_address_country = ‘Canada’ ORDER BYbilling_address_city
Figure 5-8 Definition of a Query
9. Click Save to save the query. The Customization page appears. No customization is required.
10. Click Submit to submit the new report unit to the repository.
5.2.5 Saving the New Report UnitTo submit a new report unit to the repository, click Submit on any page of the JasperReport wizard,from the Set Up page to the Customization page. You don’t have to set options on pages, such asCustomization, you do not need. When you click Submit, the server validates the report unit. Afterclicking Submit, a message appears at the top of the repository page, indicating that the report wassuccessfully saved. The report appears in the repository with the description you entered on the Set Uppage. To run the report and view the output, click its name, New Simple Report.
Figure 5-9 New Simple Report Added to the Repository
132
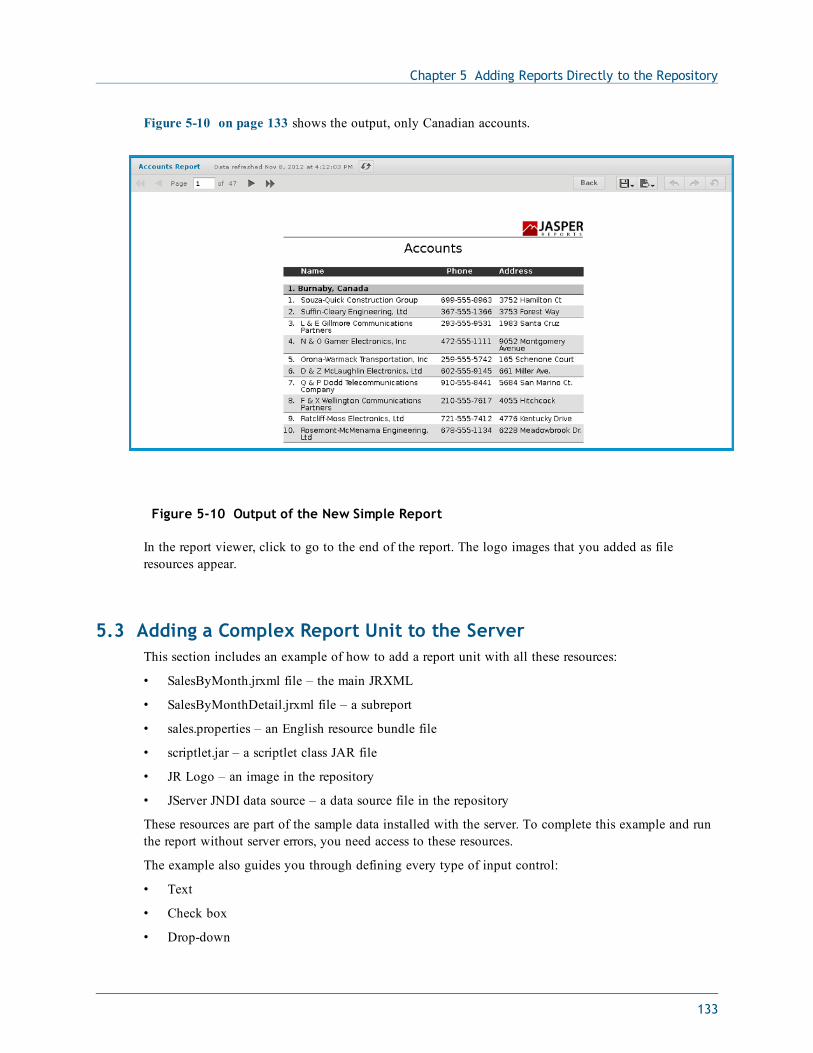
Chapter 5 Adding Reports Directly to the Repository
Figure 5-10 on page 133 shows the output, only Canadian accounts.
Figure 5-10 Output of the New Simple Report
In the report viewer, click to go to the end of the report. The logo images that you added as fileresources appear.
5.3 Adding a Complex Report Unit to the ServerThis section includes an example of how to add a report unit with all these resources:
• SalesByMonth.jrxml file – the main JRXML
• SalesByMonthDetail.jrxml file – a subreport
• sales.properties – an English resource bundle file
• scriptlet.jar – a scriptlet class JAR file
• JR Logo – an image in the repository
• JServer JNDI data source – a data source file in the repository
These resources are part of the sample data installed with the server. To complete this example and runthe report without server errors, you need access to these resources.
The example also guides you through defining every type of input control:
• Text
• Check box
• Drop-down
133
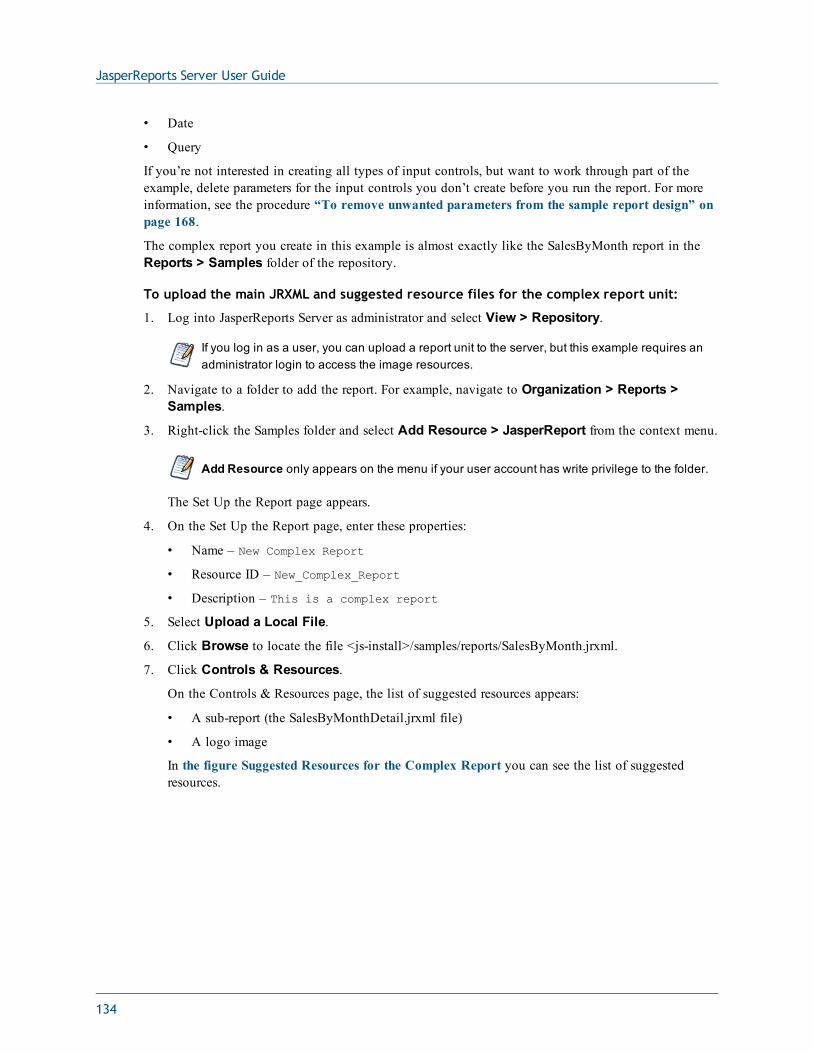
JasperReports Server User Guide
• Date
• Query
If you’re not interested in creating all types of input controls, but want to work through part of theexample, delete parameters for the input controls you don’t create before you run the report. For moreinformation, see the procedure “To remove unwanted parameters from the sample report design” onpage 168.
The complex report you create in this example is almost exactly like the SalesByMonth report in theReports > Samples folder of the repository.
To upload the main JRXML and suggested resource files for the complex report unit:
1. Log into JasperReports Server as administrator and select View > Repository.
If you log in as a user, you can upload a report unit to the server, but this example requires anadministrator login to access the image resources.
2. Navigate to a folder to add the report. For example, navigate to Organization > Reports >Samples.
3. Right-click the Samples folder and select Add Resource > JasperReport from the context menu.
Add Resource only appears on the menu if your user account has write privilege to the folder.
The Set Up the Report page appears.
4. On the Set Up the Report page, enter these properties:
• Name – New Complex Report
• Resource ID – New_Complex_Report
• Description – This is a complex report
5. Select Upload a Local File.
6. Click Browse to locate the file <js-install>/samples/reports/SalesByMonth.jrxml.
7. Click Controls & Resources.
On the Controls & Resources page, the list of suggested resources appears:
• A sub-report (the SalesByMonthDetail.jrxml file)
• A logo image
In the figure Suggested Resources for the Complex Report you can see the list of suggestedresources.
134
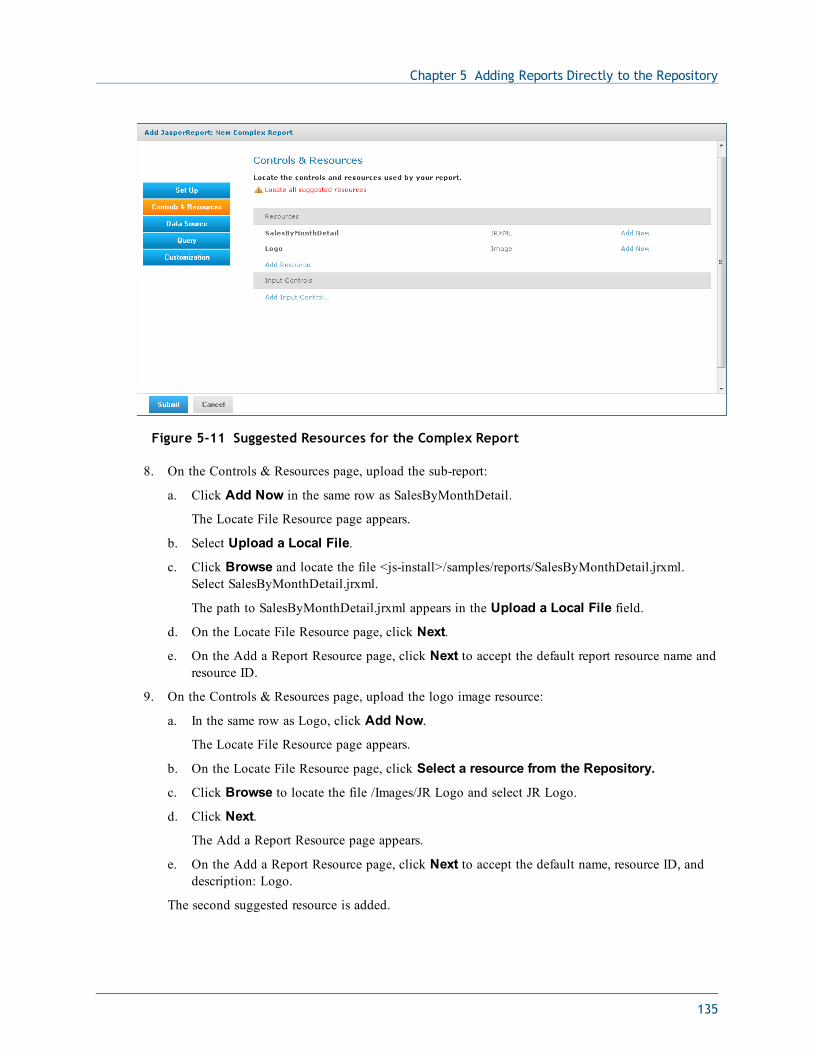
Chapter 5 Adding Reports Directly to the Repository
Figure 5-11 Suggested Resources for the Complex Report
8. On the Controls & Resources page, upload the sub-report:
a. Click Add Now in the same row as SalesByMonthDetail.
The Locate File Resource page appears.
b. Select Upload a Local File.
c. Click Browse and locate the file <js-install>/samples/reports/SalesByMonthDetail.jrxml.Select SalesByMonthDetail.jrxml.
The path to SalesByMonthDetail.jrxml appears in the Upload a Local File field.
d. On the Locate File Resource page, click Next.
e. On the Add a Report Resource page, click Next to accept the default report resource name andresource ID.
9. On the Controls & Resources page, upload the logo image resource:
a. In the same row as Logo, click Add Now.
The Locate File Resource page appears.
b. On the Locate File Resource page, click Select a resource from the Repository.
c. Click Browse to locate the file /Images/JR Logo and select JR Logo.
d. Click Next.
The Add a Report Resource page appears.
e. On the Add a Report Resource page, click Next to accept the default name, resource ID, anddescription: Logo.
The second suggested resource is added.
135
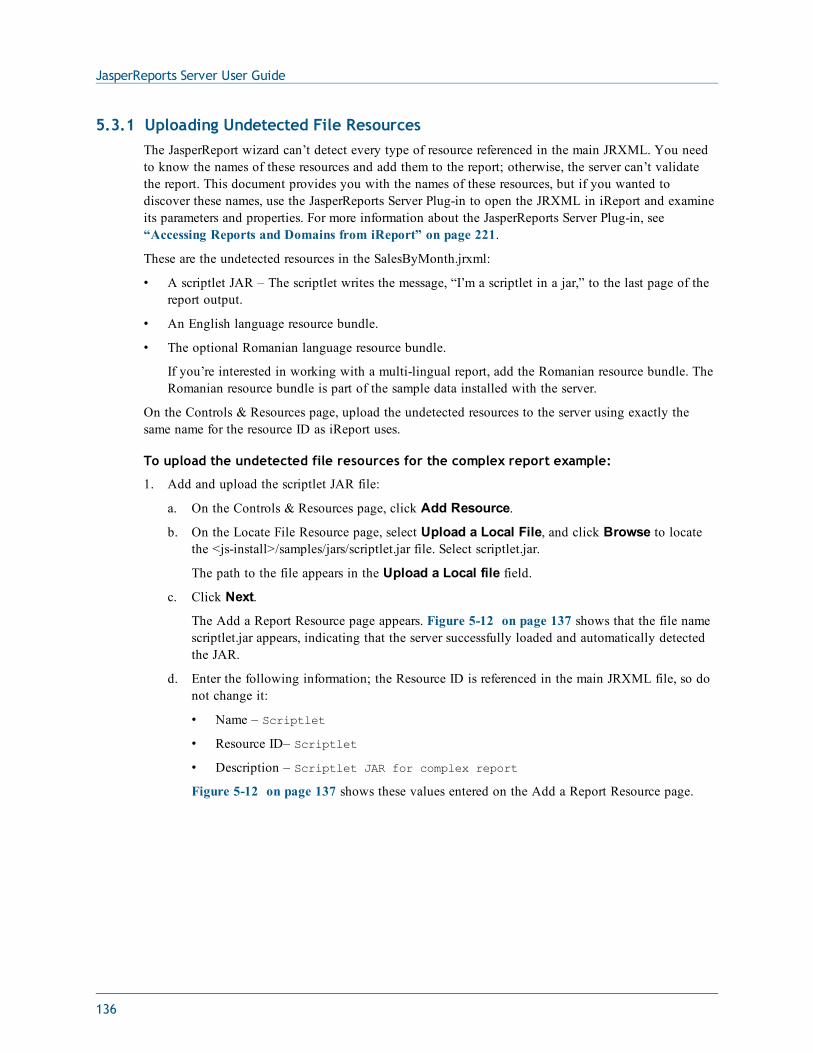
JasperReports Server User Guide
5.3.1 Uploading Undetected File ResourcesThe JasperReport wizard can’t detect every type of resource referenced in the main JRXML. You needto know the names of these resources and add them to the report; otherwise, the server can’t validatethe report. This document provides you with the names of these resources, but if you wanted todiscover these names, use the JasperReports Server Plug-in to open the JRXML in iReport and examineits parameters and properties. For more information about the JasperReports Server Plug-in, see“Accessing Reports and Domains from iReport” on page 221.
These are the undetected resources in the SalesByMonth.jrxml:
• A scriptlet JAR – The scriptlet writes the message, “I’m a scriptlet in a jar,” to the last page of thereport output.
• An English language resource bundle.
• The optional Romanian language resource bundle.
If you’re interested in working with a multi-lingual report, add the Romanian resource bundle. TheRomanian resource bundle is part of the sample data installed with the server.
On the Controls & Resources page, upload the undetected resources to the server using exactly thesame name for the resource ID as iReport uses.
To upload the undetected file resources for the complex report example:
1. Add and upload the scriptlet JAR file:
a. On the Controls & Resources page, click Add Resource.
b. On the Locate File Resource page, select Upload a Local File, and click Browse to locatethe <js-install>/samples/jars/scriptlet.jar file. Select scriptlet.jar.
The path to the file appears in the Upload a Local file field.
c. Click Next.
The Add a Report Resource page appears. Figure 5-12 on page 137 shows that the file namescriptlet.jar appears, indicating that the server successfully loaded and automatically detectedthe JAR.
d. Enter the following information; the Resource ID is referenced in the main JRXML file, so donot change it:
• Name – Scriptlet
• Resource ID– Scriptlet
• Description – Scriptlet JAR for complex report
Figure 5-12 on page 137 shows these values entered on the Add a Report Resource page.
136
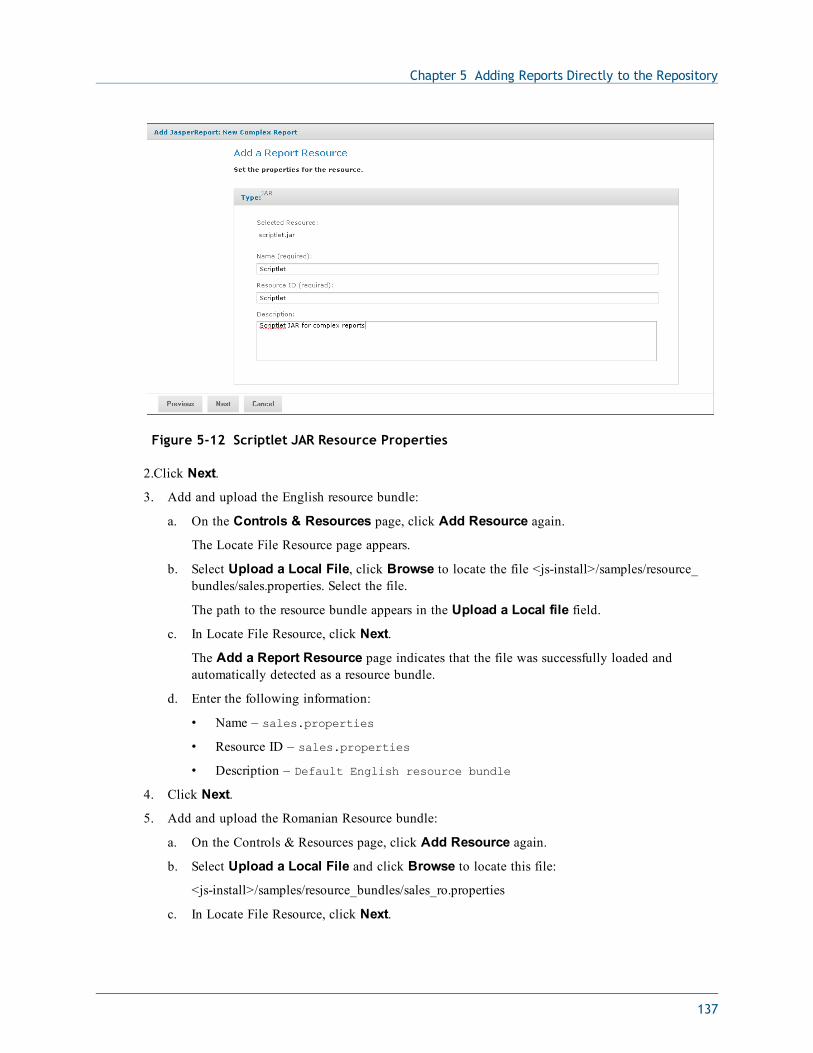
Chapter 5 Adding Reports Directly to the Repository
Figure 5-12 Scriptlet JAR Resource Properties
2.Click Next.
3. Add and upload the English resource bundle:
a. On the Controls & Resources page, click Add Resource again.
The Locate File Resource page appears.
b. Select Upload a Local File, click Browse to locate the file <js-install>/samples/resource_bundles/sales.properties. Select the file.
The path to the resource bundle appears in the Upload a Local file field.
c. In Locate File Resource, click Next.
The Add a Report Resource page indicates that the file was successfully loaded andautomatically detected as a resource bundle.
d. Enter the following information:
• Name – sales.properties
• Resource ID – sales.properties
• Description – Default English resource bundle
4. Click Next.
5. Add and upload the Romanian Resource bundle:
a. On the Controls & Resources page, click Add Resource again.
b. Select Upload a Local File and click Browse to locate this file:
<js-install>/samples/resource_bundles/sales_ro.properties
c. In Locate File Resource, click Next.
137
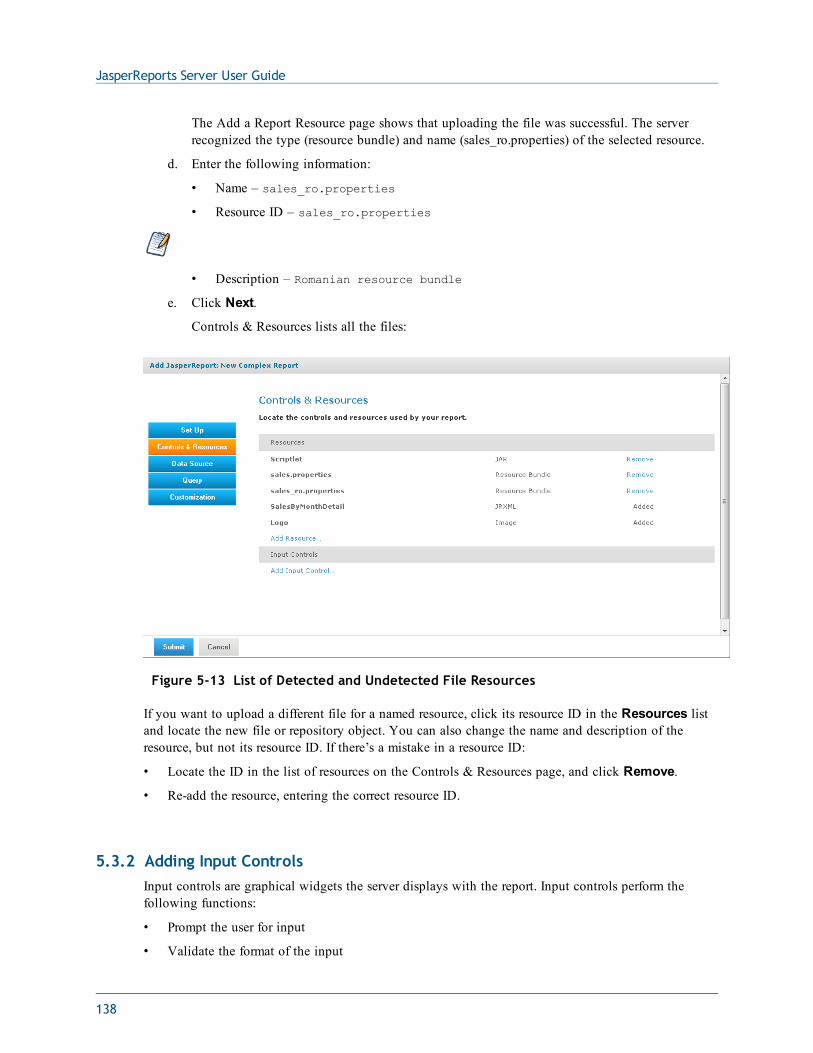
JasperReports Server User Guide
The Add a Report Resource page shows that uploading the file was successful. The serverrecognized the type (resource bundle) and name (sales_ro.properties) of the selected resource.
d. Enter the following information:
• Name – sales_ro.properties
• Resource ID – sales_ro.properties
• Description – Romanian resource bundle
e. Click Next.
Controls & Resources lists all the files:
Figure 5-13 List of Detected and Undetected File Resources
If you want to upload a different file for a named resource, click its resource ID in the Resources listand locate the new file or repository object. You can also change the name and description of theresource, but not its resource ID. If there’s a mistake in a resource ID:
• Locate the ID in the list of resources on the Controls & Resources page, and click Remove.
• Re-add the resource, entering the correct resource ID.
5.3.2 Adding Input ControlsInput controls are graphical widgets the server displays with the report. Input controls perform thefollowing functions:
• Prompt the user for input
• Validate the format of the input
138
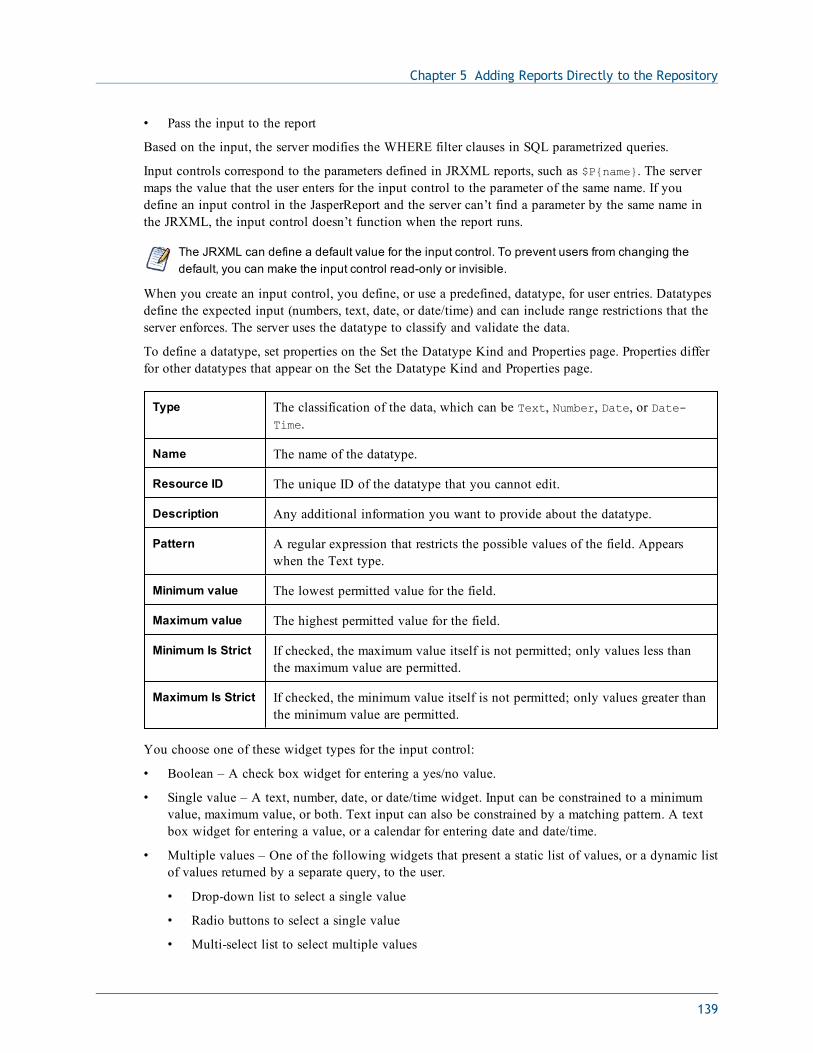
Chapter 5 Adding Reports Directly to the Repository
• Pass the input to the report
Based on the input, the server modifies the WHERE filter clauses in SQL parametrized queries.
Input controls correspond to the parameters defined in JRXML reports, such as $P{name}. The servermaps the value that the user enters for the input control to the parameter of the same name. If youdefine an input control in the JasperReport and the server can’t find a parameter by the same name inthe JRXML, the input control doesn’t function when the report runs.
The JRXML can define a default value for the input control. To prevent users from changing thedefault, you can make the input control read-only or invisible.
When you create an input control, you define, or use a predefined, datatype, for user entries. Datatypesdefine the expected input (numbers, text, date, or date/time) and can include range restrictions that theserver enforces. The server uses the datatype to classify and validate the data.
To define a datatype, set properties on the Set the Datatype Kind and Properties page. Properties differfor other datatypes that appear on the Set the Datatype Kind and Properties page.
Type The classification of the data, which can be Text, Number, Date, or Date-Time.
Name The name of the datatype.
Resource ID The unique ID of the datatype that you cannot edit.
Description Any additional information you want to provide about the datatype.
Pattern A regular expression that restricts the possible values of the field. Appearswhen the Text type.
Minimum value The lowest permitted value for the field.
Maximum value The highest permitted value for the field.
Minimum Is Strict If checked, the maximum value itself is not permitted; only values less thanthe maximum value are permitted.
Maximum Is Strict If checked, the minimum value itself is not permitted; only values greater thanthe minimum value are permitted.
You choose one of these widget types for the input control:
• Boolean – A check box widget for entering a yes/no value.
• Single value – A text, number, date, or date/time widget. Input can be constrained to a minimumvalue, maximum value, or both. Text input can also be constrained by a matching pattern. A textbox widget for entering a value, or a calendar for entering date and date/time.
• Multiple values – One of the following widgets that present a static list of values, or a dynamic listof values returned by a separate query, to the user.
• Drop-down list to select a single value
• Radio buttons to select a single value
• Multi-select list to select multiple values
139
JasperReports Server User Guide
• Check boxes to select multiple values
After determining the list of values to be presented to the user, choose the widget.
The query in the SalesByMonth.jrxml file has several input control parameters, one for each differenttype of input control. These procedures show you how to add each type to the report unit.
5.3.2.1 Adding a Text Input Control
The simplest input control is a text box. In this example, the datatype for the input value is a number;the server verifies that the user enters a number into the text box.
To add a text input control to the complex report example:
1. After completing steps in “Uploading Undetected File Resources” on page 136, click Controls& Resources in the JasperReport wizard.
2. On the Controls & Resources page, click Add Input Control.
The Locate Input Control page appears.
3. Select Define an Input Control in the next step.
4. Click Next.
5. On the Create Input Control page, accept the default type of input from the Type drop-down:Single Value.
6. Enter the other properties for the input control:
The name is referenced in the main JRXML file, so enter it exactly as shown.
• Prompt Text – The label that the user sees next to the widget for this input: Text InputControl
• Parameter Name – The name of the parameter in the report that receives the user value:TextInput
• Description – An optional description that appears only within the report wizard: leave blankin this example.
• Mandatory, Read-only, Visible – A setting that affects how the input control is displayed:check only Visible.
140
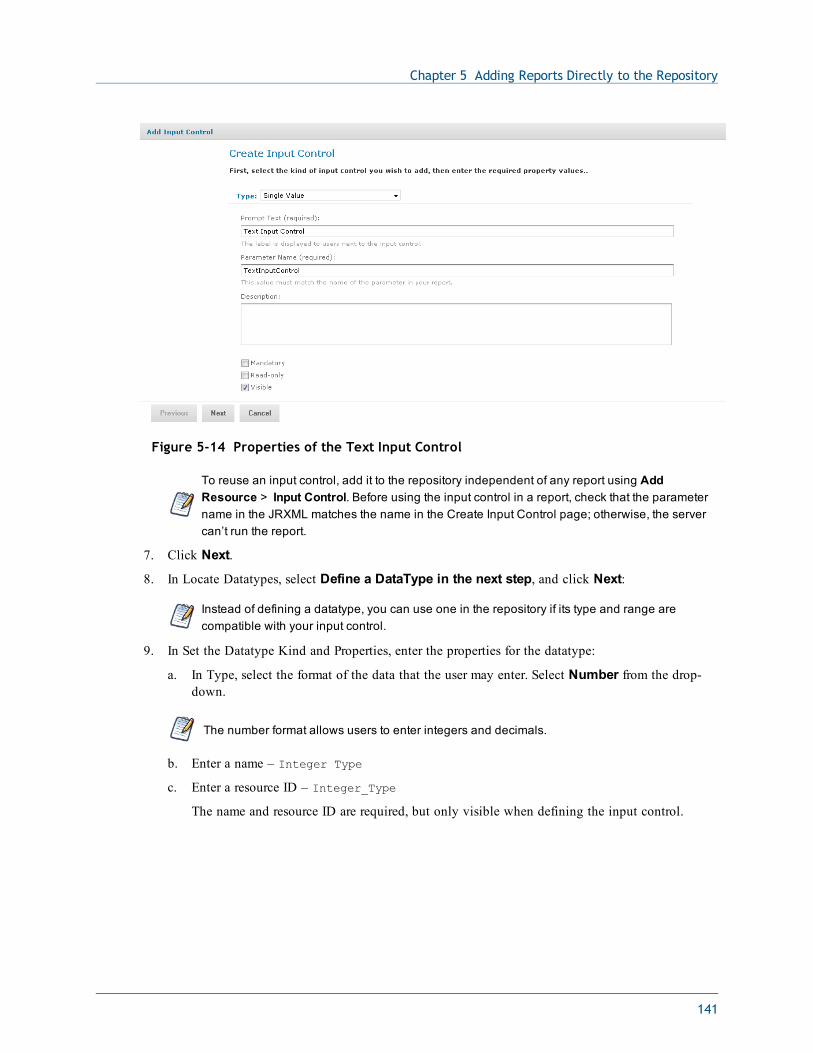
Chapter 5 Adding Reports Directly to the Repository
Figure 5-14 Properties of the Text Input Control
To reuse an input control, add it to the repository independent of any report using AddResource > Input Control. Before using the input control in a report, check that the parametername in the JRXML matches the name in the Create Input Control page; otherwise, the servercan’t run the report.
7. Click Next.
8. In Locate Datatypes, select Define a DataType in the next step, and click Next:
Instead of defining a datatype, you can use one in the repository if its type and range arecompatible with your input control.
9. In Set the Datatype Kind and Properties, enter the properties for the datatype:
a. In Type, select the format of the data that the user may enter. Select Number from the drop-down.
The number format allows users to enter integers and decimals.
b. Enter a name – Integer Type
c. Enter a resource ID – Integer_Type
The name and resource ID are required, but only visible when defining the input control.
141
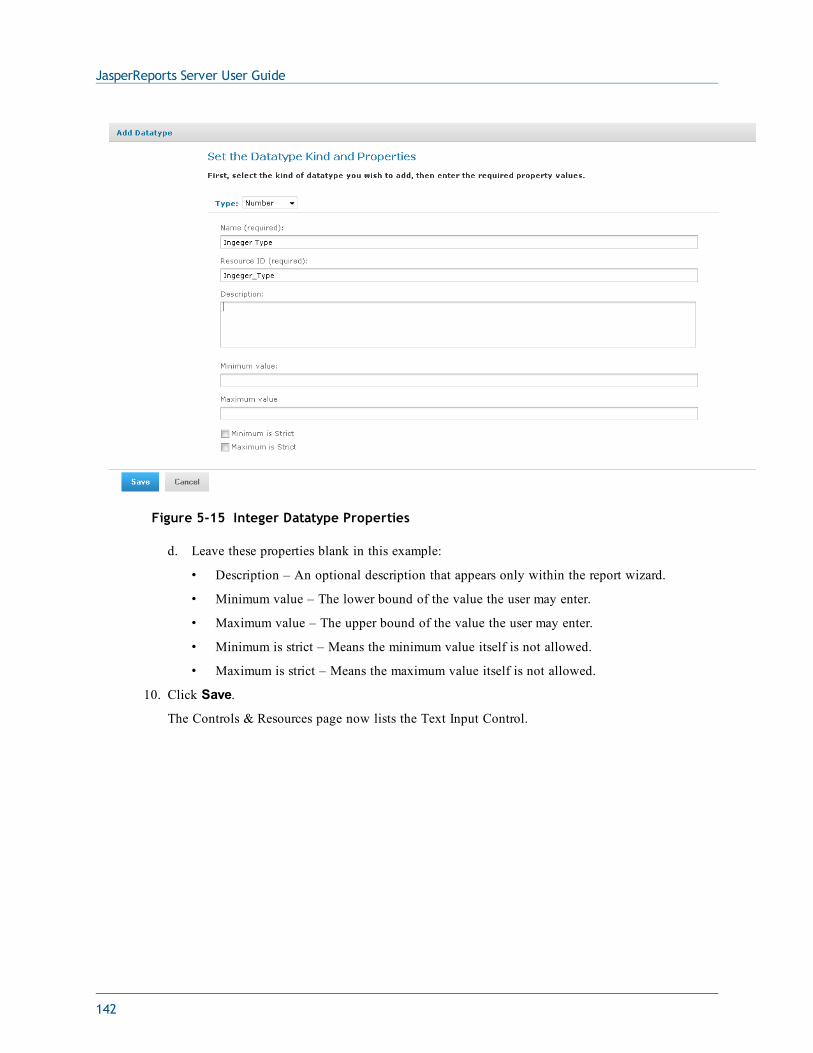
JasperReports Server User Guide
Figure 5-15 Integer Datatype Properties
d. Leave these properties blank in this example:
• Description – An optional description that appears only within the report wizard.
• Minimum value – The lower bound of the value the user may enter.
• Maximum value – The upper bound of the value the user may enter.
• Minimum is strict – Means the minimum value itself is not allowed.
• Maximum is strict – Means the maximum value itself is not allowed.
10. Click Save.
The Controls & Resources page now lists the Text Input Control.
142
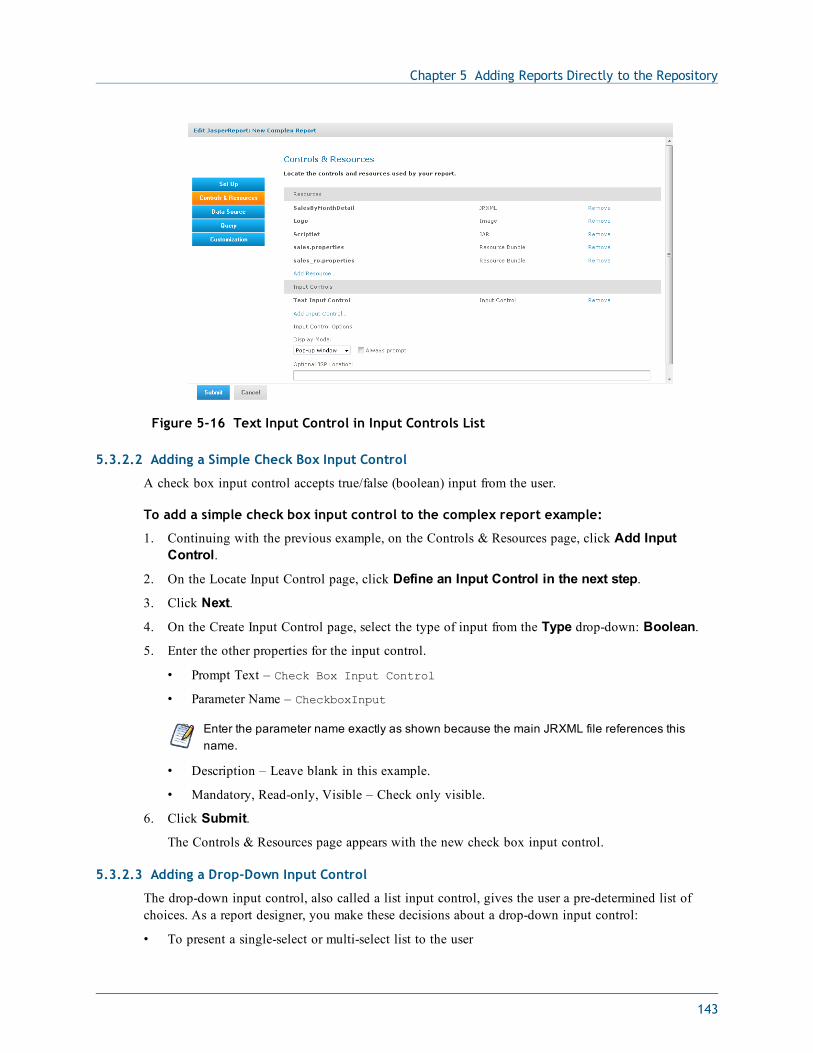
Chapter 5 Adding Reports Directly to the Repository
Figure 5-16 Text Input Control in Input Controls List
5.3.2.2 Adding a Simple Check Box Input Control
A check box input control accepts true/false (boolean) input from the user.
To add a simple check box input control to the complex report example:
1. Continuing with the previous example, on the Controls & Resources page, click Add InputControl.
2. On the Locate Input Control page, click Define an Input Control in the next step.
3. Click Next.
4. On the Create Input Control page, select the type of input from the Type drop-down: Boolean.
5. Enter the other properties for the input control.
• Prompt Text – Check Box Input Control
• Parameter Name – CheckboxInput
Enter the parameter name exactly as shown because the main JRXML file references thisname.
• Description – Leave blank in this example.
• Mandatory, Read-only, Visible – Check only visible.
6. Click Submit.
The Controls & Resources page appears with the new check box input control.
5.3.2.3 Adding a Drop-Down Input Control
The drop-down input control, also called a list input control, gives the user a pre-determined list ofchoices. As a report designer, you make these decisions about a drop-down input control:
• To present a single-select or multi-select list to the user
143
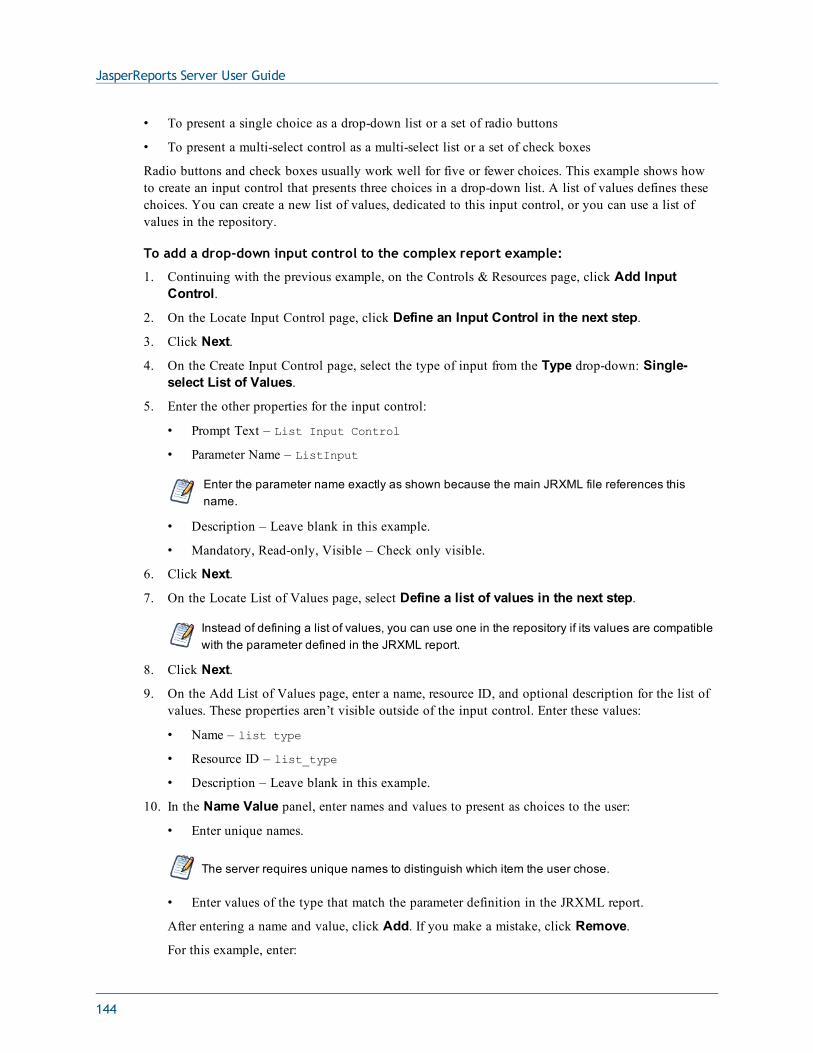
JasperReports Server User Guide
• To present a single choice as a drop-down list or a set of radio buttons
• To present a multi-select control as a multi-select list or a set of check boxes
Radio buttons and check boxes usually work well for five or fewer choices. This example shows howto create an input control that presents three choices in a drop-down list. A list of values defines thesechoices. You can create a new list of values, dedicated to this input control, or you can use a list ofvalues in the repository.
To add a drop-down input control to the complex report example:
1. Continuing with the previous example, on the Controls & Resources page, click Add InputControl.
2. On the Locate Input Control page, click Define an Input Control in the next step.
3. Click Next.
4. On the Create Input Control page, select the type of input from the Type drop-down: Single-select List of Values.
5. Enter the other properties for the input control:
• Prompt Text – List Input Control
• Parameter Name – ListInput
Enter the parameter name exactly as shown because the main JRXML file references thisname.
• Description – Leave blank in this example.
• Mandatory, Read-only, Visible – Check only visible.
6. Click Next.
7. On the Locate List of Values page, select Define a list of values in the next step.
Instead of defining a list of values, you can use one in the repository if its values are compatiblewith the parameter defined in the JRXML report.
8. Click Next.
9. On the Add List of Values page, enter a name, resource ID, and optional description for the list ofvalues. These properties aren’t visible outside of the input control. Enter these values:
• Name – list type
• Resource ID – list_type
• Description – Leave blank in this example.
10. In the Name Value panel, enter names and values to present as choices to the user:
• Enter unique names.
The server requires unique names to distinguish which item the user chose.
• Enter values of the type that match the parameter definition in the JRXML report.
After entering a name and value, click Add. If you make a mistake, click Remove.
For this example, enter:
144
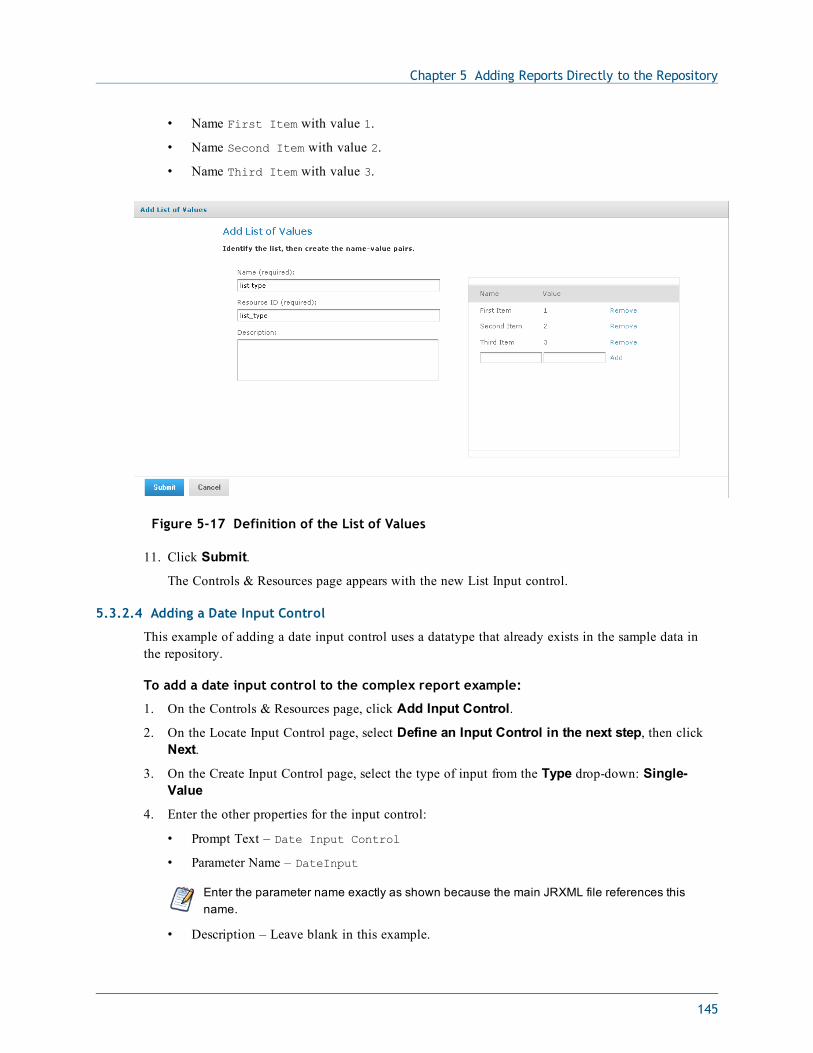
Chapter 5 Adding Reports Directly to the Repository
• Name First Item with value 1.
• Name Second Item with value 2.
• Name Third Item with value 3.
Figure 5-17 Definition of the List of Values
11. Click Submit.
The Controls & Resources page appears with the new List Input control.
5.3.2.4 Adding a Date Input Control
This example of adding a date input control uses a datatype that already exists in the sample data inthe repository.
To add a date input control to the complex report example:
1. On the Controls & Resources page, click Add Input Control.
2. On the Locate Input Control page, select Define an Input Control in the next step, then clickNext.
3. On the Create Input Control page, select the type of input from the Type drop-down: Single-Value
4. Enter the other properties for the input control:
• Prompt Text – Date Input Control
• Parameter Name – DateInput
Enter the parameter name exactly as shown because the main JRXML file references thisname.
• Description – Leave blank in this example.
145
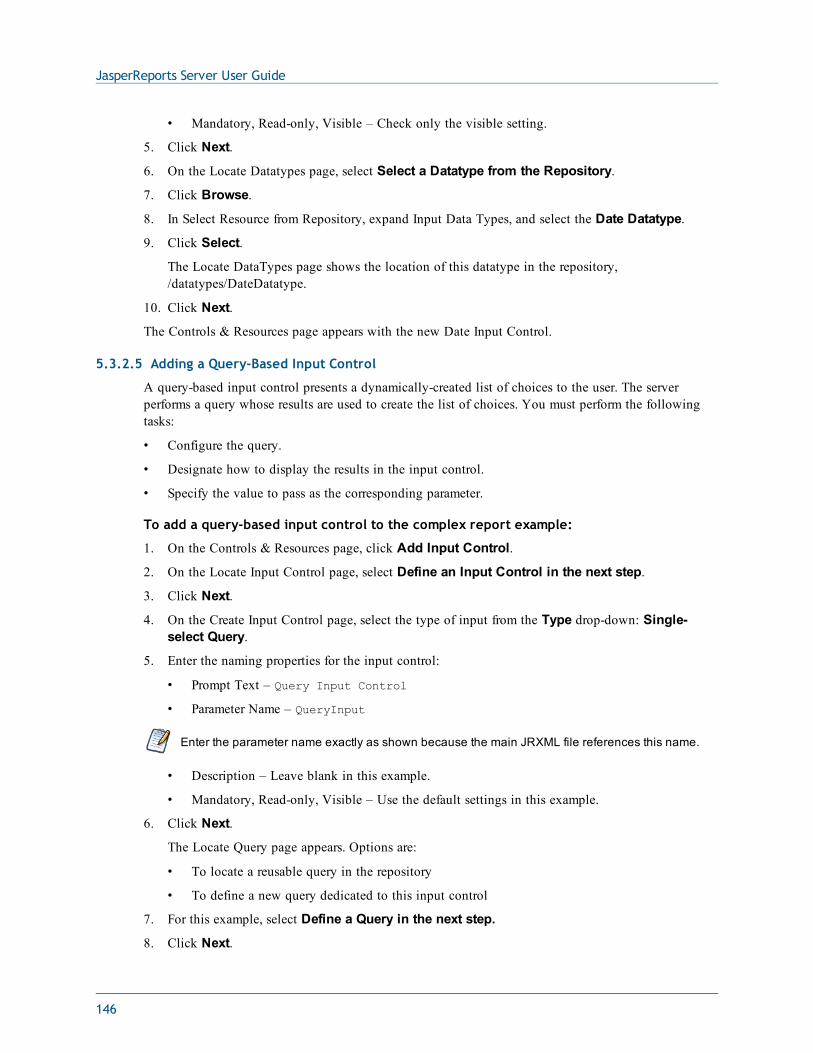
JasperReports Server User Guide
• Mandatory, Read-only, Visible – Check only the visible setting.
5. Click Next.
6. On the Locate Datatypes page, select Select a Datatype from the Repository.
7. Click Browse.
8. In Select Resource from Repository, expand Input Data Types, and select the Date Datatype.
9. Click Select.
The Locate DataTypes page shows the location of this datatype in the repository,/datatypes/DateDatatype.
10. Click Next.
The Controls & Resources page appears with the new Date Input Control.
5.3.2.5 Adding a Query-Based Input Control
A query-based input control presents a dynamically-created list of choices to the user. The serverperforms a query whose results are used to create the list of choices. You must perform the followingtasks:
• Configure the query.
• Designate how to display the results in the input control.
• Specify the value to pass as the corresponding parameter.
To add a query-based input control to the complex report example:
1. On the Controls & Resources page, click Add Input Control.
2. On the Locate Input Control page, select Define an Input Control in the next step.
3. Click Next.
4. On the Create Input Control page, select the type of input from the Type drop-down: Single-select Query.
5. Enter the naming properties for the input control:
• Prompt Text – Query Input Control
• Parameter Name – QueryInput
Enter the parameter name exactly as shown because the main JRXML file references this name.
• Description – Leave blank in this example.
• Mandatory, Read-only, Visible – Use the default settings in this example.
6. Click Next.
The Locate Query page appears. Options are:
• To locate a reusable query in the repository
• To define a new query dedicated to this input control
7. For this example, select Define a Query in the next step.
8. Click Next.
146
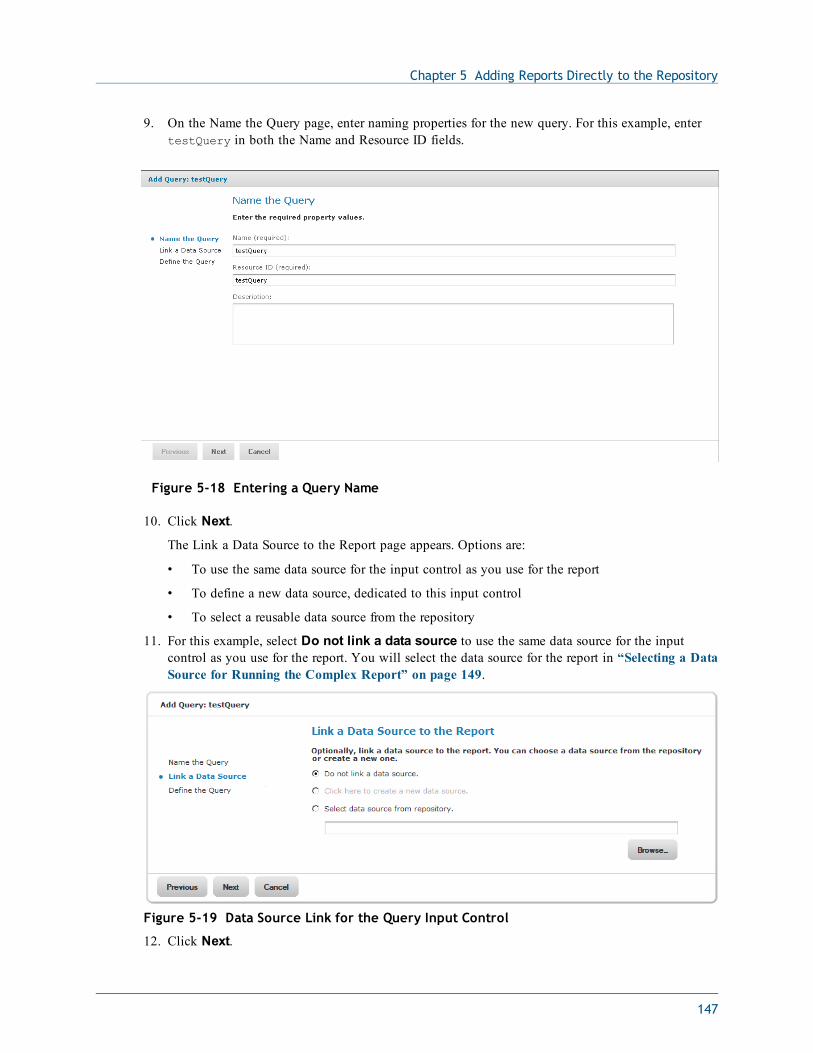
Chapter 5 Adding Reports Directly to the Repository
9. On the Name the Query page, enter naming properties for the new query. For this example, entertestQuery in both the Name and Resource ID fields.
Figure 5-18 Entering a Query Name
10. Click Next.
The Link a Data Source to the Report page appears. Options are:
• To use the same data source for the input control as you use for the report
• To define a new data source, dedicated to this input control
• To select a reusable data source from the repository
11. For this example, select Do not link a data source to use the same data source for the inputcontrol as you use for the report. You will select the data source for the report in “Selecting a DataSource for Running the Complex Report” on page 149.
Figure 5-19 Data Source Link for the Query Input Control
12. Click Next.
147
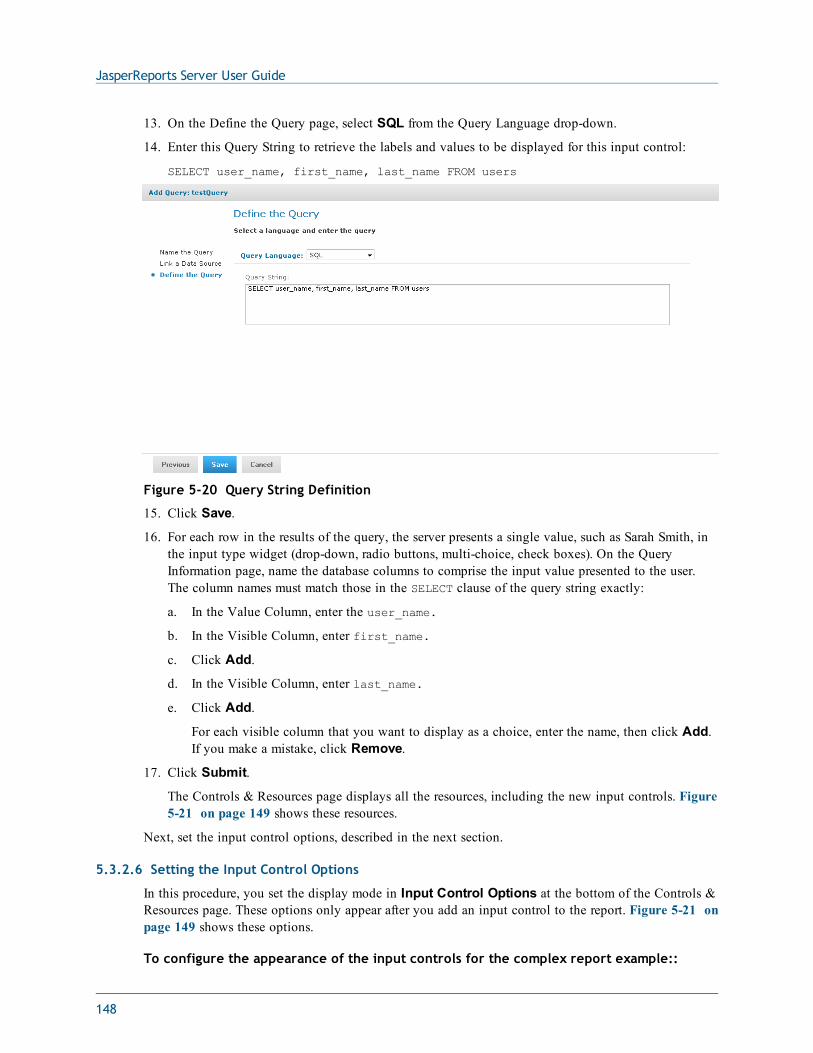
JasperReports Server User Guide
13. On the Define the Query page, select SQL from the Query Language drop-down.
14. Enter this Query String to retrieve the labels and values to be displayed for this input control:
SELECT user_name, first_name, last_name FROM users
Figure 5-20 Query String Definition
15. Click Save.
16. For each row in the results of the query, the server presents a single value, such as Sarah Smith, inthe input type widget (drop-down, radio buttons, multi-choice, check boxes). On the QueryInformation page, name the database columns to comprise the input value presented to the user.The column names must match those in the SELECT clause of the query string exactly:
a. In the Value Column, enter the user_name.
b. In the Visible Column, enter first_name.
c. Click Add.
d. In the Visible Column, enter last_name.
e. Click Add.
For each visible column that you want to display as a choice, enter the name, then click Add.If you make a mistake, click Remove.
17. Click Submit.
The Controls & Resources page displays all the resources, including the new input controls. Figure5-21 on page 149 shows these resources.
Next, set the input control options, described in the next section.
5.3.2.6 Setting the Input Control Options
In this procedure, you set the display mode in Input Control Options at the bottom of the Controls &Resources page. These options only appear after you add an input control to the report. Figure 5-21 onpage 149 shows these options.
To configure the appearance of the input controls for the complex report example::
148
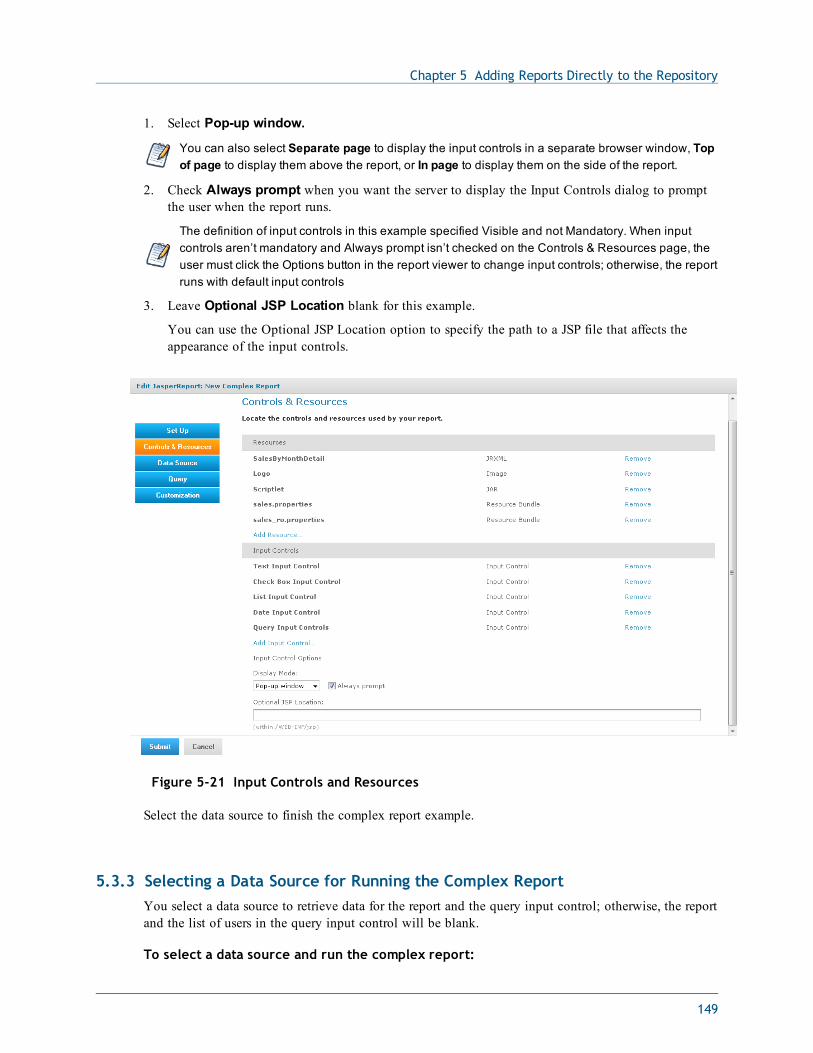
Chapter 5 Adding Reports Directly to the Repository
1. Select Pop-up window.
You can also select Separate page to display the input controls in a separate browser window, Topof page to display them above the report, or In page to display them on the side of the report.
2. Check Always prompt when you want the server to display the Input Controls dialog to promptthe user when the report runs.
The definition of input controls in this example specified Visible and not Mandatory. When inputcontrols aren’t mandatory and Always prompt isn’t checked on the Controls & Resources page, theuser must click the Options button in the report viewer to change input controls; otherwise, the reportruns with default input controls
3. Leave Optional JSP Location blank for this example.
You can use the Optional JSP Location option to specify the path to a JSP file that affects theappearance of the input controls.
Figure 5-21 Input Controls and Resources
Select the data source to finish the complex report example.
5.3.3 Selecting a Data Source for Running the Complex ReportYou select a data source to retrieve data for the report and the query input control; otherwise, the reportand the list of users in the query input control will be blank.
To select a data source and run the complex report:
149
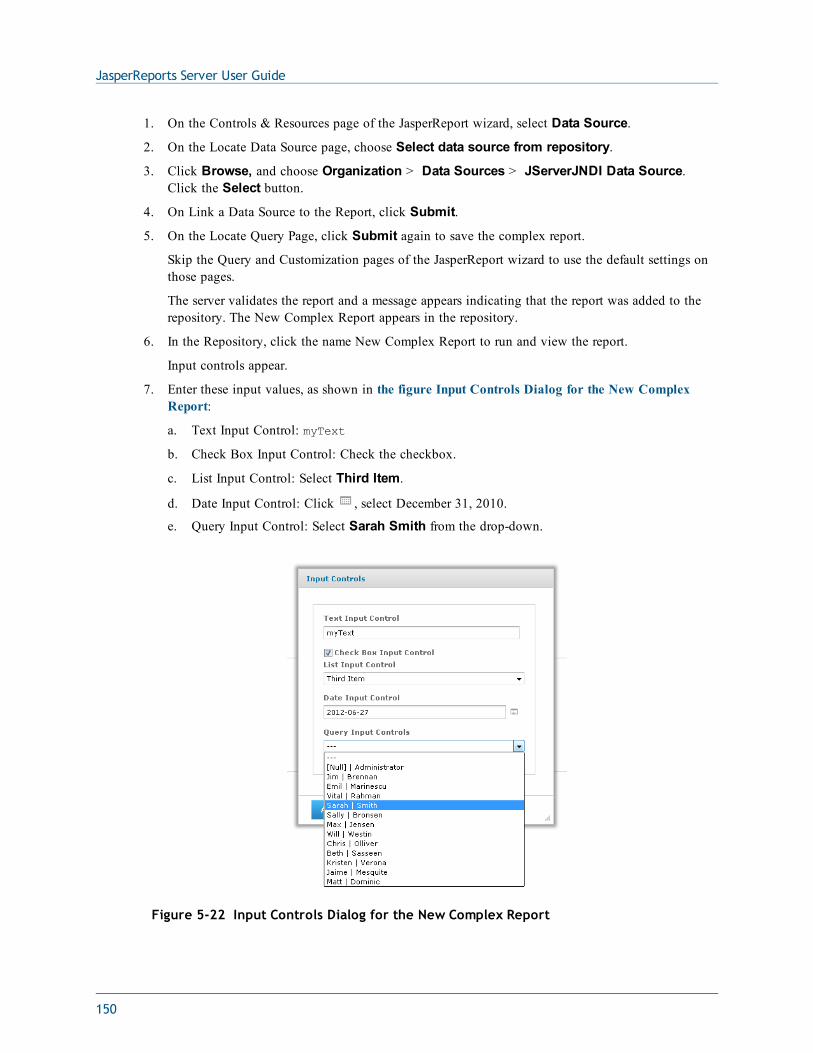
JasperReports Server User Guide
1. On the Controls & Resources page of the JasperReport wizard, select Data Source.
2. On the Locate Data Source page, choose Select data source from repository.
3. Click Browse, and choose Organization > Data Sources > JServerJNDI Data Source.Click the Select button.
4. On Link a Data Source to the Report, click Submit.
5. On the Locate Query Page, click Submit again to save the complex report.
Skip the Query and Customization pages of the JasperReport wizard to use the default settings onthose pages.
The server validates the report and a message appears indicating that the report was added to therepository. The New Complex Report appears in the repository.
6. In the Repository, click the name New Complex Report to run and view the report.
Input controls appear.
7. Enter these input values, as shown in the figure Input Controls Dialog for the New ComplexReport:
a. Text Input Control: myText
b. Check Box Input Control: Check the checkbox.
c. List Input Control: Select Third Item.
d. Date Input Control: Click , select December 31, 2010.
e. Query Input Control: Select Sarah Smith from the drop-down.
Figure 5-22 Input Controls Dialog for the New Complex Report
150
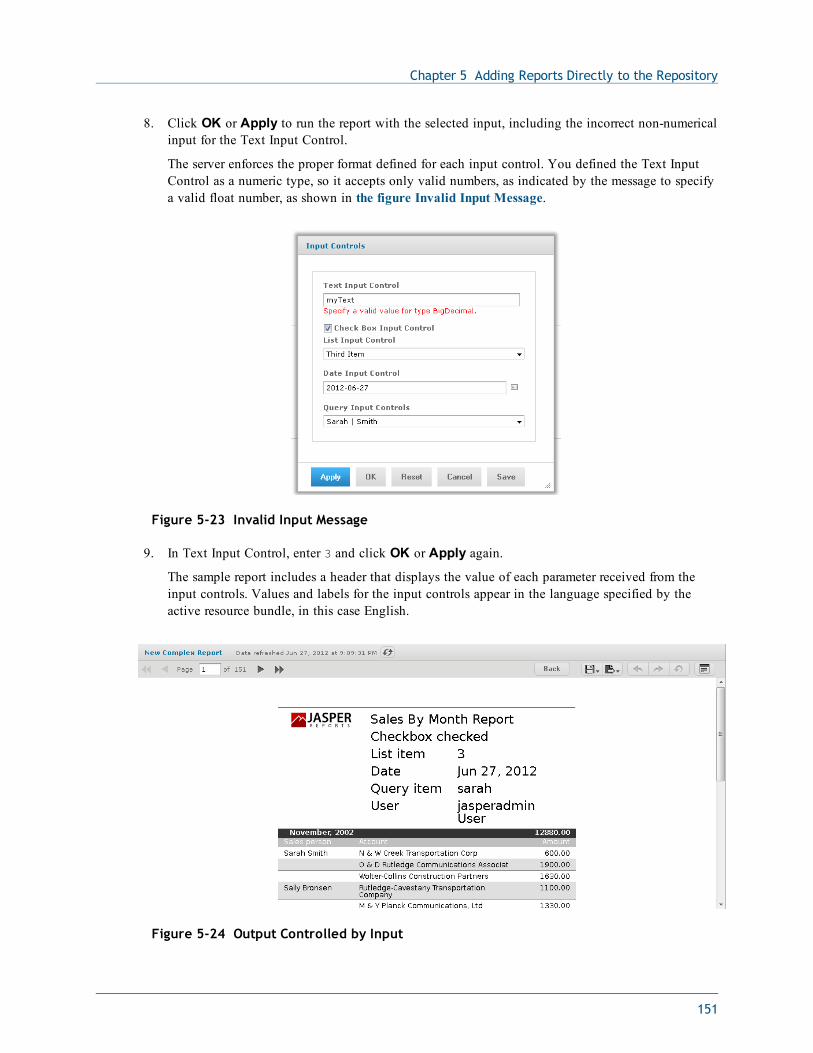
Chapter 5 Adding Reports Directly to the Repository
8. Click OK or Apply to run the report with the selected input, including the incorrect non-numericalinput for the Text Input Control.
The server enforces the proper format defined for each input control. You defined the Text InputControl as a numeric type, so it accepts only valid numbers, as indicated by the message to specifya valid float number, as shown in the figure Invalid Input Message.
Figure 5-23 Invalid Input Message
9. In Text Input Control, enter 3 and click OK or Apply again.
The sample report includes a header that displays the value of each parameter received from theinput controls. Values and labels for the input controls appear in the language specified by theactive resource bundle, in this case English.
Figure 5-24 Output Controlled by Input
151
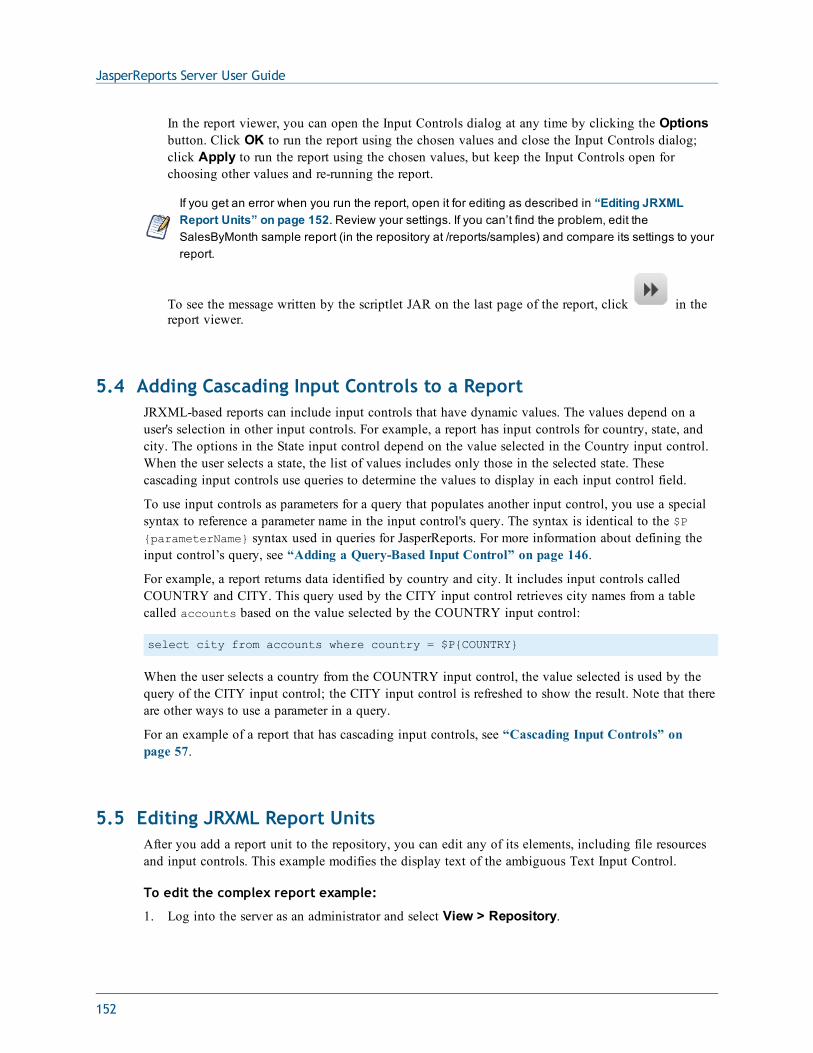
JasperReports Server User Guide
In the report viewer, you can open the Input Controls dialog at any time by clicking the Optionsbutton. Click OK to run the report using the chosen values and close the Input Controls dialog;click Apply to run the report using the chosen values, but keep the Input Controls open forchoosing other values and re-running the report.
If you get an error when you run the report, open it for editing as described in “Editing JRXMLReport Units” on page 152. Review your settings. If you can’t find the problem, edit theSalesByMonth sample report (in the repository at /reports/samples) and compare its settings to yourreport.
To see the message written by the scriptlet JAR on the last page of the report, click in thereport viewer.
5.4 Adding Cascading Input Controls to a ReportJRXML-based reports can include input controls that have dynamic values. The values depend on auser's selection in other input controls. For example, a report has input controls for country, state, andcity. The options in the State input control depend on the value selected in the Country input control.When the user selects a state, the list of values includes only those in the selected state. Thesecascading input controls use queries to determine the values to display in each input control field.
To use input controls as parameters for a query that populates another input control, you use a specialsyntax to reference a parameter name in the input control's query. The syntax is identical to the $P{parameterName} syntax used in queries for JasperReports. For more information about defining theinput control’s query, see “Adding a Query-Based Input Control” on page 146.
For example, a report returns data identified by country and city. It includes input controls calledCOUNTRY and CITY. This query used by the CITY input control retrieves city names from a tablecalled accounts based on the value selected by the COUNTRY input control:
select city from accounts where country = $P{COUNTRY}
When the user selects a country from the COUNTRY input control, the value selected is used by thequery of the CITY input control; the CITY input control is refreshed to show the result. Note that thereare other ways to use a parameter in a query.
For an example of a report that has cascading input controls, see “Cascading Input Controls” onpage 57.
5.5 Editing JRXML Report UnitsAfter you add a report unit to the repository, you can edit any of its elements, including file resourcesand input controls. This example modifies the display text of the ambiguous Text Input Control.
To edit the complex report example:
1. Log into the server as an administrator and select View > Repository.
152
Chapter 5 Adding Reports Directly to the Repository
If you log in as a user, you can edit a report that you created. This example requires an administratorlogin because an administrator created the complex report.
2. Search or browse the repository to locate the report. In this example, go to Organization >Reports > Samples.
3. Right-click the New Complex Report and select Edit from the context menu.
The JasperReport wizard opens the report unit.
4. Navigate to the page of the wizard for making the change; in this example, click Controls &Resources.
5. Make changes to an input control prompt and the display mode of the input controls, for example:
a. Click the name of the TextInput control.
The Locate Input Control page shows that this input control is locally defined.
b. Click Next.
The Create Input Control page appears.
c. Change the contents of the Prompt Text field to Enter a number. Click Next.
The Locate Datatypes page appears. You can select a different datatype from the repository.For this example, accept the existing datatype setting.
d. In Locate Datatypes, click Next.
e. In Set the Datatype Kind and Properties, click Save to accept the datatype property settings.
6. On the Controls & Resources page:
a. Change the Display Mode to In Page.
b. Clear the Always prompt check box.
c. Click Submit.
7. Run the New Complex Report again.
Instead of appearing in a pop-up before the report; the input controls appear in the Options panelof the report. In the figure Output of the Modified Report, you can see the new prompt, Enter anumber, for the text input control. Because none of the input controls in this example arerequired, the report can display with blank input controls. Enter values and click Apply to modifythe report output according to your input.
153
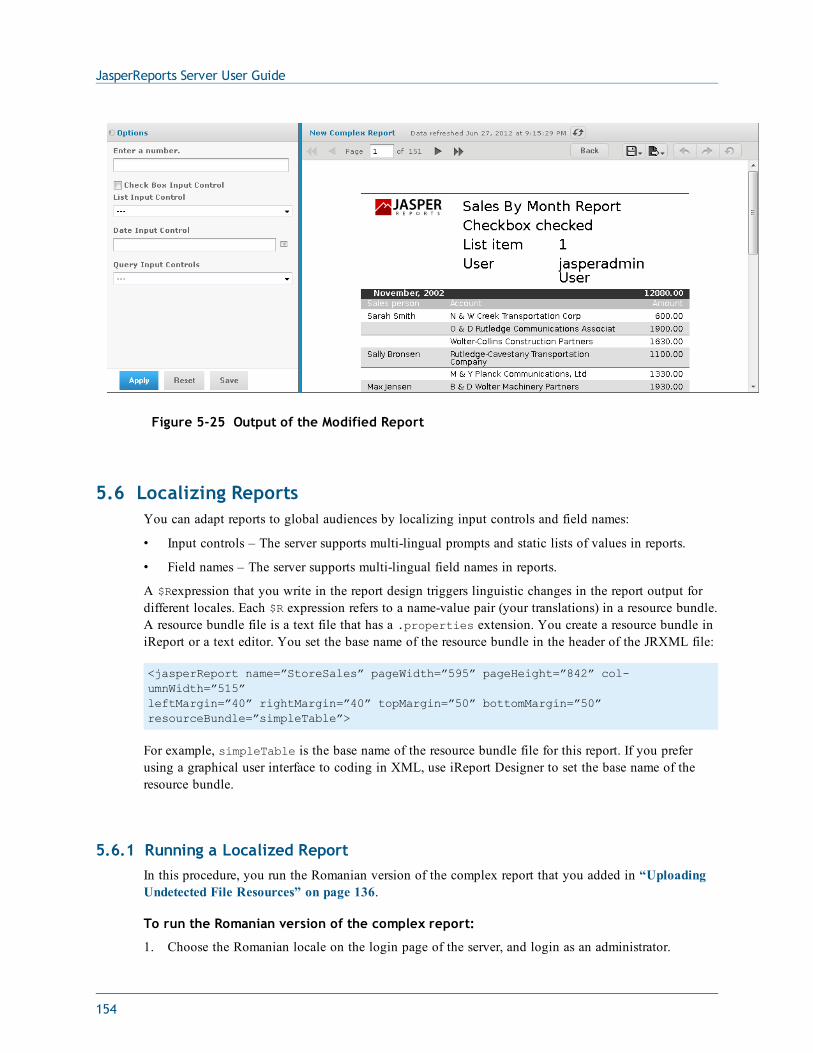
JasperReports Server User Guide
Figure 5-25 Output of the Modified Report
5.6 Localizing ReportsYou can adapt reports to global audiences by localizing input controls and field names:
• Input controls – The server supports multi-lingual prompts and static lists of values in reports.
• Field names – The server supports multi-lingual field names in reports.
A $Rexpression that you write in the report design triggers linguistic changes in the report output fordifferent locales. Each $R expression refers to a name-value pair (your translations) in a resource bundle.A resource bundle file is a text file that has a .properties extension. You create a resource bundle iniReport or a text editor. You set the base name of the resource bundle in the header of the JRXML file:
<jasperReport name=”StoreSales” pageWidth=”595” pageHeight=”842” col-umnWidth=”515”leftMargin=”40” rightMargin=”40” topMargin=”50” bottomMargin=”50”resourceBundle=”simpleTable”>
For example, simpleTable is the base name of the resource bundle file for this report. If you preferusing a graphical user interface to coding in XML, use iReport Designer to set the base name of theresource bundle.
5.6.1 Running a Localized ReportIn this procedure, you run the Romanian version of the complex report that you added in “UploadingUndetected File Resources” on page 136.
To run the Romanian version of the complex report:
1. Choose the Romanian locale on the login page of the server, and login as an administrator.
154
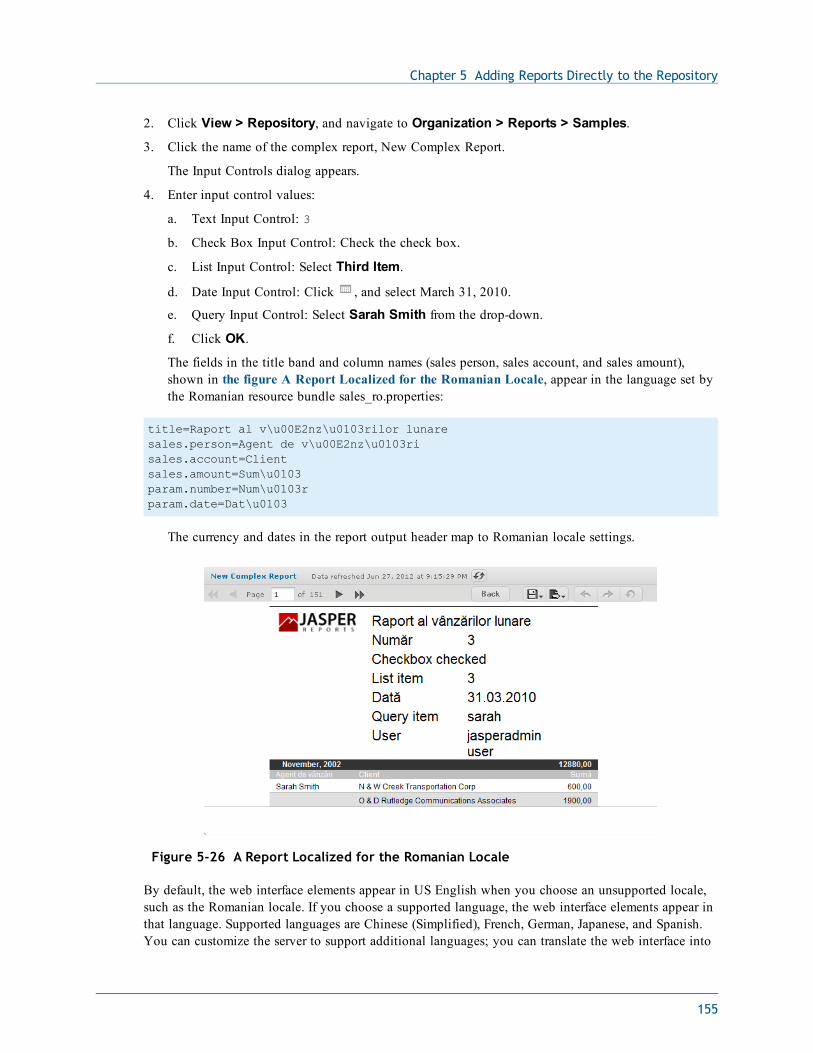
Chapter 5 Adding Reports Directly to the Repository
2. Click View > Repository, and navigate to Organization > Reports > Samples.
3. Click the name of the complex report, New Complex Report.
The Input Controls dialog appears.
4. Enter input control values:
a. Text Input Control: 3
b. Check Box Input Control: Check the check box.
c. List Input Control: Select Third Item.
d. Date Input Control: Click , and select March 31, 2010.
e. Query Input Control: Select Sarah Smith from the drop-down.
f. Click OK.
The fields in the title band and column names (sales person, sales account, and sales amount),shown in the figure A Report Localized for the Romanian Locale, appear in the language set bythe Romanian resource bundle sales_ro.properties:
title=Raport al v\u00E2nz\u0103rilor lunaresales.person=Agent de v\u00E2nz\u0103risales.account=Clientsales.amount=Sum\u0103param.number=Num\u0103rparam.date=Dat\u0103
The currency and dates in the report output header map to Romanian locale settings.
Figure 5-26 A Report Localized for the Romanian Locale
By default, the web interface elements appear in US English when you choose an unsupported locale,such as the Romanian locale. If you choose a supported language, the web interface elements appear inthat language. Supported languages are Chinese (Simplified), French, German, Japanese, and Spanish.You can customize the server to support additional languages; you can translate the web interface into
155
JasperReports Server User Guide
a different language, server property names, and messages in another language. For some locales, youmay also need to change the default locale and time zone. For more information about localizing theserver, see the JasperReports Server Administrator Guide.
5.6.2 Adding Multi-lingual Prompts to Input ControlsThis section describes how to create an Ad Hoc report that prompts for input multiple languages. Thetasks are:
• Set the base name of the resource bundles in the JRXML Topic.
• Create resource bundles that contain translations for the prompts.
• Create an Ad Hoc report based on the JRXML Topic.
• Edit an input control to make prompts multi-lingual.
• Upload the resource bundles.
• Run the report and use the localized input control.
The order of these tasks is important: Set the base name of the resource bundle in the JRXML Topicfirst, then create the Ad Hoc report. If you open the JRXML Topic after creating an Ad Hoc report,iReport removes grouping or sorting of data if there is any.
To set the base name of the resource bundles in the JRXML Topic:
1. Start iReport. In iReport, click Window > JasperReports Server Repository.
The Repository Navigator appears.
2. In the Repository Navigator, set up a connection to the server as described in “Accessing Reportsand Domains from iReport” on page 221.
3. Navigate to Ad Hoc Components > Topics and right-click the JRXML topic for this report:Parametrized Report.
4. Select Copy.
5. Navigate to the Reports folder, right-click, and select Paste. The Parametrized Report topicappears in Reports.
6. To open the topic in the Designer tab, expand the Parametrized Report folder and double-click itsmain JRXML: ParametersJRXML_label. The Shipping Report appears in the Designer tab.
7. Click Window > Report Inspector.
8. In the Report Inspector, right-click the root node: ParamMany.
In the main JRXML, ParamMany is the report name.
9. From the context menu, choose Properties.
In the figure Selecting Properties of the ParamMany report, you can see the ParamMany rootnode and Properties context menu.
156
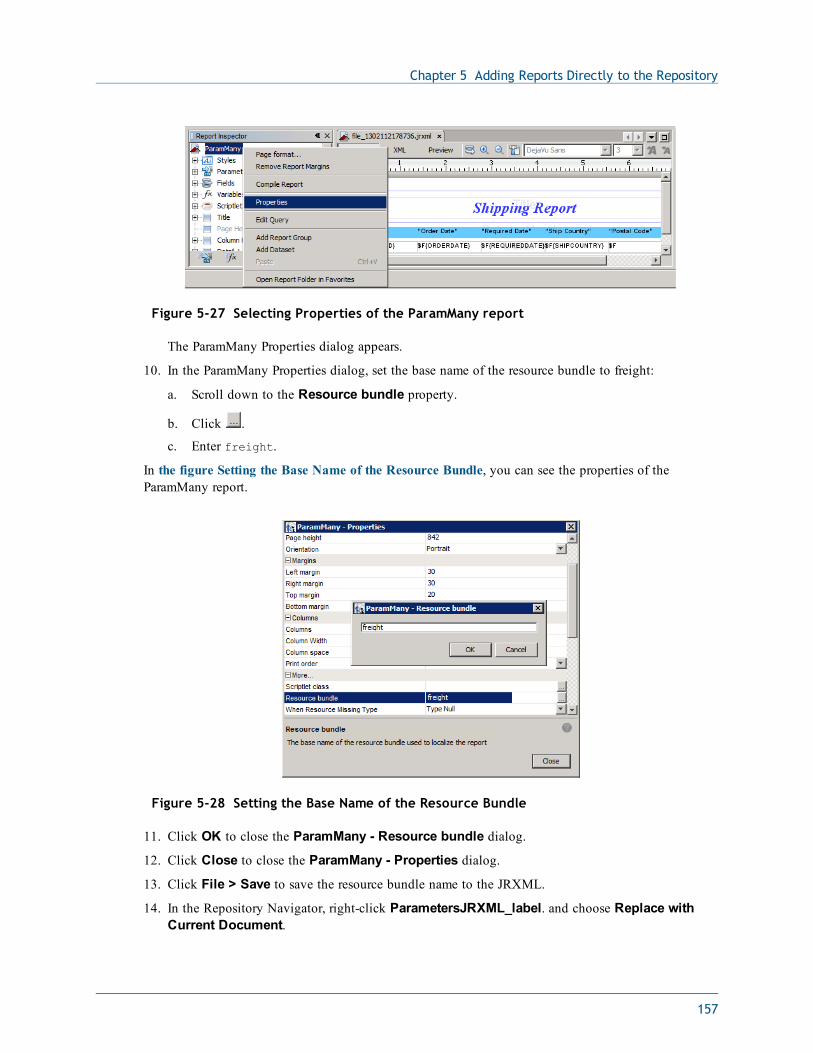
Chapter 5 Adding Reports Directly to the Repository
Figure 5-27 Selecting Properties of the ParamMany report
The ParamMany Properties dialog appears.
10. In the ParamMany Properties dialog, set the base name of the resource bundle to freight:
a. Scroll down to the Resource bundle property.
b. Click .
c. Enter freight.
In the figure Setting the Base Name of the Resource Bundle, you can see the properties of theParamMany report.
Figure 5-28 Setting the Base Name of the Resource Bundle
11. Click OK to close the ParamMany - Resource bundle dialog.
12. Click Close to close the ParamMany - Properties dialog.
13. Click File > Save to save the resource bundle name to the JRXML.
14. In the Repository Navigator, right-click ParametersJRXML_label. and choose Replace withCurrent Document.
157
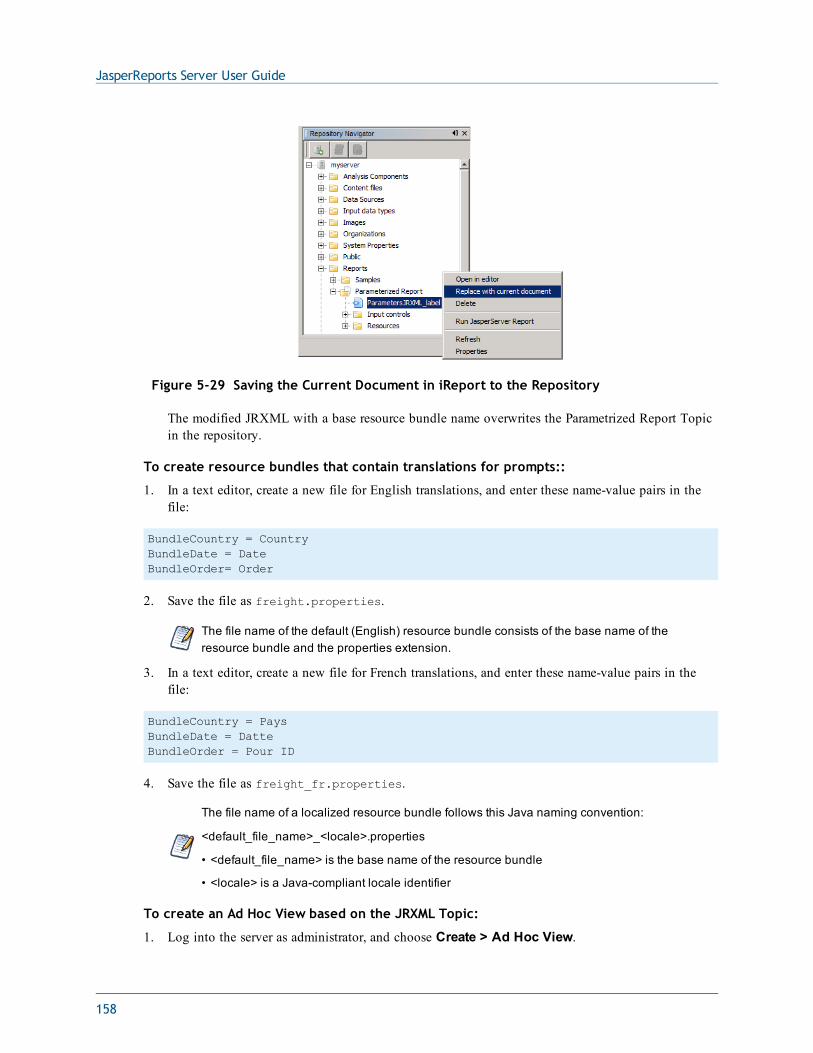
JasperReports Server User Guide
Figure 5-29 Saving the Current Document in iReport to the Repository
The modified JRXML with a base resource bundle name overwrites the Parametrized Report Topicin the repository.
To create resource bundles that contain translations for prompts::
1. In a text editor, create a new file for English translations, and enter these name-value pairs in thefile:
BundleCountry = CountryBundleDate = DateBundleOrder= Order
2. Save the file as freight.properties.
The file name of the default (English) resource bundle consists of the base name of theresource bundle and the properties extension.
3. In a text editor, create a new file for French translations, and enter these name-value pairs in thefile:
BundleCountry = PaysBundleDate = DatteBundleOrder = Pour ID
4. Save the file as freight_fr.properties.
The file name of a localized resource bundle follows this Java naming convention:
<default_file_name>_<locale>.properties
• <default_file_name> is the base name of the resource bundle
• <locale> is a Java-compliant locale identifier
To create an Ad Hoc View based on the JRXML Topic:
1. Log into the server as administrator, and choose Create > Ad Hoc View.
158
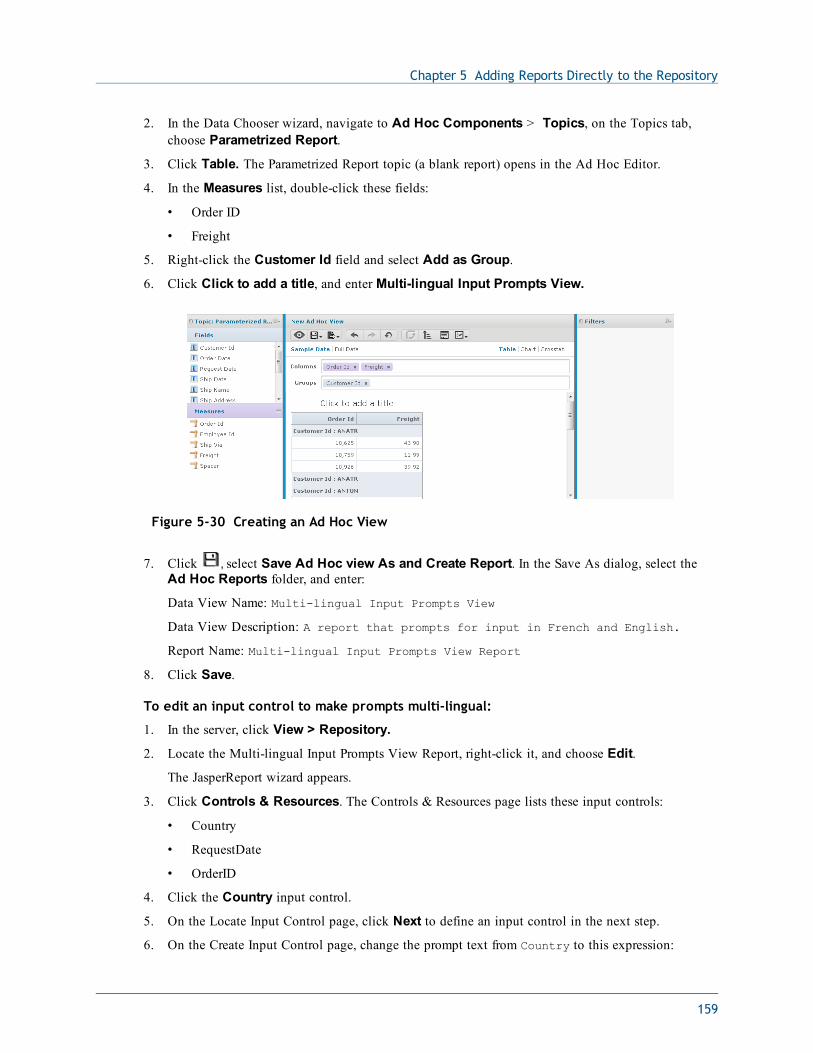
Chapter 5 Adding Reports Directly to the Repository
2. In the Data Chooser wizard, navigate to Ad Hoc Components > Topics, on the Topics tab,choose Parametrized Report.
3. Click Table. The Parametrized Report topic (a blank report) opens in the Ad Hoc Editor.
4. In the Measures list, double-click these fields:
• Order ID
• Freight
5. Right-click the Customer Id field and select Add as Group.
6. Click Click to add a title, and enter Multi-lingual Input Prompts View.
Figure 5-30 Creating an Ad Hoc View
7. Click , select Save Ad Hoc view As and Create Report. In the Save As dialog, select theAd Hoc Reports folder, and enter:
Data View Name: Multi-lingual Input Prompts View
Data View Description: A report that prompts for input in French and English.
Report Name: Multi-lingual Input Prompts View Report
8. Click Save.
To edit an input control to make prompts multi-lingual:
1. In the server, click View > Repository.
2. Locate the Multi-lingual Input Prompts View Report, right-click it, and choose Edit.
The JasperReport wizard appears.
3. Click Controls & Resources. The Controls & Resources page lists these input controls:
• Country
• RequestDate
• OrderID
4. Click the Country input control.
5. On the Locate Input Control page, click Next to define an input control in the next step.
6. On the Create Input Control page, change the prompt text from Country to this expression:
159
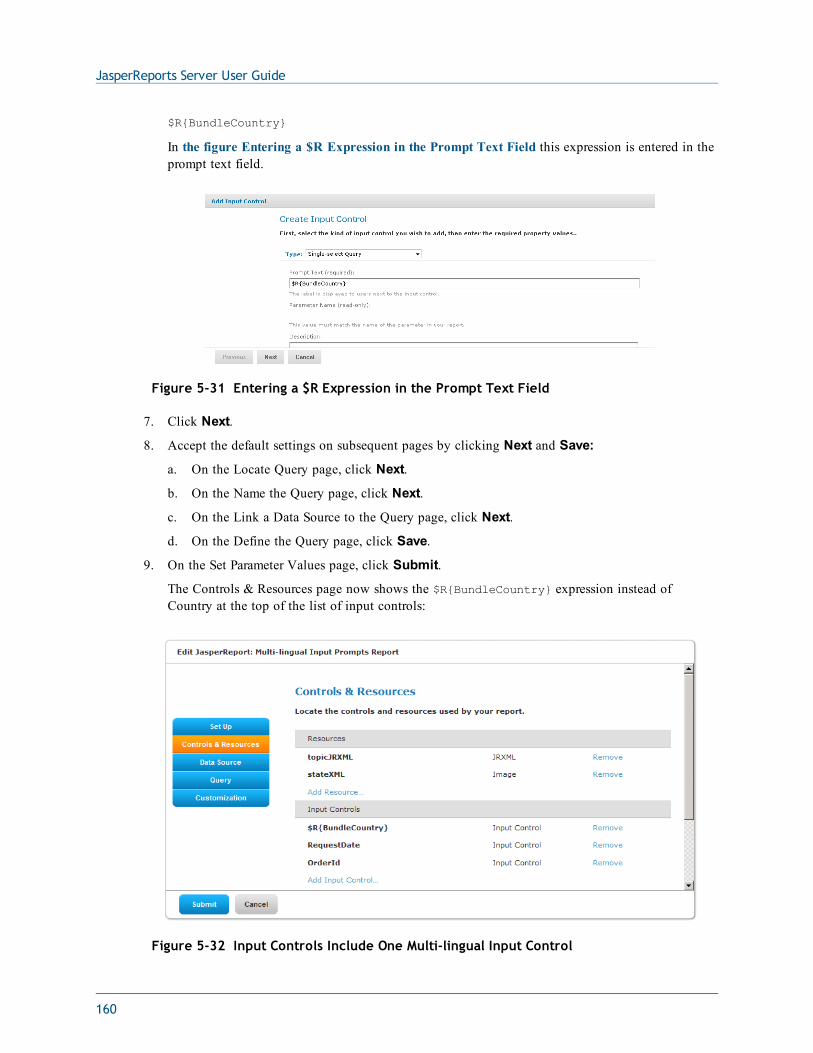
JasperReports Server User Guide
$R{BundleCountry}
In the figure Entering a $R Expression in the Prompt Text Field this expression is entered in theprompt text field.
Figure 5-31 Entering a $R Expression in the Prompt Text Field
7. Click Next.
8. Accept the default settings on subsequent pages by clicking Next and Save:
a. On the Locate Query page, click Next.
b. On the Name the Query page, click Next.
c. On the Link a Data Source to the Query page, click Next.
d. On the Define the Query page, click Save.
9. On the Set Parameter Values page, click Submit.
The Controls & Resources page now shows the $R{BundleCountry} expression instead ofCountry at the top of the list of input controls:
Figure 5-32 Input Controls Include One Multi-lingual Input Control
160
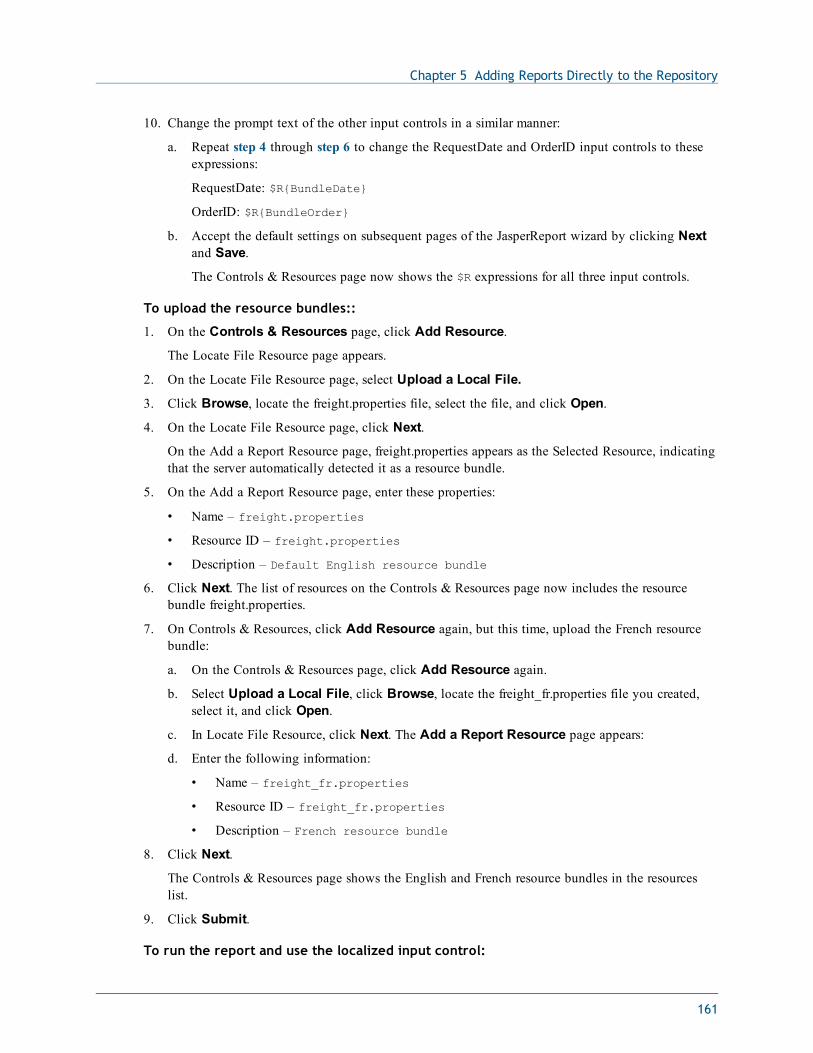
Chapter 5 Adding Reports Directly to the Repository
10. Change the prompt text of the other input controls in a similar manner:
a. Repeat step 4 through step 6 to change the RequestDate and OrderID input controls to theseexpressions:
RequestDate: $R{BundleDate}
OrderID: $R{BundleOrder}
b. Accept the default settings on subsequent pages of the JasperReport wizard by clicking Nextand Save.
The Controls & Resources page now shows the $R expressions for all three input controls.
To upload the resource bundles::
1. On the Controls & Resources page, click Add Resource.
The Locate File Resource page appears.
2. On the Locate File Resource page, select Upload a Local File.
3. Click Browse, locate the freight.properties file, select the file, and click Open.
4. On the Locate File Resource page, click Next.
On the Add a Report Resource page, freight.properties appears as the Selected Resource, indicatingthat the server automatically detected it as a resource bundle.
5. On the Add a Report Resource page, enter these properties:
• Name – freight.properties
• Resource ID – freight.properties
• Description – Default English resource bundle
6. Click Next. The list of resources on the Controls & Resources page now includes the resourcebundle freight.properties.
7. On Controls & Resources, click Add Resource again, but this time, upload the French resourcebundle:
a. On the Controls & Resources page, click Add Resource again.
b. Select Upload a Local File, click Browse, locate the freight_fr.properties file you created,select it, and click Open.
c. In Locate File Resource, click Next. The Add a Report Resource page appears:
d. Enter the following information:
• Name – freight_fr.properties
• Resource ID – freight_fr.properties
• Description – French resource bundle
8. Click Next.
The Controls & Resources page shows the English and French resource bundles in the resourceslist.
9. Click Submit.
To run the report and use the localized input control:
161
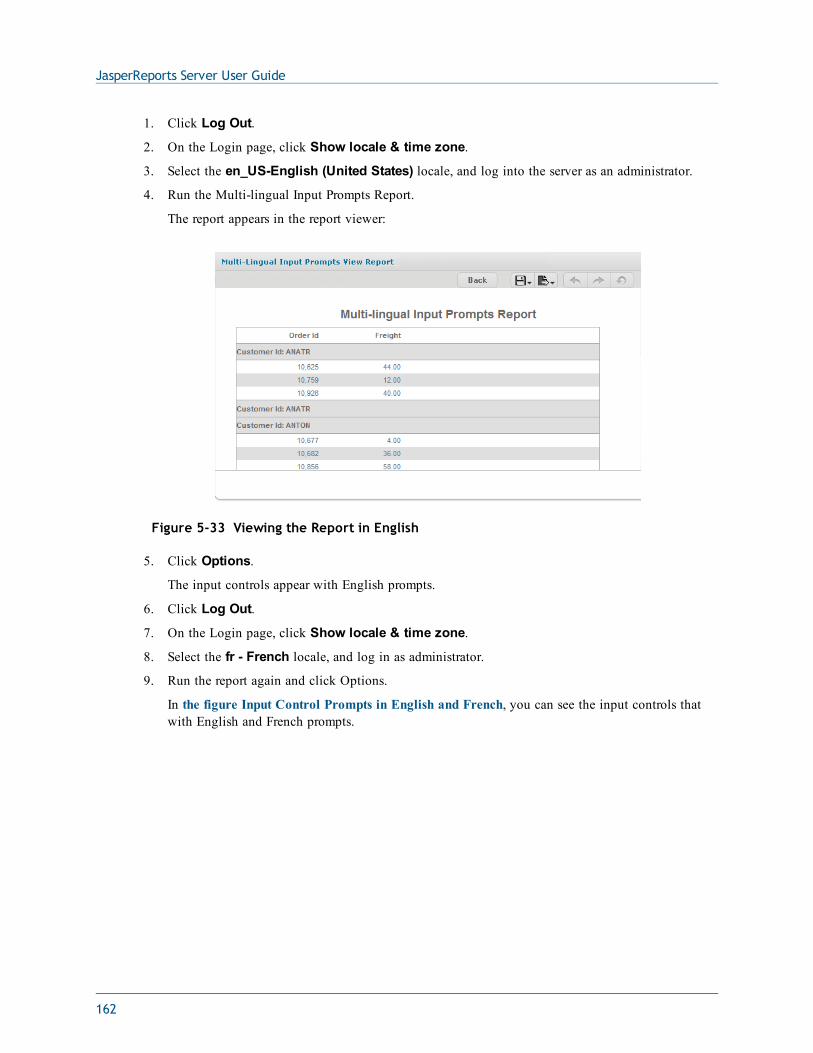
JasperReports Server User Guide
1. Click Log Out.
2. On the Login page, click Show locale & time zone.
3. Select the en_US-English (United States) locale, and log into the server as an administrator.
4. Run the Multi-lingual Input Prompts Report.
The report appears in the report viewer:
Figure 5-33 Viewing the Report in English
5. Click Options.
The input controls appear with English prompts.
6. Click Log Out.
7. On the Login page, click Show locale & time zone.
8. Select the fr - French locale, and log in as administrator.
9. Run the report again and click Options.
In the figure Input Control Prompts in English and French, you can see the input controls thatwith English and French prompts.
162
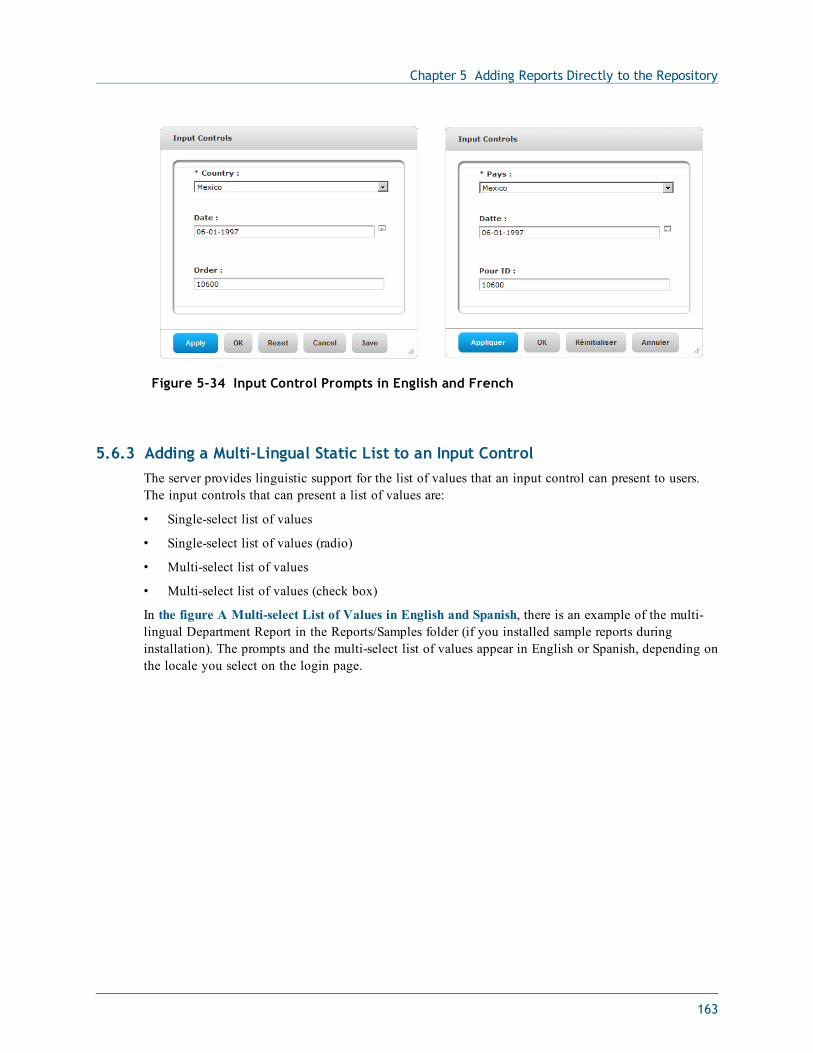
Chapter 5 Adding Reports Directly to the Repository
Figure 5-34 Input Control Prompts in English and French
5.6.3 Adding a Multi-Lingual Static List to an Input ControlThe server provides linguistic support for the list of values that an input control can present to users.The input controls that can present a list of values are:
• Single-select list of values
• Single-select list of values (radio)
• Multi-select list of values
• Multi-select list of values (check box)
In the figure A Multi-select List of Values in English and Spanish, there is an example of the multi-lingual Department Report in the Reports/Samples folder (if you installed sample reports duringinstallation). The prompts and the multi-select list of values appear in English or Spanish, depending onthe locale you select on the login page.
163
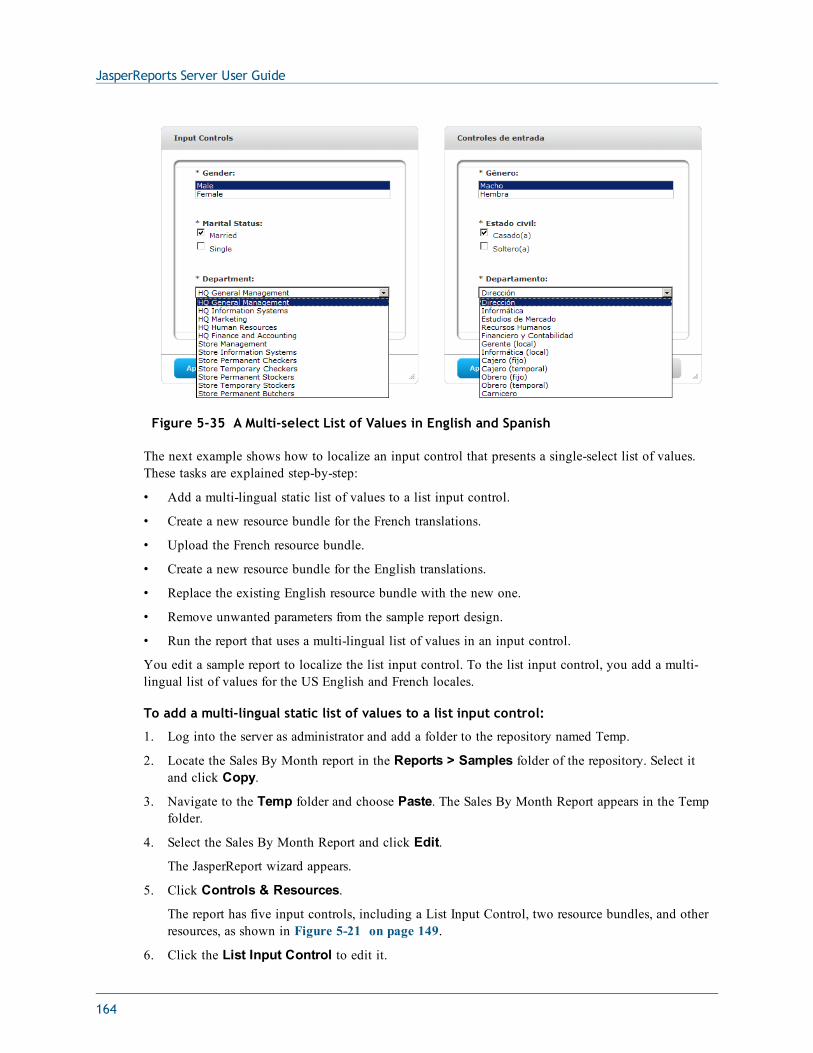
JasperReports Server User Guide
Figure 5-35 A Multi-select List of Values in English and Spanish
The next example shows how to localize an input control that presents a single-select list of values.These tasks are explained step-by-step:
• Add a multi-lingual static list of values to a list input control.
• Create a new resource bundle for the French translations.
• Upload the French resource bundle.
• Create a new resource bundle for the English translations.
• Replace the existing English resource bundle with the new one.
• Remove unwanted parameters from the sample report design.
• Run the report that uses a multi-lingual list of values in an input control.
You edit a sample report to localize the list input control. To the list input control, you add a multi-lingual list of values for the US English and French locales.
To add a multi-lingual static list of values to a list input control:
1. Log into the server as administrator and add a folder to the repository named Temp.
2. Locate the Sales By Month report in the Reports > Samples folder of the repository. Select itand click Copy.
3. Navigate to the Temp folder and choose Paste. The Sales By Month Report appears in the Tempfolder.
4. Select the Sales By Month Report and click Edit.
The JasperReport wizard appears.
5. Click Controls & Resources.
The report has five input controls, including a List Input Control, two resource bundles, and otherresources, as shown in Figure 5-21 on page 149.
6. Click the List Input Control to edit it.
164
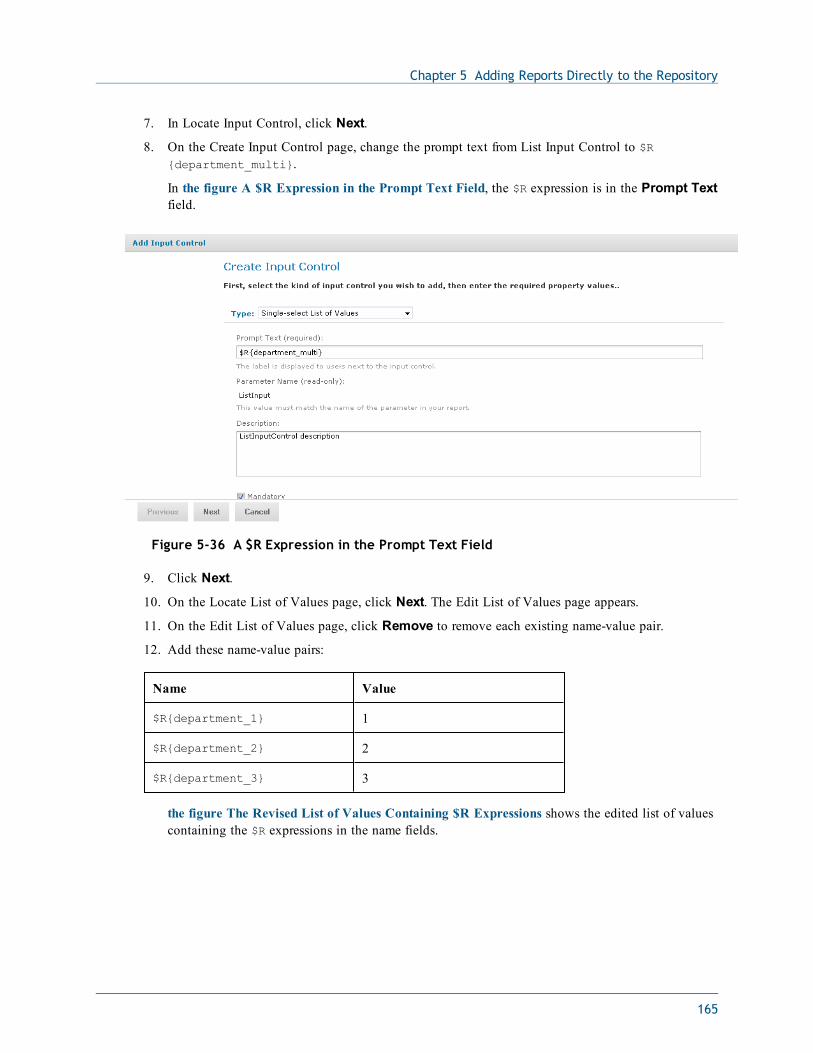
Chapter 5 Adding Reports Directly to the Repository
7. In Locate Input Control, click Next.
8. On the Create Input Control page, change the prompt text from List Input Control to $R{department_multi}.
In the figure A $R Expression in the Prompt Text Field, the $R expression is in the Prompt Textfield.
Figure 5-36 A $R Expression in the Prompt Text Field
9. Click Next.
10. On the Locate List of Values page, click Next. The Edit List of Values page appears.
11. On the Edit List of Values page, click Remove to remove each existing name-value pair.
12. Add these name-value pairs:
Name Value
$R{department_1} 1
$R{department_2} 2
$R{department_3} 3
the figure The Revised List of Values Containing $R Expressions shows the edited list of valuescontaining the $R expressions in the name fields.
165
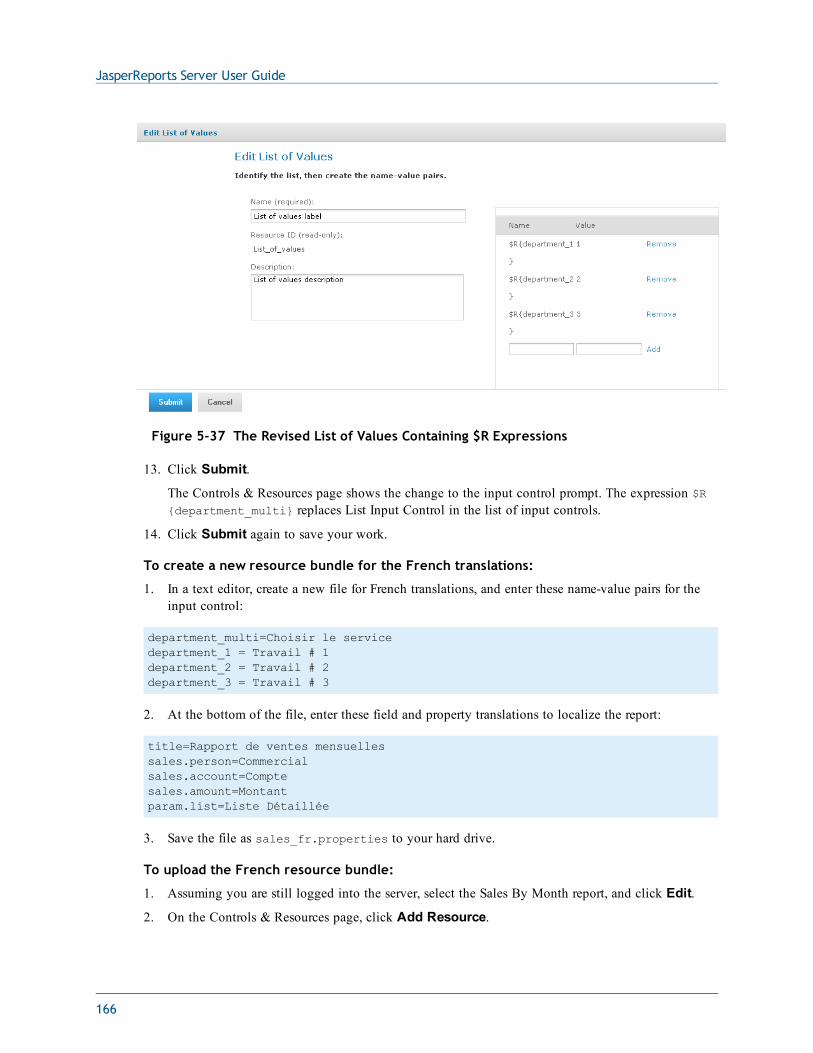
JasperReports Server User Guide
Figure 5-37 The Revised List of Values Containing $R Expressions
13. Click Submit.
The Controls & Resources page shows the change to the input control prompt. The expression $R{department_multi} replaces List Input Control in the list of input controls.
14. Click Submit again to save your work.
To create a new resource bundle for the French translations:
1. In a text editor, create a new file for French translations, and enter these name-value pairs for theinput control:
department_multi=Choisir le servicedepartment_1 = Travail # 1department_2 = Travail # 2department_3 = Travail # 3
2. At the bottom of the file, enter these field and property translations to localize the report:
title=Rapport de ventes mensuellessales.person=Commercialsales.account=Comptesales.amount=Montantparam.list=Liste Détaillée
3. Save the file as sales_fr.properties to your hard drive.
To upload the French resource bundle:
1. Assuming you are still logged into the server, select the Sales By Month report, and click Edit.
2. On the Controls & Resources page, click Add Resource.
166
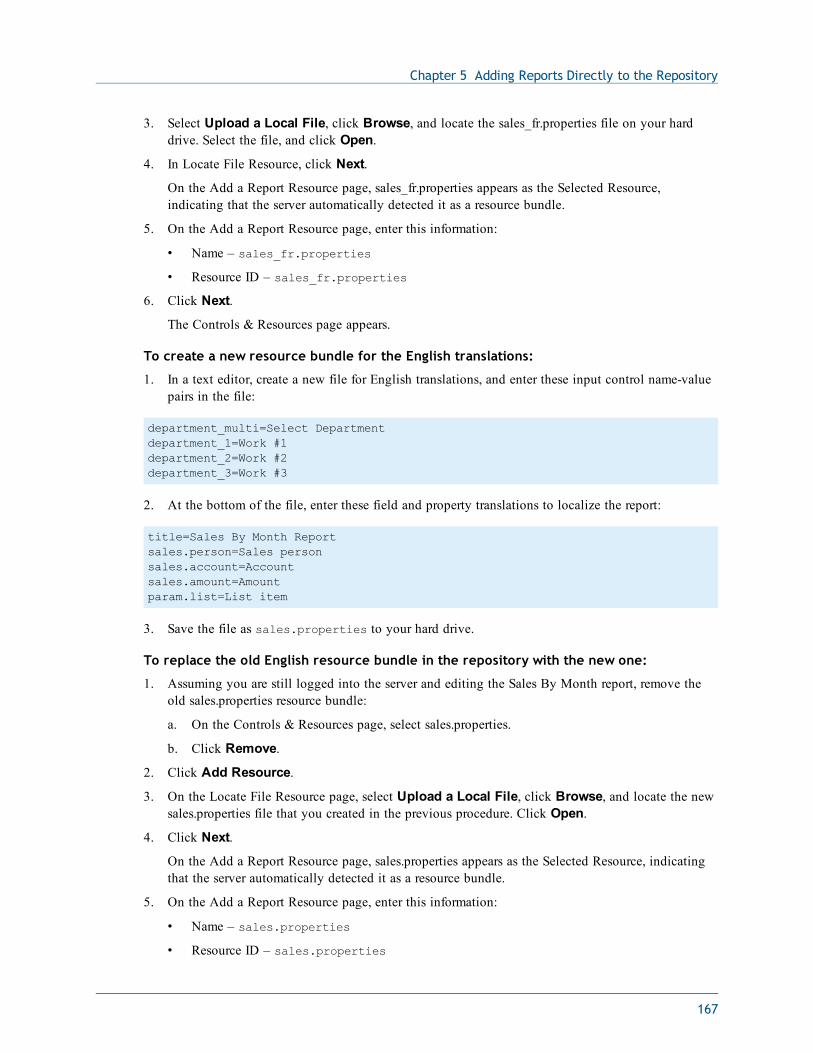
Chapter 5 Adding Reports Directly to the Repository
3. Select Upload a Local File, click Browse, and locate the sales_fr.properties file on your harddrive. Select the file, and click Open.
4. In Locate File Resource, click Next.
On the Add a Report Resource page, sales_fr.properties appears as the Selected Resource,indicating that the server automatically detected it as a resource bundle.
5. On the Add a Report Resource page, enter this information:
• Name – sales_fr.properties
• Resource ID – sales_fr.properties
6. Click Next.
The Controls & Resources page appears.
To create a new resource bundle for the English translations:
1. In a text editor, create a new file for English translations, and enter these input control name-valuepairs in the file:
department_multi=Select Departmentdepartment_1=Work #1department_2=Work #2department_3=Work #3
2. At the bottom of the file, enter these field and property translations to localize the report:
title=Sales By Month Reportsales.person=Sales personsales.account=Accountsales.amount=Amountparam.list=List item
3. Save the file as sales.properties to your hard drive.
To replace the old English resource bundle in the repository with the new one:
1. Assuming you are still logged into the server and editing the Sales By Month report, remove theold sales.properties resource bundle:
a. On the Controls & Resources page, select sales.properties.
b. Click Remove.
2. Click Add Resource.
3. On the Locate File Resource page, select Upload a Local File, click Browse, and locate the newsales.properties file that you created in the previous procedure. Click Open.
4. Click Next.
On the Add a Report Resource page, sales.properties appears as the Selected Resource, indicatingthat the server automatically detected it as a resource bundle.
5. On the Add a Report Resource page, enter this information:
• Name – sales.properties
• Resource ID – sales.properties
167
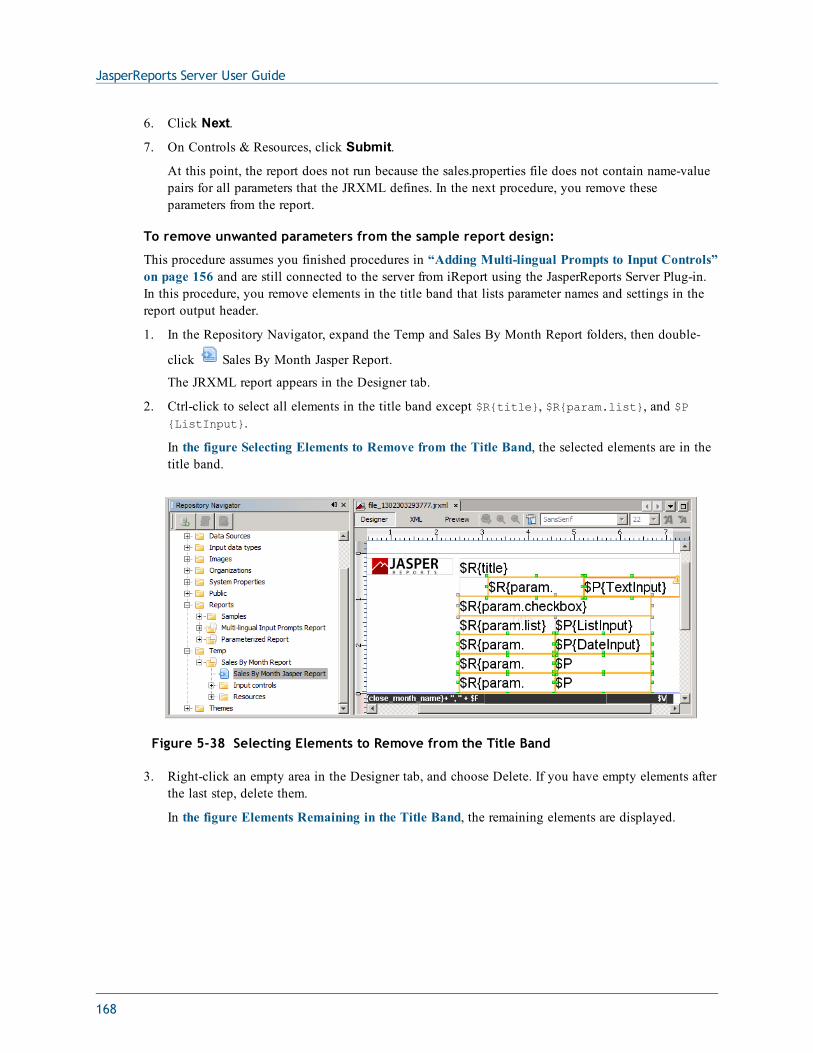
JasperReports Server User Guide
6. Click Next.
7. On Controls & Resources, click Submit.
At this point, the report does not run because the sales.properties file does not contain name-valuepairs for all parameters that the JRXML defines. In the next procedure, you remove theseparameters from the report.
To remove unwanted parameters from the sample report design:
This procedure assumes you finished procedures in “Adding Multi-lingual Prompts to Input Controls”on page 156 and are still connected to the server from iReport using the JasperReports Server Plug-in.In this procedure, you remove elements in the title band that lists parameter names and settings in thereport output header.
1. In the Repository Navigator, expand the Temp and Sales By Month Report folders, then double-
click Sales By Month Jasper Report.
The JRXML report appears in the Designer tab.
2. Ctrl-click to select all elements in the title band except $R{title}, $R{param.list}, and $P{ListInput}.
In the figure Selecting Elements to Remove from the Title Band, the selected elements are in thetitle band.
Figure 5-38 Selecting Elements to Remove from the Title Band
3. Right-click an empty area in the Designer tab, and choose Delete. If you have empty elements afterthe last step, delete them.
In the figure Elements Remaining in the Title Band, the remaining elements are displayed.
168
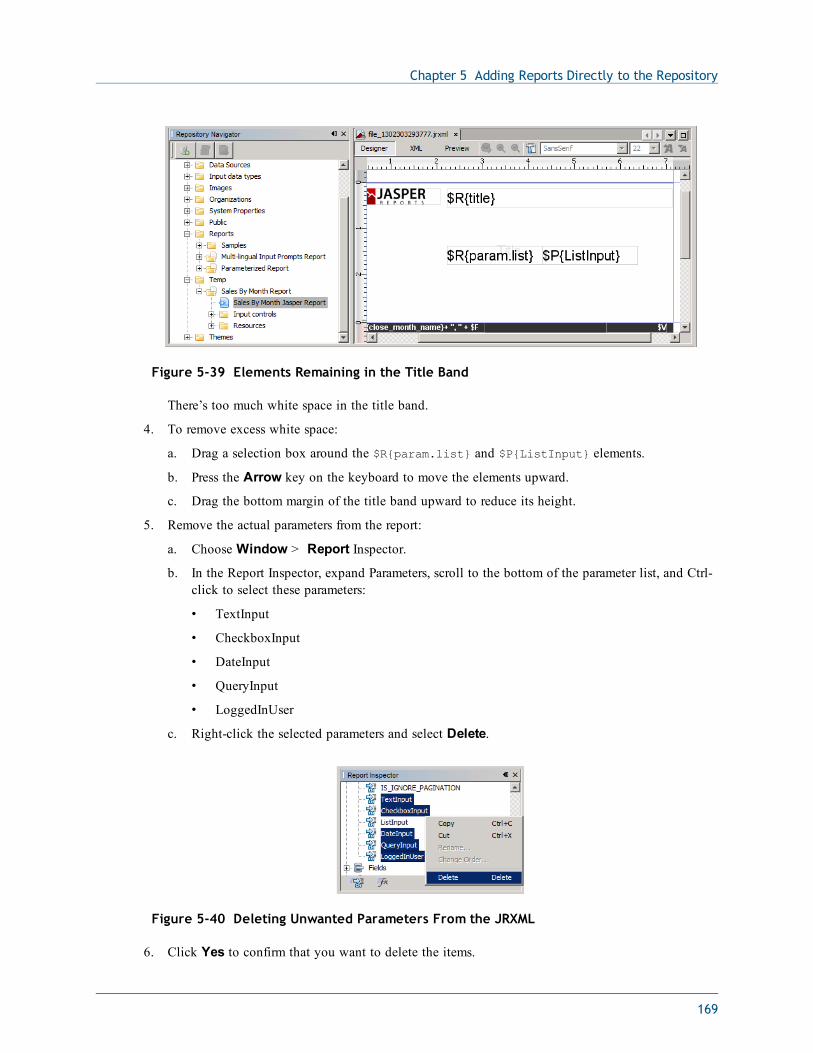
Chapter 5 Adding Reports Directly to the Repository
Figure 5-39 Elements Remaining in the Title Band
There’s too much white space in the title band.
4. To remove excess white space:
a. Drag a selection box around the $R{param.list} and $P{ListInput} elements.
b. Press the Arrow key on the keyboard to move the elements upward.
c. Drag the bottom margin of the title band upward to reduce its height.
5. Remove the actual parameters from the report:
a. Choose Window > Report Inspector.
b. In the Report Inspector, expand Parameters, scroll to the bottom of the parameter list, and Ctrl-click to select these parameters:
• TextInput
• CheckboxInput
• DateInput
• QueryInput
• LoggedInUser
c. Right-click the selected parameters and select Delete.
Figure 5-40 Deleting Unwanted Parameters From the JRXML
6. Click Yes to confirm that you want to delete the items.
169
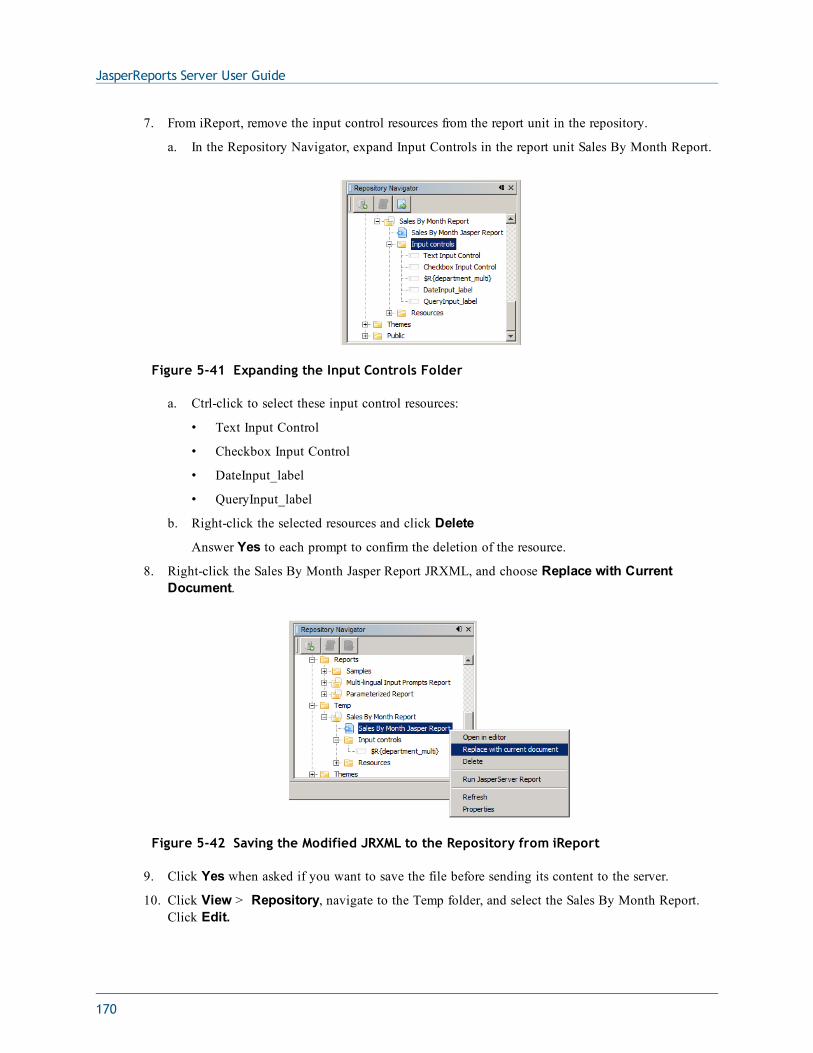
JasperReports Server User Guide
7. From iReport, remove the input control resources from the report unit in the repository.
a. In the Repository Navigator, expand Input Controls in the report unit Sales By Month Report.
Figure 5-41 Expanding the Input Controls Folder
a. Ctrl-click to select these input control resources:
• Text Input Control
• Checkbox Input Control
• DateInput_label
• QueryInput_label
b. Right-click the selected resources and click Delete
Answer Yes to each prompt to confirm the deletion of the resource.
8. Right-click the Sales By Month Jasper Report JRXML, and choose Replace with CurrentDocument.
Figure 5-42 Saving the Modified JRXML to the Repository from iReport
9. Click Yes when asked if you want to save the file before sending its content to the server.
10. Click View > Repository, navigate to the Temp folder, and select the Sales By Month Report.Click Edit.
170
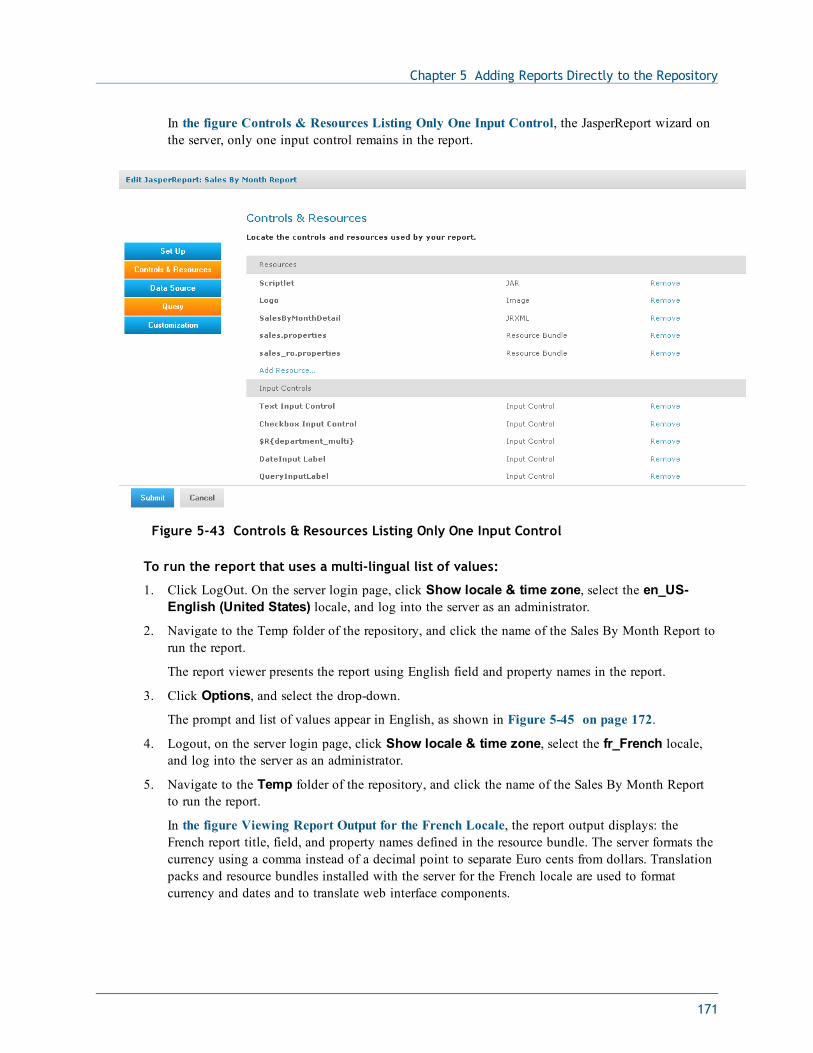
Chapter 5 Adding Reports Directly to the Repository
In the figure Controls & Resources Listing Only One Input Control, the JasperReport wizard onthe server, only one input control remains in the report.
Figure 5-43 Controls & Resources Listing Only One Input Control
To run the report that uses a multi-lingual list of values:
1. Click LogOut. On the server login page, click Show locale & time zone, select the en_US-English (United States) locale, and log into the server as an administrator.
2. Navigate to the Temp folder of the repository, and click the name of the Sales By Month Report torun the report.
The report viewer presents the report using English field and property names in the report.
3. Click Options, and select the drop-down.
The prompt and list of values appear in English, as shown in Figure 5-45 on page 172.
4. Logout, on the server login page, click Show locale & time zone, select the fr_French locale,and log into the server as an administrator.
5. Navigate to the Temp folder of the repository, and click the name of the Sales By Month Reportto run the report.
In the figure Viewing Report Output for the French Locale, the report output displays: theFrench report title, field, and property names defined in the resource bundle. The server formats thecurrency using a comma instead of a decimal point to separate Euro cents from dollars. Translationpacks and resource bundles installed with the server for the French locale are used to formatcurrency and dates and to translate web interface components.
171
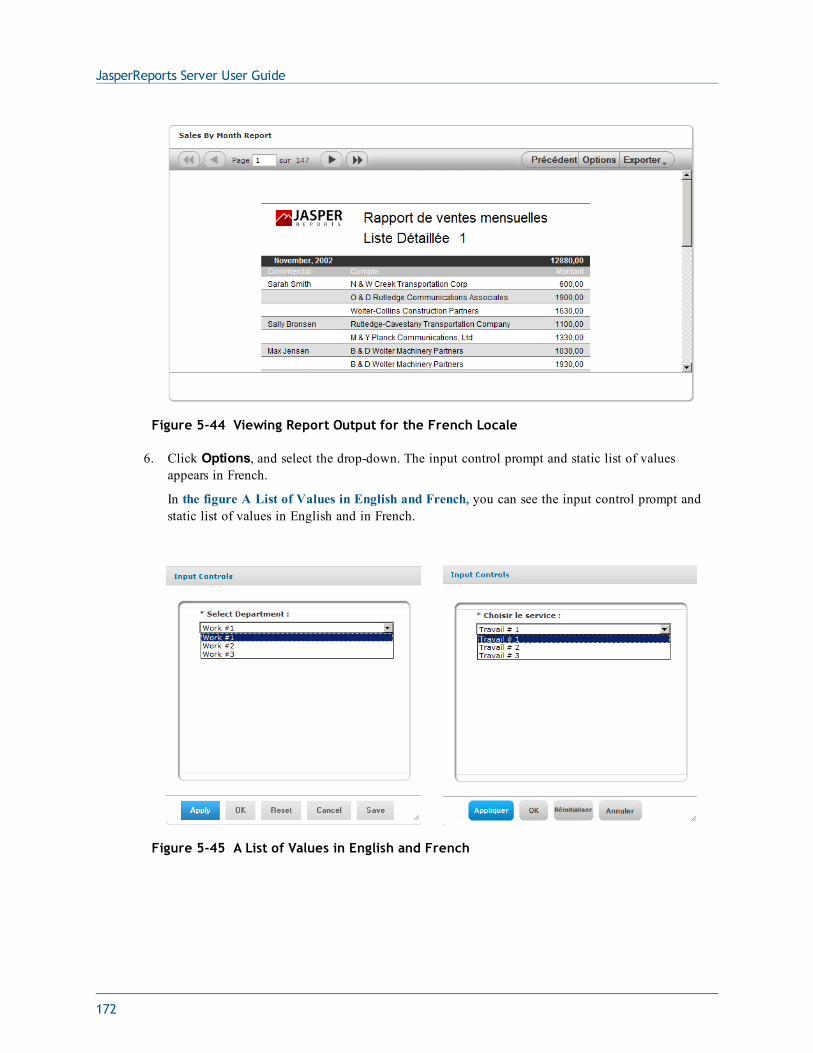
JasperReports Server User Guide
Figure 5-44 Viewing Report Output for the French Locale
6. Click Options, and select the drop-down. The input control prompt and static list of valuesappears in French.
In the figure A List of Values in English and French, you can see the input control prompt andstatic list of values in English and in French.
Figure 5-45 A List of Values in English and French
172
Chapter 5 Adding Reports Directly to the Repository
5.6.4 Reusing Resource BundlesThe location of a resource bundle determines its capability for being reused and conditions underwhich the server uses it. To resolve a $R expression in a report, the server scans resource bundles at twolevels in the order described in this table.
Orde-r
Level Description
1 Report/Repos-itory
A report-level bundle declares the resource bundle base name in the header of itsJRXML file. The Romanian resource bundle is a report-level bundle. A repository-level bundle is independent of any specific report and can be linked to multiplereports, as described in “Locale Bundles” on page 277).
2 Server A server-wide bundle typically contains server messages and labels of userinterface components, as described in the JasperReports Server AdministratorGuide. This bundle typically resides in the WEB-INF/bundles directory of theserver.
First, the server searches the report/repository level and stops scanning resource bundles if it finds aresolution to the $R expression. If the server does not find a resolution, it scans the server level for theresource ID of the field and uses this ID.
5.6.5 Using Default Fonts in JasperReports ServerBy default, the server uses three fonts you can use in reports:
• DejaVu Sans
• DejaVu Serif
• DejaVu Sans Mono
Using the DejaVu fonts shipped with the server ensures availability of fonts in all environments; thePDF is pixel-perfect every time.
The DejaVu fonts replace the Java logical fonts used in previous versions of the server:
• SansSerif
• Serif
• Monospaced
SansSerif, Serif, Monospaced can still be used, but are deprecated because these Java logical fontsmap to different TTF files in different environments, and run the risk of text being cut when exportedto PDF due to font metric mismatches. Also, these Java logical fonts aren't recognized by somebrowsers, resulting in font substitutions. For example, Firefox in a Windows environment renders theSansSerif logical font as Serif.
When using the DejaVu fonts coming from JasperReports font extensions, you don’t need to set anyother font attributes (such as the pdfXXX attributes) in the JRXML or specify font mapping. The fontextension file that makes these fonts available sets font attributes and mapping.
For more information about DejaVu, refer to its SourceForge project at:
173

JasperReports Server User Guide
http://dejavu-fonts.org/wiki/index.php?title=Main_Page.
When you upload a TrueType font to the repository, the file name must include the correct extension(.TTF).
174
CHAPTER 6 CREATING DOMAINSA Domain is a metadata layer that provides a business view of the data accessed through a data source.A Domain presents the data in business terms appropriate to your audience, and can limit the access todata based on the security permissions of the person running the report. A Domain defined inJasperReports Server can be used to create reports, Ad Hoc views, and Domain Topics.
This chapter covers the process of creating a Domain and defining its contents. For instructions aboutcreating Domain Topics and views based on Domains in the Ad Hoc Editor, see “Creating a Viewfrom a Domain” on page 112. Domains defined in the server can be accessed through iReportDesigner as well, as described in “Using the Domain Plug-in” on page 233.
This chapter contains the following sections:
• Introduction to Domains
• Example of Creating a Domain
• Example of Creating a Domain Using a Virtual Data Source
• Using the Add New Domain Page
• Using the Domain Designer
• Editing a Domain
6.1 Introduction to DomainsProduction databases typically contain data in tables that are optimized for storage and retrieval.Columns with data relevant to users need to be joined across several tables, filtered by business needs,secured against unauthorized access, and labeled using user-friendly names. In relational databases, aview can perform some of these functions. In the server, a Domain performs all these functions andmore, such as the localization of report text and permissions based on data values.
A Domain is a virtual view, created and stored in the server without modifying the data source.Through a Domain, users see columns that have been joined, filtered, and labeled for their business
175
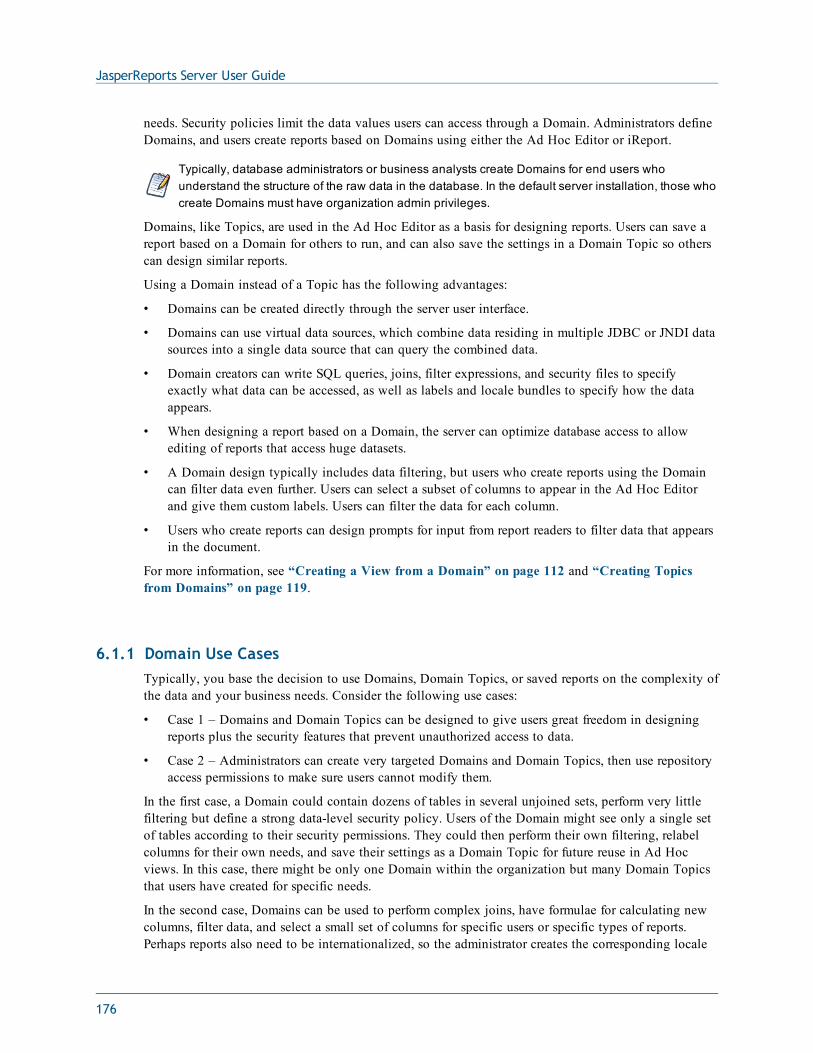
JasperReports Server User Guide
needs. Security policies limit the data values users can access through a Domain. Administrators defineDomains, and users create reports based on Domains using either the Ad Hoc Editor or iReport.
Typically, database administrators or business analysts create Domains for end users whounderstand the structure of the raw data in the database. In the default server installation, those whocreate Domains must have organization admin privileges.
Domains, like Topics, are used in the Ad Hoc Editor as a basis for designing reports. Users can save areport based on a Domain for others to run, and can also save the settings in a Domain Topic so otherscan design similar reports.
Using a Domain instead of a Topic has the following advantages:
• Domains can be created directly through the server user interface.
• Domains can use virtual data sources, which combine data residing in multiple JDBC or JNDI datasources into a single data source that can query the combined data.
• Domain creators can write SQL queries, joins, filter expressions, and security files to specifyexactly what data can be accessed, as well as labels and locale bundles to specify how the dataappears.
• When designing a report based on a Domain, the server can optimize database access to allowediting of reports that access huge datasets.
• A Domain design typically includes data filtering, but users who create reports using the Domaincan filter data even further. Users can select a subset of columns to appear in the Ad Hoc Editorand give them custom labels. Users can filter the data for each column.
• Users who create reports can design prompts for input from report readers to filter data that appearsin the document.
For more information, see “Creating a View from a Domain” on page 112 and “Creating Topicsfrom Domains” on page 119.
6.1.1 Domain Use CasesTypically, you base the decision to use Domains, Domain Topics, or saved reports on the complexity ofthe data and your business needs. Consider the following use cases:
• Case 1 – Domains and Domain Topics can be designed to give users great freedom in designingreports plus the security features that prevent unauthorized access to data.
• Case 2 – Administrators can create very targeted Domains and Domain Topics, then use repositoryaccess permissions to make sure users cannot modify them.
In the first case, a Domain could contain dozens of tables in several unjoined sets, perform very littlefiltering but define a strong data-level security policy. Users of the Domain might see only a single setof tables according to their security permissions. They could then perform their own filtering, relabelcolumns for their own needs, and save their settings as a Domain Topic for future reuse in Ad Hocviews. In this case, there might be only one Domain within the organization but many Domain Topicsthat users have created for specific needs.
In the second case, Domains can be used to perform complex joins, have formulae for calculating newcolumns, filter data, and select a small set of columns for specific users or specific types of reports.Perhaps reports also need to be internationalized, so the administrator creates the corresponding locale
176
Chapter 6 Creating Domains
bundles. In this scenario, there might be many specific Domains, and each would have correspondinglocale bundles and a single Domain Topic. Users would have a wide variety of Domain Topics tochoose from, each for a specific purpose, but no opportunity to access the Domains to perform theirown filtering.
The preceding examples illustrate two extreme cases, but there are many scenarios that combine somedegree of both. The number of users in your production environment and their level of proficiency alsodetermine your general use cases. A small number of users who understand their database might begiven administrator privileges to define complex Domains as an extension of the Ad Hoc view designprocess. On the other hand, with large numbers of users or with users who have limited database skills,administrators want to create Domains that help the users meet their business goals.
The table in “Creating Topics from Domains” on page 119 describes individual use cases forDomains, Domain Topics, and reports based on Domains.
6.1.2 TerminologyThis chapter refers to both columns and fields. Conventionally, database tables are composed ofcolumns, and the columns divide each row or record into fields. Some Domain operations refer tocolumns, others to fields, however the two terms refer to the same concept from different perspectives.For example, a calculated field refers to a field that is computed from the other field values in the samerow or record. But the effect of a calculated field in every row is to create a new calculated column.Similarly, operations such as joins and filters operate on designated field values in a row, but they aredefined by the columns that determine the fields involved.
Within a Domain, columns are called items. Because an item may originate from derived tables orcalculated fields, it may not correspond to a single column in the database.
Measures are columns or fields that display numeric values or aggregate values in reports. Measures arethe quantitative values of a record, such as an amount, as opposed to qualitative values such as name orlocation. Having a field designated as a measure determines where the item can be placed in the report.For example, measures appear summarized in the center of crosstabs, whereas only non-measures, simplycalled fields, can be used as row and column groups of the crosstab. In Domains, all items based onnumeric fields are designated as measures by default, but you can set them manually as well. Bymarking items as measures, Domains help report creators find and use the data they need in the Ad HocEditor.
6.1.3 Components of a DomainA Domain is saved as an object in the repository. Like other repository objects, it has a name, optionaldescription, and folder location specified at creation time. A Domain references the followingcomponents:
• A JDBC, JNDI, or virtual data source whose tables and columns are presented through the Domain.Data sources are selected from previously defined data sources in the repository.
• The Domain design that specifies tables and columns in the data source, queries for derived tables,joins between tables, calculated fields, and labels to display the columns.
• Optional locale bundles consisting of localized property files that present labels and descriptions inother languages.
177
JasperReports Server User Guide
• Optional security file that defines row and column-level access privileges based on users or roles.
The Domain design is either created using the Domain Designer or uploaded from an external XMLfile. Locale bundles and security files are uploaded from external files. The following sections describethe various dialogs for selecting, creating, or uploading the components of a Domain.
6.1.4 Sample DomainsThe following sample Domains are provided in Organization > Domains in the default installation:
• Simple Domain – Demonstrates basic features of Domains
• Based on the SugarCRM JNDI sample data source
• Includes a design file that you can export, as described in “The Domain Design File” onpage 241
• Used to create Simple Domain Topic in the Organization > Ad Hoc Components >Topics folder, as described in “Creating Topics from Domains” on page 119
• Shows how a report creator can see the items in a Domain through a Domain Topic
• SuperMart Domain – Demonstrates advanced features of Domains
• Based on the Foodmart sample data source
• Represents a complex Domain with many tables and joins
• Includes a design file that you can export, as described in “The Domain Design File” onpage 241
• Includes the Domain security file and locale bundles that you can download and inspect, asdescribed in “The Domain Design File” on page 241
You can use the samples to practice designing and using Domains and to see complex reports based onDomains:
6.1.5 Overview of Creating a DomainIn practice, you should plan Domain features before you begin the creation process. Decide on the datasource and define it in the server repository. If you need to combine several data sources into a singledata source, first define each data source in the repository and then create a virtual data source thatcombines them. Know the elements of your design: tables and columns to choose, joins to perform,filters to define, sets you need, and item properties to expose to users. Determine whether the users ofthe Domain need localized resources, such as translated labels and local formats. Finally, determine asecurity policy for the data retrieved through the Domain.
To launch the Domain Designer:
1. As an administrative user, select Add Resource > Domain in the repository to open the AddNew Domain page of the Domain Designer.
2. Enter a name and optional description for the Domain.
3. Under Data Source, browse to locate a data source.
178
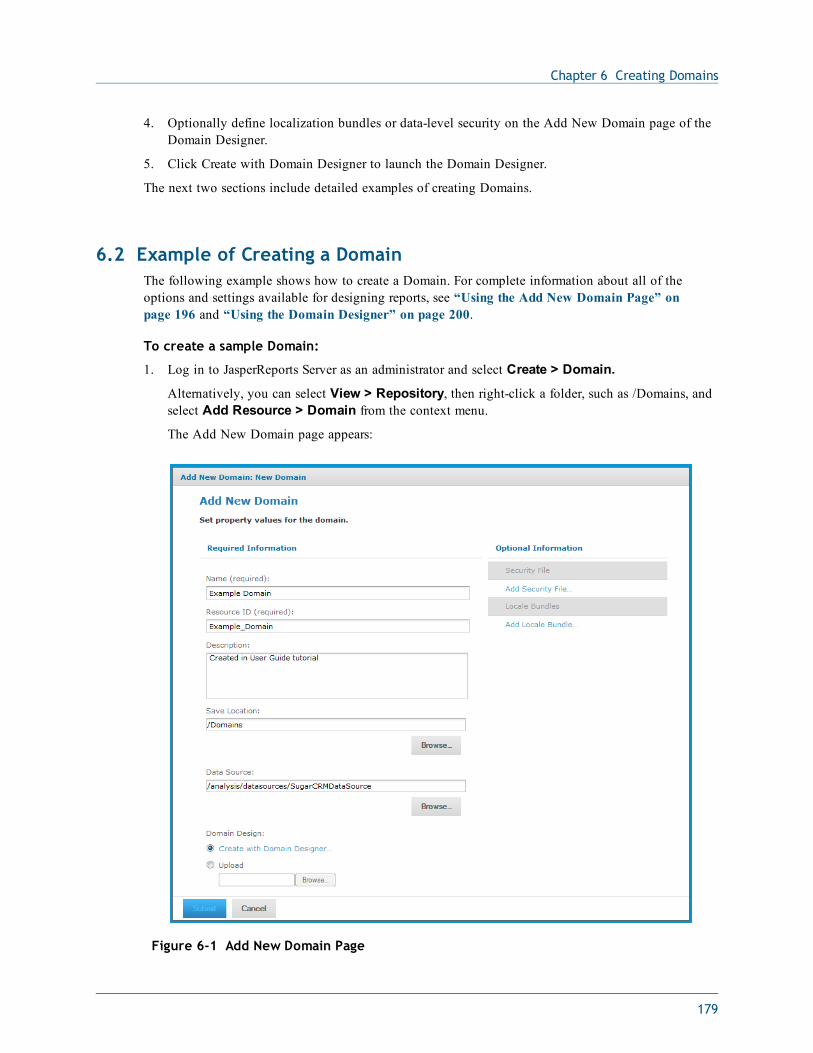
Chapter 6 Creating Domains
4. Optionally define localization bundles or data-level security on the Add New Domain page of theDomain Designer.
5. Click Create with Domain Designer to launch the Domain Designer.
The next two sections include detailed examples of creating Domains.
6.2 Example of Creating a DomainThe following example shows how to create a Domain. For complete information about all of theoptions and settings available for designing reports, see “Using the Add New Domain Page” onpage 196 and “Using the Domain Designer” on page 200.
To create a sample Domain:
1. Log in to JasperReports Server as an administrator and select Create > Domain.
Alternatively, you can select View > Repository, then right-click a folder, such as /Domains, andselect Add Resource > Domain from the context menu.
The Add New Domain page appears:
Figure 6-1 Add New Domain Page
179
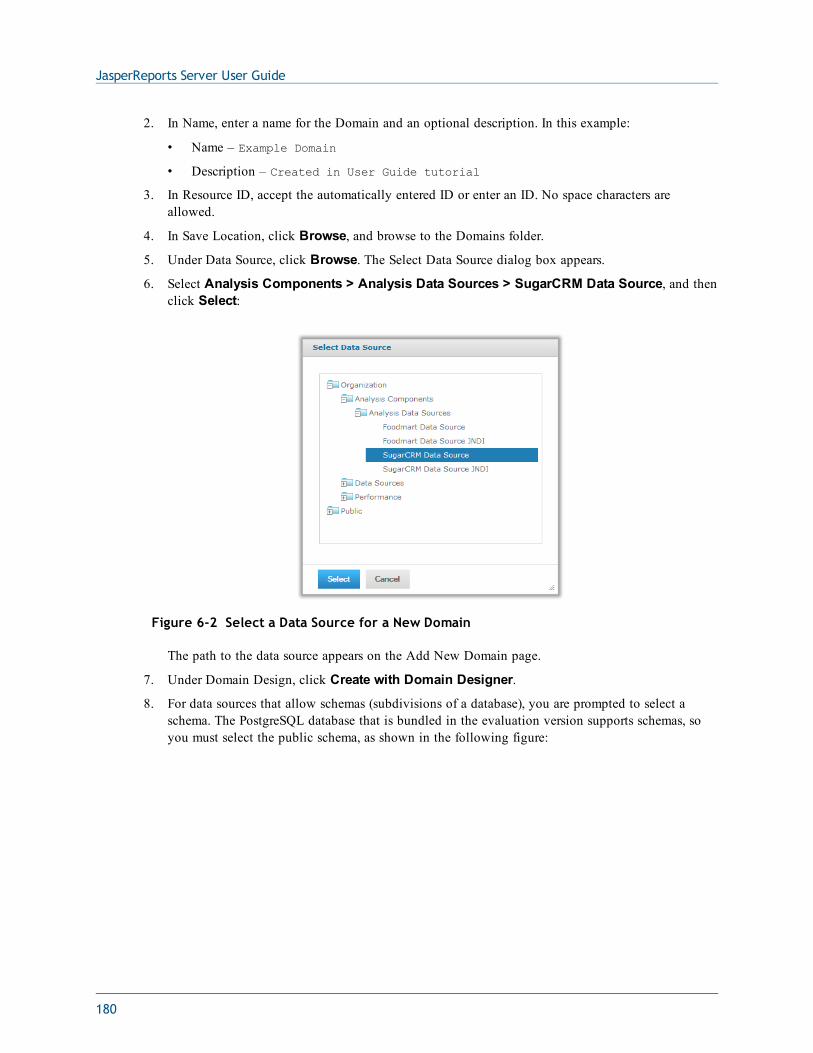
JasperReports Server User Guide
2. In Name, enter a name for the Domain and an optional description. In this example:
• Name – Example Domain
• Description – Created in User Guide tutorial
3. In Resource ID, accept the automatically entered ID or enter an ID. No space characters areallowed.
4. In Save Location, click Browse, and browse to the Domains folder.
5. Under Data Source, click Browse. The Select Data Source dialog box appears.
6. Select Analysis Components > Analysis Data Sources > SugarCRM Data Source, and thenclick Select:
Figure 6-2 Select a Data Source for a New Domain
The path to the data source appears on the Add New Domain page.
7. Under Domain Design, click Create with Domain Designer.
8. For data sources that allow schemas (subdivisions of a database), you are prompted to select aschema. The PostgreSQL database that is bundled in the evaluation version supports schemas, soyou must select the public schema, as shown in the following figure:
180
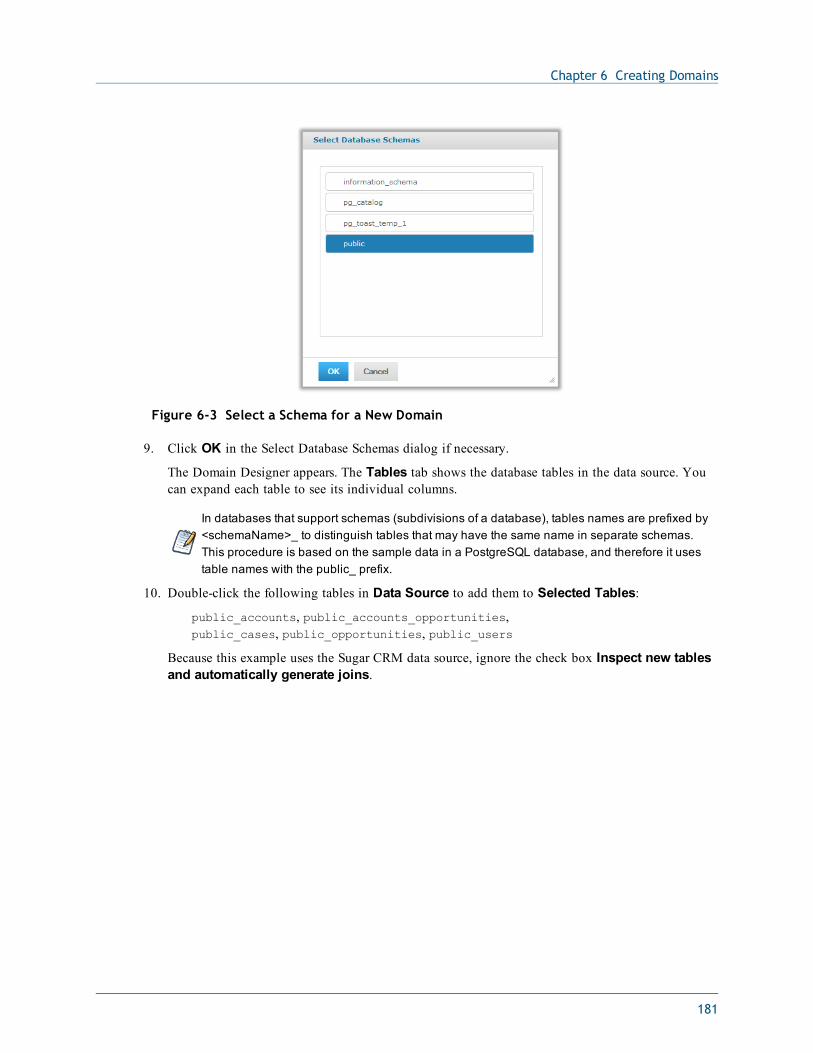
Chapter 6 Creating Domains
Figure 6-3 Select a Schema for a New Domain
9. Click OK in the Select Database Schemas dialog if necessary.
The Domain Designer appears. The Tables tab shows the database tables in the data source. Youcan expand each table to see its individual columns.
In databases that support schemas (subdivisions of a database), tables names are prefixed by<schemaName>_ to distinguish tables that may have the same name in separate schemas.This procedure is based on the sample data in a PostgreSQL database, and therefore it usestable names with the public_ prefix.
10. Double-click the following tables in Data Source to add them to Selected Tables:
public_accounts, public_accounts_opportunities,public_cases, public_opportunities, public_users
Because this example uses the Sugar CRM data source, ignore the check box Inspect new tablesand automatically generate joins.
181
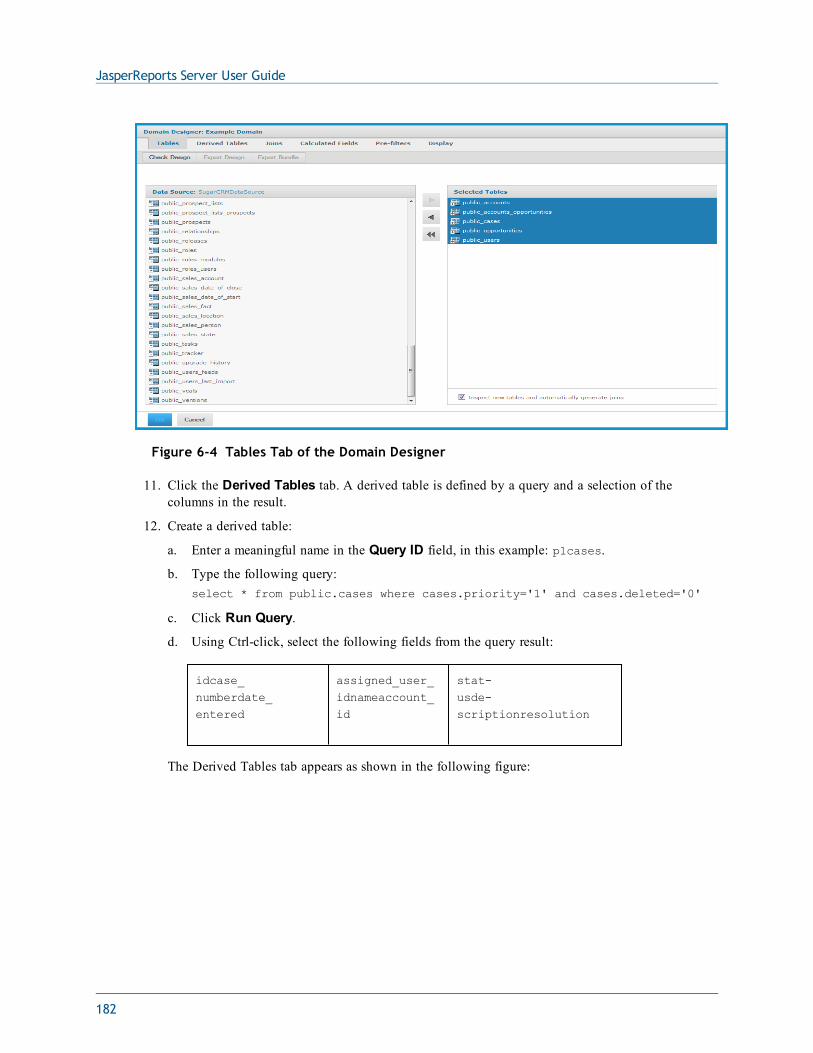
JasperReports Server User Guide
Figure 6-4 Tables Tab of the Domain Designer
11. Click the Derived Tables tab. A derived table is defined by a query and a selection of thecolumns in the result.
12. Create a derived table:
a. Enter a meaningful name in the Query ID field, in this example: p1cases.
b. Type the following query:select * from public.cases where cases.priority='1' and cases.deleted='0'
c. Click Run Query.
d. Using Ctrl-click, select the following fields from the query result:
idcase_numberdate_entered
assigned_user_idnameaccount_id
stat-usde-scriptionresolution
The Derived Tables tab appears as shown in the following figure:
182
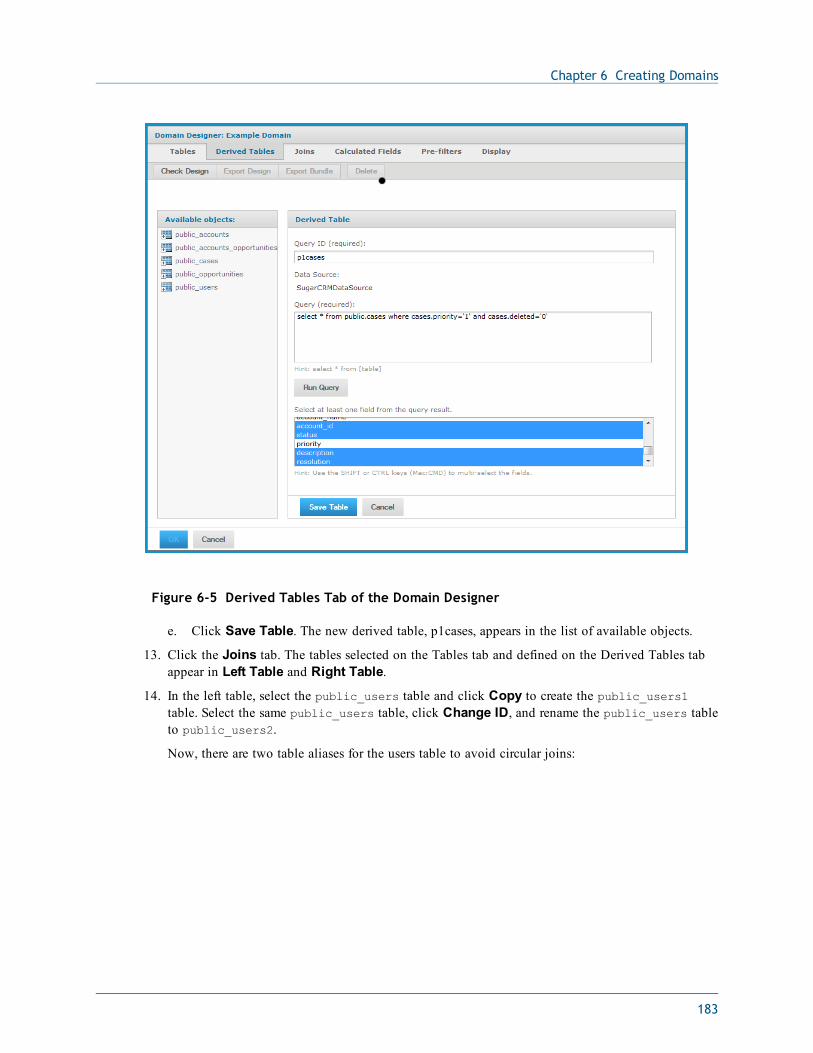
Chapter 6 Creating Domains
Figure 6-5 Derived Tables Tab of the Domain Designer
e. Click Save Table. The new derived table, p1cases, appears in the list of available objects.
13. Click the Joins tab. The tables selected on the Tables tab and defined on the Derived Tables tabappear in Left Table and Right Table.
14. In the left table, select the public_users table and click Copy to create the public_users1table. Select the same public_users table, click Change ID, and rename the public_users tableto public_users2.
Now, there are two table aliases for the users table to avoid circular joins:
183

JasperReports Server User Guide
Figure 6-6 Joins Tab of the Domain Designer
15. To specify a join, expand the tables to see column names, select a column in the left table and acolumn in the right table, then click a join icon. For this example, specify the following joins:
Left Table and Column Right Table and Column Join Type
public_accounts: id public_accounts_opportunities:account_id
Inner
public_accounts_opportunities:opportunity_id
public_opportunities: id Inner
public_opportunities: assigned_user_id public_users1: id Inner
public_accounts: id P1cases: account_id Left Outer
public_users2: id P1cases: assigned_user_id Right
Outer
Each row returned by an inner join contains data from all tables involved in the join. Outer joinsreturn rows that satisfy the join condition plus rows from either the left or right table for which nocorresponding rows exist in the other table. In this example, the result of the left outer join includesaccounts without P1 cases. The result of the right outer join includes P1 cases without assignedusers.
The final list of joins appears as shown below:
184
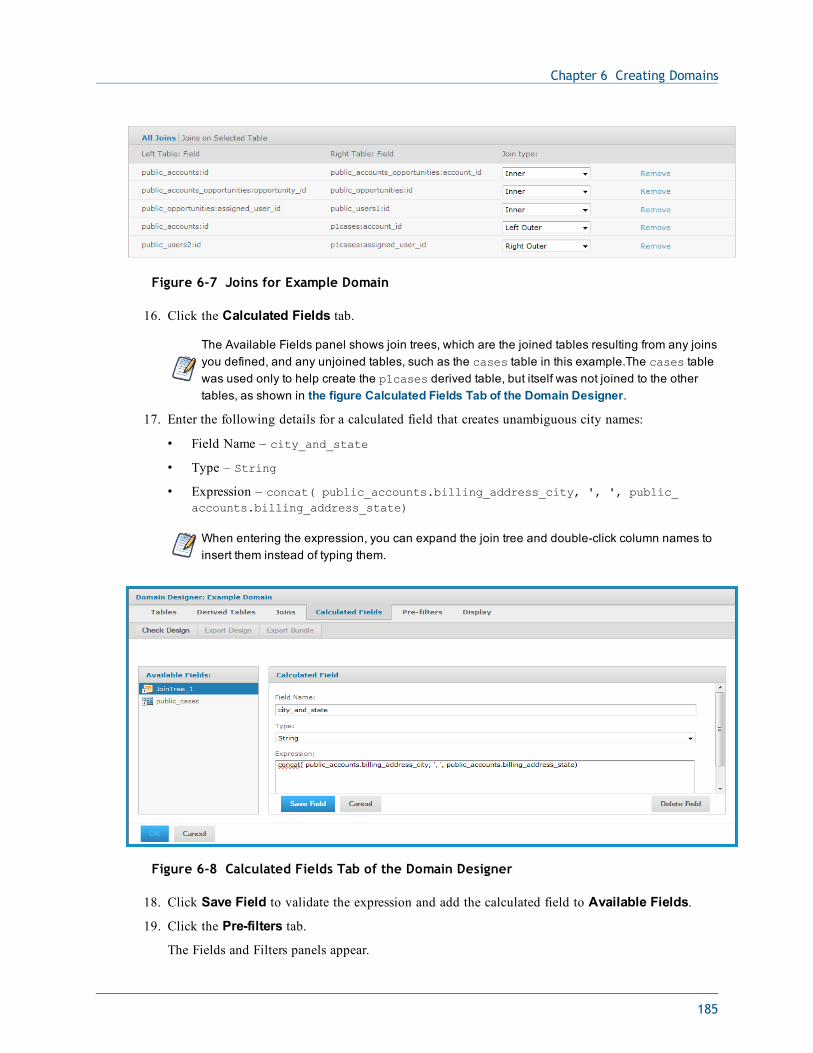
Chapter 6 Creating Domains
Figure 6-7 Joins for Example Domain
16. Click the Calculated Fields tab.
The Available Fields panel shows join trees, which are the joined tables resulting from any joinsyou defined, and any unjoined tables, such as the cases table in this example.The cases tablewas used only to help create the p1cases derived table, but itself was not joined to the othertables, as shown in the figure Calculated Fields Tab of the Domain Designer.
17. Enter the following details for a calculated field that creates unambiguous city names:
• Field Name – city_and_state
• Type – String
• Expression – concat( public_accounts.billing_address_city, ', ', public_accounts.billing_address_state)
When entering the expression, you can expand the join tree and double-click column names toinsert them instead of typing them.
Figure 6-8 Calculated Fields Tab of the Domain Designer
18. Click Save Field to validate the expression and add the calculated field to Available Fields.
19. Click the Pre-filters tab.
The Fields and Filters panels appear.
185

JasperReports Server User Guide
20. Define two filters as follows:
a. In Fields, expand the join tree and the public_opportunities table.
b. Double-click the opportunity_type column to create a filter condition.
c. Use Equals as the comparison operator, and select Existing Business from the drop-down.
d. Click OK to create the filter.
e. Create another filter by expanding the p1cases table and double-clicking the status column.
If you select the wrong column, click Cancel.
f. Choose the is not equal to comparison operator.
g. Enter the value closed in the search field, but do not click the search icon.
When the selection list in the Filters pane does not contain the value you want to use, type it inthe search field.
h. Click OK to save the filter.
The filters you defined appear in the Filters panel:
Figure 6-9 Pre-filters Tab of the Domain Designer
21. Click the Display tab. On this tab, you define how you want your fields to appear to users.
186
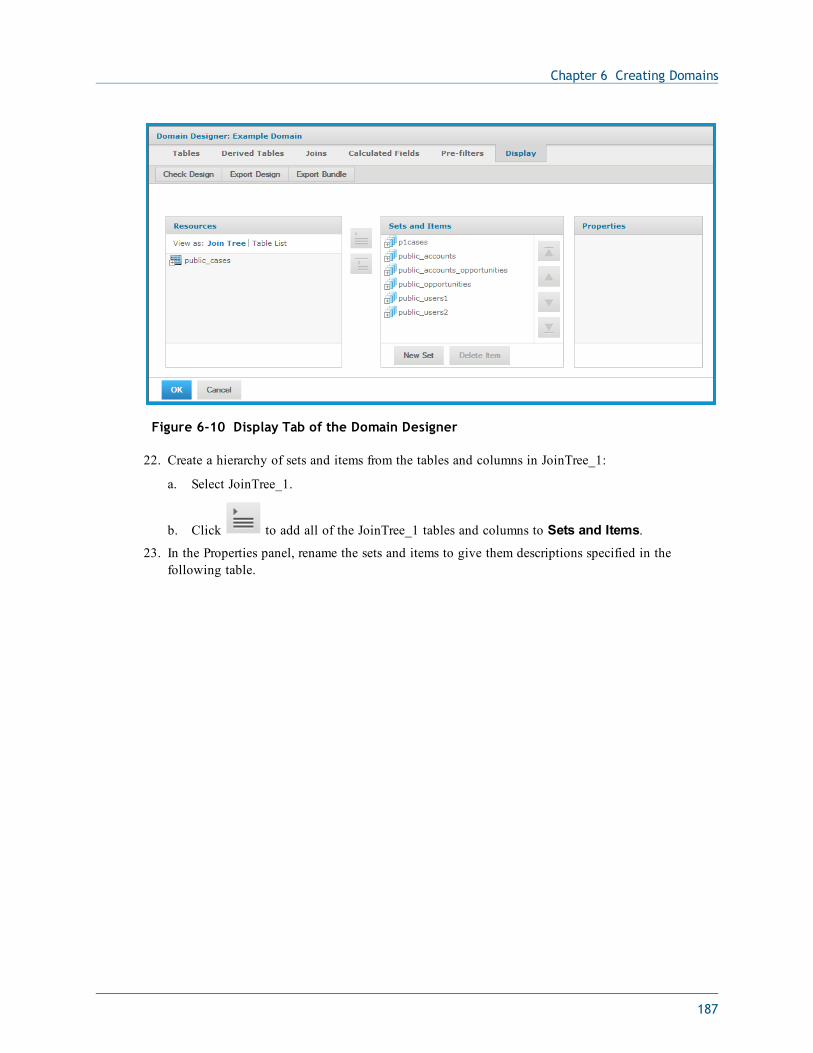
Chapter 6 Creating Domains
Figure 6-10 Display Tab of the Domain Designer
22. Create a hierarchy of sets and items from the tables and columns in JoinTree_1:
a. Select JoinTree_1.
b. Click to add all of the JoinTree_1 tables and columns to Sets and Items.23. In the Properties panel, rename the sets and items to give them descriptions specified in the
following table.
187
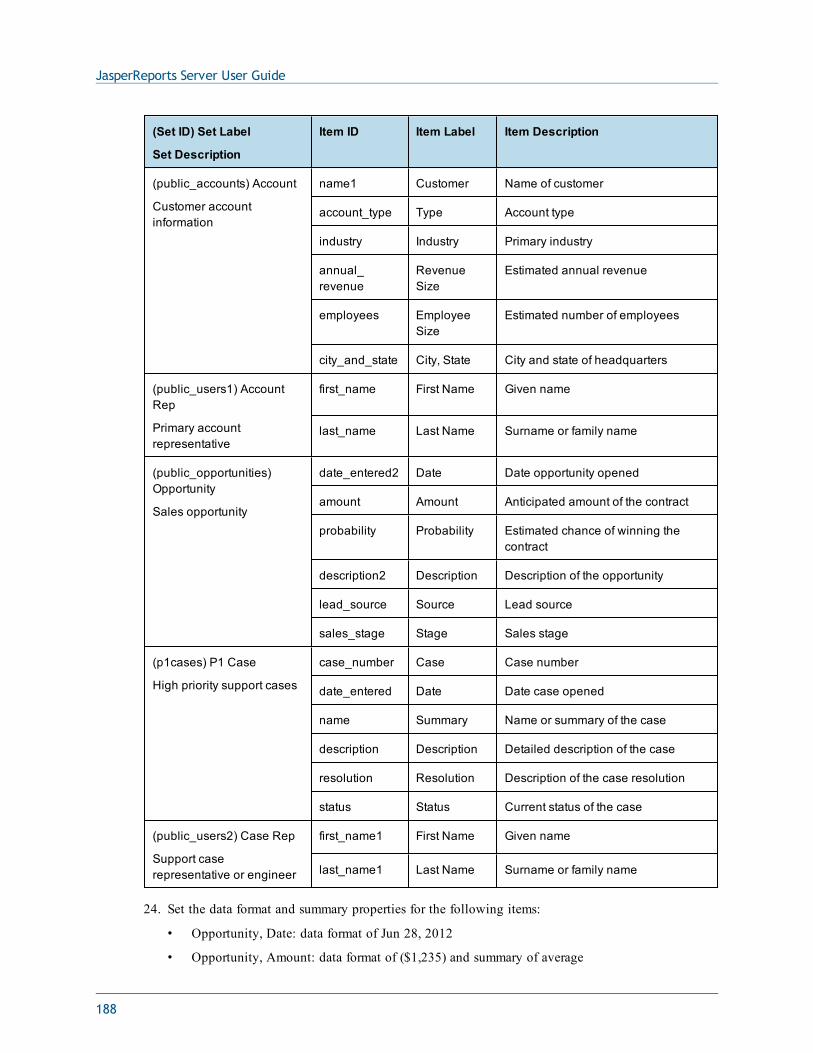
JasperReports Server User Guide
(Set ID) Set Label
Set Description
Item ID Item Label Item Description
(public_accounts) Account
Customer accountinformation
name1 Customer Name of customer
account_type Type Account type
industry Industry Primary industry
annual_revenue
RevenueSize
Estimated annual revenue
employees EmployeeSize
Estimated number of employees
city_and_state City, State City and state of headquarters
(public_users1) AccountRep
Primary accountrepresentative
first_name First Name Given name
last_name Last Name Surname or family name
(public_opportunities)Opportunity
Sales opportunity
date_entered2 Date Date opportunity opened
amount Amount Anticipated amount of the contract
probability Probability Estimated chance of winning thecontract
description2 Description Description of the opportunity
lead_source Source Lead source
sales_stage Stage Sales stage
(p1cases) P1 Case
High priority support cases
case_number Case Case number
date_entered Date Date case opened
name Summary Name or summary of the case
description Description Detailed description of the case
resolution Resolution Description of the case resolution
status Status Current status of the case
(public_users2) Case Rep
Support caserepresentative or engineer
first_name1 First Name Given name
last_name1 Last Name Surname or family name
24. Set the data format and summary properties for the following items:
• Opportunity, Date: data format of Jun 28, 2012
• Opportunity, Amount: data format of ($1,235) and summary of average
188
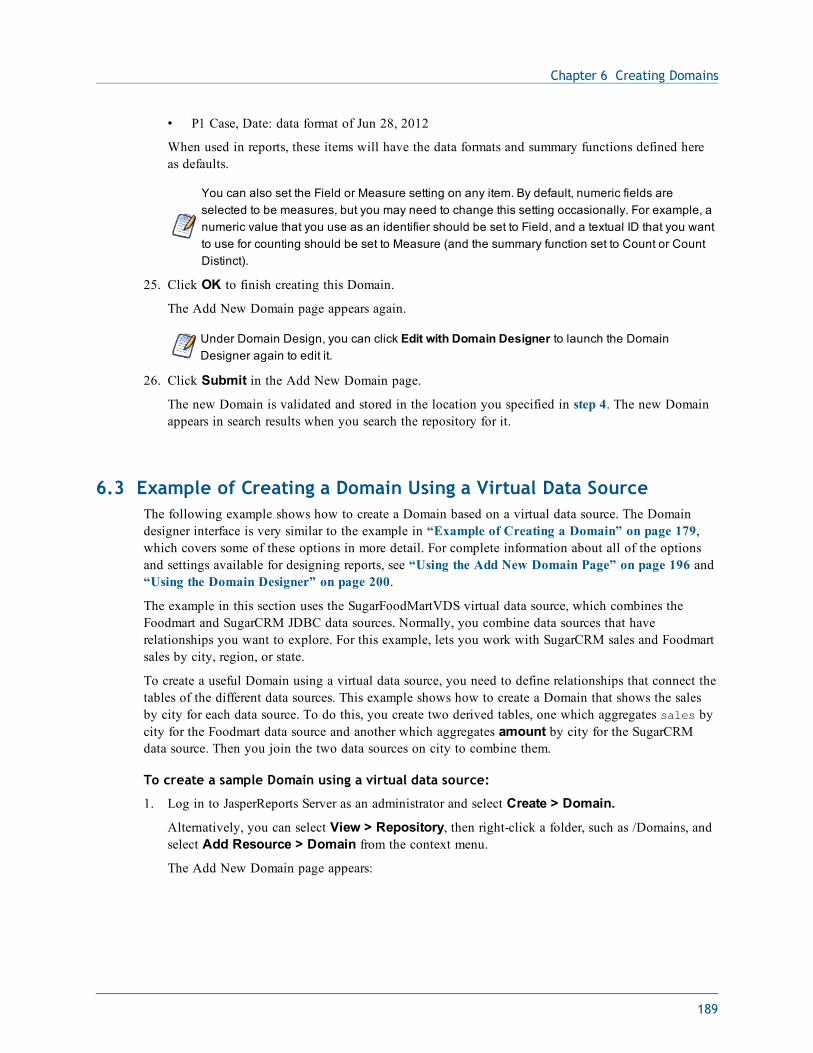
Chapter 6 Creating Domains
• P1 Case, Date: data format of Jun 28, 2012
When used in reports, these items will have the data formats and summary functions defined hereas defaults.
You can also set the Field or Measure setting on any item. By default, numeric fields areselected to be measures, but you may need to change this setting occasionally. For example, anumeric value that you use as an identifier should be set to Field, and a textual ID that you wantto use for counting should be set to Measure (and the summary function set to Count or CountDistinct).
25. Click OK to finish creating this Domain.
The Add New Domain page appears again.
Under Domain Design, you can click Edit with Domain Designer to launch the DomainDesigner again to edit it.
26. Click Submit in the Add New Domain page.
The new Domain is validated and stored in the location you specified in step 4. The new Domainappears in search results when you search the repository for it.
6.3 Example of Creating a Domain Using a Virtual Data SourceThe following example shows how to create a Domain based on a virtual data source. The Domaindesigner interface is very similar to the example in “Example of Creating a Domain” on page 179,which covers some of these options in more detail. For complete information about all of the optionsand settings available for designing reports, see “Using the Add New Domain Page” on page 196 and“Using the Domain Designer” on page 200.
The example in this section uses the SugarFoodMartVDS virtual data source, which combines theFoodmart and SugarCRM JDBC data sources. Normally, you combine data sources that haverelationships you want to explore. For this example, lets you work with SugarCRM sales and Foodmartsales by city, region, or state.
To create a useful Domain using a virtual data source, you need to define relationships that connect thetables of the different data sources. This example shows how to create a Domain that shows the salesby city for each data source. To do this, you create two derived tables, one which aggregates sales bycity for the Foodmart data source and another which aggregates amount by city for the SugarCRMdata source. Then you join the two data sources on city to combine them.
To create a sample Domain using a virtual data source:
1. Log in to JasperReports Server as an administrator and select Create > Domain.
Alternatively, you can select View > Repository, then right-click a folder, such as /Domains, andselect Add Resource > Domain from the context menu.
The Add New Domain page appears:
189
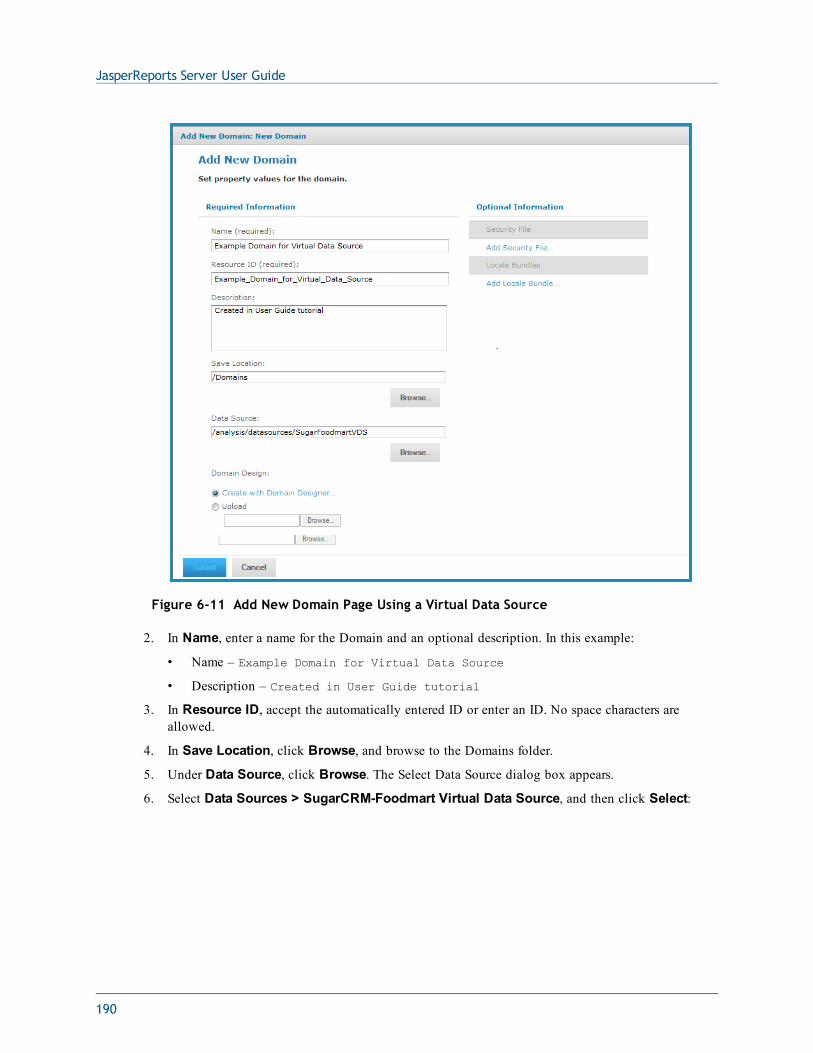
JasperReports Server User Guide
Figure 6-11 Add New Domain Page Using a Virtual Data Source
2. In Name, enter a name for the Domain and an optional description. In this example:
• Name – Example Domain for Virtual Data Source
• Description – Created in User Guide tutorial
3. In Resource ID, accept the automatically entered ID or enter an ID. No space characters areallowed.
4. In Save Location, click Browse, and browse to the Domains folder.
5. Under Data Source, click Browse. The Select Data Source dialog box appears.
6. Select Data Sources > SugarCRM-Foodmart Virtual Data Source, and then click Select:
190
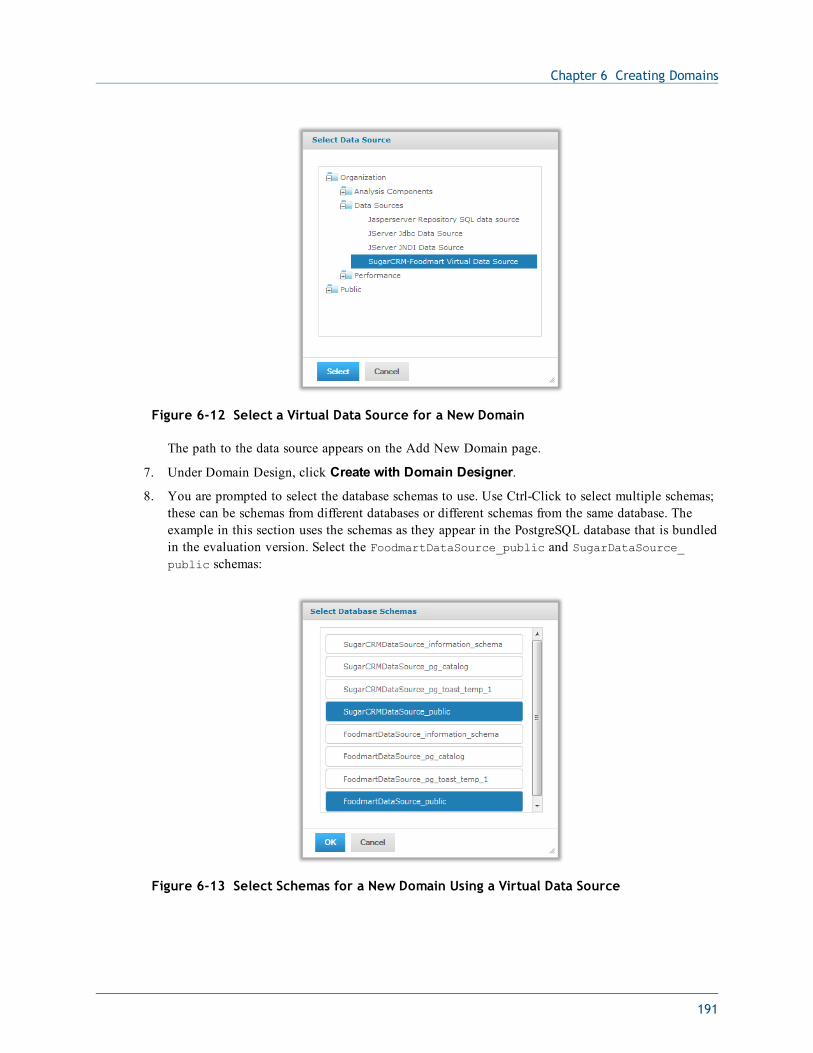
Chapter 6 Creating Domains
Figure 6-12 Select a Virtual Data Source for a New Domain
The path to the data source appears on the Add New Domain page.
7. Under Domain Design, click Create with Domain Designer.
8. You are prompted to select the database schemas to use. Use Ctrl-Click to select multiple schemas;these can be schemas from different databases or different schemas from the same database. Theexample in this section uses the schemas as they appear in the PostgreSQL database that is bundledin the evaluation version. Select the FoodmartDataSource_public and SugarDataSource_public schemas:
Figure 6-13 Select Schemas for a New Domain Using a Virtual Data Source
191
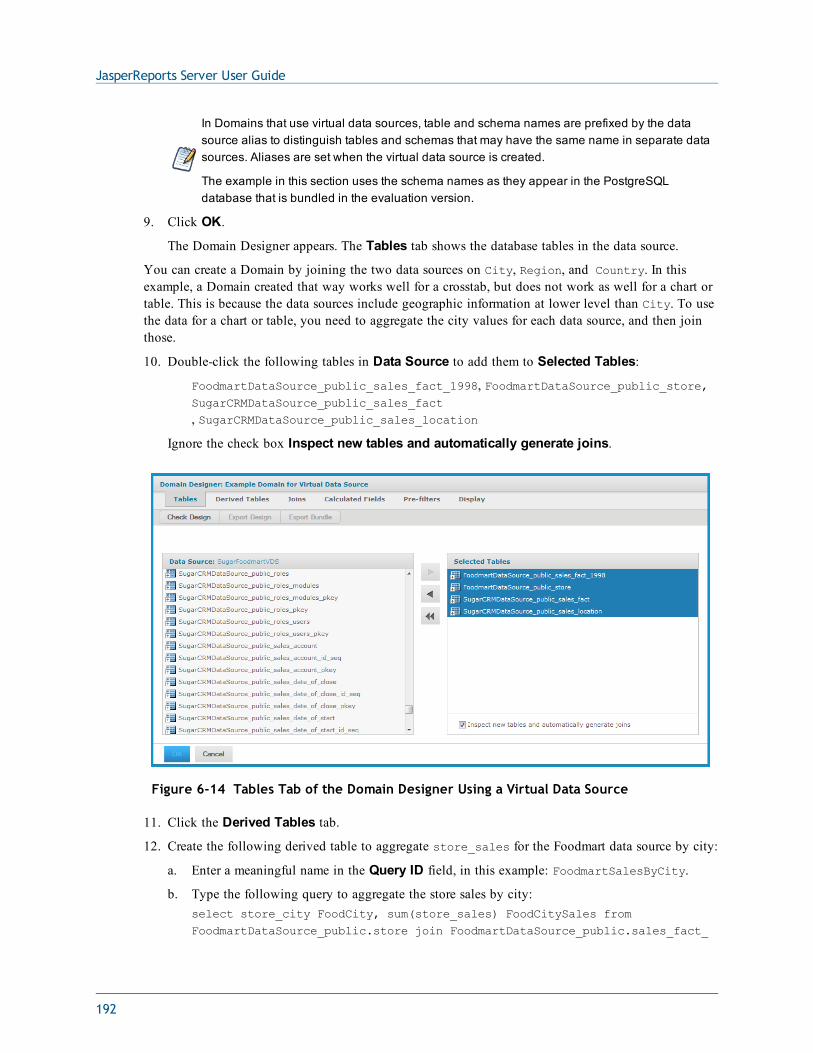
JasperReports Server User Guide
In Domains that use virtual data sources, table and schema names are prefixed by the datasource alias to distinguish tables and schemas that may have the same name in separate datasources. Aliases are set when the virtual data source is created.
The example in this section uses the schema names as they appear in the PostgreSQLdatabase that is bundled in the evaluation version.
9. Click OK.
The Domain Designer appears. The Tables tab shows the database tables in the data source.
You can create a Domain by joining the two data sources on City, Region, and Country. In thisexample, a Domain created that way works well for a crosstab, but does not work as well for a chart ortable. This is because the data sources include geographic information at lower level than City. To usethe data for a chart or table, you need to aggregate the city values for each data source, and then jointhose.
10. Double-click the following tables in Data Source to add them to Selected Tables:
FoodmartDataSource_public_sales_fact_1998, FoodmartDataSource_public_store,SugarCRMDataSource_public_sales_fact, SugarCRMDataSource_public_sales_location
Ignore the check box Inspect new tables and automatically generate joins.
Figure 6-14 Tables Tab of the Domain Designer Using a Virtual Data Source
11. Click the Derived Tables tab.
12. Create the following derived table to aggregate store_sales for the Foodmart data source by city:
a. Enter a meaningful name in the Query ID field, in this example: FoodmartSalesByCity.
b. Type the following query to aggregate the store sales by city:select store_city FoodCity, sum(store_sales) FoodCitySales fromFoodmartDataSource_public.store join FoodmartDataSource_public.sales_fact_
192
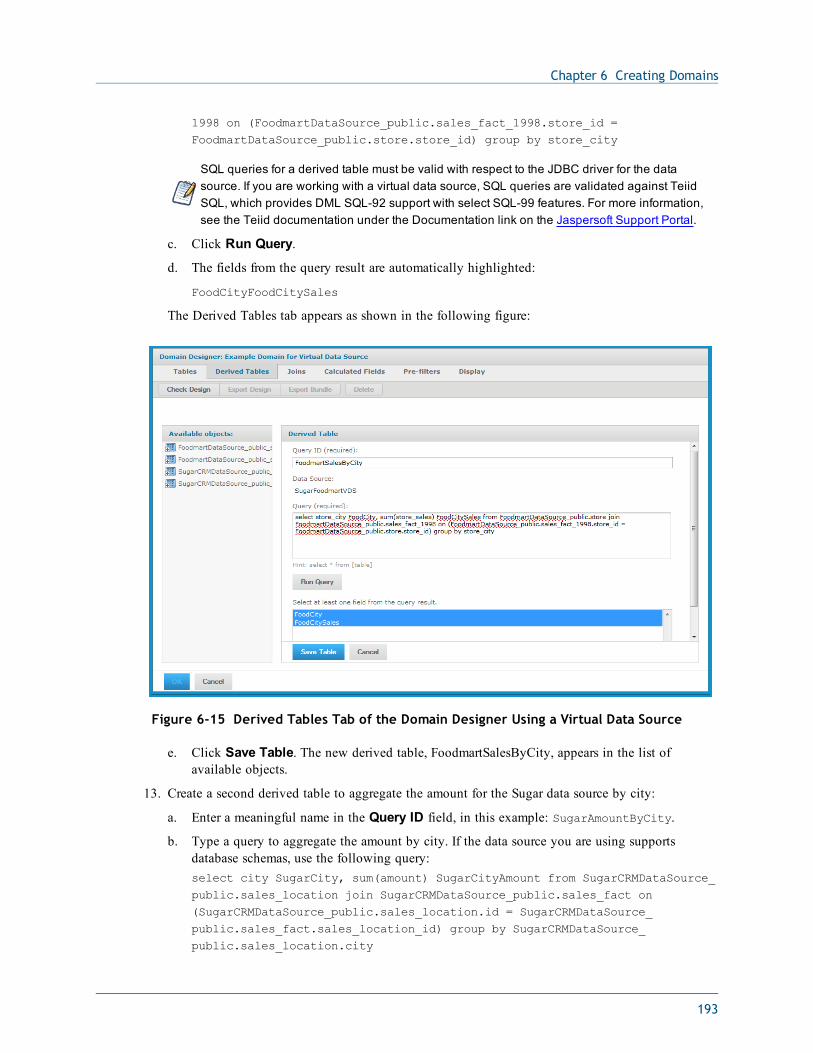
Chapter 6 Creating Domains
1998 on (FoodmartDataSource_public.sales_fact_1998.store_id =FoodmartDataSource_public.store.store_id) group by store_city
SQL queries for a derived table must be valid with respect to the JDBC driver for the datasource. If you are working with a virtual data source, SQL queries are validated against TeiidSQL, which provides DML SQL-92 support with select SQL-99 features. For more information,see the Teiid documentation under the Documentation link on the Jaspersoft Support Portal.
c. Click Run Query.
d. The fields from the query result are automatically highlighted:
FoodCityFoodCitySales
The Derived Tables tab appears as shown in the following figure:
Figure 6-15 Derived Tables Tab of the Domain Designer Using a Virtual Data Source
e. Click Save Table. The new derived table, FoodmartSalesByCity, appears in the list ofavailable objects.
13. Create a second derived table to aggregate the amount for the Sugar data source by city:
a. Enter a meaningful name in the Query ID field, in this example: SugarAmountByCity.
b. Type a query to aggregate the amount by city. If the data source you are using supportsdatabase schemas, use the following query:select city SugarCity, sum(amount) SugarCityAmount from SugarCRMDataSource_public.sales_location join SugarCRMDataSource_public.sales_fact on(SugarCRMDataSource_public.sales_location.id = SugarCRMDataSource_public.sales_fact.sales_location_id) group by SugarCRMDataSource_public.sales_location.city
193
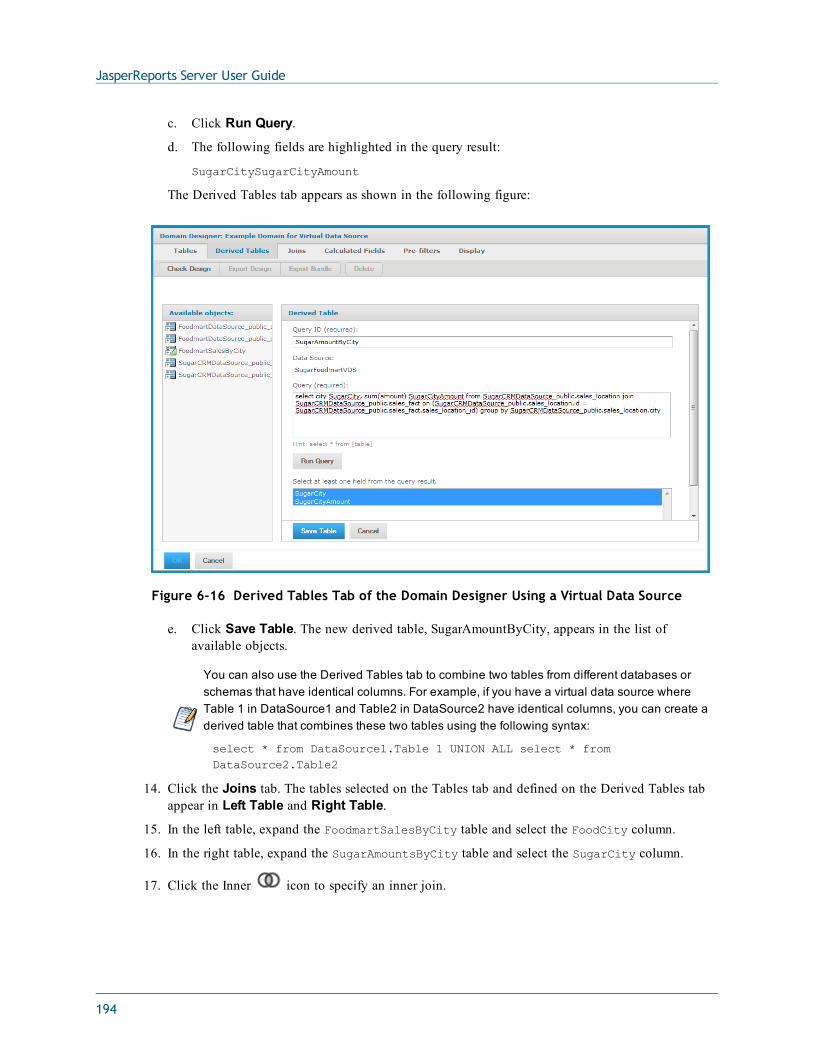
JasperReports Server User Guide
c. Click Run Query.
d. The following fields are highlighted in the query result:
SugarCitySugarCityAmount
The Derived Tables tab appears as shown in the following figure:
Figure 6-16 Derived Tables Tab of the Domain Designer Using a Virtual Data Source
e. Click Save Table. The new derived table, SugarAmountByCity, appears in the list ofavailable objects.
You can also use the Derived Tables tab to combine two tables from different databases orschemas that have identical columns. For example, if you have a virtual data source whereTable 1 in DataSource1 and Table2 in DataSource2 have identical columns, you can create aderived table that combines these two tables using the following syntax:
select * from DataSource1.Table 1 UNION ALL select * fromDataSource2.Table2
14. Click the Joins tab. The tables selected on the Tables tab and defined on the Derived Tables tabappear in Left Table and Right Table.
15. In the left table, expand the FoodmartSalesByCity table and select the FoodCity column.
16. In the right table, expand the SugarAmountsByCity table and select the SugarCity column.
17. Click the Inner icon to specify an inner join.
194
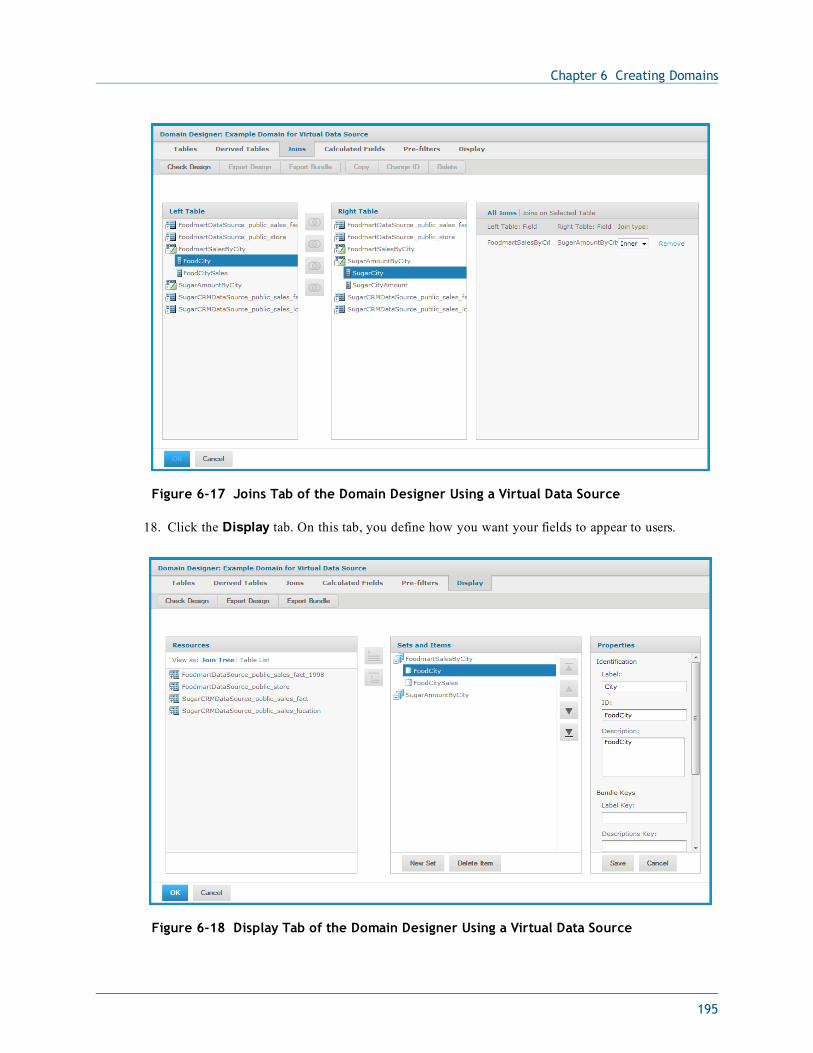
Chapter 6 Creating Domains
Figure 6-17 Joins Tab of the Domain Designer Using a Virtual Data Source
18. Click the Display tab. On this tab, you define how you want your fields to appear to users.
Figure 6-18 Display Tab of the Domain Designer Using a Virtual Data Source
195
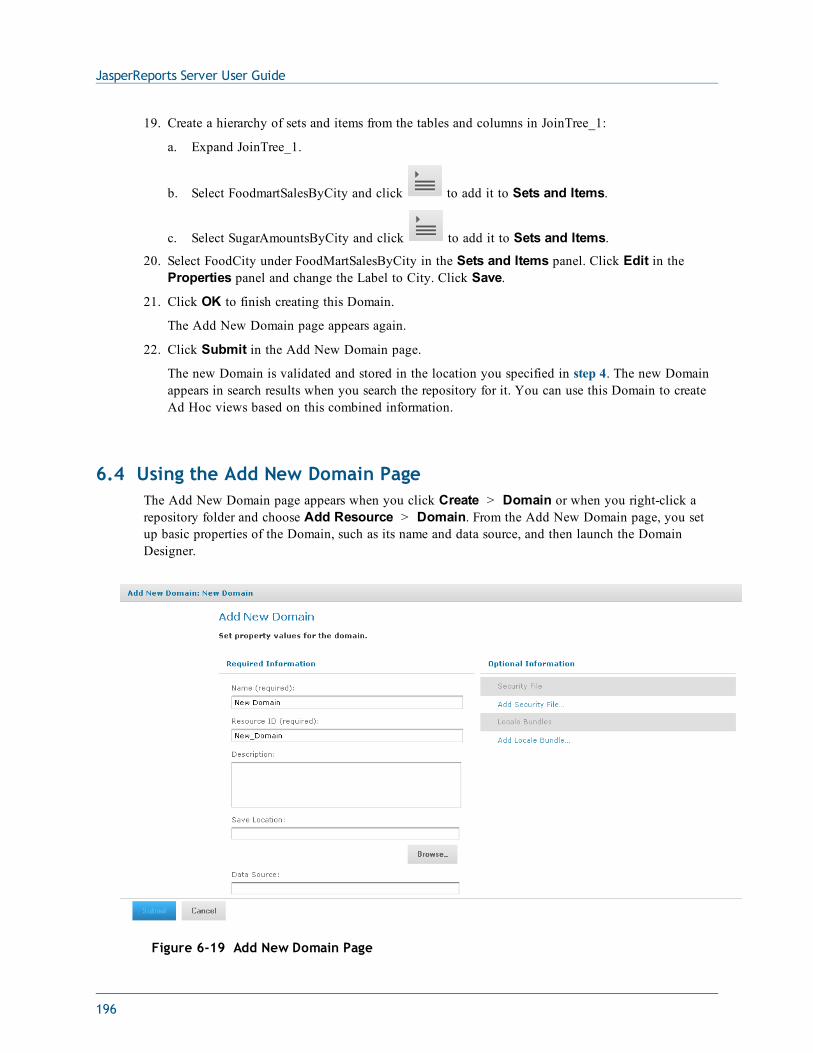
JasperReports Server User Guide
19. Create a hierarchy of sets and items from the tables and columns in JoinTree_1:
a. Expand JoinTree_1.
b. Select FoodmartSalesByCity and click to add it to Sets and Items.
c. Select SugarAmountsByCity and click to add it to Sets and Items.20. Select FoodCity under FoodMartSalesByCity in the Sets and Items panel. Click Edit in the
Properties panel and change the Label to City. Click Save.
21. Click OK to finish creating this Domain.
The Add New Domain page appears again.
22. Click Submit in the Add New Domain page.
The new Domain is validated and stored in the location you specified in step 4. The new Domainappears in search results when you search the repository for it. You can use this Domain to createAd Hoc views based on this combined information.
6.4 Using the Add New Domain PageThe Add New Domain page appears when you click Create > Domain or when you right-click arepository folder and choose Add Resource > Domain. From the Add New Domain page, you setup basic properties of the Domain, such as its name and data source, and then launch the DomainDesigner.
Figure 6-19 Add New Domain Page
196
Chapter 6 Creating Domains
On the Add New Domain page, you specify the following components of the Domain:
• Name – Specify the name for the Domain that users will see in the repository.
• Resource ID – Accept the automatically entered resource ID or enter a new one. No spacesallowed.
• Description – Specify the description that appears in the repository and in the Ad Hoc Editorwhen users create a report using the Domain. Optional, but recommended.
• Save Location – Browse to the repository folder where you want to save the Domain.
The server locates Domains by their repository object type, not by their location. The default locationis the last folder selected in the repository.
• Data Source – Browse the repository to choose a data source from the list of data sources in yourorganization.
• Use only data sources that are in the repository and for which the user has at least executepermission.
• Domains must use a JDBC, JNDI, or virtual data source.
• You can use the sample JDBC, JNDI, and virtual data sources in Organization > DataSources and Organization > Analysis Components > Analysis Data Sources if youinstalled the sample data.
• Domain Design – Create the design using the Domain Designer console or upload a Domaindesign file from outside the repository. See “Advanced Domain Features” on page 241 for moreinformation about Domain design files.
• Optional Information – Specify a security file and one or more locale bundles.
Before you can submit and save a Domain to the repository, you must specify a display name, resourceID, save location, data source, and Domain design. The Submit button is grayed out until you havecreated or specified the design for your domain.
• The Cancel button exits the Add New Domain page. For new Domains, no Domain is created;when modifying an existing Domain, it remains unchanged.
• The Submit button validates and saves the Domain components. For more information, see “Usingthe Domain Designer” on page 200. The location for Domains in the sample data is theOrganization > Domains folder, but you may use any location.
6.4.1 Add Security File and Add Locale Bundle OptionsThe Add New Domain page includes options to upload security and locale bundle files for theDomain. You can add, replace, or remove any previously uploaded files for the Domain:
197
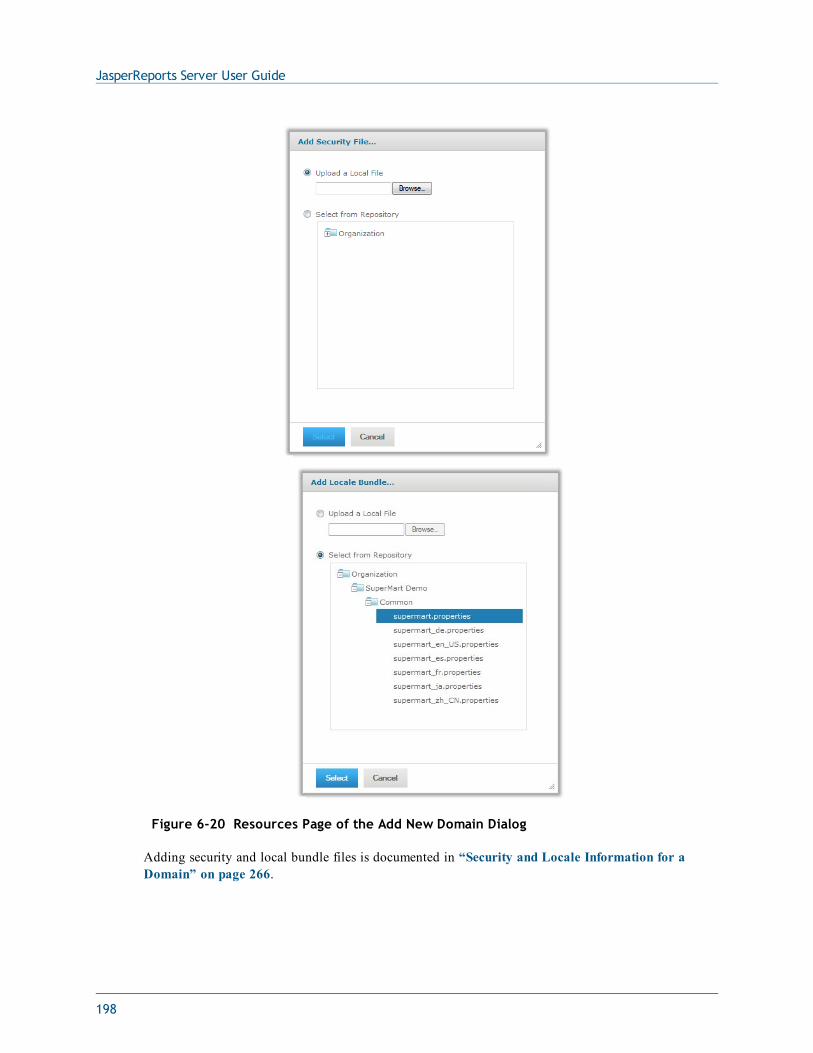
JasperReports Server User Guide
Figure 6-20 Resources Page of the Add New Domain Dialog
Adding security and local bundle files is documented in “Security and Locale Information for aDomain” on page 266.
198
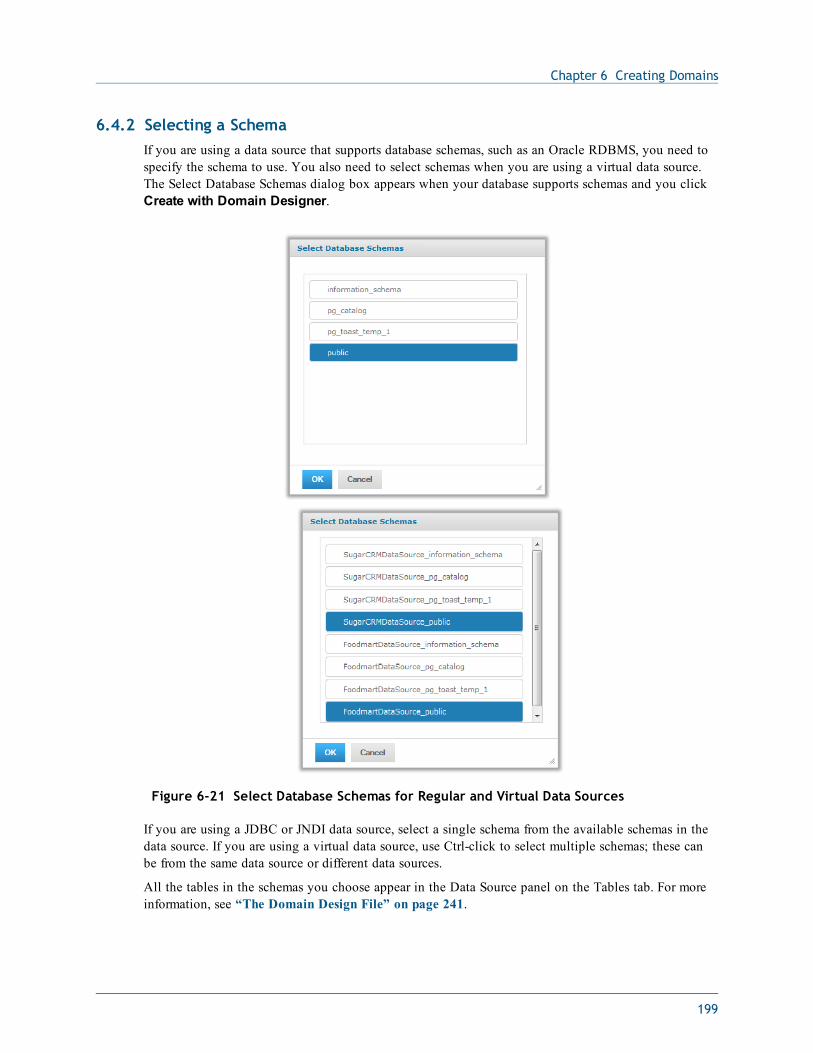
Chapter 6 Creating Domains
6.4.2 Selecting a SchemaIf you are using a data source that supports database schemas, such as an Oracle RDBMS, you need tospecify the schema to use. You also need to select schemas when you are using a virtual data source.The Select Database Schemas dialog box appears when your database supports schemas and you clickCreate with Domain Designer.
Figure 6-21 Select Database Schemas for Regular and Virtual Data Sources
If you are using a JDBC or JNDI data source, select a single schema from the available schemas in thedata source. If you are using a virtual data source, use Ctrl-click to select multiple schemas; these canbe from the same data source or different data sources.
All the tables in the schemas you choose appear in the Data Source panel on the Tables tab. For moreinformation, see “The Domain Design File” on page 241.
199
JasperReports Server User Guide
6.5 Using the Domain DesignerYou use the Domain Designer to define all the components of a Domain. From the bottom of the AddNew Domain or Edit Domain pages, click Create in Domain Designer or Edit in DomainDesigner, respectively to open the Domain Designer console. Along the top of the Domain Designerconsole are tabs for configuring various aspects of the design:
• Tables tab – Select all tables whose columns you want to use in the Domain, either directly orindirectly.
• Derived Tables tab – Enter queries whose results appear as derived tables available in the Domain.
• Joins tab – Define inner and outer joins between all the tables and derived tables.
• Calculated Fields tab – Enter expressions whose results appear as calculated fields.
• Pre-filters tab – Specify conditions on field values to limit the data accessed through the Domain.
• Display tab – Organize the visual aspects of the Domain and change the display properties oftables, columns, sets, and items exposed to Domain users.
From the Tables tab, you can navigate to any other tab. To navigate between tabs, click the tab name atthe top of the Domain Designer. Before you can save the design, you must choose which sets and itemsto expose to users of the Domain. The OK button on the console validates the design and saves it inthe location you specified earlier. For more information, see “Domain Validation” on page 212. Aftersaving a Domain, you can modify it using the Domain Designer.
The Cancel button on the console exits the Domain Designer without saving any of the designsettings. For new Domains, no design is saved; when modifying an existing design, it remainsunchanged.
6.5.1 Tables TabThe Tables tab contains two panels:
• Data Source – Shows the tables and columns in the data source or database schema you chose inthe Add New Domain page.
• Selected Tables – Shows all tables and columns that you use to design the Domain. Initially, thispanel is blank.
Typically, you move the following tables from Data Source to Selected Tables:
• Tables that need to be joined
• Tables that you want to reference in the Domain design, even if their columns do not appeardirectly in the Domain.
For example, select the tables containing columns that you want to use in a derived table orcalculated field.
An understanding of the logical design of tables in the data source is critical to selecting which tablesneed to be joined.
To select tables for use in designing the Domain, first expand the table icons beside the table names toinspect the columns of a table. Double-click or drag a table name in the Data Source panel to move itto the Selected Tables panel. Alternatively, use or to move a table from one panel to the other.
200
Chapter 6 Creating Domains
On the Tables tab, you can select only entire tables for the Domain. On the Display tab, you canmake column-level selections.
To remove a table, double-click or drag it out of Selected Tables. You can also click to clearSelected Tables.
The Inspect new tables and automatically generate joins check box at the bottom of SelectedTables creates joins only if the database has been configured with referential constraints (foreign keys).Otherwise, selecting it has no effect.
If applicable, the generated joins appear on the Join tab.
The Tables tab does not detect changes to the database tables and columns in real-time. To update aDomain after making changes to the database structure, click OK to close the Domain Designer, thenlaunch it again.
Keep the following points in mind regarding Domain updates:
• New tables and columns appear in the Data Source panel; new columns appear under their tablename.
• To add a new column to the Domain, move its table to Selected Tables.
The Tables tab works only with entire tables.
• From Selected Tables, respond affirmatively to the prompt to remove tables and columns deletedfrom the database.
The Domain Designer removes those columns or tables from the Tables tab.
If you had selected the dropped columns for display, you must manually remove them from theDisplay tab, otherwise the Domain issues a validation error. For information about removingcolumns that were displayed through the Domain, see “Maintaining Referential Integrity” onpage 215.
6.5.2 Manage Data Source Dialog BoxThe name of the data source that you choose for the Domain appears at the top of the Data Sourcepanel on the Tables tab. Click the name of the data source to make changes to it. The Manage DataSource dialog box appears:
201
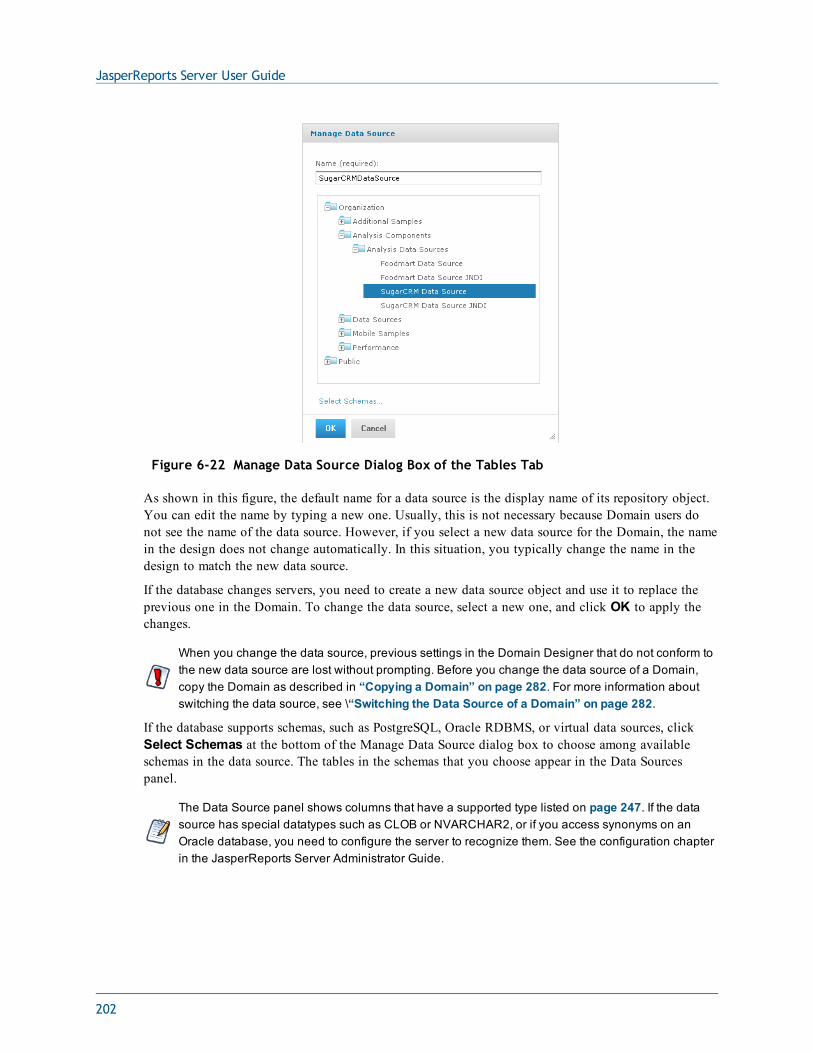
JasperReports Server User Guide
Figure 6-22 Manage Data Source Dialog Box of the Tables Tab
As shown in this figure, the default name for a data source is the display name of its repository object.You can edit the name by typing a new one. Usually, this is not necessary because Domain users donot see the name of the data source. However, if you select a new data source for the Domain, the namein the design does not change automatically. In this situation, you typically change the name in thedesign to match the new data source.
If the database changes servers, you need to create a new data source object and use it to replace theprevious one in the Domain. To change the data source, select a new one, and click OK to apply thechanges.
When you change the data source, previous settings in the Domain Designer that do not conform tothe new data source are lost without prompting. Before you change the data source of a Domain,copy the Domain as described in “Copying a Domain” on page 282. For more information aboutswitching the data source, see \“Switching the Data Source of a Domain” on page 282.
If the database supports schemas, such as PostgreSQL, Oracle RDBMS, or virtual data sources, clickSelect Schemas at the bottom of the Manage Data Source dialog box to choose among availableschemas in the data source. The tables in the schemas that you choose appear in the Data Sourcespanel.
The Data Source panel shows columns that have a supported type listed on page 247. If the datasource has special datatypes such as CLOB or NVARCHAR2, or if you access synonyms on anOracle database, you need to configure the server to recognize them. See the configuration chapterin the JasperReports Server Administrator Guide.
202
Chapter 6 Creating Domains
6.5.3 Derived Tables TabYou create a derived table in a Domain by first building a custom query using the objects you selectedon the Tables tab. Because Domains are based on JDBC and JNDI data sources, you write the query inSQL. You run the query, and then select columns from the query result for use in the Domain design.
The clauses in a query determine the structure and contents of the table returned by the query. Forexample, the WHERE clause may contain conditions that determine the rows of the derived table.
To define a derived table:
1. Type a name for the table in the Query ID field.
2. Enter a valid SQL query in Query. The query may refer to any table or column in Availableobjects. Only queries that begin with the select statement are allowed. Do not include a closingsemi-colon (;).
Expand the tables in Available objects. Double-click column names to add them to thequery.
3. When the query is complete, click Run Query to test it and choose the list of columns in theresult.
4. By default, all columns in the result are selected. Use Ctrl-click to change the selection. If youwant only a few columns out of many, it is easier to specify the column names in the SELECTclause of the query.
5. Click Save Table to add the derived table to Available objects. A distinctive icon,identifies it as a derived table.
6.5.4 Joins TabJoins create associations between tables so that their rows may be presented together in the same report.Multiple joins associate columns across many tables to create powerful data visualizations when usedin reports. The number of tables and joins in the Domain depends on your business needs, as describedin “Domain Use Cases” on page 176. The server supports the four most common join types, all basedon equality between values in each column.
To join tables for the Domain, use the Joins tab. On the Joins tab, the list of selected and derived tablesis duplicated in the Left Table and Right Table panels. Expand tables in both panels, select a columnin each table having the same logical meaning and compatible formats, then click a join icon:
Join Inner – The result contains only rows where the values in the chosen columns are equal. Inthe support case example in “Example of Creating a Domain” on page 179, the result of an inner joincontains only support cases that have been assigned to a support engineer.
Join Left Outer – The result contains all the rows of the Left Table, paired with a row of theRight Table when the values in the chosen columns are equal or contain blanks. If the support casesare in the Left Table of the example, the result of a left outer join contains all support cases even ifthey do not have an assigned engineer.
203
JasperReports Server User Guide
Join Right Outer – The result contains all the rows of the Right Table, paired with a row of theLeft Table when the values in the chosen columns are equal or contain blanks. If the users are in theRight Table of the example, the result of a right outer join contains all the users and the support casesassigned to each engineer, if there are any. In this example, a user might also appear several times ifdifferent support cases refer to the same support engineer user ID.
Full Outer Join – The result contains all rows from both tables, paired when the joined columnsare equal, and filled with blanks otherwise.
The new join appears in All Joins | Joins on Selected Table panel.
In order to create a join between two tables, each table must have a column with the same meaning. Forexample, a table with data for support cases has a column for the assigned engineer user ID that can bejoined with the table of user data that has a user ID column.
In some cases, you may need to duplicate a table in order to join it several times without creating acircular join, or in order to join it to itself. You can also duplicate a table so it may be joined withdifferent tables for different uses. Click the following icons above the Right Table to make a copy,change the name, or delete a table:
• Copy – Copies the selected table and gives it a name with sequential numbering. The copyappears in both Left Table and Right Table.
• Change ID – Changes the name of the selected table. The new name becomes the ID of the tablethroughout the Domain, and is updated everywhere it appears in the Domain Designer.
• Delete – Removes the table from both lists. If the deleted table was the only instance of a table,removing it on the Joins tab also removes it from the list of selected tables on the Tables tab.
You use the All Joins | Joins on Selected Table panel to see the defined joins, to remove a join,and to change the join type:
• All Joins – Lists all joins defined for the Domain.
• Joins on Selected Table – Lists only joins defined on the table you select, simplifying the viewyou have of many joins.
• Join Type – Changes the type of join.
• Remove – Removes the selected join definition from the list of joins and from the Domain design.
After creating joins, one or more join trees appear on the Calculated, Pre-Filters and Display tabs.For example, if you join tables A and B, B and C, then join tables D and E, the result is two join trees.Columns of table A and table C may appear in the same report because their tables belong to the samejoin tree. Tables A and D are said to be unjoined; their columns may not be compared or appear in thesame report. Tables that are not joined appear individually along with the join trees.
6.5.5 Calculated Fields TabYou create a calculated field for the Domain by writing an expression that computes a value based onthe data in another column or columns. In order for the value to be coherent, all columns that appear inthe expression for a calculated field must be from the same join tree.
To create a calculated field:
1. Select the Calculated Fields tab to begin defining a new calculated field.
204
Chapter 6 Creating Domains
2. In Field Name, enter a short name for the calculated field. This name becomes the ID of the fieldin the Domain.
Later you can give the field a more meaningful label and full description.
3. In Type, select a datatype for the calculated field. The expression you write must return a value ofthis type.
Generally, this datatype matches the datatype of the columns in the expression. Therefore, youneed to be familiar with the datatypes of columns in the data source.
4. Enter an expression to compute the value of the calculated field.
Write expressions using the Domain Expression Language, fully described in The DomEL Syntax.
To insert a reference to the value of another column:
a. Expand the join-tree to find its table and double-click the column name.
The column name appears in the expression at the cursor, qualified by its table name.
Calculated fields may be used to compute other calculated fields.
b. Double-click the calculated field name to insert a reference to it into an expression.
Do not insert a column reference from unjoined trees because the Domain Designer does notvalidate expressions as they are written.
5. Click Save Field to save the new calculated field. To clear the calculated field editor withoutsaving, click Cancel.
After saving the calculated field, the Domain Designer validates the expression and warns you of anyerrors at this time. If there are errors, use the indications of the error message to help correct theexpression. After validation, a calculated field appears in the table or join tree whose columns are usedin the expression.
Calculated fields have a distinctive icon, , for easy recognition in Available Fields.An expression that does not use any columns has a constant value. For example, you might create aninteger field named Count that has the value 1 and later has a default summary function to count alloccurrences. Constant fields are independent of join trees and automatically appear in a set calledConstants.
To view, edit, or delete the definition of a calculated field:
1. Cancel any input in the calculated field editor, then click the name of the field in Available Fields.
2. Modify its name, its type, or its expression.
3. Click OK to save the new definition, or click Cancel if you just viewed the field definition.
Click Delete Field to remove the calculated field from the Domain design.
205
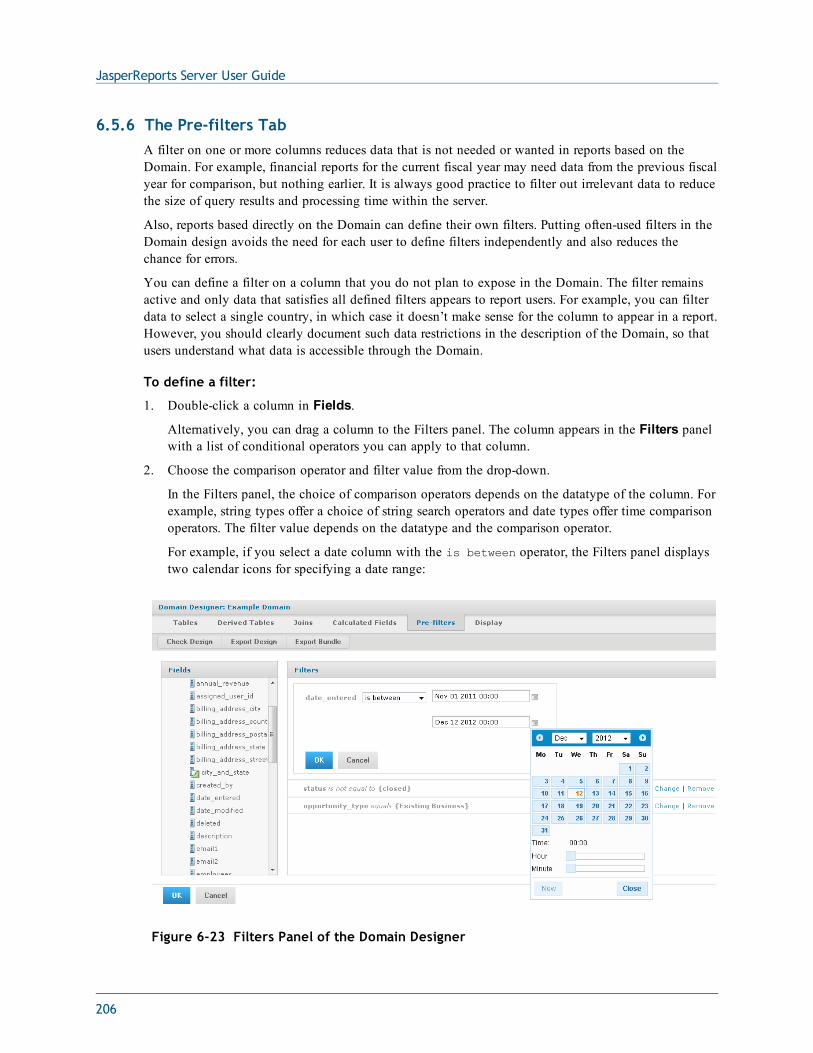
JasperReports Server User Guide
6.5.6 The Pre-filters TabA filter on one or more columns reduces data that is not needed or wanted in reports based on theDomain. For example, financial reports for the current fiscal year may need data from the previous fiscalyear for comparison, but nothing earlier. It is always good practice to filter out irrelevant data to reducethe size of query results and processing time within the server.
Also, reports based directly on the Domain can define their own filters. Putting often-used filters in theDomain design avoids the need for each user to define filters independently and also reduces thechance for errors.
You can define a filter on a column that you do not plan to expose in the Domain. The filter remainsactive and only data that satisfies all defined filters appears to report users. For example, you can filterdata to select a single country, in which case it doesn’t make sense for the column to appear in a report.However, you should clearly document such data restrictions in the description of the Domain, so thatusers understand what data is accessible through the Domain.
To define a filter:
1. Double-click a column in Fields.
Alternatively, you can drag a column to the Filters panel. The column appears in the Filters panelwith a list of conditional operators you can apply to that column.
2. Choose the comparison operator and filter value from the drop-down.
In the Filters panel, the choice of comparison operators depends on the datatype of the column. Forexample, string types offer a choice of string search operators and date types offer time comparisonoperators. The filter value depends on the datatype and the comparison operator.
For example, if you select a date column with the is between operator, the Filters panel displaystwo calendar icons for specifying a date range:
Figure 6-23 Filters Panel of the Domain Designer
206
Chapter 6 Creating Domains
Text columns have both substring comparison operators such as starts with or contains andwhole string matching such as equals or is one of. When you select a whole string matchingoperator, the panel displays a list of all existing values for the chosen column, retrieved in real-timefrom the database. If there are more than 50 values to display, use the search controls to the left and
click to narrow the list of available values. For multiple value matching, double-click theavailable values to select them. You may perform multiple searches and select values from each listof results.
To define a filter that compares two columns of the same datatype, Ctrl-click to select thesecond column, and drag the columns to the Filters panel. This action is possible only when twocolumns of the same type are selected.
3. Click OK to define the filter. To clear the condition editor without saving a filter, click Cancel.
Filters shows all the filters you have defined. The overall filter applied to the data is the logicalAND of all conditions you defined.
In Filters, click Change to modify a filter you defined. Click OK to save the changes. After selecting arow, you can click the Remove button to remove it from the list.
6.5.7 Display TabOn the Display tab, you specify which columns and calculated fields to expose through the Domainand how they appear. Typically, you select only columns that are useful in building or filtering reports,and omit other columns for simplicity. You also can modify display properties, such as the label anddescription of tables and sets and items for each specified column. Using meaningful labels anddescriptions to help users of the Domain.
The Display tab contains three panels:
• Resources – Lists tables or join trees, depending on the view you choose.
• Sets and Items – Lists resources that appear to report creators who use the Domain.
• Properties – Displays and modifies properties of selected sets and item.
In the Resources panel you can view resources as either a Join Tree or a Table List:
• Join Tree – Displays joined, unjoined, and calculated tables for this Domain. Joined tables appearas join trees.
• Table List – Displays the selected and calculated tables for this Domain.
In the Table List view, you can use the Delete Table button to remove the selected table from theResources panel and from the Domain design. The table no longer appears on the Joins tab, and anyjoins to the table are deleted. Use carefully.
To specify which columns and calculated fields are exposed to users of the Domain, you moveresources from the Resources panel to the Sets and Items panel:
• Set – A group of items independent of the tables in which the columns originate.
• Item – A column or calculated field, along with its display properties, that you want to appear inthe Domain.
207
JasperReports Server User Guide
All items in a set correspond to columns in a join tree. Sets and items appear to report creators who usethe Domain. Sets are optional. You can create a list of items outside of any sets. If you want to displayonly a few of the columns from the join tree, first create a new set in Sets and Items. Next, add itemsfrom the join tree in Resources.
To move a resource to Sets and Items, you can drag it from Resources and drop it in Sets and Items, oryou can use one of the following buttons:
Add to Sets – Select a resource in Resources and click this icon to add it to Sets and Items.Tables are added as sets, and columns are added as items outside of any set.
Add to Selected Set – Select a destination set in Sets and Items, select a resource inResources, and click this icon. Tables are added to Sets and Items as subsets, and columns are added asitems within the destination set. You can also expand sets in Sets and Items and drag tables andcolumns from Resources to the destination set.
To create new sets or delete items, use the New Set and Delete buttons:
New Set – Creates a new set or subset in Sets and Items. If a set is not selected, clicking New Setcreates a top-level set; otherwise, clicking New Set creates a subset.
Delete – Removes the selected set or item from Sets and Items. You can also double-click the object ordrag and drop it in a blank area of Resources. Items removed from Sets and Items automaticallyreappear in Resources.
To move most of the tables and columns in Resources to Sets and Items:
1. Double-click the join tree name in Resources, or drag-and-drop it from Resources to Sets and Items.All tables are created as sets, and the columns are created as items within the sets.
2. Remove any unwanted sets or items individually from Sets and Items using the Delete Itembutton.
To change the order of items within a set in Sets and Items:
1. Select the item.
2. Reposition the item using one of the following buttons:
Move the selected set or item to the top.
Move the selected set or item up.
Move the selected set or down.
Move the selected set or item to the bottom.
You can also use these buttons to reposition sets within Sets and Items.
To move items and subsets into other sets:
1. In Sets and Items, select the item or subset you want to move.
2. Click Delete Item.
3. In Sets and Items, select the destination set.
208
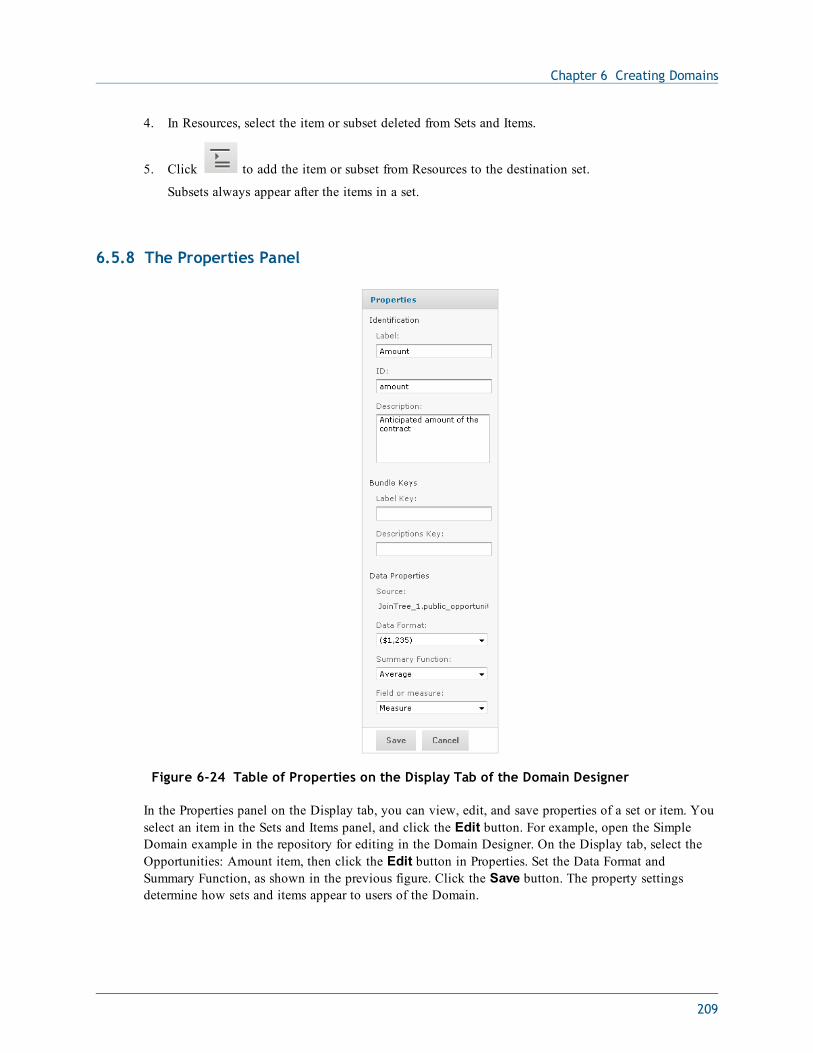
Chapter 6 Creating Domains
4. In Resources, select the item or subset deleted from Sets and Items.
5. Click to add the item or subset from Resources to the destination set.
Subsets always appear after the items in a set.
6.5.8 The Properties Panel
Figure 6-24 Table of Properties on the Display Tab of the Domain Designer
In the Properties panel on the Display tab, you can view, edit, and save properties of a set or item. Youselect an item in the Sets and Items panel, and click the Edit button. For example, open the SimpleDomain example in the repository for editing in the Domain Designer. On the Display tab, select theOpportunities: Amount item, then click the Edit button in Properties. Set the Data Format andSummary Function, as shown in the previous figure. Click the Save button. The property settingsdetermine how sets and items appear to users of the Domain.
209
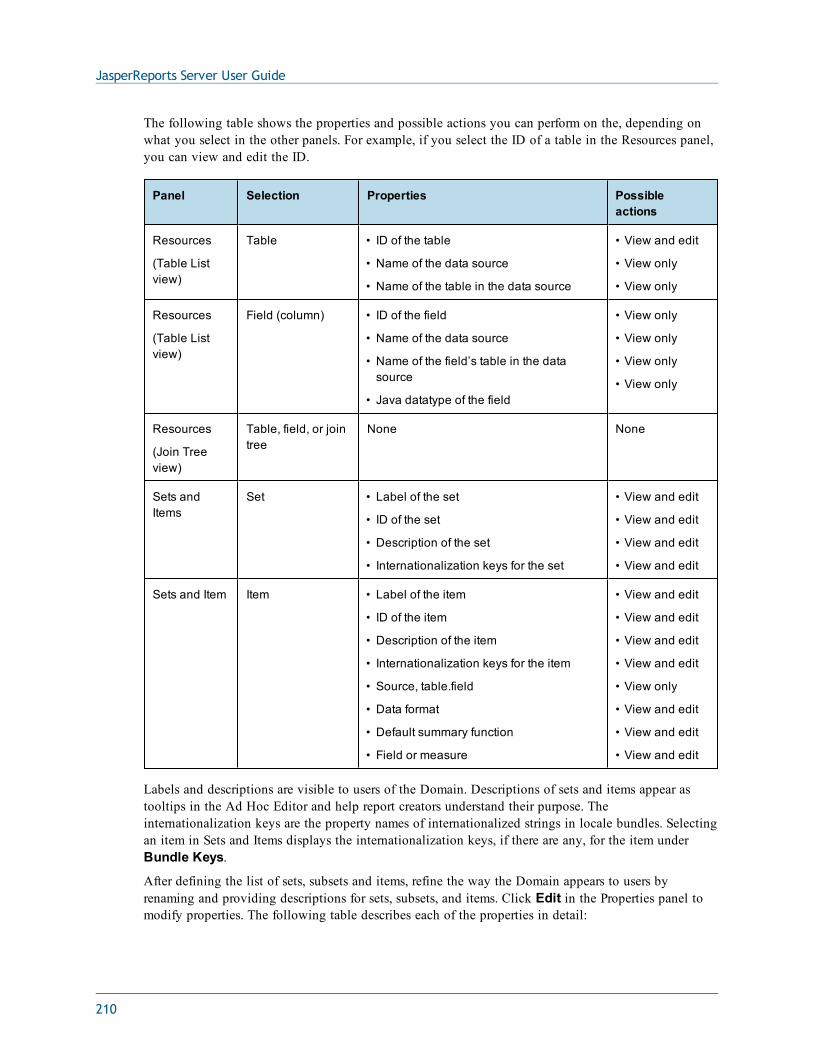
JasperReports Server User Guide
The following table shows the properties and possible actions you can perform on the, depending onwhat you select in the other panels. For example, if you select the ID of a table in the Resources panel,you can view and edit the ID.
Panel Selection Properties Possibleactions
Resources
(Table Listview)
Table • ID of the table
• Name of the data source
• Name of the table in the data source
• View and edit
• View only
• View only
Resources
(Table Listview)
Field (column) • ID of the field
• Name of the data source
• Name of the field’s table in the datasource
• Java datatype of the field
• View only
• View only
• View only
• View only
Resources
(Join Treeview)
Table, field, or jointree
None None
Sets andItems
Set • Label of the set
• ID of the set
• Description of the set
• Internationalization keys for the set
• View and edit
• View and edit
• View and edit
• View and edit
Sets and Item Item • Label of the item
• ID of the item
• Description of the item
• Internationalization keys for the item
• Source, table.field
• Data format
• Default summary function
• Field or measure
• View and edit
• View and edit
• View and edit
• View and edit
• View only
• View and edit
• View and edit
• View and edit
Labels and descriptions are visible to users of the Domain. Descriptions of sets and items appear astooltips in the Ad Hoc Editor and help report creators understand their purpose. Theinternationalization keys are the property names of internationalized strings in locale bundles. Selectingan item in Sets and Items displays the internationalization keys, if there are any, for the item underBundle Keys.
After defining the list of sets, subsets and items, refine the way the Domain appears to users byrenaming and providing descriptions for sets, subsets, and items. Click Edit in the Properties panel tomodify properties. The following table describes each of the properties in detail:
210
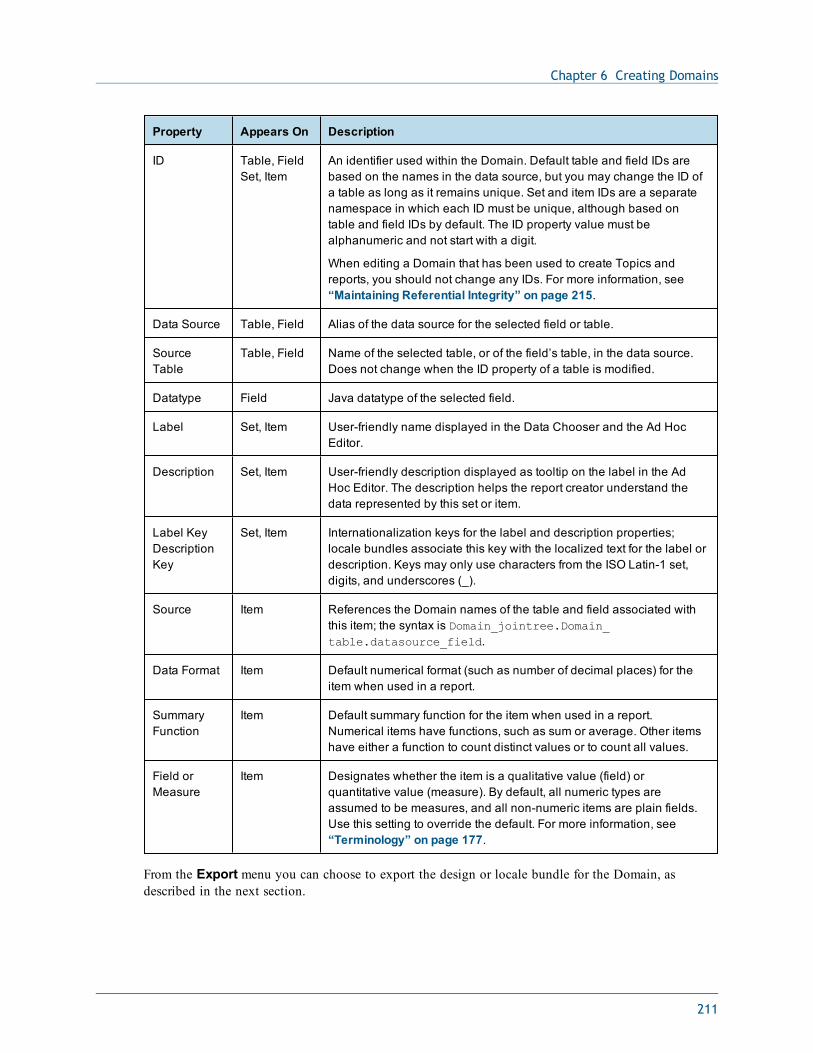
Chapter 6 Creating Domains
Property Appears On Description
ID Table, FieldSet, Item
An identifier used within the Domain. Default table and field IDs arebased on the names in the data source, but you may change the ID ofa table as long as it remains unique. Set and item IDs are a separatenamespace in which each ID must be unique, although based ontable and field IDs by default. The ID property value must bealphanumeric and not start with a digit.
When editing a Domain that has been used to create Topics andreports, you should not change any IDs. For more information, see“Maintaining Referential Integrity” on page 215.
Data Source Table, Field Alias of the data source for the selected field or table.
SourceTable
Table, Field Name of the selected table, or of the field’s table, in the data source.Does not change when the ID property of a table is modified.
Datatype Field Java datatype of the selected field.
Label Set, Item User-friendly name displayed in the Data Chooser and the Ad HocEditor.
Description Set, Item User-friendly description displayed as tooltip on the label in the AdHoc Editor. The description helps the report creator understand thedata represented by this set or item.
Label KeyDescriptionKey
Set, Item Internationalization keys for the label and description properties;locale bundles associate this key with the localized text for the label ordescription. Keys may only use characters from the ISO Latin-1 set,digits, and underscores (_).
Source Item References the Domain names of the table and field associated withthis item; the syntax is Domain_jointree.Domain_table.datasource_field.
Data Format Item Default numerical format (such as number of decimal places) for theitem when used in a report.
SummaryFunction
Item Default summary function for the item when used in a report.Numerical items have functions, such as sum or average. Other itemshave either a function to count distinct values or to count all values.
Field orMeasure
Item Designates whether the item is a qualitative value (field) orquantitative value (measure). By default, all numeric types areassumed to be measures, and all non-numeric items are plain fields.Use this setting to override the default. For more information, see“Terminology” on page 177.
From the Export menu you can choose to export the design or locale bundle for the Domain, asdescribed in the next section.
211
JasperReports Server User Guide
6.5.9 Designer Tool BarThe tool bar buttons operate on the Domain design in its current state, regardless of which tab isselected.
• Check Design – Validates the Domain as described in the next section.
• Export Design – Exports the XML design for the Domain. Use this menu item if you want to editthe XML in an external editor, for example to duplicate settings with copy-paste or to enter acomplex formula. Exporting the XML design from the Domain Designer avoids having to write itfrom scratch. For more information, see “The Domain Design File” on page 241.
• Export Bundle – Generates the internationalization keys and saves them to a Java properties filethat serves as a template for the locale bundles. Use this menu item to create a template for thelocale bundles after you have defined the sets and items on the Display tab. You can select a checkbox to automatically generate keys based on the set and item IDs. This option is visible only afteryou define localized sets or items. For more information, see “Locale Bundles” on page 277.
You can save time editing the properties for a large number of sets and items by using the exportedXML file instead of using the properties table on the Display tab. For more information aboutsaving and uploading XML, see “The Domain Design File” on page 241.
Before exporting a bundle, make sure the set and item IDs are finalized because they are used togenerate the keys. The generated keys are added to the Domain design and appear in the table ofproperties. For more information about the internationalization keys, see “Locale Bundles” onpage 277.
6.5.10 Domain ValidationThe validation of a Domain ensures that all of its components are consistent. The Domain Designerchecks the syntax of files when they are uploaded, but overall consistency must be checked whensaving a new or edited Domain.
When you click Check Design, the Domain Designer performs the following validation.
1. Verifies that the tables and columns of the Domain design exist in the data source.
In special cases where you need to create a design before the data source is available, thisstep can be omitted by setting a parameter in the server configuration file. See theJasperReports Server Administrator Guide.
2. Verifies that all items in each defined set originate in the same join tree.
3. Verifies that all items reference existing columns.
4. Verifies that derived tables have valid SQL queries.
5. If a security file has been uploaded, verifies that all items and sets in the security file exist in theDomain design.
If validation fails, the Domain Designer remains open and a message appears to help you correct theerror. Make the necessary changes to the settings and save again. If the settings are in the uploadedfiles, edit the files and upload them again.
Validation is important because the Domain design may include derived table queries and calculatedfield expressions entered by the user.
212
Chapter 6 Creating Domains
Validation occurs at the following times:
• When opening the Domain Designer. This check detects any inconsistencies in Domain designsfrom uploaded files.
• When navigating from tab to tab under certain circumstances. This check detects problems on thetab where they occur.
• When changing the data source.
• When exporting the Domain design file.
• When clicking Check Design in the Domain Designer.
• When clicking OK to exit the Domain Designer.
Unless you click Check Design, no message appears when validation succeeds. When validation fails,however, a message appears to help you correct the error.
6.6 Editing a DomainYou can edit a Domain by changing, adding to, and deleting its components.
Use extreme caution when editing Domains that might have been used for reports and DomainTopics. A Domain specifies the data source for the Domain Topics and reports that are based on theDomain. These Domain Topics and reports might fail if you edit the underlying Domain; if you deletethe underlying Domain, dependent reports fail.
Before you edit a Domain, see “Maintaining Referential Integrity” on page 215.
To edit a Domain:
1. Log in to the server as an administrator and select View > Search Results.
2. Locate the Domain.
a. Choose View > Search Results.
b. In the Filters panel, under Types, click More choices.
c. Click Domains.
3. Right-click an existing Domain and select Edit from the context menu.
The Edit Domain page appears. This page is similar to the Add New Domain page documented in“Using the Add New Domain Page” on page 196.
213
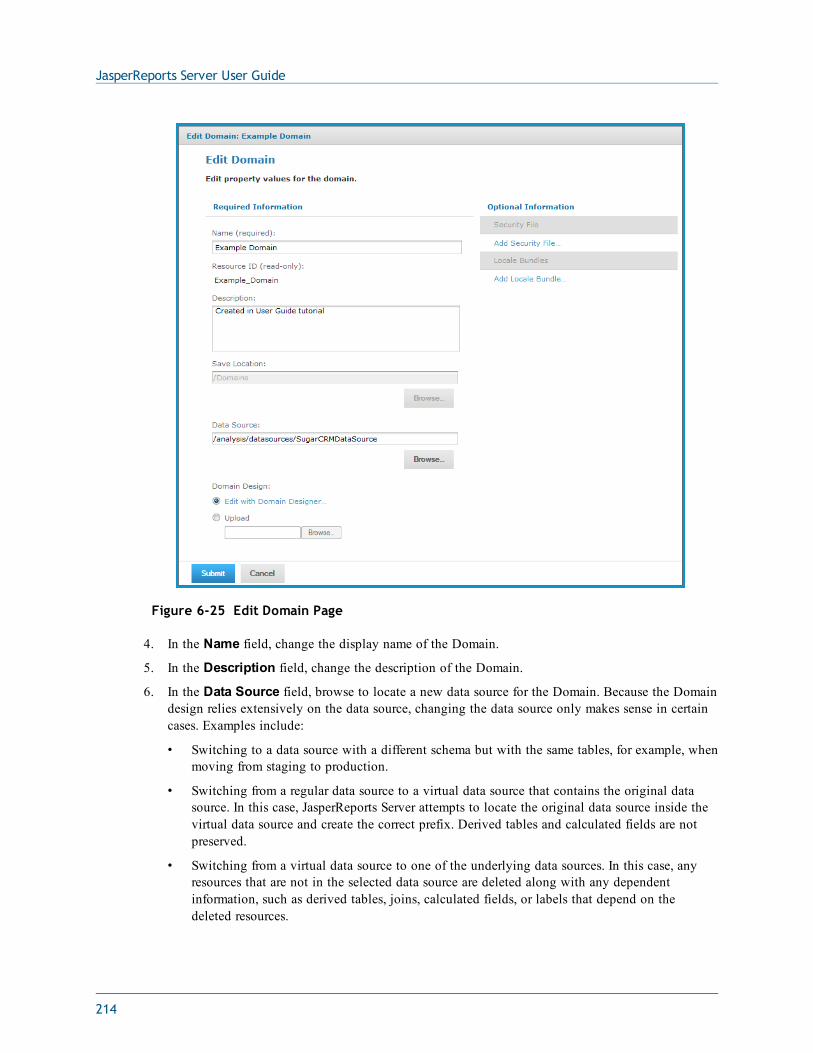
JasperReports Server User Guide
Figure 6-25 Edit Domain Page
4. In the Name field, change the display name of the Domain.
5. In the Description field, change the description of the Domain.
6. In the Data Source field, browse to locate a new data source for the Domain. Because the Domaindesign relies extensively on the data source, changing the data source only makes sense in certaincases. Examples include:
• Switching to a data source with a different schema but with the same tables, for example, whenmoving from staging to production.
• Switching from a regular data source to a virtual data source that contains the original datasource. In this case, JasperReports Server attempts to locate the original data source inside thevirtual data source and create the correct prefix. Derived tables and calculated fields are notpreserved.
• Switching from a virtual data source to one of the underlying data sources. In this case, anyresources that are not in the selected data source are deleted along with any dependentinformation, such as derived tables, joins, calculated fields, or labels that depend on thedeleted resources.
214
Chapter 6 Creating Domains
If you change to a data source with a different database, the definitions in the Domain design are nolonger valid and you are not able to save the Domain.
Before you switch the data source for a Domain, you should back up the Domain and export aDomain design file. See “Switching the Data Source of a Domain” on page 282 for moreinformation.
7. Under Domain Design, click Edit with Domain Designer. For instructions, see section “Usingthe Domain Designer” on page 200. Alternatively, select the Upload option, and browse tolocate a Domain design file. You can import the XML file of the Domain design after exporting itand making modifications in an external editor. See also “Maintaining Referential Integrity”below if you need to remove items in the Domain.
8. To add or replace the security file or locale bundles for the Domain, click Add Security File orAdd Locale Bundle in Optional Information. The Resources page is further documented insection “The Domain Design File” on page 241.
9. Click Submit to update the Domain. To close the Domain Designer without modifying theDomain stored in the repository, click Cancel.
After modifying a Domain, you must clear the Ad Hoc cache of all queries based on the Domain. Thisremoves any data that was based on the old instance of the Domain and avoids inconsistencies in newreports. For instructions, see the JasperReports Server Administrator Guide.
6.6.1 Maintaining Referential IntegrityWhen editing an existing Domain, the user is responsible for maintaining the referential integritybetween the items in the Domain and any Domain Topics or reports that have been created from theDomain. Referential integrity means that at the time a Domain Topic or report is opened or run, all theitems that the Domain references are still defined in the Domain. If you modify a Domain by removingsets or items, you must be sure that no Domain Topics or reports are based on those sets or items. Evenif the underlying tables and columns still exist in the database, the sets and items referenced in theDomain must still exist in the Domain.
Domain items are identified by their IDs and the IDs of the sets in which they are located. Changingthe ID of an item or moving it to a different set also makes it unavailable to any Topics and reportsthat referenced the ID. To change the name of an item or set, edit its label property, not its ID (see“The Properties Panel” on page 209). Moving an item is considered the same as deleting it from itscurrent location so it can be added elsewhere.
Any report that references a deleted item no longer runs, nor can you open it in the Ad Hoc Editoragain. A Domain Topic that references a deleted item causes errors when used in the Ad Hoc Editor.You can, however, open a Domain Topic for editing and remove references to deleted items. Thataction, however, allows only new reports to use the Domain Topic, and does not fix the broken reportsbased on the items deleted from the Domain Topic.
The granularity of referential integrity is at the individual set and item level. This means that changesto sets and items that are not used in a given report or Topic do not affect the report or Topic. Forexample, if you delete an item used by Topic A but not Topic B, then Topic A fails and reports basedon Topic A that included the item fail. But Topic B and its reports are unaffected, as are any reportsbased on Topic A that did not include the deleted item.
215
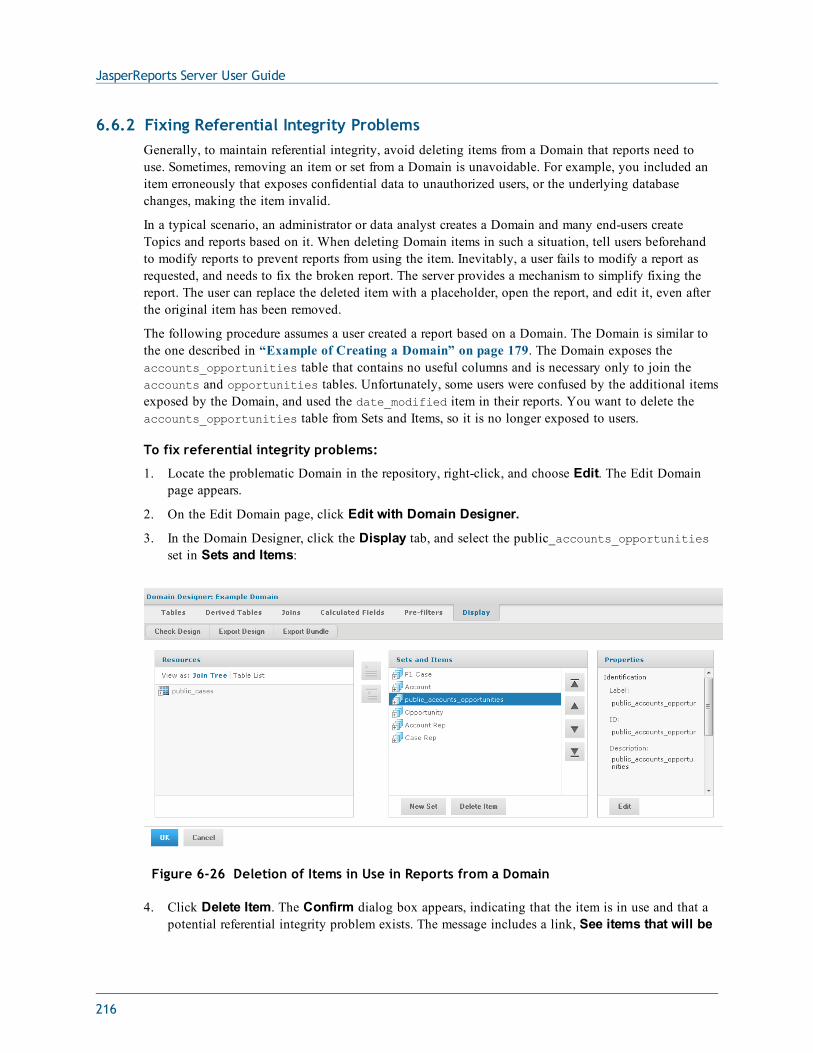
JasperReports Server User Guide
6.6.2 Fixing Referential Integrity ProblemsGenerally, to maintain referential integrity, avoid deleting items from a Domain that reports need touse. Sometimes, removing an item or set from a Domain is unavoidable. For example, you included anitem erroneously that exposes confidential data to unauthorized users, or the underlying databasechanges, making the item invalid.
In a typical scenario, an administrator or data analyst creates a Domain and many end-users createTopics and reports based on it. When deleting Domain items in such a situation, tell users beforehandto modify reports to prevent reports from using the item. Inevitably, a user fails to modify a report asrequested, and needs to fix the broken report. The server provides a mechanism to simplify fixing thereport. The user can replace the deleted item with a placeholder, open the report, and edit it, even afterthe original item has been removed.
The following procedure assumes a user created a report based on a Domain. The Domain is similar tothe one described in “Example of Creating a Domain” on page 179. The Domain exposes theaccounts_opportunities table that contains no useful columns and is necessary only to join theaccounts and opportunities tables. Unfortunately, some users were confused by the additional itemsexposed by the Domain, and used the date_modified item in their reports. You want to delete theaccounts_opportunities table from Sets and Items, so it is no longer exposed to users.
To fix referential integrity problems:
1. Locate the problematic Domain in the repository, right-click, and choose Edit. The Edit Domainpage appears.
2. On the Edit Domain page, click Edit with Domain Designer.
3. In the Domain Designer, click the Display tab, and select the public_accounts_opportunitiesset in Sets and Items:
Figure 6-26 Deletion of Items in Use in Reports from a Domain
4. Click Delete Item. The Confirm dialog box appears, indicating that the item is in use and that apotential referential integrity problem exists. The message includes a link, See items that will be
216
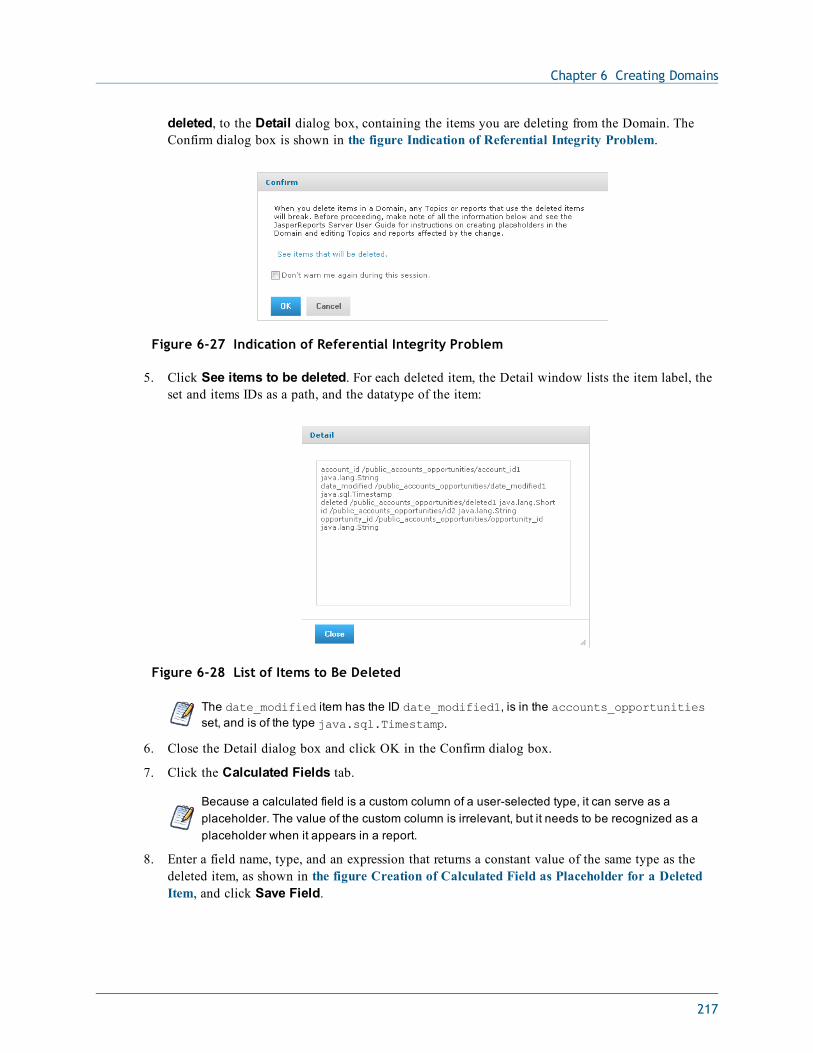
Chapter 6 Creating Domains
deleted, to the Detail dialog box, containing the items you are deleting from the Domain. TheConfirm dialog box is shown in the figure Indication of Referential Integrity Problem.
Figure 6-27 Indication of Referential Integrity Problem
5. Click See items to be deleted. For each deleted item, the Detail window lists the item label, theset and items IDs as a path, and the datatype of the item:
Figure 6-28 List of Items to Be Deleted
The date_modified item has the ID date_modified1, is in the accounts_opportunitiesset, and is of the type java.sql.Timestamp.
6. Close the Detail dialog box and click OK in the Confirm dialog box.
7. Click the Calculated Fields tab.
Because a calculated field is a custom column of a user-selected type, it can serve as aplaceholder. The value of the custom column is irrelevant, but it needs to be recognized as aplaceholder when it appears in a report.
8. Enter a field name, type, and an expression that returns a constant value of the same type as thedeleted item, as shown in the figure Creation of Calculated Field as Placeholder for a DeletedItem, and click Save Field.
217
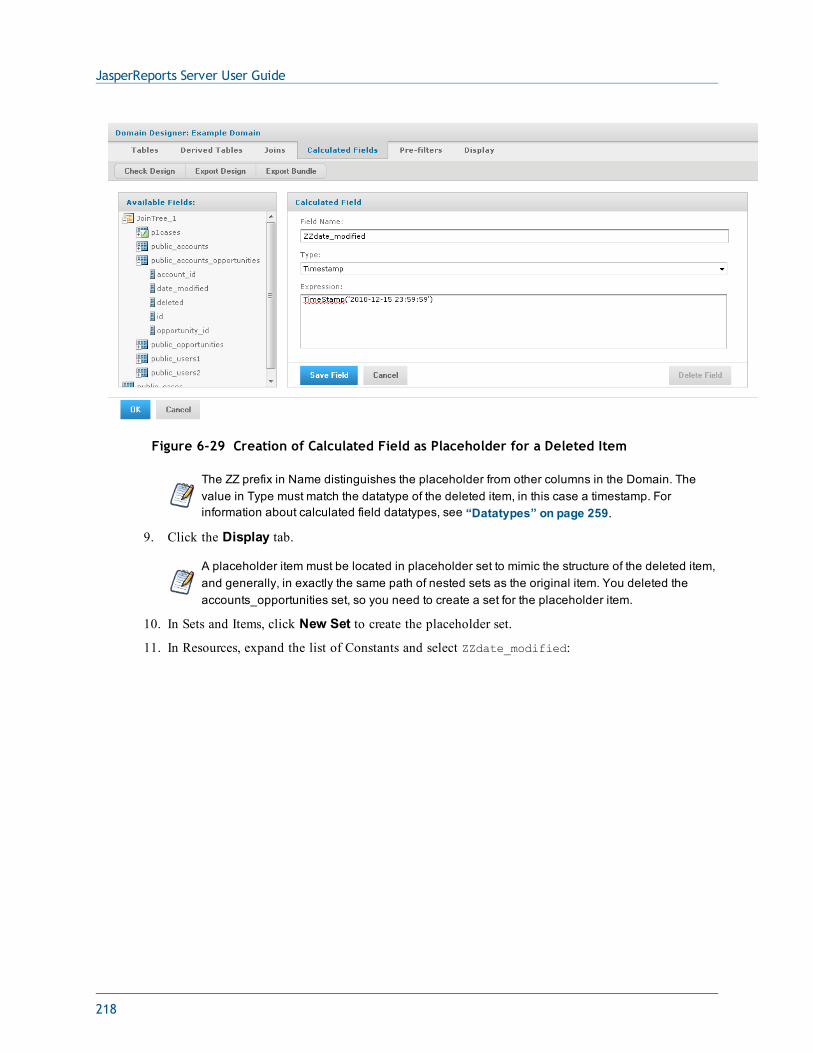
JasperReports Server User Guide
Figure 6-29 Creation of Calculated Field as Placeholder for a Deleted Item
The ZZ prefix in Name distinguishes the placeholder from other columns in the Domain. Thevalue in Type must match the datatype of the deleted item, in this case a timestamp. Forinformation about calculated field datatypes, see “Datatypes” on page 259.
9. Click the Display tab.
A placeholder item must be located in placeholder set to mimic the structure of the deleted item,and generally, in exactly the same path of nested sets as the original item. You deleted theaccounts_opportunities set, so you need to create a set for the placeholder item.
10. In Sets and Items, click New Set to create the placeholder set.
11. In Resources, expand the list of Constants and select ZZdate_modified:
218
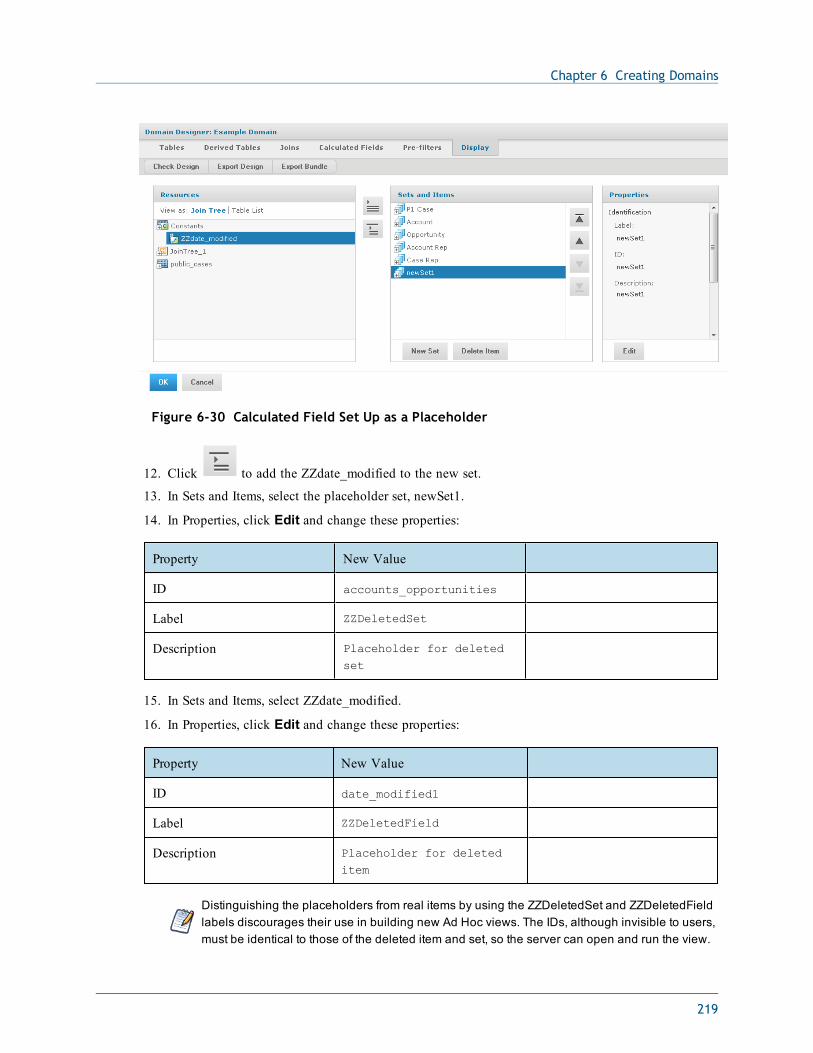
Chapter 6 Creating Domains
Figure 6-30 Calculated Field Set Up as a Placeholder
12. Click to add the ZZdate_modified to the new set.
13. In Sets and Items, select the placeholder set, newSet1.
14. In Properties, click Edit and change these properties:
Property New Value
ID accounts_opportunities
Label ZZDeletedSet
Description Placeholder for deletedset
15. In Sets and Items, select ZZdate_modified.
16. In Properties, click Edit and change these properties:
Property New Value
ID date_modified1
Label ZZDeletedField
Description Placeholder for deleteditem
Distinguishing the placeholders from real items by using the ZZDeletedSet and ZZDeletedFieldlabels discourages their use in building new Ad Hoc views. The IDs, although invisible to users,must be identical to those of the deleted item and set, so the server can open and run the view.
219
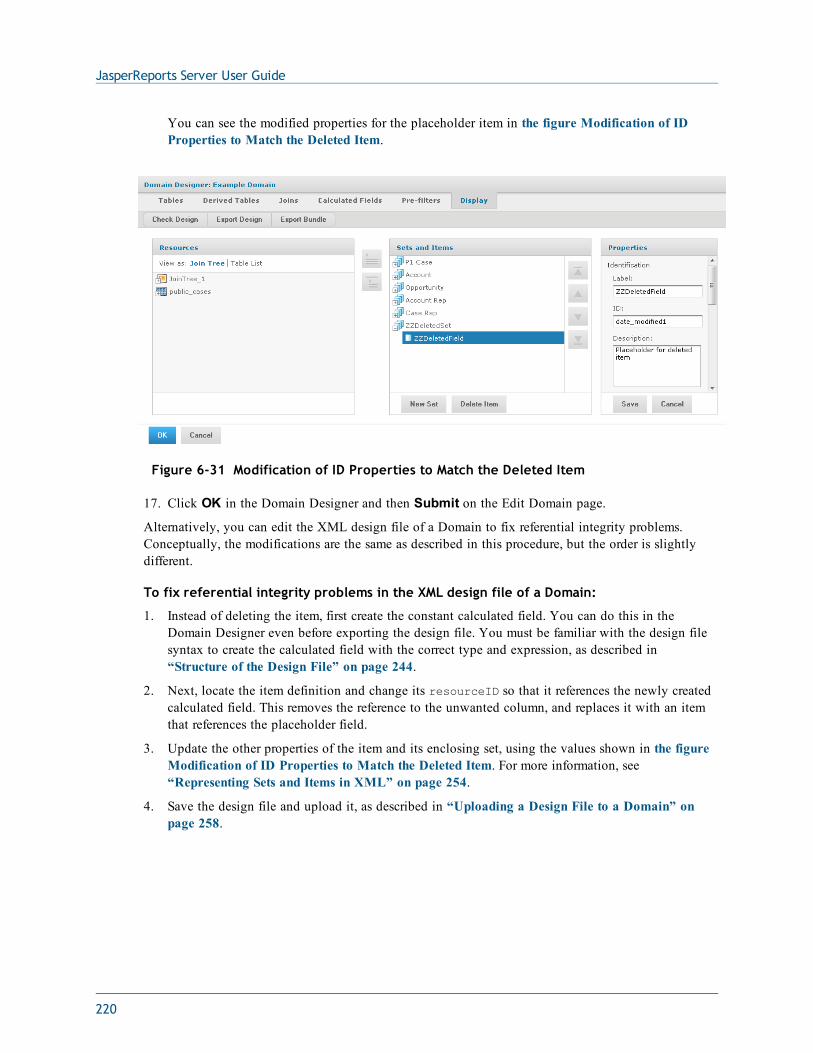
JasperReports Server User Guide
You can see the modified properties for the placeholder item in the figure Modification of IDProperties to Match the Deleted Item.
Figure 6-31 Modification of ID Properties to Match the Deleted Item
17. Click OK in the Domain Designer and then Submit on the Edit Domain page.
Alternatively, you can edit the XML design file of a Domain to fix referential integrity problems.Conceptually, the modifications are the same as described in this procedure, but the order is slightlydifferent.
To fix referential integrity problems in the XML design file of a Domain:
1. Instead of deleting the item, first create the constant calculated field. You can do this in theDomain Designer even before exporting the design file. You must be familiar with the design filesyntax to create the calculated field with the correct type and expression, as described in“Structure of the Design File” on page 244.
2. Next, locate the item definition and change its resourceID so that it references the newly createdcalculated field. This removes the reference to the unwanted column, and replaces it with an itemthat references the placeholder field.
3. Update the other properties of the item and its enclosing set, using the values shown in the figureModification of ID Properties to Match the Deleted Item. For more information, see“Representing Sets and Items in XML” on page 254.
4. Save the design file and upload it, as described in “Uploading a Design File to a Domain” onpage 258.
220
CHAPTER 7 ACCESSING REPORTS AND DOMAINS FROM IREPORTThis section describes functionality that can be restricted by the software license for JasperReportsServer. If you don’t see some of the options described in this section, your license may prohibit youfrom using them. To find out what you're licensed to use, or to upgrade your license, contactJaspersoft.
iReport Designer includes JasperReports Server and Domain plug-ins. Using the JasperReports ServerPlug-in, you move reports between iReport and JasperReports Server. The server plug-in uses webservices to interact with the server.
You can download iReport Designer from the Jaspersoft Community website.
Some tasks you can perform using the server plug-in are:
• Browse the repository on the server from iReport.
• Add reports and subreports to the repository from iReport.
• Drag and drop images and other resources from the repository to the iReport Designer tab.
• Add and delete folders and resources on the server from iReport. Resources include images, fonts,JRXML files, JAR files, datatypes, and input controls.
• Modify resource properties on the server from iReport.
• Link input controls to reports on the server.
• Import and export data sources (JDBC, JNDI, and JavaBean).
• Download, edit, and upload JRXML files.
• Connect to multiple servers to facilitate access both test and production environments.
Using the Domain Plug-in, you can create a report in iReport based on a Domain in JasperReportsServer.
This chapter contains the following sections:
• Plug-in Requirements
• Connecting to the Server from iReport
• Creating a Report Unit in the Repository from iReport
221
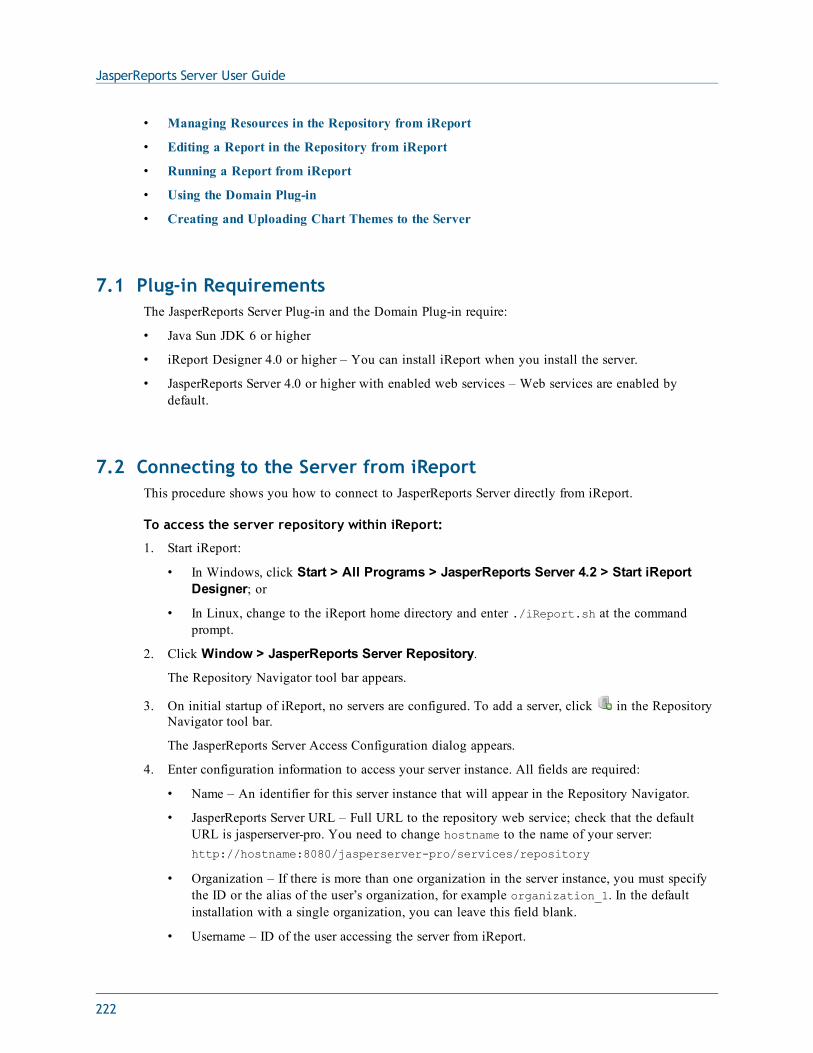
JasperReports Server User Guide
• Managing Resources in the Repository from iReport
• Editing a Report in the Repository from iReport
• Running a Report from iReport
• Using the Domain Plug-in
• Creating and Uploading Chart Themes to the Server
7.1 Plug-in RequirementsThe JasperReports Server Plug-in and the Domain Plug-in require:
• Java Sun JDK 6 or higher
• iReport Designer 4.0 or higher – You can install iReport when you install the server.
• JasperReports Server 4.0 or higher with enabled web services – Web services are enabled bydefault.
7.2 Connecting to the Server from iReportThis procedure shows you how to connect to JasperReports Server directly from iReport.
To access the server repository within iReport:
1. Start iReport:
• In Windows, click Start > All Programs > JasperReports Server 4.2 > Start iReportDesigner; or
• In Linux, change to the iReport home directory and enter ./iReport.sh at the commandprompt.
2. Click Window > JasperReports Server Repository.
The Repository Navigator tool bar appears.
3. On initial startup of iReport, no servers are configured. To add a server, click in the RepositoryNavigator tool bar.
The JasperReports Server Access Configuration dialog appears.
4. Enter configuration information to access your server instance. All fields are required:
• Name – An identifier for this server instance that will appear in the Repository Navigator.
• JasperReports Server URL – Full URL to the repository web service; check that the defaultURL is jasperserver-pro. You need to change hostname to the name of your server:http://hostname:8080/jasperserver-pro/services/repository
• Organization – If there is more than one organization in the server instance, you must specifythe ID or the alias of the user’s organization, for example organization_1. In the defaultinstallation with a single organization, you can leave this field blank.
• Username – ID of the user accessing the server from iReport.
222
Chapter 7 Accessing Reports and Domains from iReport
• Password – The password of the user.
Figure 7-1 Configuration to Access the Server from iReport
5. Click Save, then expand the repository tree in the Repository Navigator.
Figure 7-2 Server Repository as Seen from iReport
The visibility and access to resources in the Repository Navigator depend on the organization andpermissions of the user.
You can add multiple servers to the Repository Navigator. Servers configured for iReport 3.1 versionsof the plug-in and later are compatible with the iReport 4.0.0 or later version of the plug-in. You mayexperience problems if you connect to incompatible servers.
223
JasperReports Server User Guide
7.3 Creating a Report Unit in the Repository from iReportTo add a new report unit, you need a JRXML file, which you can create in iReport beforehand. Areport unit has a main JRXML file, a data source, input controls (zero or more), and resources (zero ormore).
To create a report unit in the repository:
1. In the Repository Navigator, shown in the figure Server Repository as Seen from iReport, right-click a parent folder for the new report and click Add > JasperServer Report. For example, addthe report unit to the Reports folder.
The ReportUnit Wizard appears.
2. In the Naming step, enter an ID, for example, report_unit_example. No spaces allowed.
3. In the Name field, enter a meaningful name. For example, enter Report Unit Example. Thisname will appear in the repository on the server, and consequently, in the Repository Navigator.
4. In the Description field, briefly describe the report unit. The description will appear in therepository on the server and help users find the report they need.
5. Click Next.
6. In the Main JRXML step, locate the main JRXML file in the repository or on your hard drive. Youcan also specify a report that you have open in iReport.
For example, assume you have a report file named report1.jrxml on your hard drive that youalready opened the report in iReport. Select Locally Defined, then click the Get source fromcurrent opened report button.
7. Click Next.
8. In the Locate Data Source step, select one of the following options:
• From the repository
• Locally Defined
• Don’t use any data source
For this example, select Locally Defined.
9. Click the Edit local datasource button.
The Data Source dialog appears.
10. In the Data Source dialog:
a. On the General tab, enter a unique ID. No spaces allowed. For example, enter MyFoodmartDS.
b. In Name, enter a meaningful name. This name will appear in the repository on the server. Forexample, enter FoodmartDS.
c. On the Data Source Details tab, select a data source type, for example JDBC Data Source,and fill in the required details:
• Driver – org.postgresql.Driver
• URL – jdbc:postgresql://localhost:5432/foodmart
• User name (for the database) – postgres
• Password (for the database)
224
Chapter 7 Accessing Reports and Domains from iReport
If you defined the JDBC data source in the currently opened report, you can click the Importfrom iReport button to help provide these details. Select the data source from the drop-downthat you specified during report design. Fill in the port number for the database (5432 forexample), and click OK
In the figure Data Source Details, you'll see the typical details for a JDBC data source.
Figure 7-3 Data Source Details
d. Click Save.
11. In the ReportUnit wizard, click Finish.
If the report unit doesn’t appear in the Repository Navigator, right-click the server name(MyServer in the figure The New Report Unit in the Repository Navigator) and select Refreshfrom the context menu.
12. In the Repository Navigator, expand the Reports folder. The report unit, Report Unit Example,appears:
225
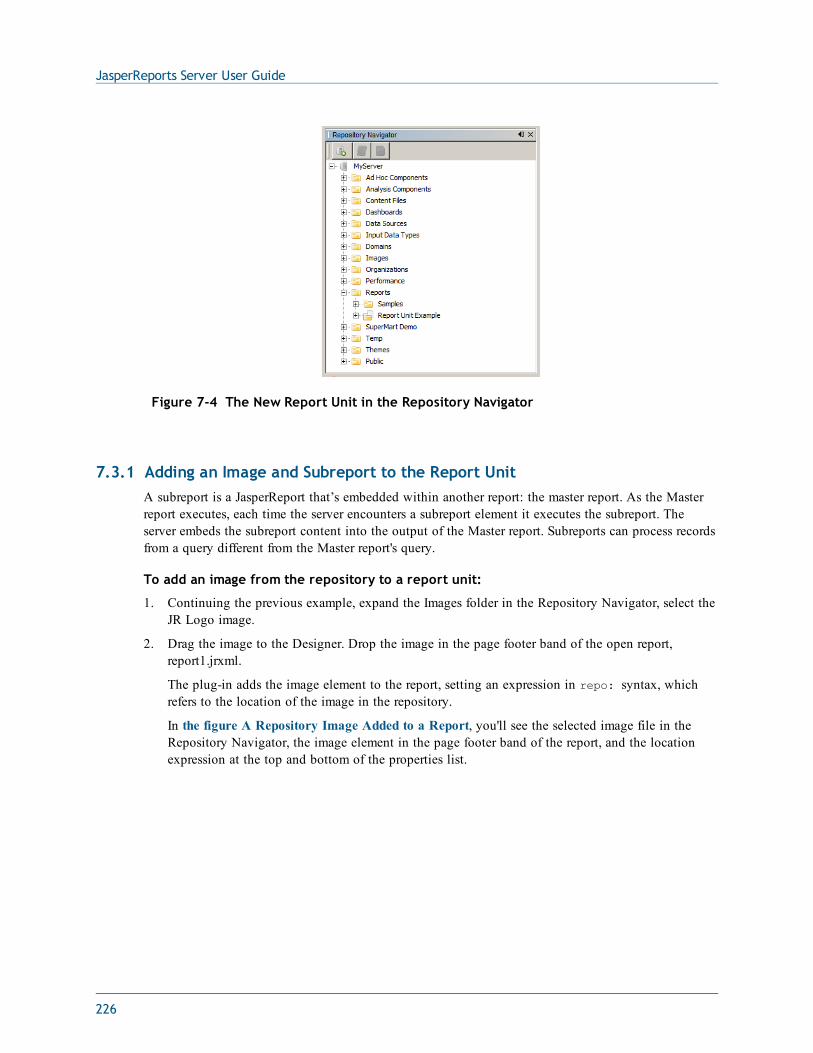
JasperReports Server User Guide
Figure 7-4 The New Report Unit in the Repository Navigator
7.3.1 Adding an Image and Subreport to the Report UnitA subreport is a JasperReport that’s embedded within another report: the master report. As the Masterreport executes, each time the server encounters a subreport element it executes the subreport. Theserver embeds the subreport content into the output of the Master report. Subreports can process recordsfrom a query different from the Master report's query.
To add an image from the repository to a report unit:
1. Continuing the previous example, expand the Images folder in the Repository Navigator, select theJR Logo image.
2. Drag the image to the Designer. Drop the image in the page footer band of the open report,report1.jrxml.
The plug-in adds the image element to the report, setting an expression in repo: syntax, whichrefers to the location of the image in the repository.
In the figure A Repository Image Added to a Report, you'll see the selected image file in theRepository Navigator, the image element in the page footer band of the report, and the locationexpression at the top and bottom of the properties list.
226
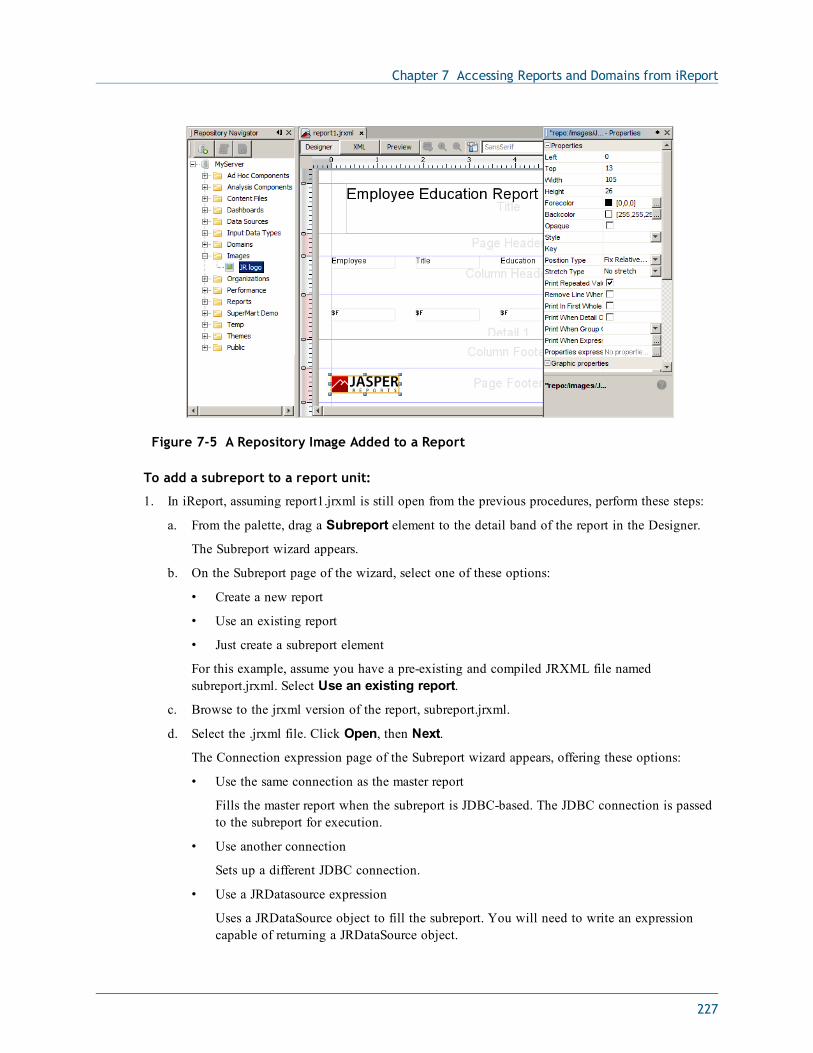
Chapter 7 Accessing Reports and Domains from iReport
Figure 7-5 A Repository Image Added to a Report
To add a subreport to a report unit:
1. In iReport, assuming report1.jrxml is still open from the previous procedures, perform these steps:
a. From the palette, drag a Subreport element to the detail band of the report in the Designer.
The Subreport wizard appears.
b. On the Subreport page of the wizard, select one of these options:
• Create a new report
• Use an existing report
• Just create a subreport element
For this example, assume you have a pre-existing and compiled JRXML file namedsubreport.jrxml. Select Use an existing report.
c. Browse to the jrxml version of the report, subreport.jrxml.
d. Select the .jrxml file. Click Open, then Next.
The Connection expression page of the Subreport wizard appears, offering these options:
• Use the same connection as the master report
Fills the master report when the subreport is JDBC-based. The JDBC connection is passedto the subreport for execution.
• Use another connection
Sets up a different JDBC connection.
• Use a JRDatasource expression
Uses a JRDataSource object to fill the subreport. You will need to write an expressioncapable of returning a JRDataSource object.
227
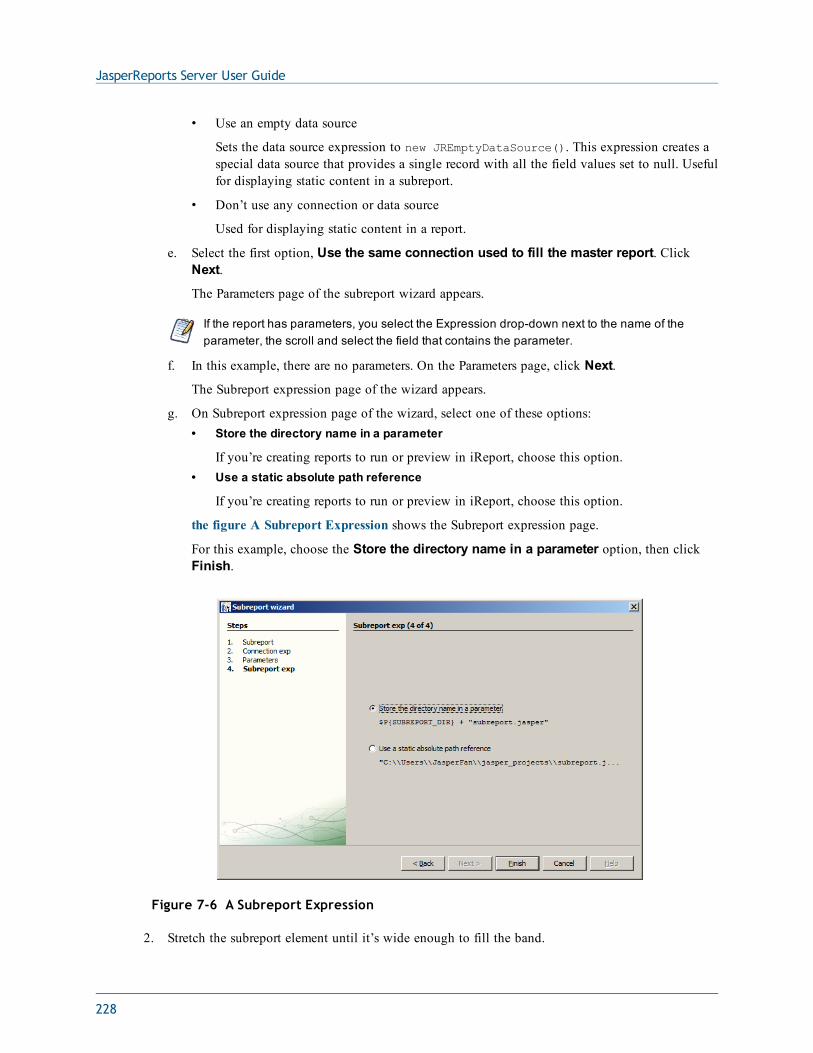
JasperReports Server User Guide
• Use an empty data source
Sets the data source expression to new JREmptyDataSource(). This expression creates aspecial data source that provides a single record with all the field values set to null. Usefulfor displaying static content in a subreport.
• Don’t use any connection or data source
Used for displaying static content in a report.
e. Select the first option, Use the same connection used to fill the master report. ClickNext.
The Parameters page of the subreport wizard appears.
If the report has parameters, you select the Expression drop-down next to the name of theparameter, the scroll and select the field that contains the parameter.
f. In this example, there are no parameters. On the Parameters page, click Next.
The Subreport expression page of the wizard appears.
g. On Subreport expression page of the wizard, select one of these options:• Store the directory name in a parameter
If you’re creating reports to run or preview in iReport, choose this option.• Use a static absolute path reference
If you’re creating reports to run or preview in iReport, choose this option.
the figure A Subreport Expression shows the Subreport expression page.
For this example, choose the Store the directory name in a parameter option, then clickFinish.
Figure 7-6 A Subreport Expression
2. Stretch the subreport element until it’s wide enough to fill the band.
228
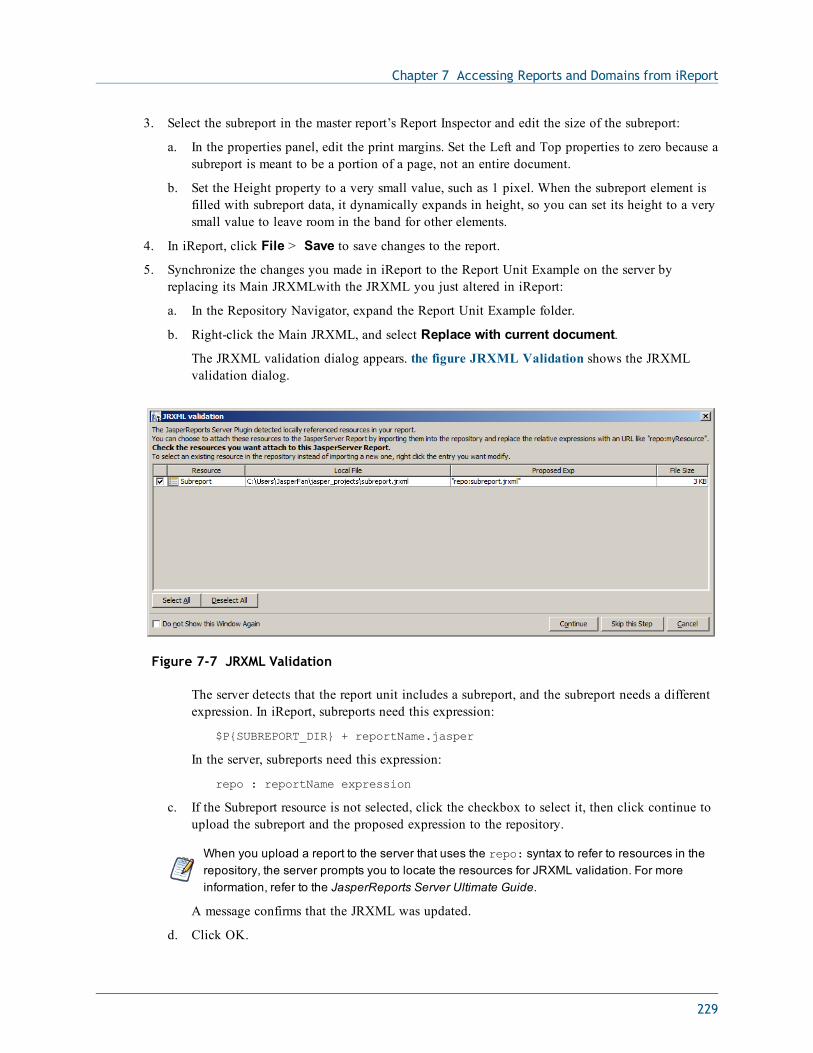
Chapter 7 Accessing Reports and Domains from iReport
3. Select the subreport in the master report’s Report Inspector and edit the size of the subreport:
a. In the properties panel, edit the print margins. Set the Left and Top properties to zero because asubreport is meant to be a portion of a page, not an entire document.
b. Set the Height property to a very small value, such as 1 pixel. When the subreport element isfilled with subreport data, it dynamically expands in height, so you can set its height to a verysmall value to leave room in the band for other elements.
4. In iReport, click File > Save to save changes to the report.
5. Synchronize the changes you made in iReport to the Report Unit Example on the server byreplacing its Main JRXMLwith the JRXML you just altered in iReport:
a. In the Repository Navigator, expand the Report Unit Example folder.
b. Right-click the Main JRXML, and select Replace with current document.
The JRXML validation dialog appears. the figure JRXML Validation shows the JRXMLvalidation dialog.
Figure 7-7 JRXML Validation
The server detects that the report unit includes a subreport, and the subreport needs a differentexpression. In iReport, subreports need this expression:
$P{SUBREPORT_DIR} + reportName.jasper
In the server, subreports need this expression:
repo : reportName expression
c. If the Subreport resource is not selected, click the checkbox to select it, then click continue toupload the subreport and the proposed expression to the repository.
When you upload a report to the server that uses the repo: syntax to refer to resources in therepository, the server prompts you to locate the resources for JRXML validation. For moreinformation, refer to the JasperReports Server Ultimate Guide.
A message confirms that the JRXML was updated.
d. Click OK.
229
JasperReports Server User Guide
In the Repository Navigator, the subreport jrxml appears in the Resources folder of the ReportUnit Example.
6. To run the report from iReport:
a. Right-click the Report Unit Example folder in the Repository Navigator.
You cannot run a subreport alone on the server; you must run the entire report unit.
b. Select Run JasperServer Report from the context menu.
7. To run the report in the server, first you need to link a data source to the report:
a. Log into the server.
b. Click View > Repository. Select the report unit in the repository.
c. Click Edit.
d. On the Set Up page, upload report1.jrxml.
e. On the Data Source page, link a data source to the report. For example, select the followingdata source from the repository:
/Analysis Components/Analysis Data Sources/FoodmartDataSourceJNDI
7.4 Managing Resources in the Repository from iReportWhile creating reports that you intend to store in the repository, you also need to create and managethe resources associated with them, such as images, JARs, JRXML files, property files for localizedreports, input controls, datatypes, lists of values, style templates (JRTX), and data sources. If you’remaintaining existing reports, you may need to access, modify, and save changes to existing resources.You can also modify the location, name, or description of the repository folders.
To add, modify, or delete resources to the repository from iReport:
1. If the Repository Navigator is not open, click Window > JasperReports Server Repository.
2. To add a resource to the repository, right-click a folder, select Add, and then select the type ofobject you want to add.
If you choose to add any item other than a JasperReport, a dialog for entering the location andother information about the object appears. If you choose to add a JasperReport, a wizardguides you through the process.
3. To change the location of a resource in the repository, locate the object, then drag-and-drop it tothe new location.
Or, perform the following steps:
a. Right-click the object and select Copy or Cut. Or use the keyboard shortcuts: Ctrl-C and Ctrl-X, respectively.
b. Locate the destination, right-click, and select Paste, or use the keyboard shortcut Ctrl-V.
When cutting the object, it is not removed from its original location until pasted in the newlocation.
230
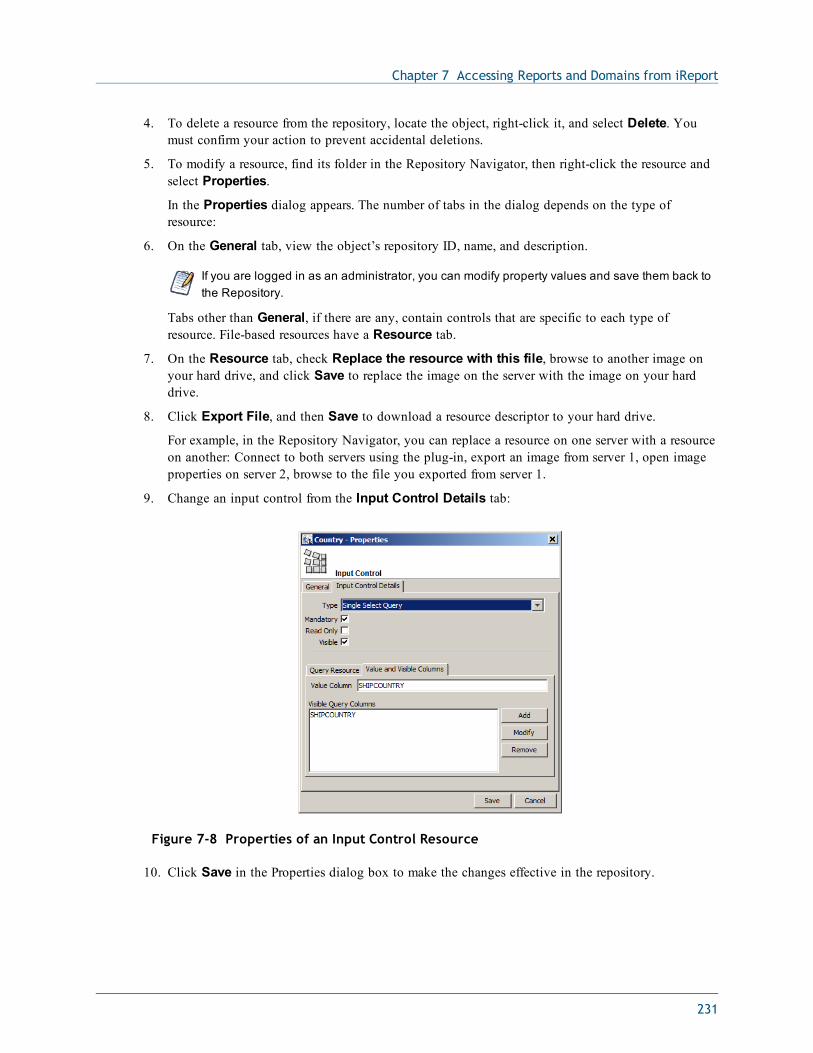
Chapter 7 Accessing Reports and Domains from iReport
4. To delete a resource from the repository, locate the object, right-click it, and select Delete. Youmust confirm your action to prevent accidental deletions.
5. To modify a resource, find its folder in the Repository Navigator, then right-click the resource andselect Properties.
In the Properties dialog appears. The number of tabs in the dialog depends on the type ofresource:
6. On the General tab, view the object’s repository ID, name, and description.
If you are logged in as an administrator, you can modify property values and save them back tothe Repository.
Tabs other than General, if there are any, contain controls that are specific to each type ofresource. File-based resources have a Resource tab.
7. On the Resource tab, check Replace the resource with this file, browse to another image onyour hard drive, and click Save to replace the image on the server with the image on your harddrive.
8. Click Export File, and then Save to download a resource descriptor to your hard drive.
For example, in the Repository Navigator, you can replace a resource on one server with a resourceon another: Connect to both servers using the plug-in, export an image from server 1, open imageproperties on server 2, browse to the file you exported from server 1.
9. Change an input control from the Input Control Details tab:
Figure 7-8 Properties of an Input Control Resource
10. Click Save in the Properties dialog box to make the changes effective in the repository.
231
JasperReports Server User Guide
7.5 Editing a Report in the Repository from iReport
In the Repository Navigator, the icon means a report unit, and means a JRXML file. When youwork with a JRXML file in the Repository from iReport, iReport operates on a copy of the file. Youneed to upload the JRXML file to put it back into the repository when finished.
To edit a JRXML file in the Repository from iReport:
1. In the Repository Navigator, right-click the JRXML file in the report unit and select Open inEditor.
The JRXML from the repository is stored locally in the <USER_HOME>/.ireport/jstmp directory.This directory is never automatically cleared.
The JRXML appears in the Designer window.
2. Edit the file, either in the Designer or in the XML editor. For information about adding images orsubreports to the JRXML file, see “Creating a Report Unit in the Repository from iReport” onpage 224.
3. To save the file and upload it to the repository, right-click the file in the repository tree and clickReplace with Current JRXML.
A message confirms the operation’s success.
To edit a Report Unit in the Repository from iReport:
1. In the Repository Navigator, right-click the report unit and select Properties.
2. On the General tab, change the repository name and description.
3. On the Main Report and Data Source tab, you can change the JRXML file for the report, eitherby selecting one from the repository, or uploading one through iReport. Click Current Report touse the JRXML currently being edited in iReport. Similarly, you can select the data source fromthe repository or from iReport. See Figure 7-9 on page 233.
4. On the Other tab, you can set display properties for any input controls.
5. On the JSP fields you can modify the appearance of the controls.
The Controls Layout determines where they appear.
232
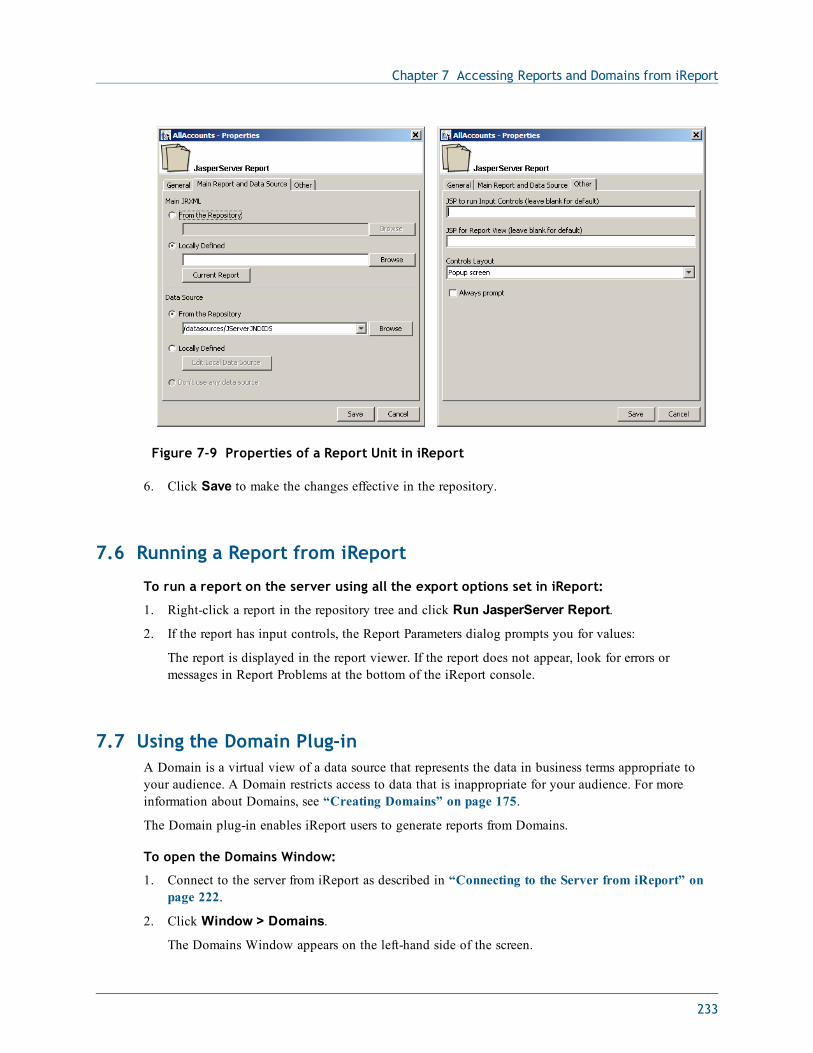
Chapter 7 Accessing Reports and Domains from iReport
Figure 7-9 Properties of a Report Unit in iReport
6. Click Save to make the changes effective in the repository.
7.6 Running a Report from iReport
To run a report on the server using all the export options set in iReport:
1. Right-click a report in the repository tree and click Run JasperServer Report.
2. If the report has input controls, the Report Parameters dialog prompts you for values:
The report is displayed in the report viewer. If the report does not appear, look for errors ormessages in Report Problems at the bottom of the iReport console.
7.7 Using the Domain Plug-inA Domain is a virtual view of a data source that represents the data in business terms appropriate toyour audience. A Domain restricts access to data that is inappropriate for your audience. For moreinformation about Domains, see “Creating Domains” on page 175.
The Domain plug-in enables iReport users to generate reports from Domains.
To open the Domains Window:
1. Connect to the server from iReport as described in “Connecting to the Server from iReport” onpage 222.
2. Click Window > Domains.
The Domains Window appears on the left-hand side of the screen.
233
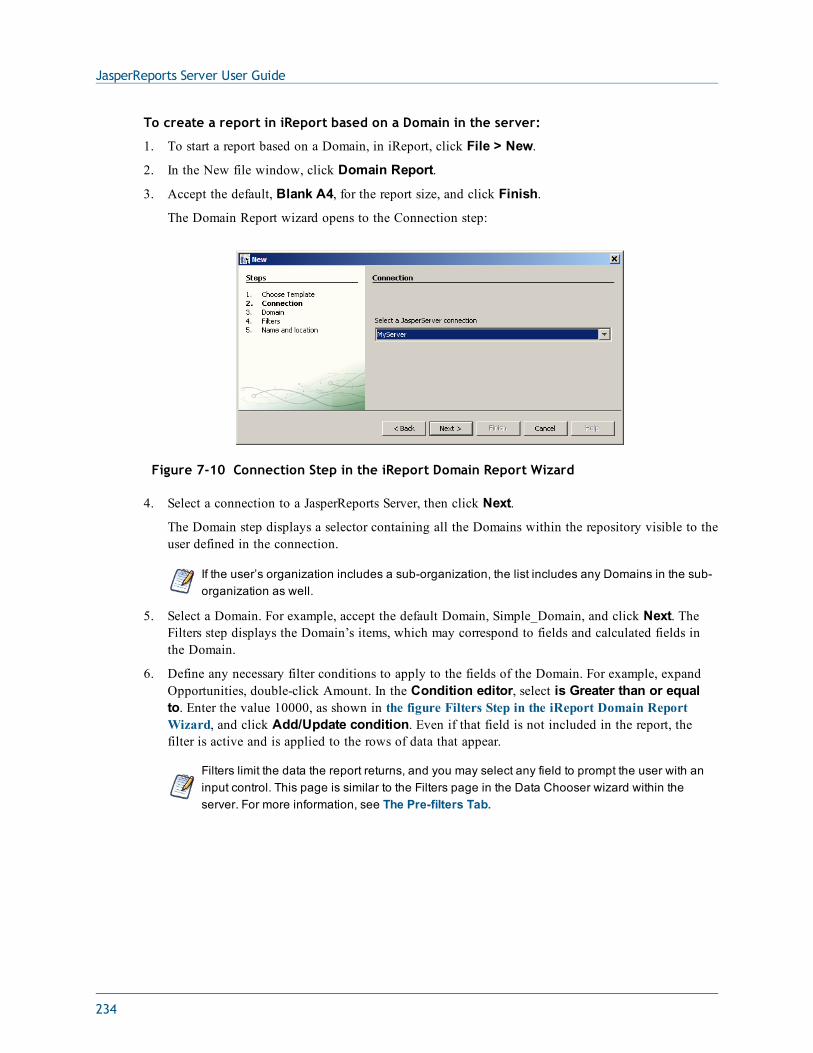
JasperReports Server User Guide
To create a report in iReport based on a Domain in the server:
1. To start a report based on a Domain, in iReport, click File > New.
2. In the New file window, click Domain Report.
3. Accept the default, Blank A4, for the report size, and click Finish.
The Domain Report wizard opens to the Connection step:
Figure 7-10 Connection Step in the iReport Domain Report Wizard
4. Select a connection to a JasperReports Server, then click Next.
The Domain step displays a selector containing all the Domains within the repository visible to theuser defined in the connection.
If the user’s organization includes a sub-organization, the list includes any Domains in the sub-organization as well.
5. Select a Domain. For example, accept the default Domain, Simple_Domain, and click Next. TheFilters step displays the Domain’s items, which may correspond to fields and calculated fields inthe Domain.
6. Define any necessary filter conditions to apply to the fields of the Domain. For example, expandOpportunities, double-click Amount. In the Condition editor, select is Greater than or equalto. Enter the value 10000, as shown in the figure Filters Step in the iReport Domain ReportWizard, and click Add/Update condition. Even if that field is not included in the report, thefilter is active and is applied to the rows of data that appear.
Filters limit the data the report returns, and you may select any field to prompt the user with aninput control. This page is similar to the Filters page in the Data Chooser wizard within theserver. For more information, see The Pre-filters Tab.
234
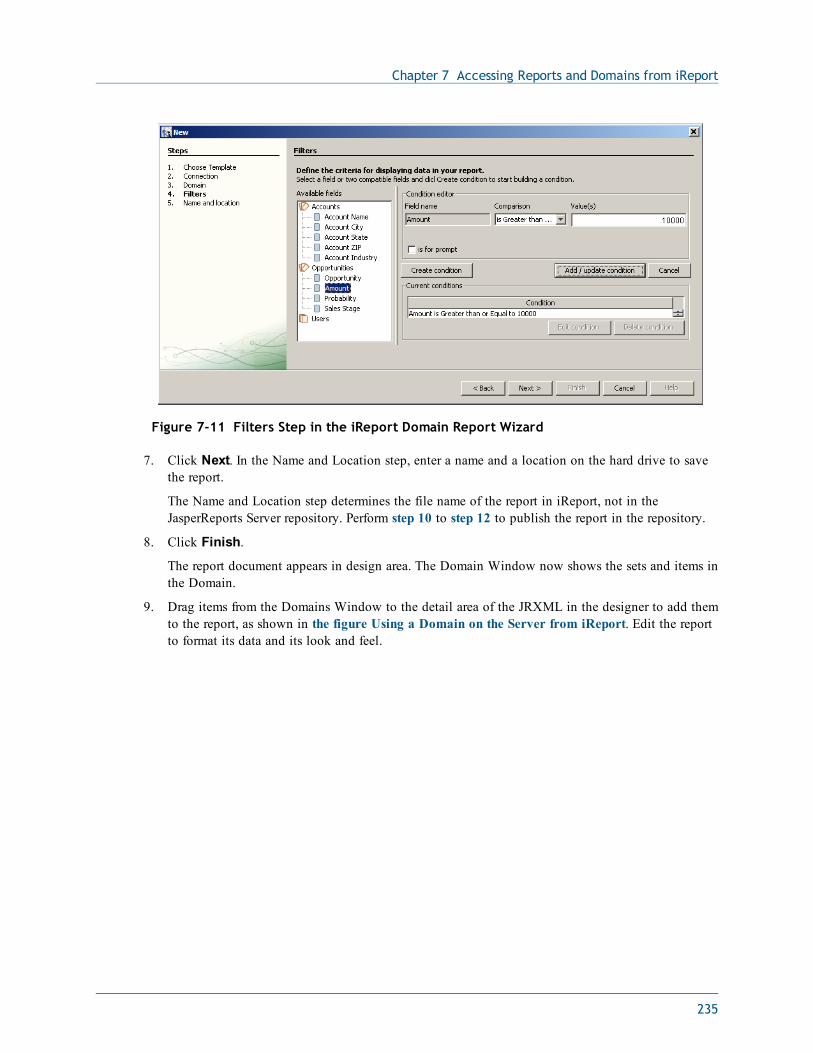
Chapter 7 Accessing Reports and Domains from iReport
Figure 7-11 Filters Step in the iReport Domain Report Wizard
7. Click Next. In the Name and Location step, enter a name and a location on the hard drive to savethe report.
The Name and Location step determines the file name of the report in iReport, not in theJasperReports Server repository. Perform step 10 to step 12 to publish the report in the repository.
8. Click Finish.
The report document appears in design area. The Domain Window now shows the sets and items inthe Domain.
9. Drag items from the Domains Window to the detail area of the JRXML in the designer to add themto the report, as shown in the figure Using a Domain on the Server from iReport. Edit the reportto format its data and its look and feel.
235
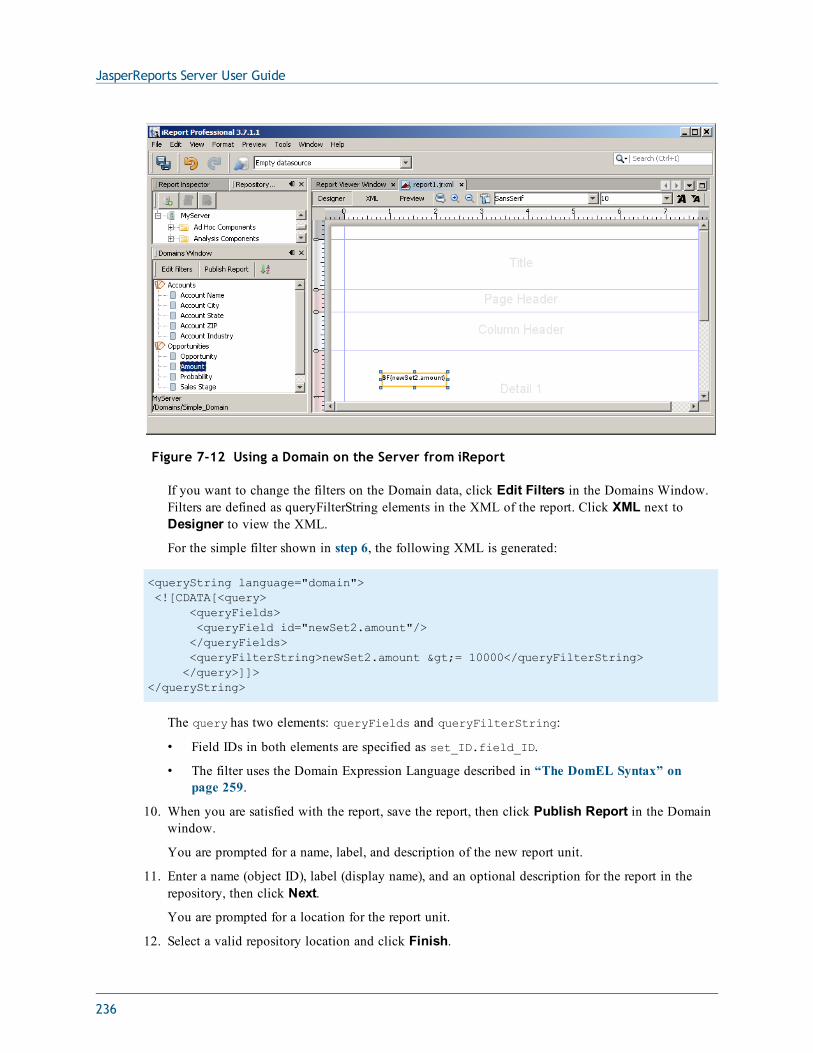
JasperReports Server User Guide
Figure 7-12 Using a Domain on the Server from iReport
If you want to change the filters on the Domain data, click Edit Filters in the Domains Window.Filters are defined as queryFilterString elements in the XML of the report. Click XML next toDesigner to view the XML.
For the simple filter shown in step 6, the following XML is generated:
<queryString language="domain"><![CDATA[<query>
<queryFields><queryField id="newSet2.amount"/></queryFields><queryFilterString>newSet2.amount >= 10000</queryFilterString></query>]]>
</queryString>
The query has two elements: queryFields and queryFilterString:
• Field IDs in both elements are specified as set_ID.field_ID.
• The filter uses the Domain Expression Language described in “The DomEL Syntax” onpage 259.
10. When you are satisfied with the report, save the report, then click Publish Report in the Domainwindow.
You are prompted for a name, label, and description of the new report unit.
11. Enter a name (object ID), label (display name), and an optional description for the report in therepository, then click Next.
You are prompted for a location for the report unit.
12. Select a valid repository location and click Finish.
236
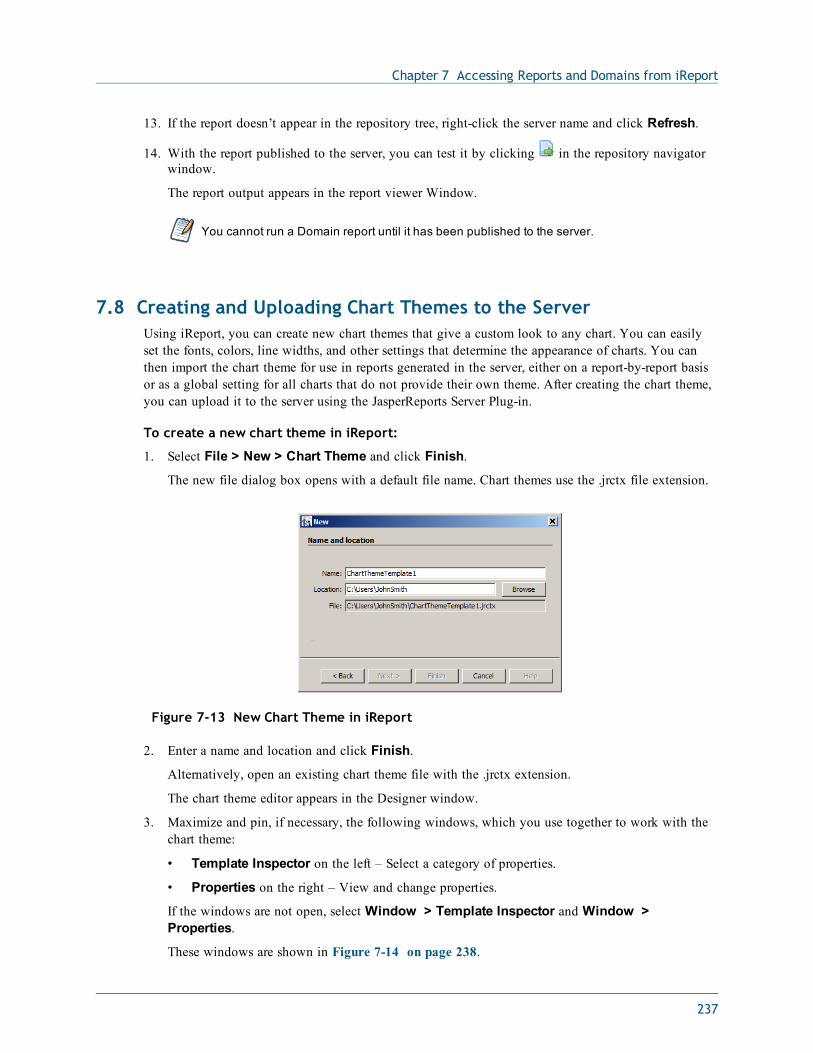
Chapter 7 Accessing Reports and Domains from iReport
13. If the report doesn’t appear in the repository tree, right-click the server name and click Refresh.
14. With the report published to the server, you can test it by clicking in the repository navigatorwindow.
The report output appears in the report viewer Window.
You cannot run a Domain report until it has been published to the server.
7.8 Creating and Uploading Chart Themes to the ServerUsing iReport, you can create new chart themes that give a custom look to any chart. You can easilyset the fonts, colors, line widths, and other settings that determine the appearance of charts. You canthen import the chart theme for use in reports generated in the server, either on a report-by-report basisor as a global setting for all charts that do not provide their own theme. After creating the chart theme,you can upload it to the server using the JasperReports Server Plug-in.
To create a new chart theme in iReport:
1. Select File > New > Chart Theme and click Finish.
The new file dialog box opens with a default file name. Chart themes use the .jrctx file extension.
Figure 7-13 New Chart Theme in iReport
2. Enter a name and location and click Finish.
Alternatively, open an existing chart theme file with the .jrctx extension.
The chart theme editor appears in the Designer window.
3. Maximize and pin, if necessary, the following windows, which you use together to work with thechart theme:
• Template Inspector on the left – Select a category of properties.
• Properties on the right – View and change properties.
If the windows are not open, select Window > Template Inspector and Window >Properties.
These windows are shown in Figure 7-14 on page 238.
237
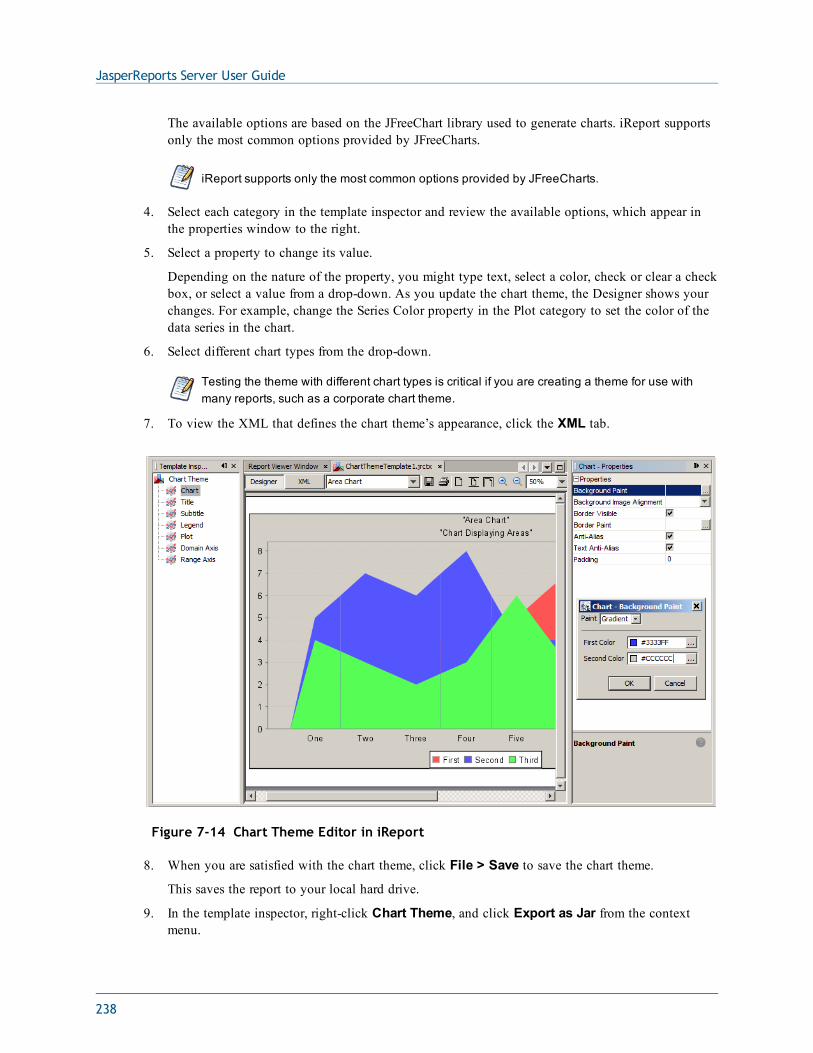
JasperReports Server User Guide
The available options are based on the JFreeChart library used to generate charts. iReport supportsonly the most common options provided by JFreeCharts.
iReport supports only the most common options provided by JFreeCharts.
4. Select each category in the template inspector and review the available options, which appear inthe properties window to the right.
5. Select a property to change its value.
Depending on the nature of the property, you might type text, select a color, check or clear a checkbox, or select a value from a drop-down. As you update the chart theme, the Designer shows yourchanges. For example, change the Series Color property in the Plot category to set the color of thedata series in the chart.
6. Select different chart types from the drop-down.
Testing the theme with different chart types is critical if you are creating a theme for use withmany reports, such as a corporate chart theme.
7. To view the XML that defines the chart theme’s appearance, click the XML tab.
Figure 7-14 Chart Theme Editor in iReport
8. When you are satisfied with the chart theme, click File > Save to save the chart theme.
This saves the report to your local hard drive.
9. In the template inspector, right-click Chart Theme, and click Export as Jar from the contextmenu.
238
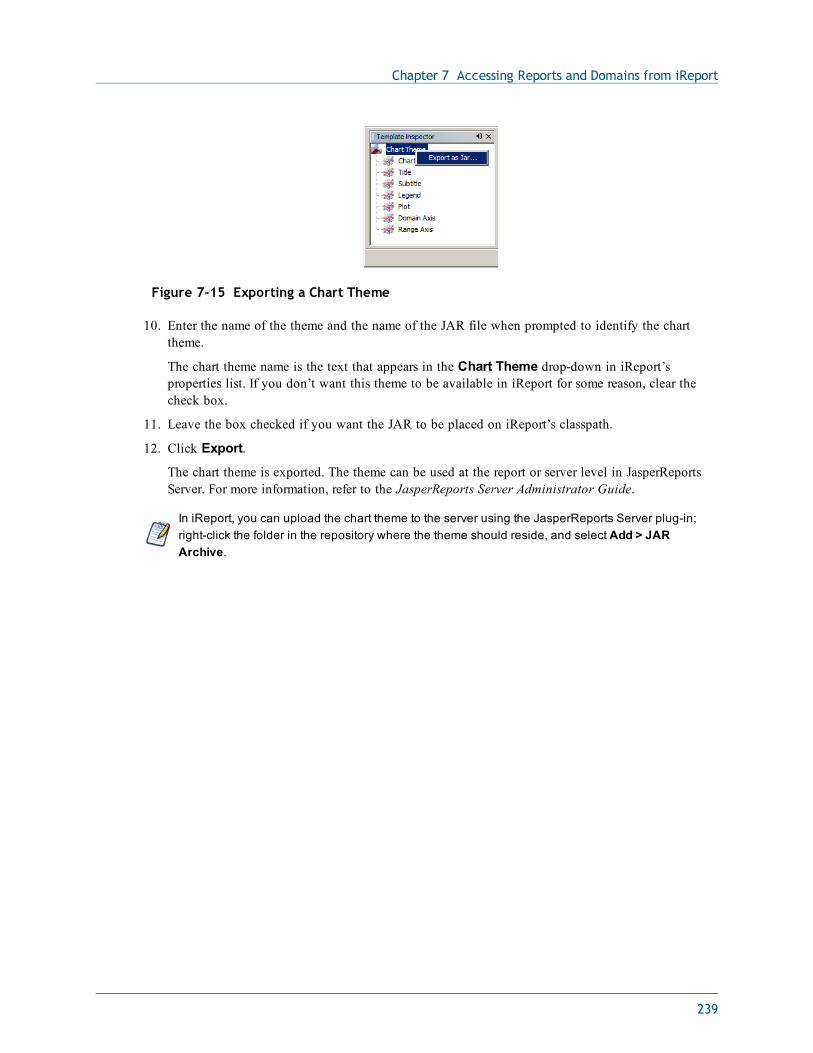
Chapter 7 Accessing Reports and Domains from iReport
Figure 7-15 Exporting a Chart Theme
10. Enter the name of the theme and the name of the JAR file when prompted to identify the charttheme.
The chart theme name is the text that appears in the Chart Theme drop-down in iReport’sproperties list. If you don’t want this theme to be available in iReport for some reason, clear thecheck box.
11. Leave the box checked if you want the JAR to be placed on iReport’s classpath.
12. Click Export.
The chart theme is exported. The theme can be used at the report or server level in JasperReportsServer. For more information, refer to the JasperReports Server Administrator Guide.
In iReport, you can upload the chart theme to the server using the JasperReports Server plug-in;right-click the folder in the repository where the theme should reside, and select Add > JARArchive.
239

JasperReports Server User Guide
240
CHAPTER 8 ADVANCED DOMAIN FEATURESThe security file and locale bundle are optional information in a Domain. When included, these optionsprovide data access permissions and localized strings for reports based on a Domain. The data securityand localized strings are defined in external files that Domain creators must upload to the Domain.Security and locale options take effect in the Ad Hoc Editor when creating the report and in the finaloutput when running the report.
The Domain design can be exported to an XML file and edited outside of JasperReports Server. Thisgives Domain creators an alternative to using JasperReports Server to modify the design and simplifiessharing of Domains between systems. This chapter documents the syntax for the security file and localebundle and discusses the important considerations in writing or modifying file contents. The discussionbegins with the Domain design file because the security file and locale bundles rely on certain values itcontains.
For a definition of the terms column, field, and item as used in Domains, see “Terminology” onpage 177.
This chapter contains the following sections:
• The Domain Design File
• The DomEL Syntax
• Security and Locale Information for a Domain
• The Domain Security File
• Locale Bundles
• Internationalized Databases
8.1 The Domain Design FileThe design of a Domain specifies the selection of tables in the data source, any derived tables, joins,calculated fields, and filters, as well as how those elements appear to users. In JasperReports Server, theDomain design can be created interactively through the Domain Designer, however there is also an
241
JasperReports Server User Guide
XML file format for exporting and uploading the settings. The text file containing a Domain designrepresented in XML is called a design file.
The XML in a design file is a hierarchy of elements and attributes on those elements that specifies allthe settings in the Domain. The elements and attributes are defined by an XML schema provided in anXSD file. In addition, there are constraints on a Domain design that are not expressed in the XMLschema. A design file can be modified or written from scratch in an editor and uploaded to the server,as long as it conforms to the XML schema and the design constraints.
XML is not the native format of the Domain design. The XML file is only a representation from whichthe design can be inferred. A design has additional constraints that are not mapped in the XMLformat.
There are several common use cases for working with design files:
• Completing the elements of a new design. Use the Domain Designer to define as much of thedesign as possible, then export the design file and add your handwritten code to the exported file.For example, you can enter the SQL query for a derived table or complex expressions for acalculated field.
• Working with very large Domains. The Domain Designer makes it easy to select all tables andcolumns and expose them as sets and items, but editing the labels and descriptions of dozens ofitems is faster when they appear in a single design file.
• Making repetitive changes to an existing Domain design. If the database changes or you want tomove a design file to a different system, you may need to edit each table or item in the design inthe same way. Using search-and-replace on an external editor does this quickly.
• Creating locale bundles and security files as described in the other sections of this chapter. Theseoptional files refer to elements of the Domain design, and it is often more convenient to copy-pastethem between external files.
• Creating a Domain design from scratch. It is possible to write a valid XML file that meets theconstraints of JasperReports Server and defines a Domain design. However, due to the complexityof creating a valid design file, it is much easier to begin with a basic design file exported from theDomain Designer or to modify an existing design file.
After editing, a design file can be uploaded, validated, and used to define the design of a new orexisting Domain. When you open the design in the Domain Designer again, the modifications appearand are editable in the Designer. For example, a description you added in the XML design file appearsin the Properties table of the Display Tab, and you are be able to edit it again the Designer. Otherelements of the XML file appear on some or all of the Designer tabs.
8.1.1 Exporting the Design File from a DomainThe design file of a Domain can be exported from the Domain Designer dialog and saved as an XMLfile. The file contains the current state of the Domain in the Domain Designer.
To export a Domain’s design file:
1. Log in to the server as an administrator and browse or search for the Domain you want to export.
2. Right-click the Domain and select Edit from the context-menu.
The Edit Domain page of the Domain Designer appears.
242
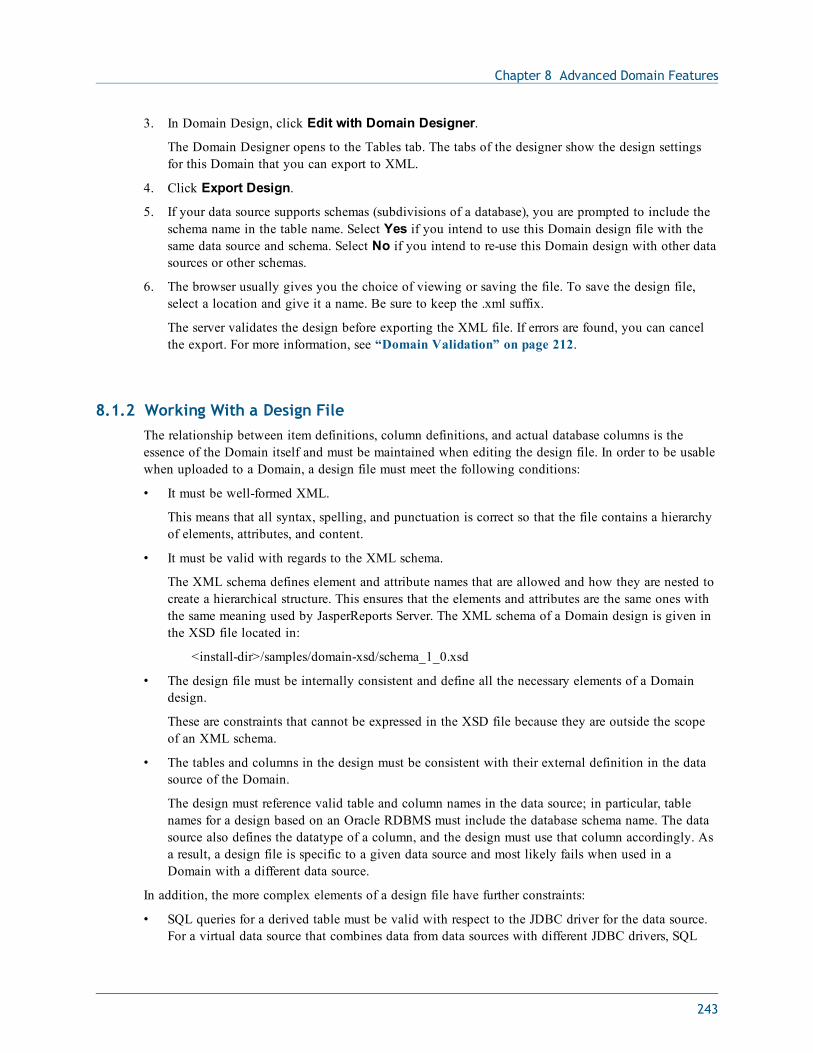
Chapter 8 Advanced Domain Features
3. In Domain Design, click Edit with Domain Designer.
The Domain Designer opens to the Tables tab. The tabs of the designer show the design settingsfor this Domain that you can export to XML.
4. Click Export Design.
5. If your data source supports schemas (subdivisions of a database), you are prompted to include theschema name in the table name. Select Yes if you intend to use this Domain design file with thesame data source and schema. Select No if you intend to re-use this Domain design with other datasources or other schemas.
6. The browser usually gives you the choice of viewing or saving the file. To save the design file,select a location and give it a name. Be sure to keep the .xml suffix.
The server validates the design before exporting the XML file. If errors are found, you can cancelthe export. For more information, see “Domain Validation” on page 212.
8.1.2 Working With a Design FileThe relationship between item definitions, column definitions, and actual database columns is theessence of the Domain itself and must be maintained when editing the design file. In order to be usablewhen uploaded to a Domain, a design file must meet the following conditions:
• It must be well-formed XML.
This means that all syntax, spelling, and punctuation is correct so that the file contains a hierarchyof elements, attributes, and content.
• It must be valid with regards to the XML schema.
The XML schema defines element and attribute names that are allowed and how they are nested tocreate a hierarchical structure. This ensures that the elements and attributes are the same ones withthe same meaning used by JasperReports Server. The XML schema of a Domain design is given inthe XSD file located in:
<install-dir>/samples/domain-xsd/schema_1_0.xsd
• The design file must be internally consistent and define all the necessary elements of a Domaindesign.
These are constraints that cannot be expressed in the XSD file because they are outside the scopeof an XML schema.
• The tables and columns in the design must be consistent with their external definition in the datasource of the Domain.
The design must reference valid table and column names in the data source; in particular, tablenames for a design based on an Oracle RDBMS must include the database schema name. The datasource also defines the datatype of a column, and the design must use that column accordingly. Asa result, a design file is specific to a given data source and most likely fails when used in aDomain with a different data source.
In addition, the more complex elements of a design file have further constraints:
• SQL queries for a derived table must be valid with respect to the JDBC driver for the data source.For a virtual data source that combines data from data sources with different JDBC drivers, SQL
243
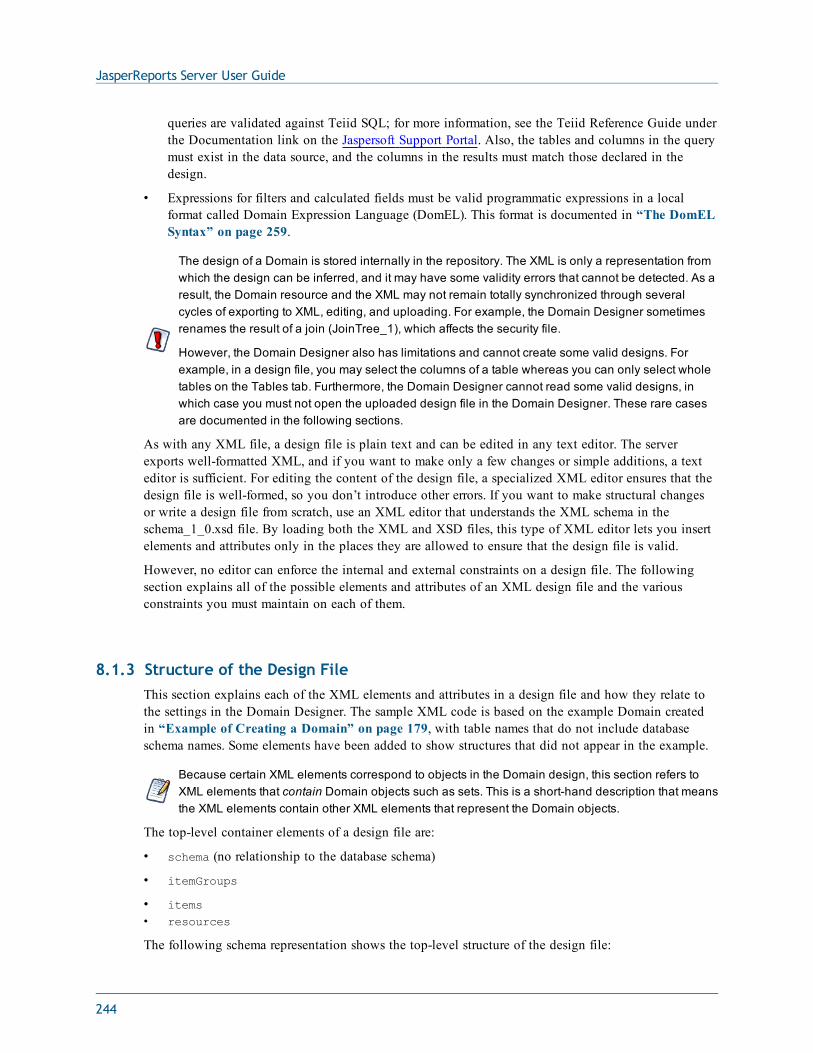
JasperReports Server User Guide
queries are validated against Teiid SQL; for more information, see the Teiid Reference Guide underthe Documentation link on the Jaspersoft Support Portal. Also, the tables and columns in the querymust exist in the data source, and the columns in the results must match those declared in thedesign.
• Expressions for filters and calculated fields must be valid programmatic expressions in a localformat called Domain Expression Language (DomEL). This format is documented in “The DomELSyntax” on page 259.
The design of a Domain is stored internally in the repository. The XML is only a representation fromwhich the design can be inferred, and it may have some validity errors that cannot be detected. As aresult, the Domain resource and the XML may not remain totally synchronized through severalcycles of exporting to XML, editing, and uploading. For example, the Domain Designer sometimesrenames the result of a join (JoinTree_1), which affects the security file.
However, the Domain Designer also has limitations and cannot create some valid designs. Forexample, in a design file, you may select the columns of a table whereas you can only select wholetables on the Tables tab. Furthermore, the Domain Designer cannot read some valid designs, inwhich case you must not open the uploaded design file in the Domain Designer. These rare casesare documented in the following sections.
As with any XML file, a design file is plain text and can be edited in any text editor. The serverexports well-formatted XML, and if you want to make only a few changes or simple additions, a texteditor is sufficient. For editing the content of the design file, a specialized XML editor ensures that thedesign file is well-formed, so you don’t introduce other errors. If you want to make structural changesor write a design file from scratch, use an XML editor that understands the XML schema in theschema_1_0.xsd file. By loading both the XML and XSD files, this type of XML editor lets you insertelements and attributes only in the places they are allowed to ensure that the design file is valid.
However, no editor can enforce the internal and external constraints on a design file. The followingsection explains all of the possible elements and attributes of an XML design file and the variousconstraints you must maintain on each of them.
8.1.3 Structure of the Design FileThis section explains each of the XML elements and attributes in a design file and how they relate tothe settings in the Domain Designer. The sample XML code is based on the example Domain createdin “Example of Creating a Domain” on page 179, with table names that do not include databaseschema names. Some elements have been added to show structures that did not appear in the example.
Because certain XML elements correspond to objects in the Domain design, this section refers toXML elements that contain Domain objects such as sets. This is a short-hand description that meansthe XML elements contain other XML elements that represent the Domain objects.
The top-level container elements of a design file are:
• schema (no relationship to the database schema)
• itemGroups
• items• resources
The following schema representation shows the top-level structure of the design file:
244
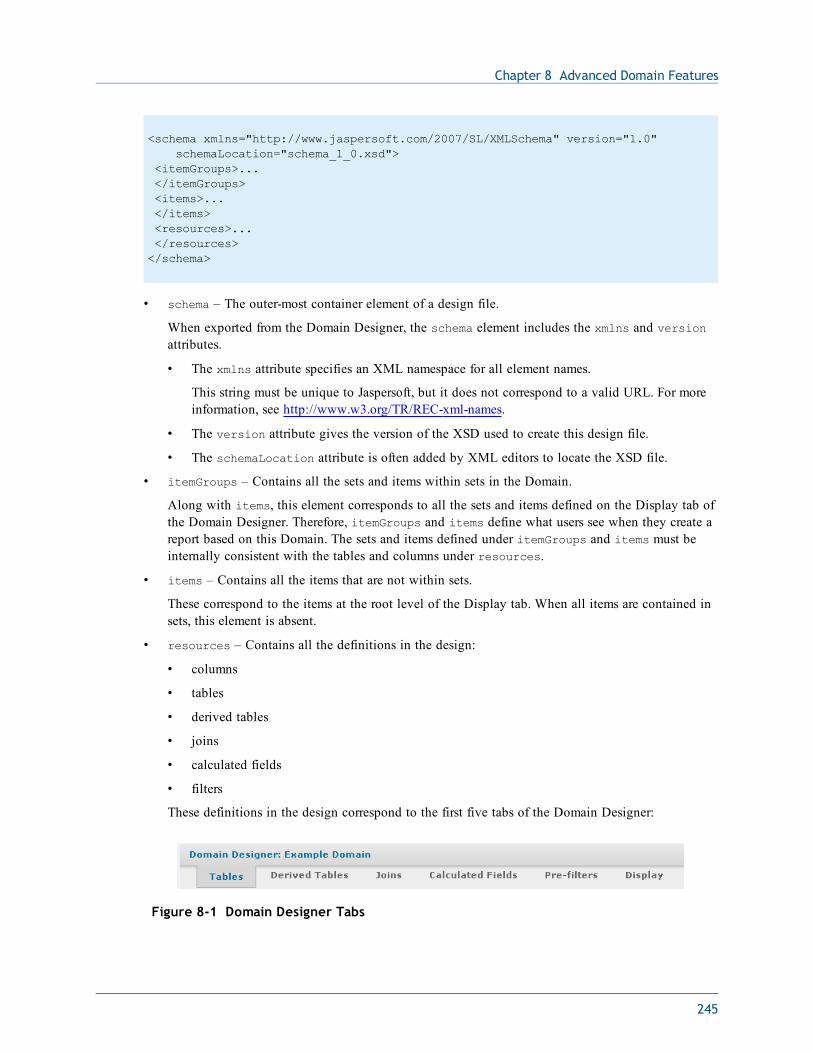
Chapter 8 Advanced Domain Features
<schema xmlns="http://www.jaspersoft.com/2007/SL/XMLSchema" version="1.0"schemaLocation="schema_1_0.xsd">
<itemGroups>...</itemGroups><items>...</items><resources>...</resources></schema>
• schema – The outer-most container element of a design file.
When exported from the Domain Designer, the schema element includes the xmlns and versionattributes.
• The xmlns attribute specifies an XML namespace for all element names.
This string must be unique to Jaspersoft, but it does not correspond to a valid URL. For moreinformation, see http://www.w3.org/TR/REC-xml-names.
• The version attribute gives the version of the XSD used to create this design file.
• The schemaLocation attribute is often added by XML editors to locate the XSD file.
• itemGroups – Contains all the sets and items within sets in the Domain.
Along with items, this element corresponds to all the sets and items defined on the Display tab ofthe Domain Designer. Therefore, itemGroups and items define what users see when they create areport based on this Domain. The sets and items defined under itemGroups and items must beinternally consistent with the tables and columns under resources.
• items – Contains all the items that are not within sets.
These correspond to the items at the root level of the Display tab. When all items are contained insets, this element is absent.
• resources – Contains all the definitions in the design:
• columns
• tables
• derived tables
• joins
• calculated fields
• filters
These definitions in the design correspond to the first five tabs of the Domain Designer:
Figure 8-1 Domain Designer Tabs
245
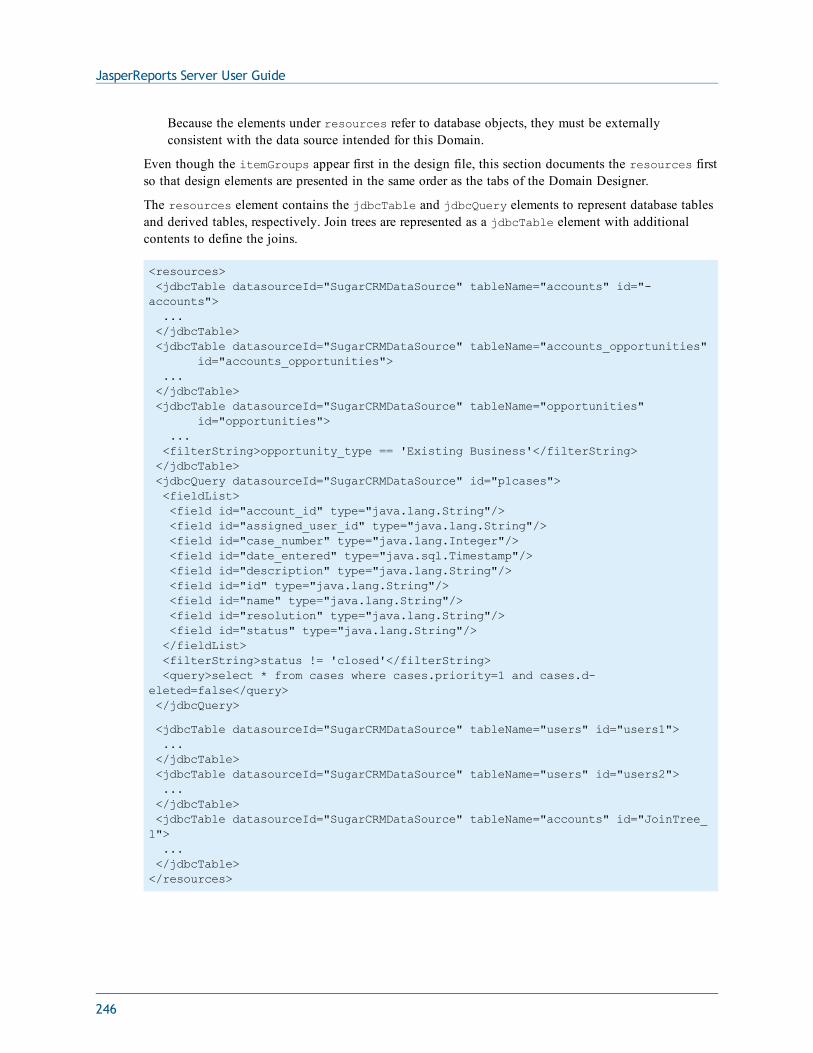
JasperReports Server User Guide
Because the elements under resources refer to database objects, they must be externallyconsistent with the data source intended for this Domain.
Even though the itemGroups appear first in the design file, this section documents the resources firstso that design elements are presented in the same order as the tabs of the Domain Designer.
The resources element contains the jdbcTable and jdbcQuery elements to represent database tablesand derived tables, respectively. Join trees are represented as a jdbcTable element with additionalcontents to define the joins.
<resources><jdbcTable datasourceId="SugarCRMDataSource" tableName="accounts" id="-accounts">...</jdbcTable><jdbcTable datasourceId="SugarCRMDataSource" tableName="accounts_opportunities"
id="accounts_opportunities">...</jdbcTable><jdbcTable datasourceId="SugarCRMDataSource" tableName="opportunities"
id="opportunities">...<filterString>opportunity_type == 'Existing Business'</filterString></jdbcTable><jdbcQuery datasourceId="SugarCRMDataSource" id="p1cases"><fieldList><field id="account_id" type="java.lang.String"/><field id="assigned_user_id" type="java.lang.String"/><field id="case_number" type="java.lang.Integer"/><field id="date_entered" type="java.sql.Timestamp"/><field id="description" type="java.lang.String"/><field id="id" type="java.lang.String"/><field id="name" type="java.lang.String"/><field id="resolution" type="java.lang.String"/><field id="status" type="java.lang.String"/></fieldList><filterString>status != 'closed'</filterString><query>select * from cases where cases.priority=1 and cases.d-
eleted=false</query></jdbcQuery>
<jdbcTable datasourceId="SugarCRMDataSource" tableName="users" id="users1">...</jdbcTable><jdbcTable datasourceId="SugarCRMDataSource" tableName="users" id="users2">...</jdbcTable><jdbcTable datasourceId="SugarCRMDataSource" tableName="accounts" id="JoinTree_1">...</jdbcTable></resources>
246
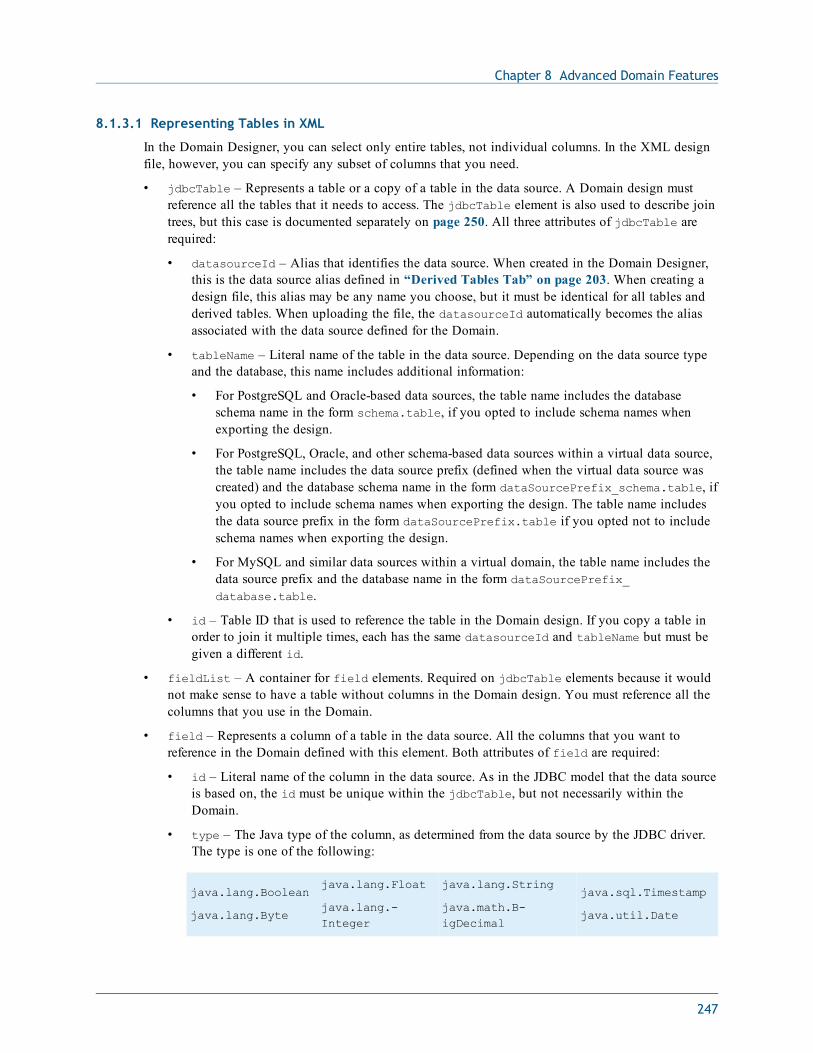
Chapter 8 Advanced Domain Features
8.1.3.1 Representing Tables in XML
In the Domain Designer, you can select only entire tables, not individual columns. In the XML designfile, however, you can specify any subset of columns that you need.
• jdbcTable – Represents a table or a copy of a table in the data source. A Domain design mustreference all the tables that it needs to access. The jdbcTable element is also used to describe jointrees, but this case is documented separately on page 250. All three attributes of jdbcTable arerequired:
• datasourceId – Alias that identifies the data source. When created in the Domain Designer,this is the data source alias defined in “Derived Tables Tab” on page 203. When creating adesign file, this alias may be any name you choose, but it must be identical for all tables andderived tables. When uploading the file, the datasourceId automatically becomes the aliasassociated with the data source defined for the Domain.
• tableName – Literal name of the table in the data source. Depending on the data source typeand the database, this name includes additional information:
• For PostgreSQL and Oracle-based data sources, the table name includes the databaseschema name in the form schema.table, if you opted to include schema names whenexporting the design.
• For PostgreSQL, Oracle, and other schema-based data sources within a virtual data source,the table name includes the data source prefix (defined when the virtual data source wascreated) and the database schema name in the form dataSourcePrefix_schema.table, ifyou opted to include schema names when exporting the design. The table name includesthe data source prefix in the form dataSourcePrefix.table if you opted not to includeschema names when exporting the design.
• For MySQL and similar data sources within a virtual domain, the table name includes thedata source prefix and the database name in the form dataSourcePrefix_database.table.
• id – Table ID that is used to reference the table in the Domain design. If you copy a table inorder to join it multiple times, each has the same datasourceId and tableName but must begiven a different id.
• fieldList – A container for field elements. Required on jdbcTable elements because it wouldnot make sense to have a table without columns in the Domain design. You must reference all thecolumns that you use in the Domain.
• field – Represents a column of a table in the data source. All the columns that you want toreference in the Domain defined with this element. Both attributes of field are required:
• id – Literal name of the column in the data source. As in the JDBC model that the data sourceis based on, the id must be unique within the jdbcTable, but not necessarily within theDomain.
• type – The Java type of the column, as determined from the data source by the JDBC driver.The type is one of the following:
java.lang.Boolean
java.lang.Byte
java.lang.Float
java.lang.-Integer
java.lang.String
java.math.B-igDecimal
java.sql.Timestamp
java.util.Date
247
JasperReports Server User Guide
java.lang.Ch-aracter
java.lang.Double
java.lang.Long
java.lang.Short
java.sql.Date
java.sql.Time
Unless you know the name and type of every column in the data source, it is often easier to select andexport tables from the Domain Designer. The Domain Designer accesses the data source to find thenames of all tables and columns, as well as their types. You may then export the XML design file withthis information and refine your design.
If you have proprietary types in your database, the server may not be able to map its Java type fromthe JDBC driver. You can configure the mapping for proprietary types, as described in theJasperReports Server Administrator Guide.
Alternatively, you can override any mapping by specifying the type attribute for any given field inthe XML design file. The server uses this Java type for the field, regardless of its mapping. If yourproprietary type cannot be cast in the specified type, the server raises an exception.
8.1.3.2 Representing Derived Tables in XML
Derived tables are similar in structure to tables, but they use the jdbcQuery element which containsthe query element:
• jdbcQuery – Represents a derived table that is the result of an SQL query.
Both attributes of jdbcQuery are required:
• datasourceId – Alias that identifies the data source for the Domain. The alias designates thedata source to be queried. In the design file, this alias must be identical for all tables andderived tables.
• id – Table ID that is used to reference the derived table in the Domain design. Any referenceto the id of a jdbcTable may also reference the id of a derived table.
• fieldList – A required container for the field elements.
When the derived table is created in the Domain Designer, the set of columns corresponds to theselection of columns in the query result on the Derived Tables tab.
• field – Represents a column in the results of the query.
Only the columns represented by a field element are available for reference by other elements.The columns of a derived table must be among those returned by the query.
• id – Literal name of the column in the query result. If the query gives an alias to the columnin a SELECT AS statement, the id is the same as the alias. The id must be unique within thequery results, but not necessarily within the Domain.
• type – The Java type of the column, as determined from the data source by the JDBC driver.
• query – The SQL query sent to the database server.
• You can use any valid SQL that returns results, as long as the tables and columns in the queryexist in the data source, and the columns in the result match the id and type of all field elementsof the derived table given in the fieldList. The syntax for a valid SQL query does not include aclosing semi-colon (;). If you add a derived table in the Domain Designer, it runs the query andgenerates columns based on the result set. You can then export the design file containing thegenerated column list.
248
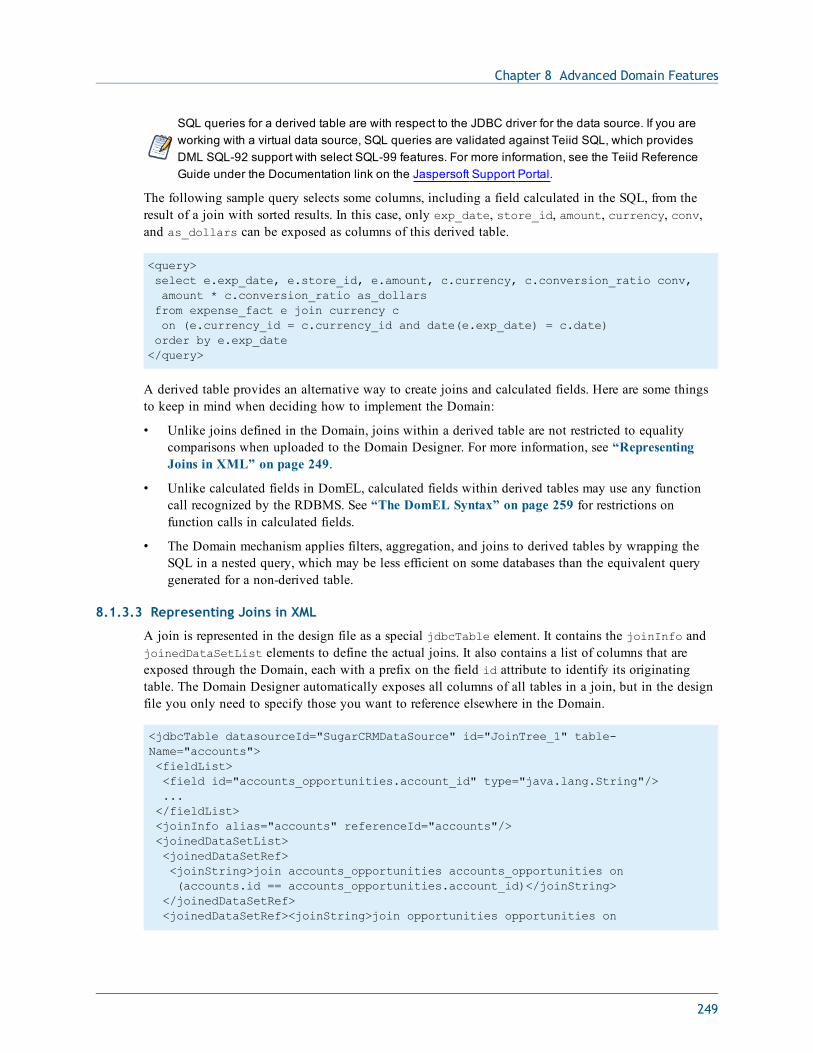
Chapter 8 Advanced Domain Features
SQL queries for a derived table are with respect to the JDBC driver for the data source. If you areworking with a virtual data source, SQL queries are validated against Teiid SQL, which providesDML SQL-92 support with select SQL-99 features. For more information, see the Teiid ReferenceGuide under the Documentation link on the Jaspersoft Support Portal.
The following sample query selects some columns, including a field calculated in the SQL, from theresult of a join with sorted results. In this case, only exp_date, store_id, amount, currency, conv,and as_dollars can be exposed as columns of this derived table.
<query>select e.exp_date, e.store_id, e.amount, c.currency, c.conversion_ratio conv,amount * c.conversion_ratio as_dollarsfrom expense_fact e join currency con (e.currency_id = c.currency_id and date(e.exp_date) = c.date)order by e.exp_date</query>
A derived table provides an alternative way to create joins and calculated fields. Here are some thingsto keep in mind when deciding how to implement the Domain:
• Unlike joins defined in the Domain, joins within a derived table are not restricted to equalitycomparisons when uploaded to the Domain Designer. For more information, see “RepresentingJoins in XML” on page 249.
• Unlike calculated fields in DomEL, calculated fields within derived tables may use any functioncall recognized by the RDBMS. See “The DomEL Syntax” on page 259 for restrictions onfunction calls in calculated fields.
• The Domain mechanism applies filters, aggregation, and joins to derived tables by wrapping theSQL in a nested query, which may be less efficient on some databases than the equivalent querygenerated for a non-derived table.
8.1.3.3 Representing Joins in XML
A join is represented in the design file as a special jdbcTable element. It contains the joinInfo andjoinedDataSetList elements to define the actual joins. It also contains a list of columns that areexposed through the Domain, each with a prefix on the field id attribute to identify its originatingtable. The Domain Designer automatically exposes all columns of all tables in a join, but in the designfile you only need to specify those you want to reference elsewhere in the Domain.
<jdbcTable datasourceId="SugarCRMDataSource" id="JoinTree_1" table-Name="accounts"><fieldList><field id="accounts_opportunities.account_id" type="java.lang.String"/>...</fieldList><joinInfo alias="accounts" referenceId="accounts"/><joinedDataSetList><joinedDataSetRef><joinString>join accounts_opportunities accounts_opportunities on(accounts.id == accounts_opportunities.account_id)</joinString>
</joinedDataSetRef><joinedDataSetRef><joinString>join opportunities opportunities on
249
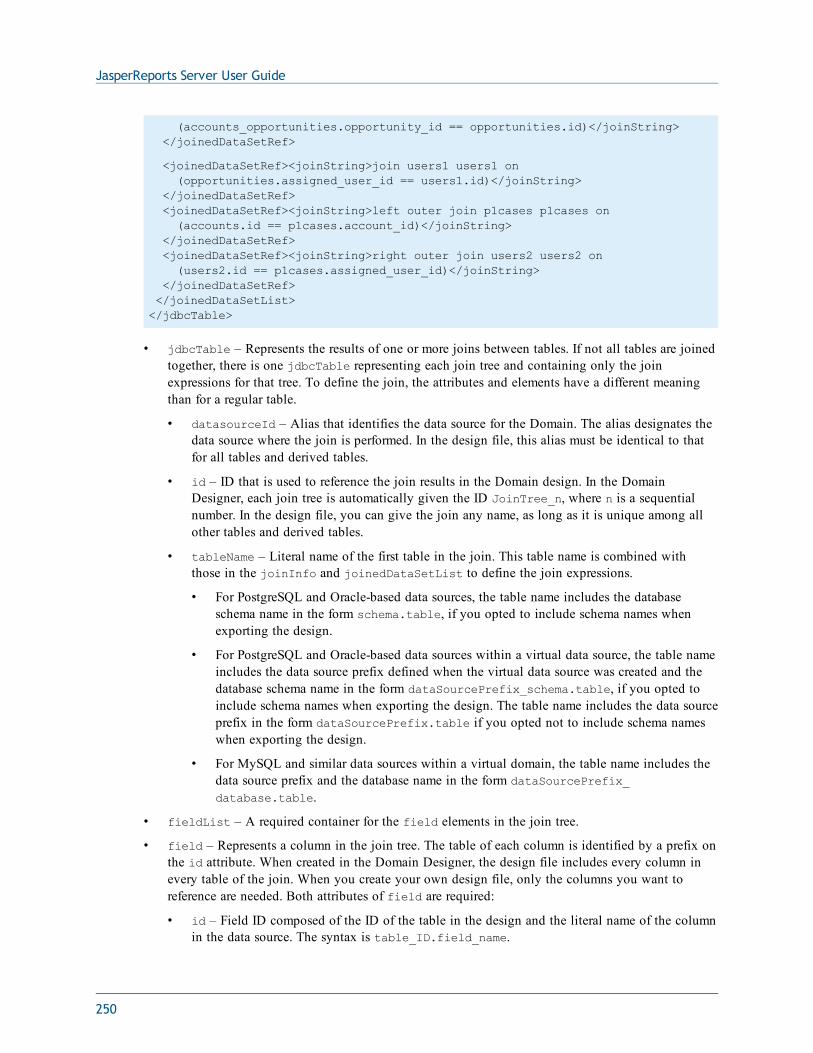
JasperReports Server User Guide
(accounts_opportunities.opportunity_id == opportunities.id)</joinString></joinedDataSetRef>
<joinedDataSetRef><joinString>join users1 users1 on(opportunities.assigned_user_id == users1.id)</joinString>
</joinedDataSetRef><joinedDataSetRef><joinString>left outer join p1cases p1cases on(accounts.id == p1cases.account_id)</joinString>
</joinedDataSetRef><joinedDataSetRef><joinString>right outer join users2 users2 on(users2.id == p1cases.assigned_user_id)</joinString>
</joinedDataSetRef></joinedDataSetList></jdbcTable>
• jdbcTable – Represents the results of one or more joins between tables. If not all tables are joinedtogether, there is one jdbcTable representing each join tree and containing only the joinexpressions for that tree. To define the join, the attributes and elements have a different meaningthan for a regular table.
• datasourceId – Alias that identifies the data source for the Domain. The alias designates thedata source where the join is performed. In the design file, this alias must be identical to thatfor all tables and derived tables.
• id – ID that is used to reference the join results in the Domain design. In the DomainDesigner, each join tree is automatically given the ID JoinTree_n, where n is a sequentialnumber. In the design file, you can give the join any name, as long as it is unique among allother tables and derived tables.
• tableName – Literal name of the first table in the join. This table name is combined withthose in the joinInfo and joinedDataSetList to define the join expressions.
• For PostgreSQL and Oracle-based data sources, the table name includes the databaseschema name in the form schema.table, if you opted to include schema names whenexporting the design.
• For PostgreSQL and Oracle-based data sources within a virtual data source, the table nameincludes the data source prefix defined when the virtual data source was created and thedatabase schema name in the form dataSourcePrefix_schema.table, if you opted toinclude schema names when exporting the design. The table name includes the data sourceprefix in the form dataSourcePrefix.table if you opted not to include schema nameswhen exporting the design.
• For MySQL and similar data sources within a virtual domain, the table name includes thedata source prefix and the database name in the form dataSourcePrefix_database.table.
• fieldList – A required container for the field elements in the join tree.
• field – Represents a column in the join tree. The table of each column is identified by a prefix onthe id attribute. When created in the Domain Designer, the design file includes every column inevery table of the join. When you create your own design file, only the columns you want toreference are needed. Both attributes of field are required:
• id – Field ID composed of the ID of the table in the design and the literal name of the columnin the data source. The syntax is table_ID.field_name.
250
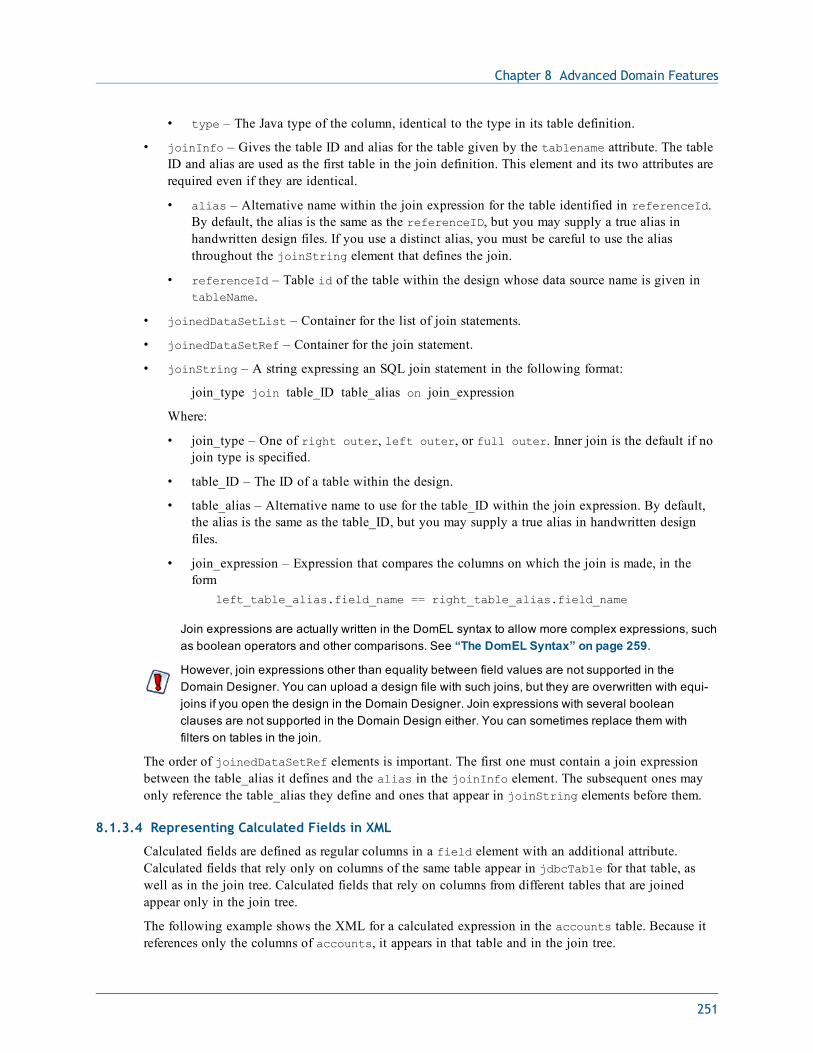
Chapter 8 Advanced Domain Features
• type – The Java type of the column, identical to the type in its table definition.
• joinInfo – Gives the table ID and alias for the table given by the tablename attribute. The tableID and alias are used as the first table in the join definition. This element and its two attributes arerequired even if they are identical.
• alias – Alternative name within the join expression for the table identified in referenceId.By default, the alias is the same as the referenceID, but you may supply a true alias inhandwritten design files. If you use a distinct alias, you must be careful to use the aliasthroughout the joinString element that defines the join.
• referenceId – Table id of the table within the design whose data source name is given intableName.
• joinedDataSetList – Container for the list of join statements.
• joinedDataSetRef – Container for the join statement.
• joinString – A string expressing an SQL join statement in the following format:
join_type join table_ID table_alias on join_expression
Where:
• join_type – One of right outer, left outer, or full outer. Inner join is the default if nojoin type is specified.
• table_ID – The ID of a table within the design.
• table_alias – Alternative name to use for the table_ID within the join expression. By default,the alias is the same as the table_ID, but you may supply a true alias in handwritten designfiles.
• join_expression – Expression that compares the columns on which the join is made, in theform
left_table_alias.field_name == right_table_alias.field_name
Join expressions are actually written in the DomEL syntax to allow more complex expressions, suchas boolean operators and other comparisons. See “The DomEL Syntax” on page 259.
However, join expressions other than equality between field values are not supported in theDomain Designer. You can upload a design file with such joins, but they are overwritten with equi-joins if you open the design in the Domain Designer. Join expressions with several booleanclauses are not supported in the Domain Design either. You can sometimes replace them withfilters on tables in the join.
The order of joinedDataSetRef elements is important. The first one must contain a join expressionbetween the table_alias it defines and the alias in the joinInfo element. The subsequent ones mayonly reference the table_alias they define and ones that appear in joinString elements before them.
8.1.3.4 Representing Calculated Fields in XML
Calculated fields are defined as regular columns in a field element with an additional attribute.Calculated fields that rely only on columns of the same table appear in jdbcTable for that table, aswell as in the join tree. Calculated fields that rely on columns from different tables that are joinedappear only in the join tree.
The following example shows the XML for a calculated expression in the accounts table. Because itreferences only the columns of accounts, it appears in that table and in the join tree.
251
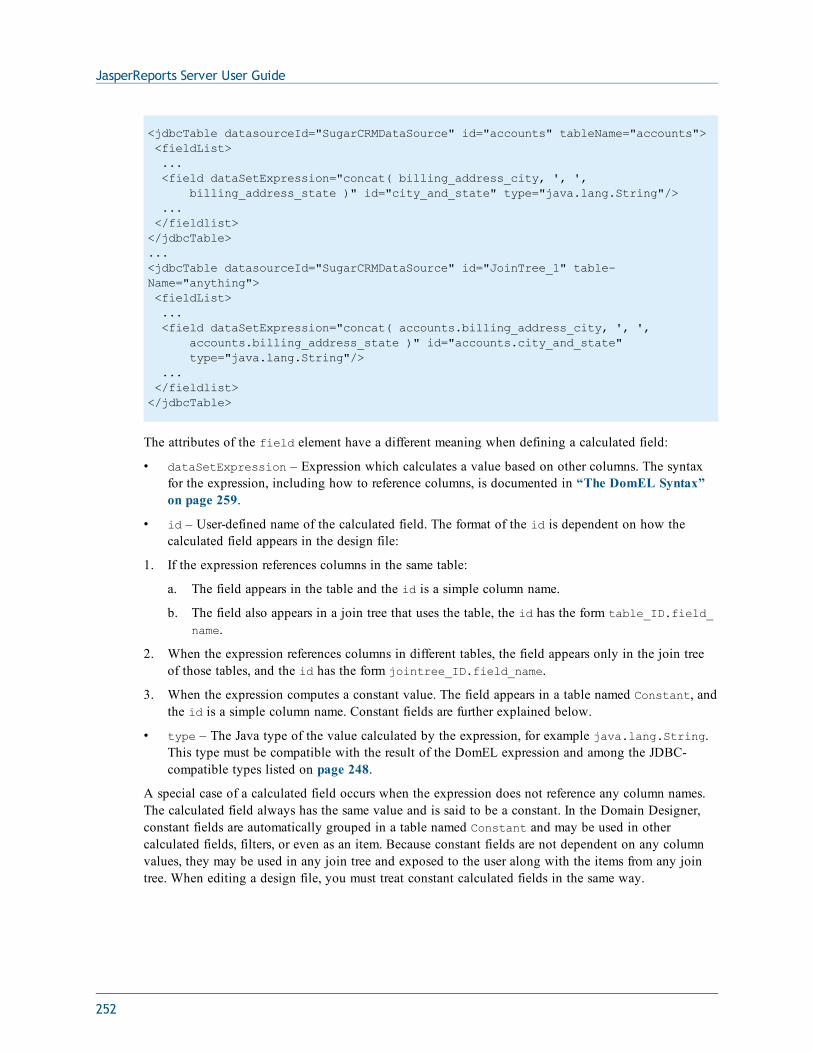
JasperReports Server User Guide
<jdbcTable datasourceId="SugarCRMDataSource" id="accounts" tableName="accounts"><fieldList>...<field dataSetExpression="concat( billing_address_city, ', ',
billing_address_state )" id="city_and_state" type="java.lang.String"/>...</fieldlist></jdbcTable>...<jdbcTable datasourceId="SugarCRMDataSource" id="JoinTree_1" table-Name="anything"><fieldList>...<field dataSetExpression="concat( accounts.billing_address_city, ', ',
accounts.billing_address_state )" id="accounts.city_and_state" type="java.lang.String"/>
...</fieldlist></jdbcTable>
The attributes of the field element have a different meaning when defining a calculated field:
• dataSetExpression – Expression which calculates a value based on other columns. The syntaxfor the expression, including how to reference columns, is documented in “The DomEL Syntax”on page 259.
• id – User-defined name of the calculated field. The format of the id is dependent on how thecalculated field appears in the design file:
1. If the expression references columns in the same table:
a. The field appears in the table and the id is a simple column name.
b. The field also appears in a join tree that uses the table, the id has the form table_ID.field_name.
2. When the expression references columns in different tables, the field appears only in the join treeof those tables, and the id has the form jointree_ID.field_name.
3. When the expression computes a constant value. The field appears in a table named Constant, andthe id is a simple column name. Constant fields are further explained below.
• type – The Java type of the value calculated by the expression, for example java.lang.String.This type must be compatible with the result of the DomEL expression and among the JDBC-compatible types listed on page 248.
A special case of a calculated field occurs when the expression does not reference any column names.The calculated field always has the same value and is said to be a constant. In the Domain Designer,constant fields are automatically grouped in a table named Constant and may be used in othercalculated fields, filters, or even as an item. Because constant fields are not dependent on any columnvalues, they may be used in any join tree and exposed to the user along with the items from any jointree. When editing a design file, you must treat constant calculated fields in the same way.
252
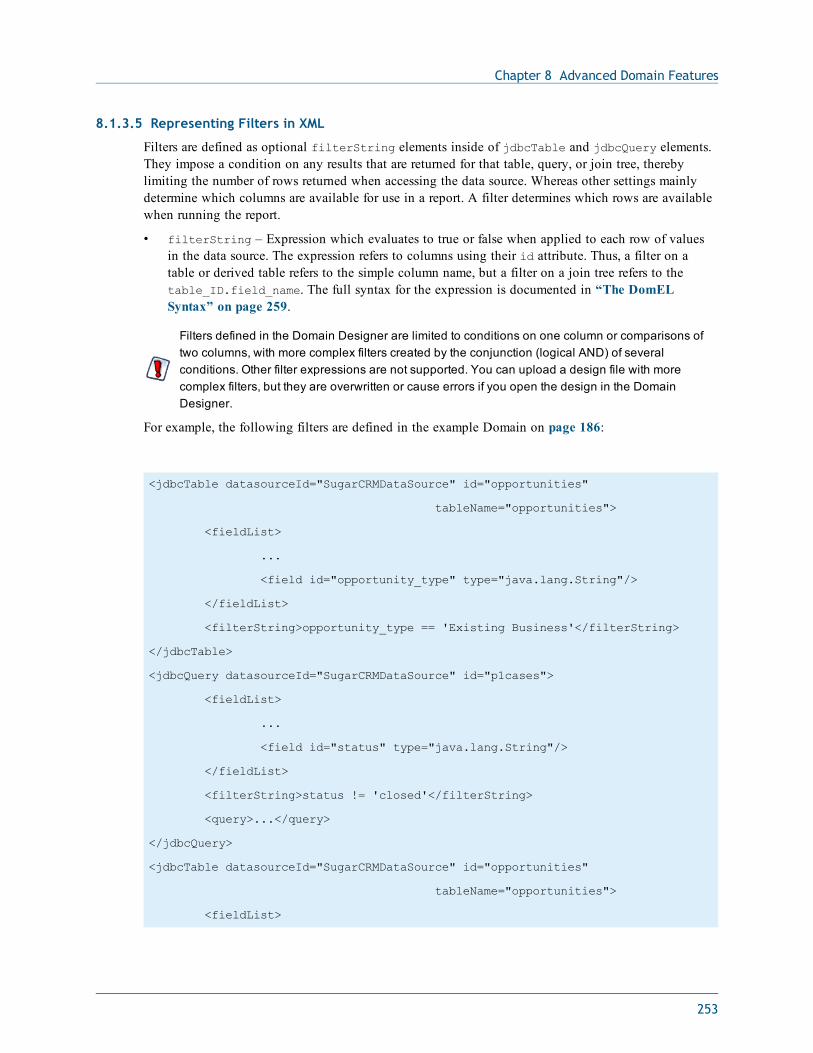
Chapter 8 Advanced Domain Features
8.1.3.5 Representing Filters in XML
Filters are defined as optional filterString elements inside of jdbcTable and jdbcQuery elements.They impose a condition on any results that are returned for that table, query, or join tree, therebylimiting the number of rows returned when accessing the data source. Whereas other settings mainlydetermine which columns are available for use in a report. A filter determines which rows are availablewhen running the report.
• filterString – Expression which evaluates to true or false when applied to each row of valuesin the data source. The expression refers to columns using their id attribute. Thus, a filter on atable or derived table refers to the simple column name, but a filter on a join tree refers to thetable_ID.field_name. The full syntax for the expression is documented in “The DomELSyntax” on page 259.
Filters defined in the Domain Designer are limited to conditions on one column or comparisons oftwo columns, with more complex filters created by the conjunction (logical AND) of severalconditions. Other filter expressions are not supported. You can upload a design file with morecomplex filters, but they are overwritten or cause errors if you open the design in the DomainDesigner.
For example, the following filters are defined in the example Domain on page 186:
<jdbcTable datasourceId="SugarCRMDataSource" id="opportunities"
tableName="opportunities">
<fieldList>
...
<field id="opportunity_type" type="java.lang.String"/>
</fieldList>
<filterString>opportunity_type == 'Existing Business'</filterString>
</jdbcTable>
<jdbcQuery datasourceId="SugarCRMDataSource" id="p1cases">
<fieldList>
...
<field id="status" type="java.lang.String"/>
</fieldList>
<filterString>status != 'closed'</filterString>
<query>...</query>
</jdbcQuery>
<jdbcTable datasourceId="SugarCRMDataSource" id="opportunities"
tableName="opportunities">
<fieldList>
253
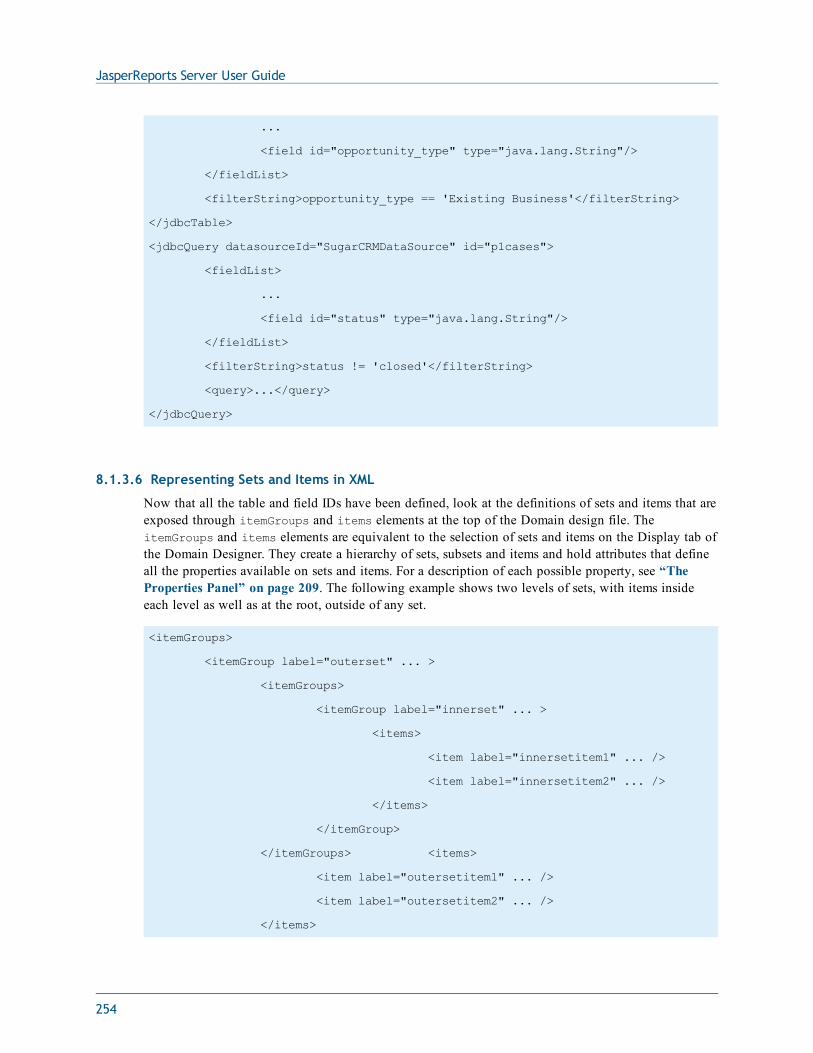
JasperReports Server User Guide
...
<field id="opportunity_type" type="java.lang.String"/>
</fieldList>
<filterString>opportunity_type == 'Existing Business'</filterString>
</jdbcTable>
<jdbcQuery datasourceId="SugarCRMDataSource" id="p1cases">
<fieldList>
...
<field id="status" type="java.lang.String"/>
</fieldList>
<filterString>status != 'closed'</filterString>
<query>...</query>
</jdbcQuery>
8.1.3.6 Representing Sets and Items in XML
Now that all the table and field IDs have been defined, look at the definitions of sets and items that areexposed through itemGroups and items elements at the top of the Domain design file. TheitemGroups and items elements are equivalent to the selection of sets and items on the Display tab ofthe Domain Designer. They create a hierarchy of sets, subsets and items and hold attributes that defineall the properties available on sets and items. For a description of each possible property, see “TheProperties Panel” on page 209. The following example shows two levels of sets, with items insideeach level as well as at the root, outside of any set.
<itemGroups>
<itemGroup label="outerset" ... >
<itemGroups>
<itemGroup label="innerset" ... >
<items>
<item label="innersetitem1" ... />
<item label="innersetitem2" ... />
</items>
</itemGroup>
</itemGroups> <items>
<item label="outersetitem1" ... />
<item label="outersetitem2" ... />
</items>
254
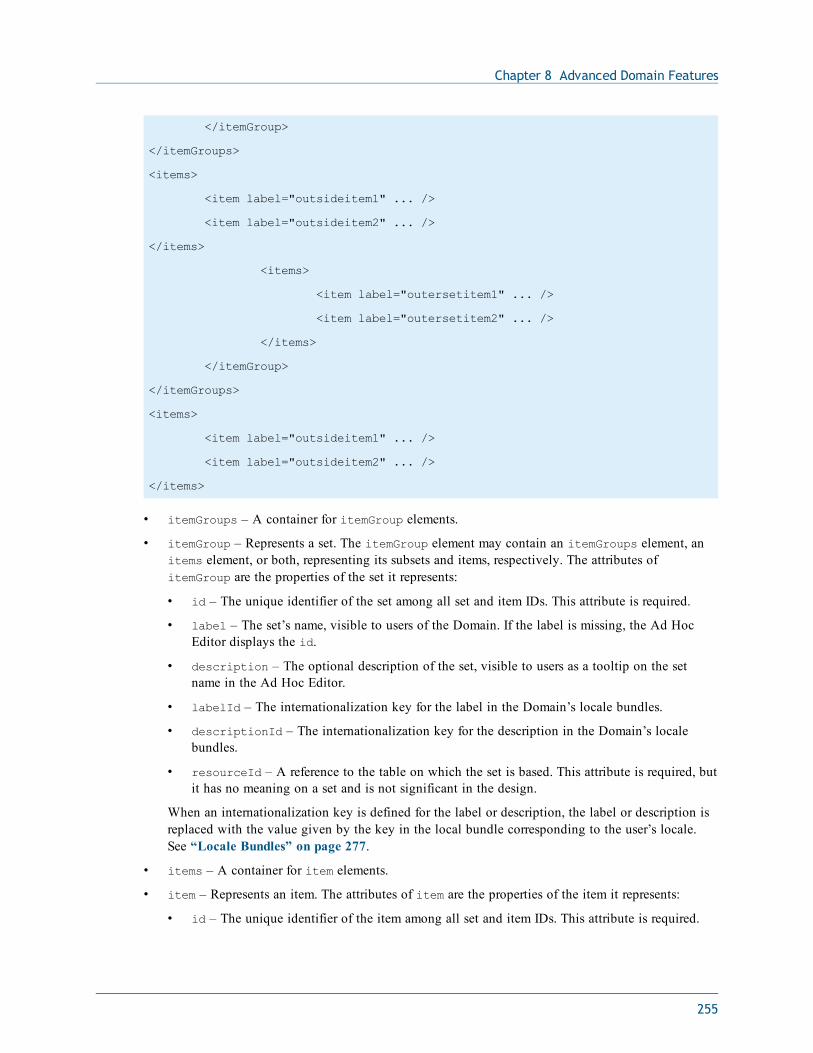
Chapter 8 Advanced Domain Features
</itemGroup>
</itemGroups>
<items>
<item label="outsideitem1" ... />
<item label="outsideitem2" ... />
</items>
<items>
<item label="outersetitem1" ... />
<item label="outersetitem2" ... />
</items>
</itemGroup>
</itemGroups>
<items>
<item label="outsideitem1" ... />
<item label="outsideitem2" ... />
</items>
• itemGroups – A container for itemGroup elements.
• itemGroup – Represents a set. The itemGroup element may contain an itemGroups element, anitems element, or both, representing its subsets and items, respectively. The attributes ofitemGroup are the properties of the set it represents:
• id – The unique identifier of the set among all set and item IDs. This attribute is required.
• label – The set’s name, visible to users of the Domain. If the label is missing, the Ad HocEditor displays the id.
• description – The optional description of the set, visible to users as a tooltip on the setname in the Ad Hoc Editor.
• labelId – The internationalization key for the label in the Domain’s locale bundles.
• descriptionId – The internationalization key for the description in the Domain’s localebundles.
• resourceId – A reference to the table on which the set is based. This attribute is required, butit has no meaning on a set and is not significant in the design.
When an internationalization key is defined for the label or description, the label or description isreplaced with the value given by the key in the local bundle corresponding to the user’s locale.See “Locale Bundles” on page 277.
• items – A container for item elements.
• item – Represents an item. The attributes of item are the properties of the item it represents:
• id – The unique identifier of the item among all set and item IDs. This attribute is required.
255
JasperReports Server User Guide
• label – The item’s name, visible to users. If the label is missing, the Ad Hoc Editor displaysthe id.
• description – The optional description of the item, visible as a tooltip on the item name inthe Ad Hoc Editor.
• labelId – The internationalization key for the label in the Domain’s locale bundles.
• descriptionId – The internationalization key for the description in the Domain’s localebundles.
• resourceId – A reference to the column on which the item is based. This attribute is requiredbecause it defines the connection between what the user sees and the corresponding data in thedata source. The resourceId has the form table_ID.field_ID. When the item refers to acolumn in a join tree, the resourceID corresponds to jointree_ID.table_ID.field_namebecause the field ID in a join tree includes the table ID.
• dimensionOrMeasure – Corresponds to the Field or measure setting in the user interface. Itspossible values are Dimension (equivalent to field) or Measure. By default, all numeric fieldsare treated as measures in the Ad Hoc Editor. This attribute is optional and necessary onlywhen overriding the default behavior, for example to make a numeric item explicitly not ameasure. See “Terminology” on page 177.
• defaultMask – A representation of the default data format to use when this item is includedin a report. The possible values depend on the type attribute of the column referenced by theresourceId. See the table below.
• defaultAgg – The name of the default summary function (also called aggregation) to usewhen this item is included in a report. The possible values for the defaultAgg depend on thetype attribute of the column referenced by the resourceId. The following table gives thepossible data formats and summary functions based on the column type. The appearancecolumns show the equivalent setting in the properties table of the Display tab:
256
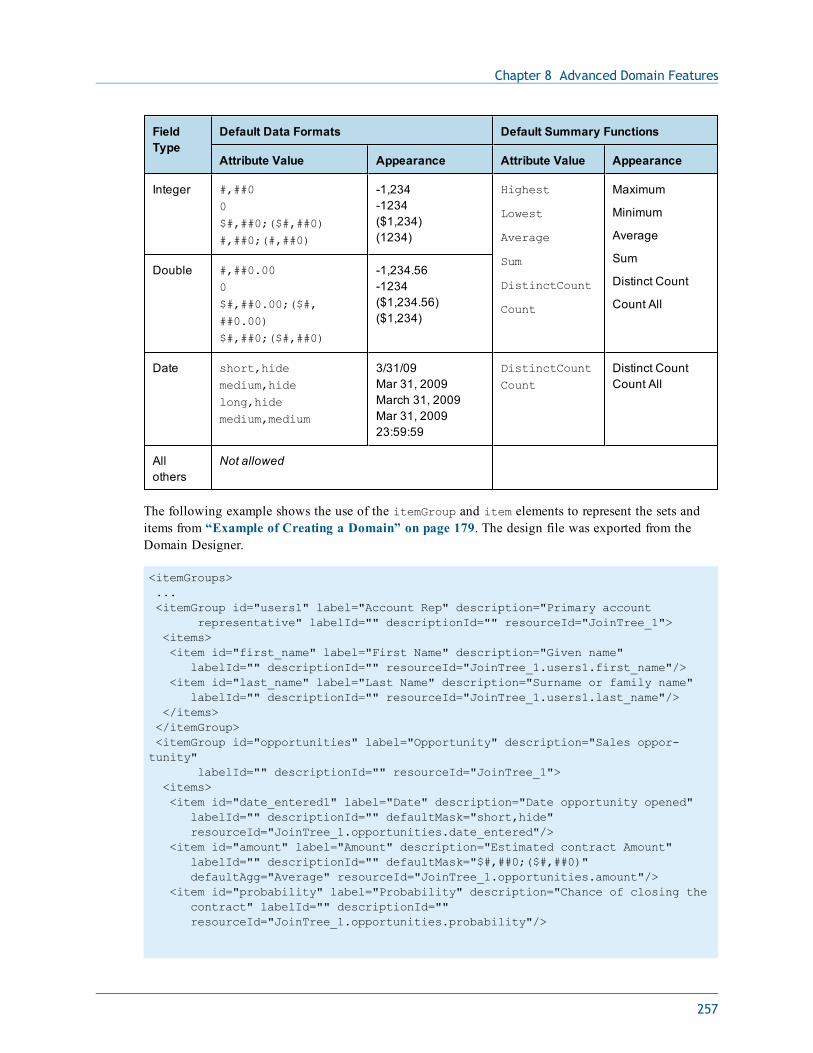
Chapter 8 Advanced Domain Features
FieldType
Default Data Formats Default Summary Functions
Attribute Value Appearance Attribute Value Appearance
Integer #,##00$#,##0;($#,##0)#,##0;(#,##0)
-1,234-1234($1,234)(1234)
Highest
Lowest
Average
Sum
DistinctCount
Count
Maximum
Minimum
Average
Sum
Distinct Count
Count All
Double #,##0.000$#,##0.00;($#,##0.00)$#,##0;($#,##0)
-1,234.56-1234($1,234.56)($1,234)
Date short,hidemedium,hidelong,hidemedium,medium
3/31/09Mar 31, 2009March 31, 2009Mar 31, 200923:59:59
DistinctCountCount
Distinct CountCount All
Allothers
Not allowed
The following example shows the use of the itemGroup and item elements to represent the sets anditems from “Example of Creating a Domain” on page 179. The design file was exported from theDomain Designer.
<itemGroups>...<itemGroup id="users1" label="Account Rep" description="Primary account
representative" labelId="" descriptionId="" resourceId="JoinTree_1"><items><item id="first_name" label="First Name" description="Given name"
labelId="" descriptionId="" resourceId="JoinTree_1.users1.first_name"/><item id="last_name" label="Last Name" description="Surname or family name"
labelId="" descriptionId="" resourceId="JoinTree_1.users1.last_name"/></items></itemGroup><itemGroup id="opportunities" label="Opportunity" description="Sales oppor-tunity"
labelId="" descriptionId="" resourceId="JoinTree_1"><items><item id="date_entered1" label="Date" description="Date opportunity opened"
labelId="" descriptionId="" defaultMask="short,hide"resourceId="JoinTree_1.opportunities.date_entered"/>
<item id="amount" label="Amount" description="Estimated contract Amount"labelId="" descriptionId="" defaultMask="$#,##0;($#,##0)"defaultAgg="Average" resourceId="JoinTree_1.opportunities.amount"/>
<item id="probability" label="Probability" description="Chance of closing thecontract" labelId="" descriptionId=""resourceId="JoinTree_1.opportunities.probability"/>
257
JasperReports Server User Guide
Labels and descriptions may contain any characters, but the ID property value of both itemGroup anditem elements must be alphanumeric and not start with a digit.
8.1.4 Uploading a Design File to a DomainAfter you have modified an XML design file, you can upload it through the Add New Domain page.Alternatively, you can create a new Domain based on a modified file or even on a design file createdfrom scratch.
To upload an XML design file:
1. Log in to the server as an administrator and select View > Search Results.
2. Locate the Domain.
a. Choose View > Search Results.
b. In the Filters panel, under Types, click More choices.
c. Click Domains.
3. To update an existing Domain, right-click the Domain and select Edit from the context-menu.
To create a new Domain, select Create > Domain from the main menu.
The Domain appears in the Data and Design page of the Edit Domain or Add New Domain dialog.If you are creating a new Domain, you must select a data source before you can proceed.
4. Select Upload under Domain Design, then click Browse to find the XML design file. In the FileUpload window, click Open.
The design file overwrites any existing design without prompting. If you make a mistake orupload the wrong file, click Cancel on the Data and Design page and start over.
The server validates the uploaded XML file. If there are syntax or semantic errors, the currentdesign is not replaced. You can make changes to the XML file and upload it again until there areno errors.
5. If you used only supported features in the design file, verify the uploaded Domain design byselecting Edit in Domain Designer. Make sure the settings you made in the XML file appear asexpected on the various tabs of the Domain Designer. If there are any errors or inconsistencies, youshould make changes to the XML file, upload it again, and verify it again. The results of editing adesign in the Domain Designer based on inconsistent XML file are unpredictable. If you cannotresolve the error or inconsistencies, you should click Cancel on the Data and Design page so thatthe uploaded design is not saved.
After the design appears correctly in the Domain Designer, you may make further modifications onany of the tabs.
If you intentionally use syntax in the design file that Domain Designer does not support, do notlaunch the Domain Designer after uploading the file. The Domain Designer can haveunpredictable results with some XML designs it does not support.
6. Click OK, then click Submit to update the Domain in the repository.
258
Chapter 8 Advanced Domain Features
7. If you modified an existing Domain, you must clear the Ad Hoc cache of all queries based on theDomain. This removes any data that was based on the old instance of the Domain and avoidinconsistencies in new reports. For instructions, see the JasperReports Server Administrator Guide.
8.2 The DomEL SyntaxVarious components of a Domain need to compute values based on some expression involvingconstants, field values, and environment variables. The Domain Expression Language (DomEL) wascreated to fill this need. Currently, the following features in XML design files are expressed in DomEL:
• The on and where clauses of derived tables
• The on clause of join statements
• Calculated fields
• Filter expressions in Domains and Domain topics (equivalent to where clauses)
• The testProfileAttribute function
• Row-level security (see “The Domain Security File” on page 269)
A DomEL expression is a shorthand way of writing a complex query. When processing a report basedon a Domain, the server interprets DomEL expressions to generate parts of the SQL expression thatperform the desired query. Depending on the data policy, either the augmented SQL is passed to thedata source, or the server performs a simpler query and applies the DomEL expressions to the fulldataset in memory.
8.2.1 DatatypesThe following simple datatypes may be declared as constants, used in expressions, and returned asvalues:
259
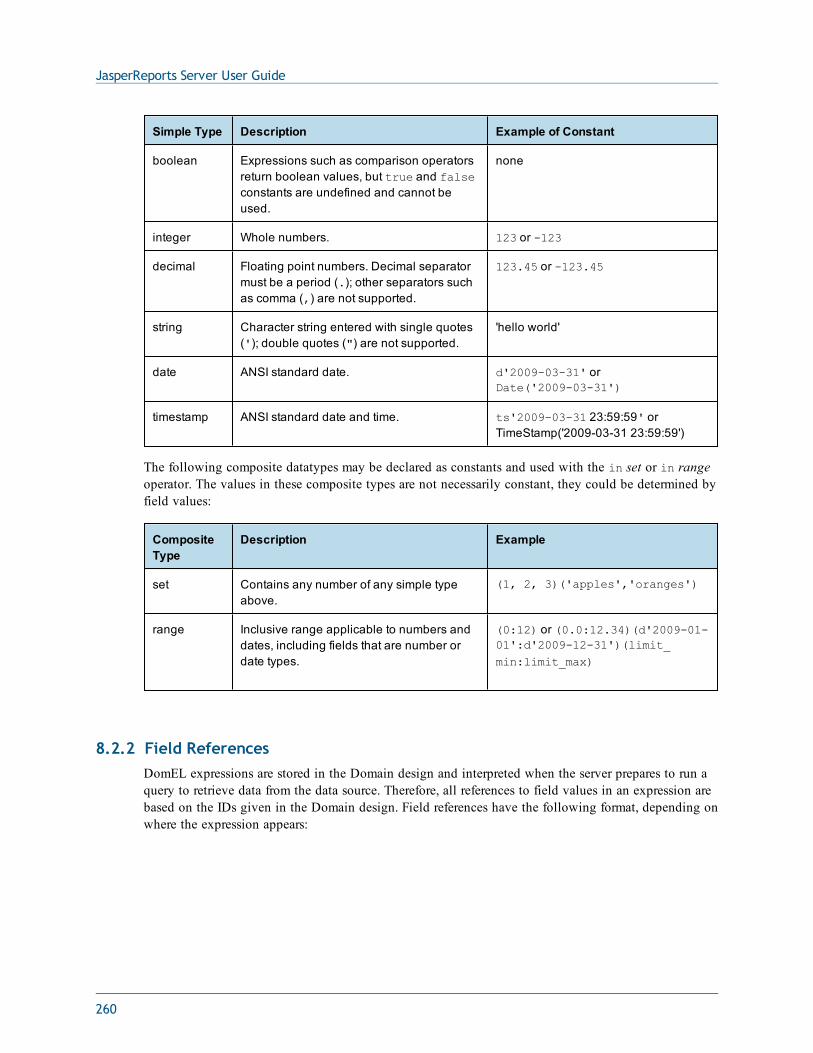
JasperReports Server User Guide
Simple Type Description Example of Constant
boolean Expressions such as comparison operatorsreturn boolean values, but true and falseconstants are undefined and cannot beused.
none
integer Whole numbers. 123 or -123
decimal Floating point numbers. Decimal separatormust be a period (.); other separators suchas comma (,) are not supported.
123.45 or -123.45
string Character string entered with single quotes('); double quotes (") are not supported.
'hello world'
date ANSI standard date. d'2009-03-31' orDate('2009-03-31')
timestamp ANSI standard date and time. ts'2009-03-31 23:59:59' orTimeStamp('2009-03-31 23:59:59')
The following composite datatypes may be declared as constants and used with the in set or in rangeoperator. The values in these composite types are not necessarily constant, they could be determined byfield values:
CompositeType
Description Example
set Contains any number of any simple typeabove.
(1, 2, 3)('apples','oranges')
range Inclusive range applicable to numbers anddates, including fields that are number ordate types.
(0:12) or (0.0:12.34)(d'2009-01-01':d'2009-12-31')(limit_min:limit_max)
8.2.2 Field ReferencesDomEL expressions are stored in the Domain design and interpreted when the server prepares to run aquery to retrieve data from the data source. Therefore, all references to field values in an expression arebased on the IDs given in the Domain design. Field references have the following format, depending onwhere the expression appears:
260
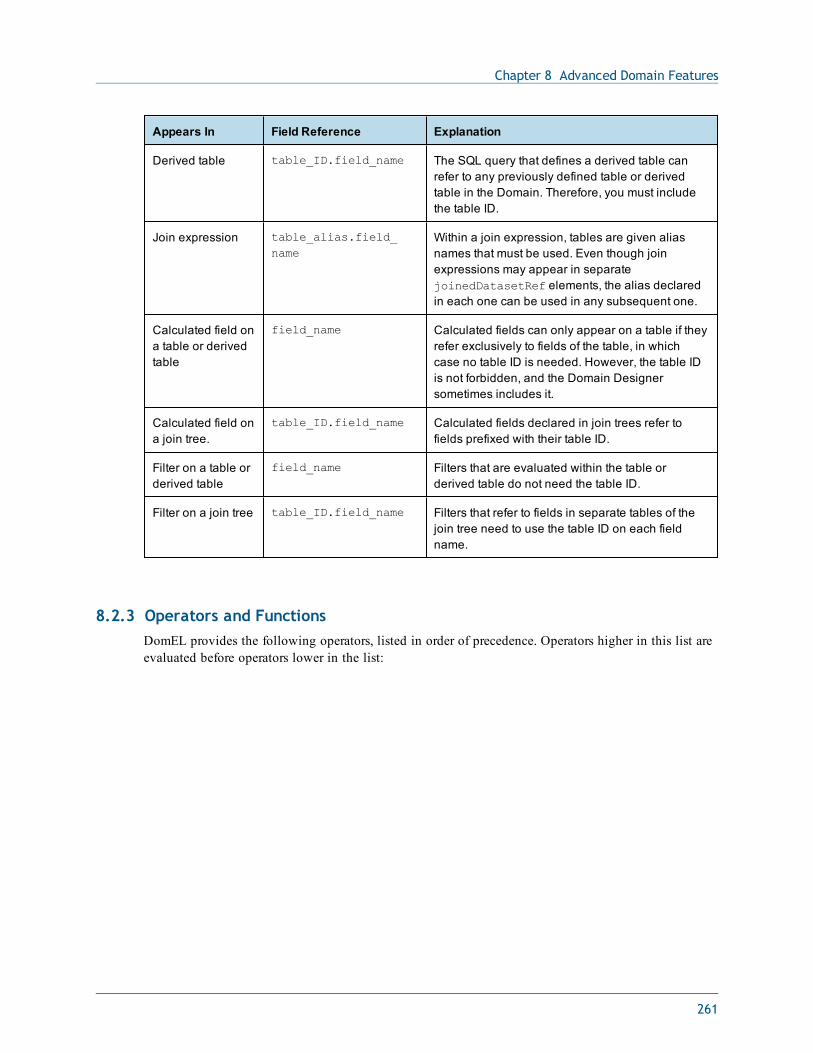
Chapter 8 Advanced Domain Features
Appears In Field Reference Explanation
Derived table table_ID.field_name The SQL query that defines a derived table canrefer to any previously defined table or derivedtable in the Domain. Therefore, you must includethe table ID.
Join expression table_alias.field_name
Within a join expression, tables are given aliasnames that must be used. Even though joinexpressions may appear in separatejoinedDatasetRef elements, the alias declaredin each one can be used in any subsequent one.
Calculated field ona table or derivedtable
field_name Calculated fields can only appear on a table if theyrefer exclusively to fields of the table, in whichcase no table ID is needed. However, the table IDis not forbidden, and the Domain Designersometimes includes it.
Calculated field ona join tree.
table_ID.field_name Calculated fields declared in join trees refer tofields prefixed with their table ID.
Filter on a table orderived table
field_name Filters that are evaluated within the table orderived table do not need the table ID.
Filter on a join tree table_ID.field_name Filters that refer to fields in separate tables of thejoin tree need to use the table ID on each fieldname.
8.2.3 Operators and FunctionsDomEL provides the following operators, listed in order of precedence. Operators higher in this list areevaluated before operators lower in the list:
261
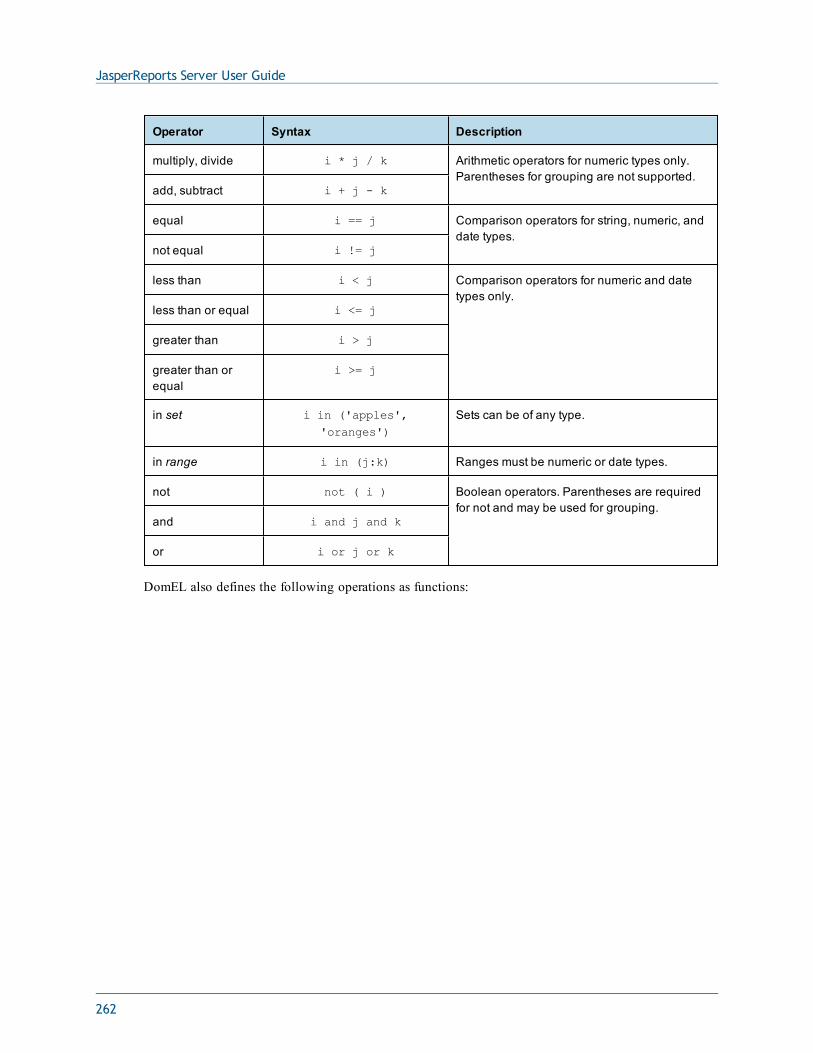
JasperReports Server User Guide
Operator Syntax Description
multiply, divide i * j / k Arithmetic operators for numeric types only.Parentheses for grouping are not supported.
add, subtract i + j - k
equal i == j Comparison operators for string, numeric, anddate types.
not equal i != j
less than i < j Comparison operators for numeric and datetypes only.
less than or equal i <= j
greater than i > j
greater than orequal
i >= j
in set i in ('apples','oranges')
Sets can be of any type.
in range i in (j:k) Ranges must be numeric or date types.
not not ( i ) Boolean operators. Parentheses are requiredfor not and may be used for grouping.
and i and j and k
or i or j or k
DomEL also defines the following operations as functions:
262
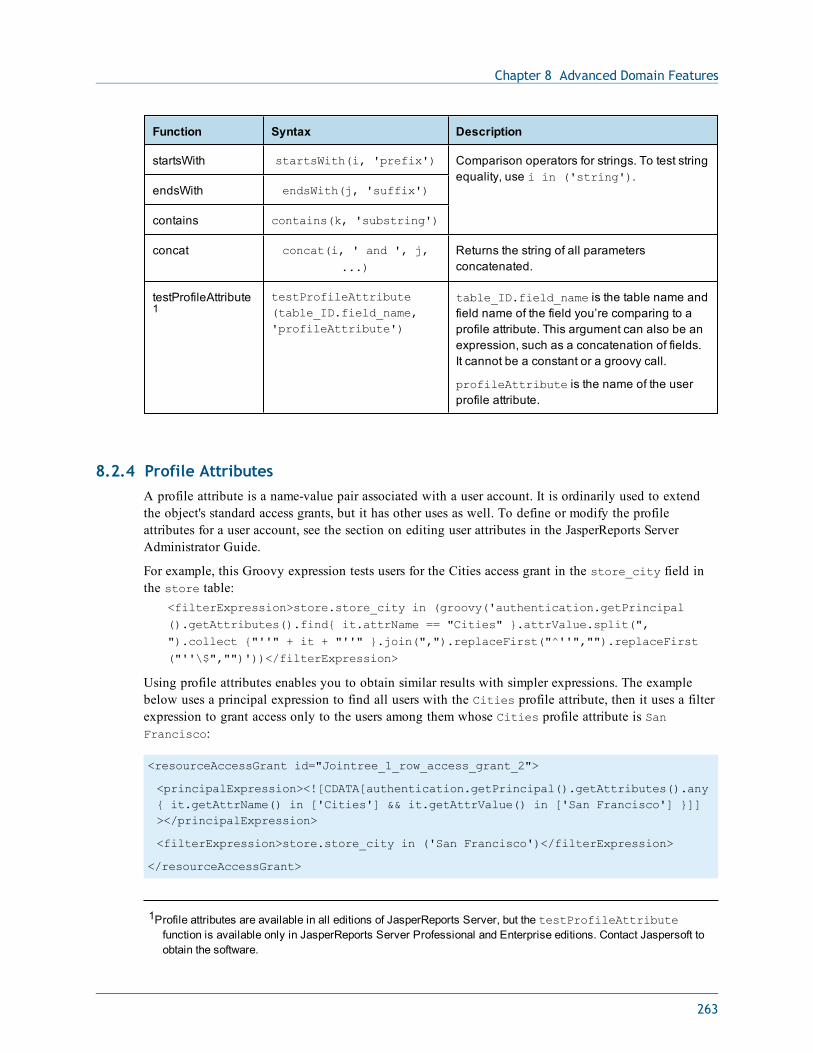
Chapter 8 Advanced Domain Features
Function Syntax Description
startsWith startsWith(i, 'prefix') Comparison operators for strings. To test stringequality, use i in ('string').
endsWith endsWith(j, 'suffix')
contains contains(k, 'substring')
concat concat(i, ' and ', j,...)
Returns the string of all parametersconcatenated.
testProfileAttribute1
testProfileAttribute(table_ID.field_name,'profileAttribute')
table_ID.field_name is the table name andfield name of the field you’re comparing to aprofile attribute. This argument can also be anexpression, such as a concatenation of fields.It cannot be a constant or a groovy call.
profileAttribute is the name of the userprofile attribute.
8.2.4 Profile AttributesA profile attribute is a name-value pair associated with a user account. It is ordinarily used to extendthe object's standard access grants, but it has other uses as well. To define or modify the profileattributes for a user account, see the section on editing user attributes in the JasperReports ServerAdministrator Guide.
For example, this Groovy expression tests users for the Cities access grant in the store_city field inthe store table:
<filterExpression>store.store_city in (groovy('authentication.getPrincipal().getAttributes().find{ it.attrName == "Cities" }.attrValue.split(",").collect {"''" + it + "''" }.join(",").replaceFirst("^''","").replaceFirst("''\$","")'))</filterExpression>
Using profile attributes enables you to obtain similar results with simpler expressions. The examplebelow uses a principal expression to find all users with the Cities profile attribute, then it uses a filterexpression to grant access only to the users among them whose Cities profile attribute is SanFrancisco:
<resourceAccessGrant id="Jointree_1_row_access_grant_2">
<principalExpression><![CDATA[authentication.getPrincipal().getAttributes().any{ it.getAttrName() in ['Cities'] && it.getAttrValue() in ['San Francisco'] }]]></principalExpression>
<filterExpression>store.store_city in ('San Francisco')</filterExpression>
</resourceAccessGrant>
1Profile attributes are available in all editions of JasperReports Server, but the testProfileAttributefunction is available only in JasperReports Server Professional and Enterprise editions. Contact Jaspersoft toobtain the software.
263
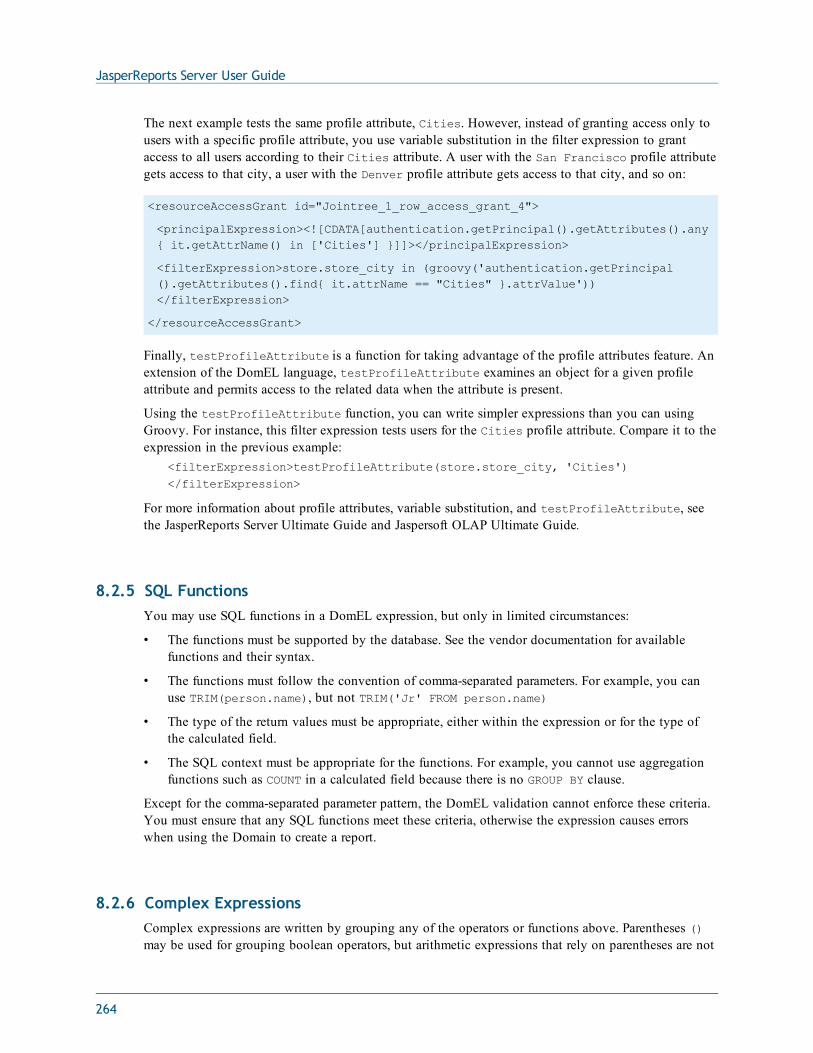
JasperReports Server User Guide
The next example tests the same profile attribute, Cities. However, instead of granting access only tousers with a specific profile attribute, you use variable substitution in the filter expression to grantaccess to all users according to their Cities attribute. A user with the San Francisco profile attributegets access to that city, a user with the Denver profile attribute gets access to that city, and so on:
<resourceAccessGrant id="Jointree_1_row_access_grant_4">
<principalExpression><![CDATA[authentication.getPrincipal().getAttributes().any{ it.getAttrName() in ['Cities'] }]]></principalExpression>
<filterExpression>store.store_city in (groovy('authentication.getPrincipal().getAttributes().find{ it.attrName == "Cities" }.attrValue'))</filterExpression>
</resourceAccessGrant>
Finally, testProfileAttribute is a function for taking advantage of the profile attributes feature. Anextension of the DomEL language, testProfileAttribute examines an object for a given profileattribute and permits access to the related data when the attribute is present.
Using the testProfileAttribute function, you can write simpler expressions than you can usingGroovy. For instance, this filter expression tests users for the Cities profile attribute. Compare it to theexpression in the previous example:
<filterExpression>testProfileAttribute(store.store_city, 'Cities')</filterExpression>
For more information about profile attributes, variable substitution, and testProfileAttribute, seethe JasperReports Server Ultimate Guide and Jaspersoft OLAP Ultimate Guide.
8.2.5 SQL FunctionsYou may use SQL functions in a DomEL expression, but only in limited circumstances:
• The functions must be supported by the database. See the vendor documentation for availablefunctions and their syntax.
• The functions must follow the convention of comma-separated parameters. For example, you canuse TRIM(person.name), but not TRIM('Jr' FROM person.name)
• The type of the return values must be appropriate, either within the expression or for the type ofthe calculated field.
• The SQL context must be appropriate for the functions. For example, you cannot use aggregationfunctions such as COUNT in a calculated field because there is no GROUP BY clause.
Except for the comma-separated parameter pattern, the DomEL validation cannot enforce these criteria.You must ensure that any SQL functions meet these criteria, otherwise the expression causes errorswhen using the Domain to create a report.
8.2.6 Complex ExpressionsComplex expressions are written by grouping any of the operators or functions above. Parentheses ()may be used for grouping boolean operators, but arithmetic expressions that rely on parentheses are not
264
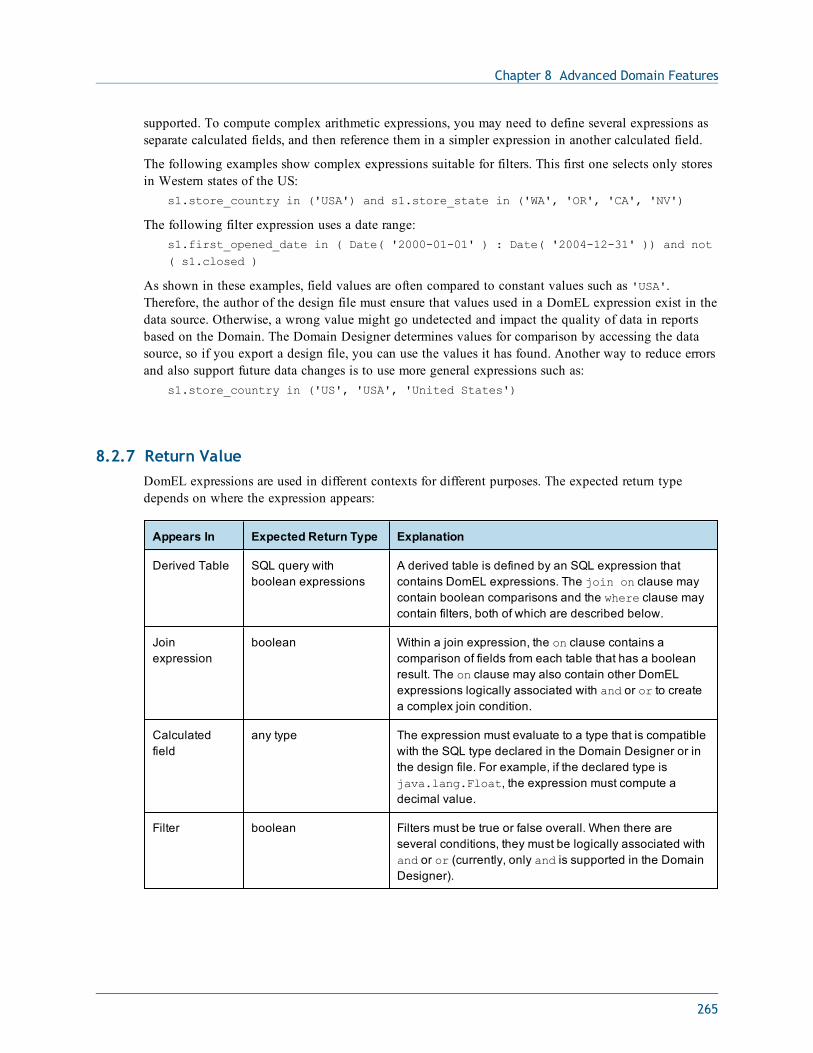
Chapter 8 Advanced Domain Features
supported. To compute complex arithmetic expressions, you may need to define several expressions asseparate calculated fields, and then reference them in a simpler expression in another calculated field.
The following examples show complex expressions suitable for filters. This first one selects only storesin Western states of the US:
s1.store_country in ('USA') and s1.store_state in ('WA', 'OR', 'CA', 'NV')
The following filter expression uses a date range:s1.first_opened_date in ( Date( '2000-01-01' ) : Date( '2004-12-31' )) and not( s1.closed )
As shown in these examples, field values are often compared to constant values such as 'USA'.Therefore, the author of the design file must ensure that values used in a DomEL expression exist in thedata source. Otherwise, a wrong value might go undetected and impact the quality of data in reportsbased on the Domain. The Domain Designer determines values for comparison by accessing the datasource, so if you export a design file, you can use the values it has found. Another way to reduce errorsand also support future data changes is to use more general expressions such as:
s1.store_country in ('US', 'USA', 'United States')
8.2.7 Return ValueDomEL expressions are used in different contexts for different purposes. The expected return typedepends on where the expression appears:
Appears In Expected Return Type Explanation
Derived Table SQL query withboolean expressions
A derived table is defined by an SQL expression thatcontains DomEL expressions. The join on clause maycontain boolean comparisons and the where clause maycontain filters, both of which are described below.
Joinexpression
boolean Within a join expression, the on clause contains acomparison of fields from each table that has a booleanresult. The on clause may also contain other DomELexpressions logically associated with and or or to createa complex join condition.
Calculatedfield
any type The expression must evaluate to a type that is compatiblewith the SQL type declared in the Domain Designer or inthe design file. For example, if the declared type isjava.lang.Float, the expression must compute adecimal value.
Filter boolean Filters must be true or false overall. When there areseveral conditions, they must be logically associated withand or or (currently, only and is supported in the DomainDesigner).
265
JasperReports Server User Guide
8.3 Security and Locale Information for a DomainYou can include security and locale information by uploading the following files:
• A single security file. Defines row and column-level access to data selected by the Domain.
• Any number of locale bundles. Provides internationalized labels for the sets and items of theDomain design.
You upload and manage these files using the Edit Domain or Add New Domain pages of the DomainDesigner. This section describes how to upload and replace Domain resources. For more informationabout the syntax of resource files, see “The Domain Security File” on page 269 and “LocaleBundles” on page 277.
To upload and replace a security file and locale bundles for a Domain:
1. Log in to the server as an administrator and select View > Search Results.
2. Locate the Domain. Typically, you set the Domain filter in Filters > All Types > More Choices> Domains.
3. Right-click an existing Domain and select Edit from the context-menu.
The Domain appears in the Edit Domain page of the Domain Designer.
4. Click Add Security File or Add Locale Bundle to upload a security file or locale bundle to theDomain. The respective Add Security File or Add Locale Bundle dialog box appears:
266
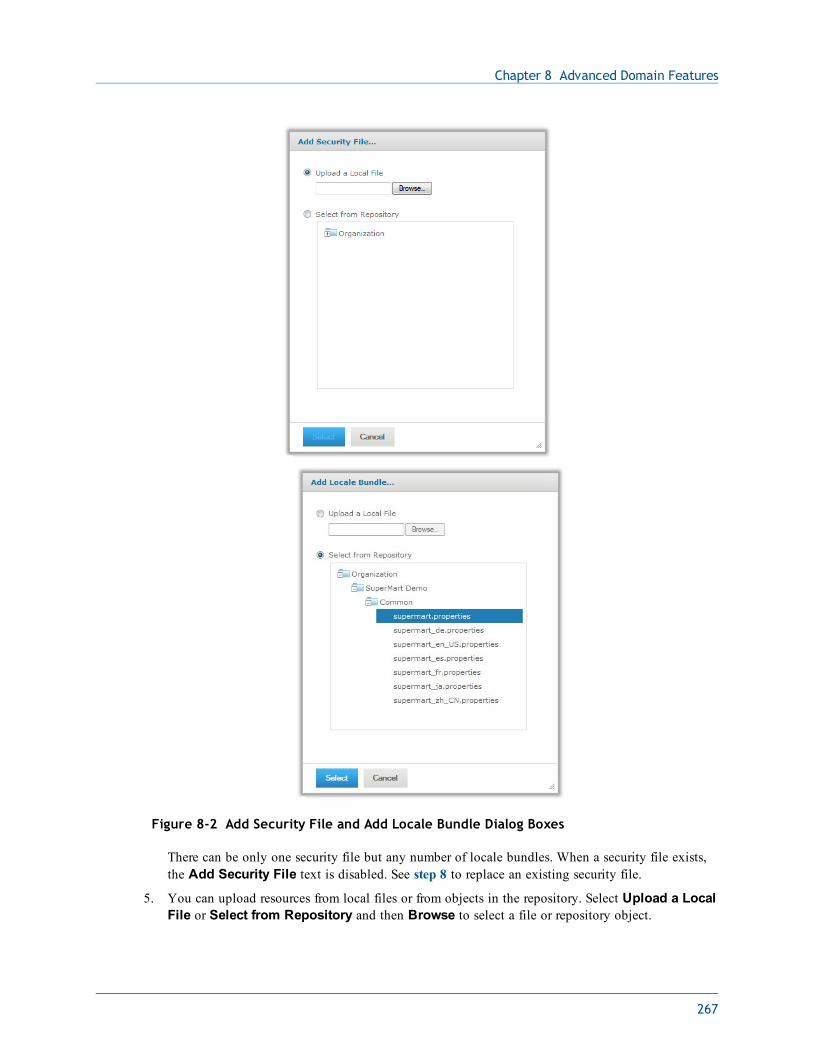
Chapter 8 Advanced Domain Features
Figure 8-2 Add Security File and Add Locale Bundle Dialog Boxes
There can be only one security file but any number of locale bundles. When a security file exists,the Add Security File text is disabled. See step 8 to replace an existing security file.
5. You can upload resources from local files or from objects in the repository. Select Upload a LocalFile or Select from Repository and then Browse to select a file or repository object.
267
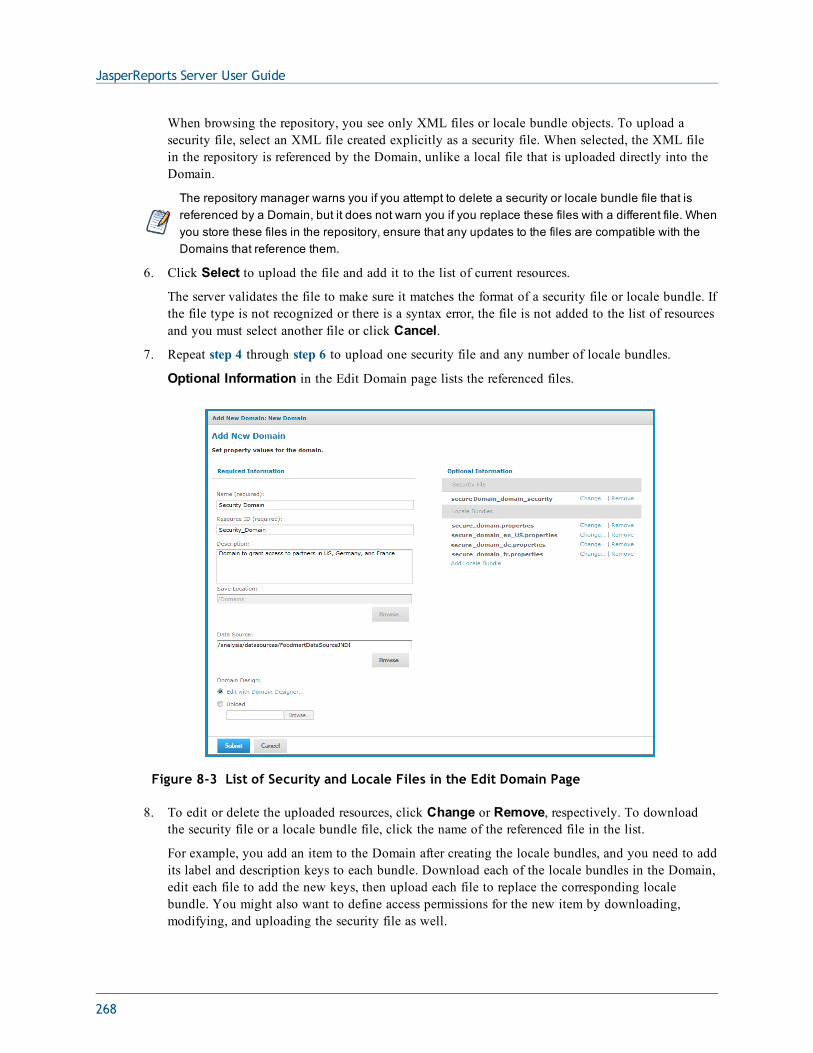
JasperReports Server User Guide
When browsing the repository, you see only XML files or locale bundle objects. To upload asecurity file, select an XML file created explicitly as a security file. When selected, the XML filein the repository is referenced by the Domain, unlike a local file that is uploaded directly into theDomain.
The repository manager warns you if you attempt to delete a security or locale bundle file that isreferenced by a Domain, but it does not warn you if you replace these files with a different file. Whenyou store these files in the repository, ensure that any updates to the files are compatible with theDomains that reference them.
6. Click Select to upload the file and add it to the list of current resources.
The server validates the file to make sure it matches the format of a security file or locale bundle. Ifthe file type is not recognized or there is a syntax error, the file is not added to the list of resourcesand you must select another file or click Cancel.
7. Repeat step 4 through step 6 to upload one security file and any number of locale bundles.
Optional Information in the Edit Domain page lists the referenced files.
Figure 8-3 List of Security and Locale Files in the Edit Domain Page
8. To edit or delete the uploaded resources, click Change or Remove, respectively. To downloadthe security file or a locale bundle file, click the name of the referenced file in the list.
For example, you add an item to the Domain after creating the locale bundles, and you need to addits label and description keys to each bundle. Download each of the locale bundles in the Domain,edit each file to add the new keys, then upload each file to replace the corresponding localebundle. You might also want to define access permissions for the new item by downloading,modifying, and uploading the security file as well.
268
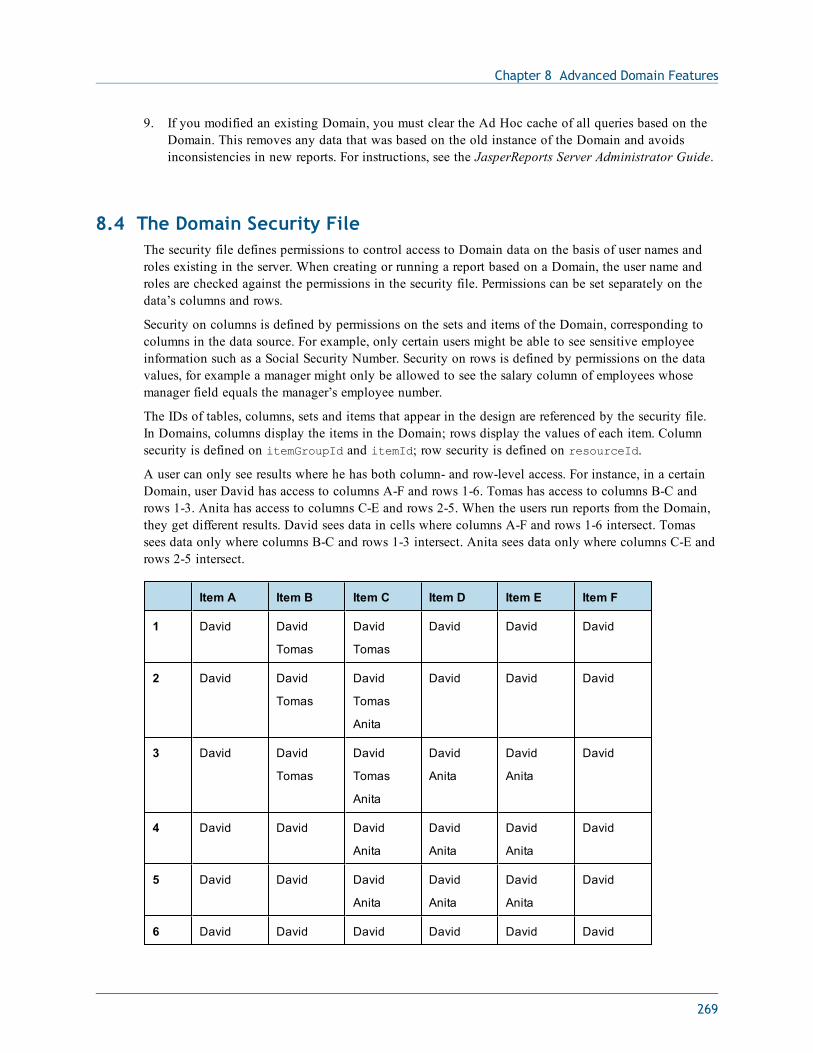
Chapter 8 Advanced Domain Features
9. If you modified an existing Domain, you must clear the Ad Hoc cache of all queries based on theDomain. This removes any data that was based on the old instance of the Domain and avoidsinconsistencies in new reports. For instructions, see the JasperReports Server Administrator Guide.
8.4 The Domain Security FileThe security file defines permissions to control access to Domain data on the basis of user names androles existing in the server. When creating or running a report based on a Domain, the user name androles are checked against the permissions in the security file. Permissions can be set separately on thedata’s columns and rows.
Security on columns is defined by permissions on the sets and items of the Domain, corresponding tocolumns in the data source. For example, only certain users might be able to see sensitive employeeinformation such as a Social Security Number. Security on rows is defined by permissions on the datavalues, for example a manager might only be allowed to see the salary column of employees whosemanager field equals the manager’s employee number.
The IDs of tables, columns, sets and items that appear in the design are referenced by the security file.In Domains, columns display the items in the Domain; rows display the values of each item. Columnsecurity is defined on itemGroupId and itemId; row security is defined on resourceId.
A user can only see results where he has both column- and row-level access. For instance, in a certainDomain, user David has access to columns A-F and rows 1-6. Tomas has access to columns B-C androws 1-3. Anita has access to columns C-E and rows 2-5. When the users run reports from the Domain,they get different results. David sees data in cells where columns A-F and rows 1-6 intersect. Tomassees data only where columns B-C and rows 1-3 intersect. Anita sees data only where columns C-E androws 2-5 intersect.
Item A Item B Item C Item D Item E Item F
1 David David
Tomas
David
Tomas
David David David
2 David David
Tomas
David
Tomas
Anita
David David David
3 David David
Tomas
David
Tomas
Anita
David
Anita
David
Anita
David
4 David David David
Anita
David
Anita
David
Anita
David
5 David David David
Anita
David
Anita
David
Anita
David
6 David David David David David David
269
JasperReports Server User Guide
For a given query on the data source, the security definition finds the access grants and determines hisaccess rights, determined first for item groups and items, then for resources. When the query is passed tothe data source and the report is run, the grants are applied as filters on the report’s columns and rows.Security that is defined on the physical layer applies to all content in the presentation layer. Securitythat is defined on a join applies only to the presentation layer content that is specific to the join.
When a user is designing a report in the Ad Hoc Editor, he sees only the columns to which he hasaccess. When the report runs, portions to which the user has no access are blank.
Access grants take a principalExpression that evaluates the principal in authentication objectscreated in the Acegi security framework (http://community.jaspersoft.com/). The standard expression is
<principalExpression>authentication.getPrincipal().getRoles().any{ it.getRoleName() in ['ANY_SUPPORTED_ROLE'] }
</principalExpression>
The expression gets the current authentication object and determines the access privileges of theprincipal in the object. Then, from the server, it gets the user and roles associated with the object.Finally, it evaluates the roles for the specified role. The access grants are applied to the role.
The expression evaluates to<principalExpression>authentication.principal.roles.roleName in ('ANY_SUPPORTED_ROLE')
</principalExpression>
While the standard principal expression tests for a given role, an expression can test for any object inthe principal. For example, this expression tests for attribute A:
<principalExpression>authentication.getPrincipal().getAttributes().any{ it.getAttributeA() in ['ANY_SUPPORTED_ROLE'] }
</principalExpression>
The scripting language for principalExpression is Groovy.
For more information about Groovy, go to http://groovy.codehaus.org.
All access grants for a Domain are defined in a single security file that is attached to the Domain as aresource, as described in “Security and Locale Information for a Domain” on page 266. The defaultaccess is granted.
When creating a security file, be sure to use the IDs of items and groups as they are defined in theDomain design file exported from the Domain Designer. For more information, see “Working With aDesign File” on page 243.
If you modify the Domain, you should also export the design file and update the security file with anyIDs that have changed. Update the security file using the Change function on the Edit Domain pageof the Domain Designer.
270
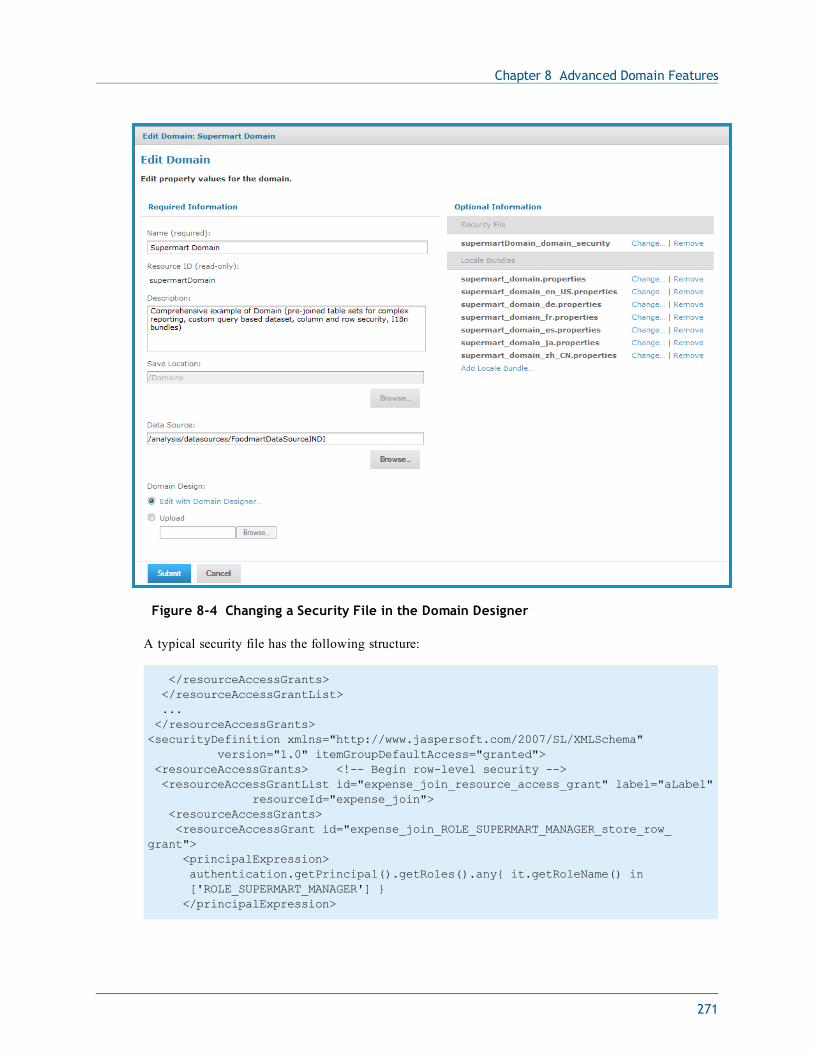
Chapter 8 Advanced Domain Features
Figure 8-4 Changing a Security File in the Domain Designer
A typical security file has the following structure:
</resourceAccessGrants></resourceAccessGrantList>...</resourceAccessGrants><securityDefinition xmlns="http://www.jaspersoft.com/2007/SL/XMLSchema"
version="1.0" itemGroupDefaultAccess="granted"><resourceAccessGrants> <!-- Begin row-level security --><resourceAccessGrantList id="expense_join_resource_access_grant" label="aLabel"
resourceId="expense_join"><resourceAccessGrants><resourceAccessGrant id="expense_join_ROLE_SUPERMART_MANAGER_store_row_
grant"><principalExpression>authentication.getPrincipal().getRoles().any{ it.getRoleName() in['ROLE_SUPERMART_MANAGER'] }</principalExpression>
271
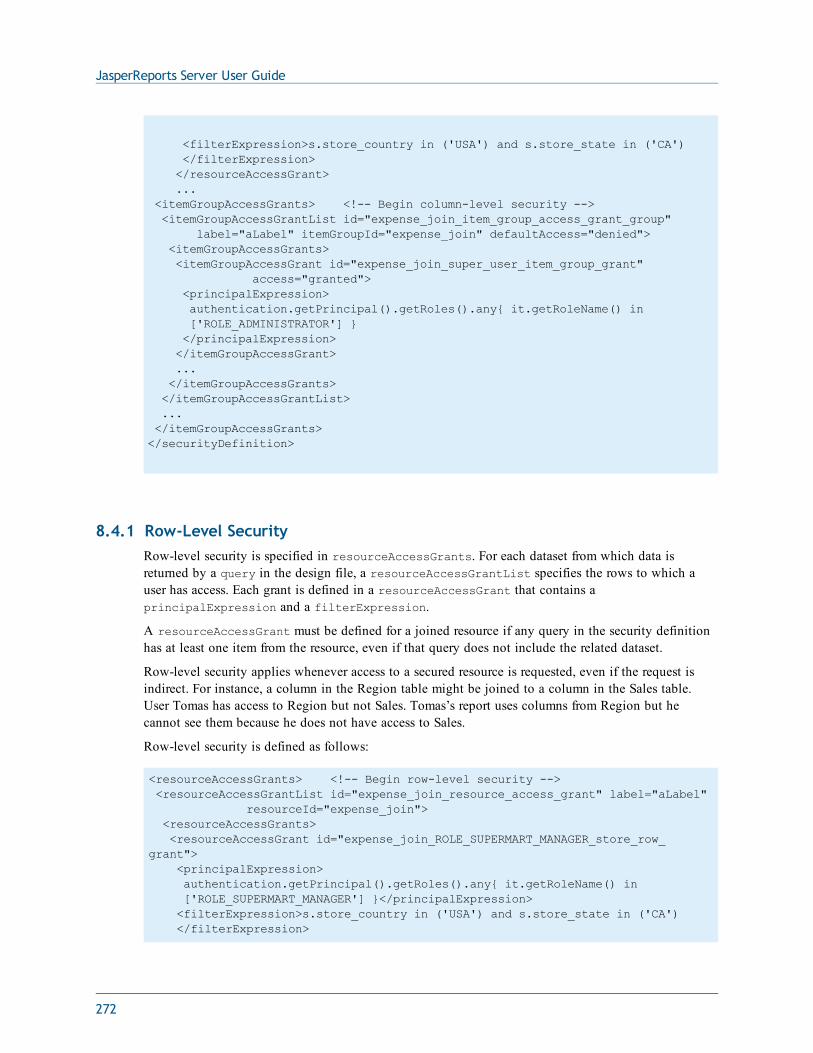
JasperReports Server User Guide
<filterExpression>s.store_country in ('USA') and s.store_state in ('CA')</filterExpression></resourceAccessGrant>...
<itemGroupAccessGrants> <!-- Begin column-level security --><itemGroupAccessGrantList id="expense_join_item_group_access_grant_group"
label="aLabel" itemGroupId="expense_join" defaultAccess="denied"><itemGroupAccessGrants><itemGroupAccessGrant id="expense_join_super_user_item_group_grant"
access="granted"><principalExpression>authentication.getPrincipal().getRoles().any{ it.getRoleName() in['ROLE_ADMINISTRATOR'] }</principalExpression></itemGroupAccessGrant>...</itemGroupAccessGrants></itemGroupAccessGrantList>...</itemGroupAccessGrants></securityDefinition>
8.4.1 Row-Level SecurityRow-level security is specified in resourceAccessGrants. For each dataset from which data isreturned by a query in the design file, a resourceAccessGrantList specifies the rows to which auser has access. Each grant is defined in a resourceAccessGrant that contains aprincipalExpression and a filterExpression.
A resourceAccessGrant must be defined for a joined resource if any query in the security definitionhas at least one item from the resource, even if that query does not include the related dataset.
Row-level security applies whenever access to a secured resource is requested, even if the request isindirect. For instance, a column in the Region table might be joined to a column in the Sales table.User Tomas has access to Region but not Sales. Tomas’s report uses columns from Region but hecannot see them because he does not have access to Sales.
Row-level security is defined as follows:
<resourceAccessGrants> <!-- Begin row-level security --><resourceAccessGrantList id="expense_join_resource_access_grant" label="aLabel"
resourceId="expense_join"><resourceAccessGrants><resourceAccessGrant id="expense_join_ROLE_SUPERMART_MANAGER_store_row_
grant"><principalExpression>authentication.getPrincipal().getRoles().any{ it.getRoleName() in['ROLE_SUPERMART_MANAGER'] }</principalExpression><filterExpression>s.store_country in ('USA') and s.store_state in ('CA')</filterExpression>
272
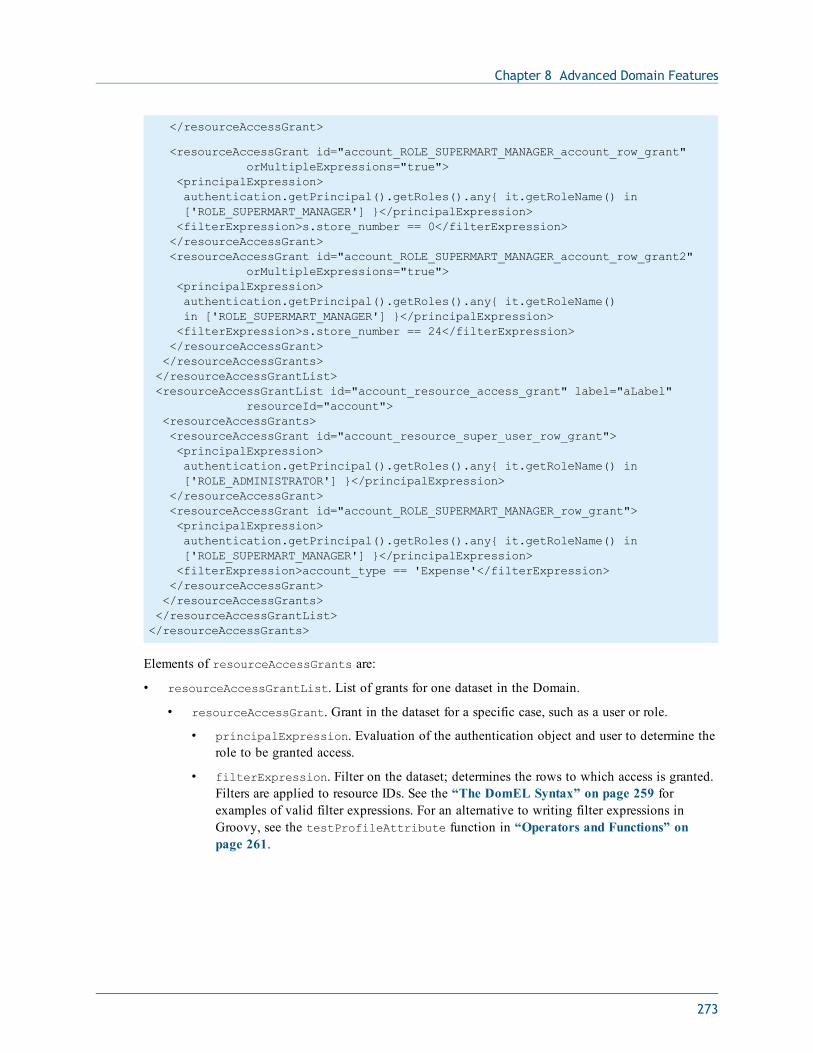
Chapter 8 Advanced Domain Features
</resourceAccessGrant>
<resourceAccessGrant id="account_ROLE_SUPERMART_MANAGER_account_row_grant" orMultipleExpressions="true">
<principalExpression>authentication.getPrincipal().getRoles().any{ it.getRoleName() in['ROLE_SUPERMART_MANAGER'] }</principalExpression><filterExpression>s.store_number == 0</filterExpression></resourceAccessGrant><resourceAccessGrant id="account_ROLE_SUPERMART_MANAGER_account_row_grant2"
orMultipleExpressions="true"><principalExpression>authentication.getPrincipal().getRoles().any{ it.getRoleName()in ['ROLE_SUPERMART_MANAGER'] }</principalExpression><filterExpression>s.store_number == 24</filterExpression></resourceAccessGrant></resourceAccessGrants></resourceAccessGrantList><resourceAccessGrantList id="account_resource_access_grant" label="aLabel"
resourceId="account"><resourceAccessGrants><resourceAccessGrant id="account_resource_super_user_row_grant"><principalExpression>authentication.getPrincipal().getRoles().any{ it.getRoleName() in['ROLE_ADMINISTRATOR'] }</principalExpression>
</resourceAccessGrant><resourceAccessGrant id="account_ROLE_SUPERMART_MANAGER_row_grant"><principalExpression>authentication.getPrincipal().getRoles().any{ it.getRoleName() in['ROLE_SUPERMART_MANAGER'] }</principalExpression><filterExpression>account_type == 'Expense'</filterExpression></resourceAccessGrant></resourceAccessGrants></resourceAccessGrantList></resourceAccessGrants>
Elements of resourceAccessGrants are:
• resourceAccessGrantList. List of grants for one dataset in the Domain.
• resourceAccessGrant. Grant in the dataset for a specific case, such as a user or role.
• principalExpression. Evaluation of the authentication object and user to determine therole to be granted access.
• filterExpression. Filter on the dataset; determines the rows to which access is granted.Filters are applied to resource IDs. See the “The DomEL Syntax” on page 259 forexamples of valid filter expressions. For an alternative to writing filter expressions inGroovy, see the testProfileAttribute function in “Operators and Functions” onpage 261.
273
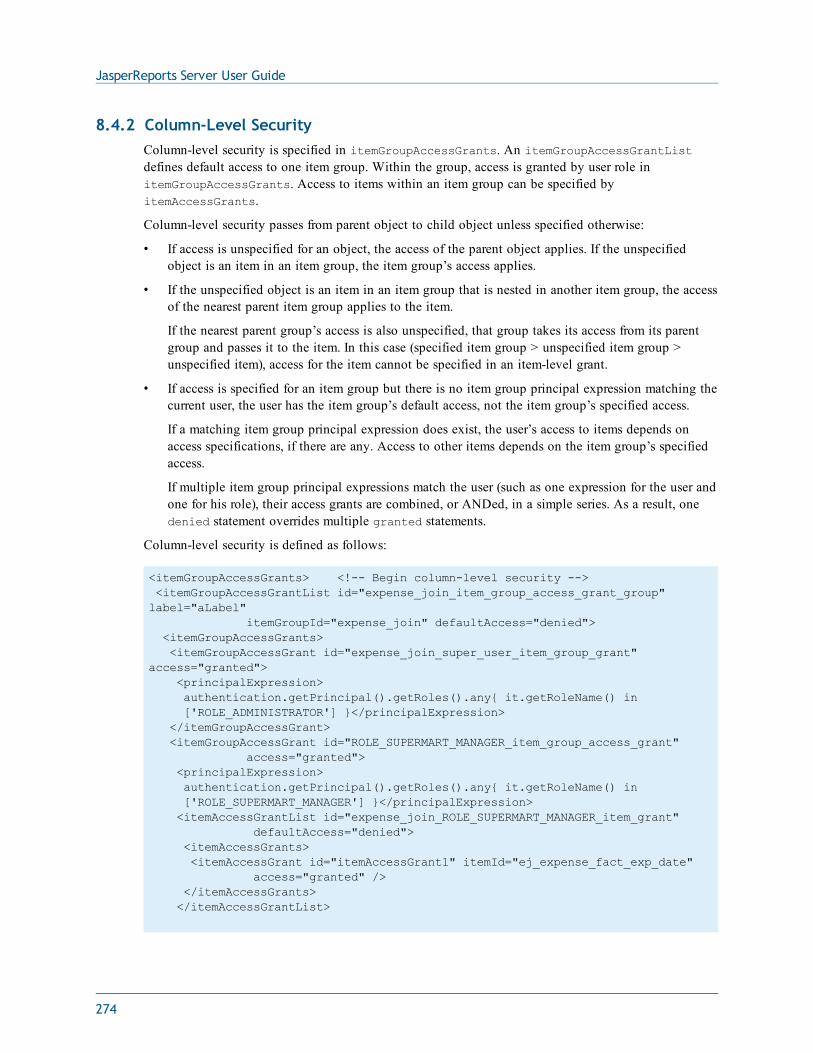
JasperReports Server User Guide
8.4.2 Column-Level SecurityColumn-level security is specified in itemGroupAccessGrants. An itemGroupAccessGrantListdefines default access to one item group. Within the group, access is granted by user role initemGroupAccessGrants. Access to items within an item group can be specified byitemAccessGrants.
Column-level security passes from parent object to child object unless specified otherwise:
• If access is unspecified for an object, the access of the parent object applies. If the unspecifiedobject is an item in an item group, the item group’s access applies.
• If the unspecified object is an item in an item group that is nested in another item group, the accessof the nearest parent item group applies to the item.
If the nearest parent group’s access is also unspecified, that group takes its access from its parentgroup and passes it to the item. In this case (specified item group > unspecified item group >unspecified item), access for the item cannot be specified in an item-level grant.
• If access is specified for an item group but there is no item group principal expression matching thecurrent user, the user has the item group’s default access, not the item group’s specified access.
If a matching item group principal expression does exist, the user’s access to items depends onaccess specifications, if there are any. Access to other items depends on the item group’s specifiedaccess.
If multiple item group principal expressions match the user (such as one expression for the user andone for his role), their access grants are combined, or ANDed, in a simple series. As a result, onedenied statement overrides multiple granted statements.
Column-level security is defined as follows:
<itemGroupAccessGrants> <!-- Begin column-level security --><itemGroupAccessGrantList id="expense_join_item_group_access_grant_group"label="aLabel"
itemGroupId="expense_join" defaultAccess="denied"><itemGroupAccessGrants><itemGroupAccessGrant id="expense_join_super_user_item_group_grant"
access="granted"><principalExpression>authentication.getPrincipal().getRoles().any{ it.getRoleName() in['ROLE_ADMINISTRATOR'] }</principalExpression>
</itemGroupAccessGrant><itemGroupAccessGrant id="ROLE_SUPERMART_MANAGER_item_group_access_grant"
access="granted"><principalExpression>authentication.getPrincipal().getRoles().any{ it.getRoleName() in['ROLE_SUPERMART_MANAGER'] }</principalExpression><itemAccessGrantList id="expense_join_ROLE_SUPERMART_MANAGER_item_grant"
defaultAccess="denied"><itemAccessGrants><itemAccessGrant id="itemAccessGrant1" itemId="ej_expense_fact_exp_date"
access="granted" /></itemAccessGrants></itemAccessGrantList>
274
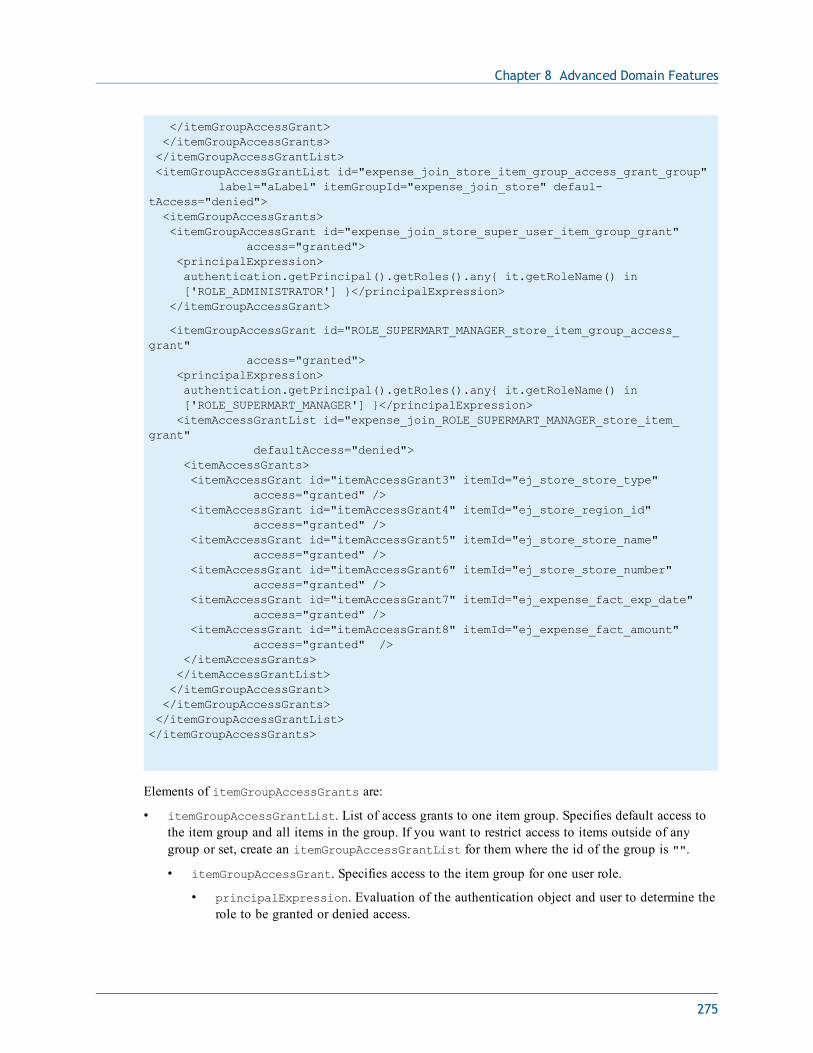
Chapter 8 Advanced Domain Features
</itemGroupAccessGrant></itemGroupAccessGrants></itemGroupAccessGrantList><itemGroupAccessGrantList id="expense_join_store_item_group_access_grant_group"
label="aLabel" itemGroupId="expense_join_store" defaul-tAccess="denied"><itemGroupAccessGrants><itemGroupAccessGrant id="expense_join_store_super_user_item_group_grant"
access="granted"><principalExpression>authentication.getPrincipal().getRoles().any{ it.getRoleName() in['ROLE_ADMINISTRATOR'] }</principalExpression>
</itemGroupAccessGrant>
<itemGroupAccessGrant id="ROLE_SUPERMART_MANAGER_store_item_group_access_grant"
access="granted"><principalExpression>authentication.getPrincipal().getRoles().any{ it.getRoleName() in['ROLE_SUPERMART_MANAGER'] }</principalExpression><itemAccessGrantList id="expense_join_ROLE_SUPERMART_MANAGER_store_item_
grant" defaultAccess="denied">
<itemAccessGrants><itemAccessGrant id="itemAccessGrant3" itemId="ej_store_store_type"
access="granted" /><itemAccessGrant id="itemAccessGrant4" itemId="ej_store_region_id"
access="granted" /><itemAccessGrant id="itemAccessGrant5" itemId="ej_store_store_name"
access="granted" /><itemAccessGrant id="itemAccessGrant6" itemId="ej_store_store_number"
access="granted" /><itemAccessGrant id="itemAccessGrant7" itemId="ej_expense_fact_exp_date"
access="granted" /><itemAccessGrant id="itemAccessGrant8" itemId="ej_expense_fact_amount"
access="granted" /></itemAccessGrants></itemAccessGrantList></itemGroupAccessGrant></itemGroupAccessGrants></itemGroupAccessGrantList></itemGroupAccessGrants>
Elements of itemGroupAccessGrants are:
• itemGroupAccessGrantList. List of access grants to one item group. Specifies default access tothe item group and all items in the group. If you want to restrict access to items outside of anygroup or set, create an itemGroupAccessGrantList for them where the id of the group is "".
• itemGroupAccessGrant. Specifies access to the item group for one user role.
• principalExpression. Evaluation of the authentication object and user to determine therole to be granted or denied access.
275
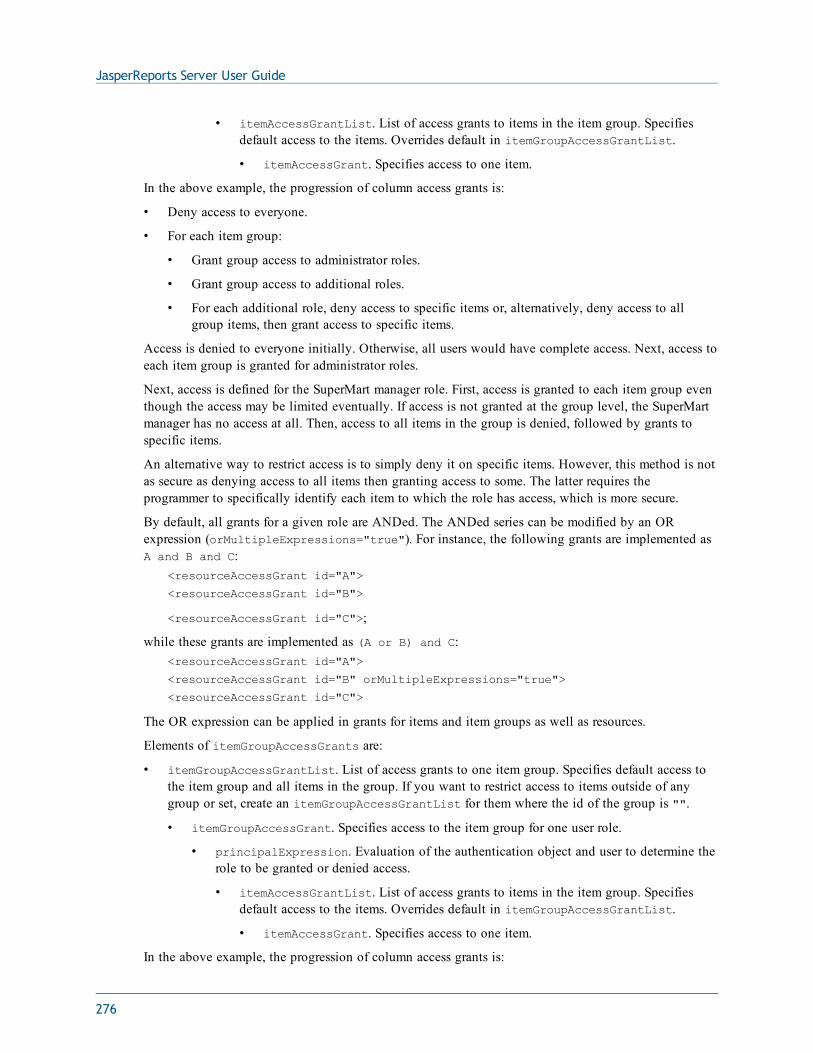
JasperReports Server User Guide
• itemAccessGrantList. List of access grants to items in the item group. Specifiesdefault access to the items. Overrides default in itemGroupAccessGrantList.
• itemAccessGrant. Specifies access to one item.
In the above example, the progression of column access grants is:
• Deny access to everyone.
• For each item group:
• Grant group access to administrator roles.
• Grant group access to additional roles.
• For each additional role, deny access to specific items or, alternatively, deny access to allgroup items, then grant access to specific items.
Access is denied to everyone initially. Otherwise, all users would have complete access. Next, access toeach item group is granted for administrator roles.
Next, access is defined for the SuperMart manager role. First, access is granted to each item group eventhough the access may be limited eventually. If access is not granted at the group level, the SuperMartmanager has no access at all. Then, access to all items in the group is denied, followed by grants tospecific items.
An alternative way to restrict access is to simply deny it on specific items. However, this method is notas secure as denying access to all items then granting access to some. The latter requires theprogrammer to specifically identify each item to which the role has access, which is more secure.
By default, all grants for a given role are ANDed. The ANDed series can be modified by an ORexpression (orMultipleExpressions="true"). For instance, the following grants are implemented asA and B and C:
<resourceAccessGrant id="A">
<resourceAccessGrant id="B">
<resourceAccessGrant id="C">;
while these grants are implemented as (A or B) and C:<resourceAccessGrant id="A">
<resourceAccessGrant id="B" orMultipleExpressions="true">
<resourceAccessGrant id="C">
The OR expression can be applied in grants for items and item groups as well as resources.
Elements of itemGroupAccessGrants are:
• itemGroupAccessGrantList. List of access grants to one item group. Specifies default access tothe item group and all items in the group. If you want to restrict access to items outside of anygroup or set, create an itemGroupAccessGrantList for them where the id of the group is "".
• itemGroupAccessGrant. Specifies access to the item group for one user role.
• principalExpression. Evaluation of the authentication object and user to determine therole to be granted or denied access.
• itemAccessGrantList. List of access grants to items in the item group. Specifiesdefault access to the items. Overrides default in itemGroupAccessGrantList.
• itemAccessGrant. Specifies access to one item.
In the above example, the progression of column access grants is:
276
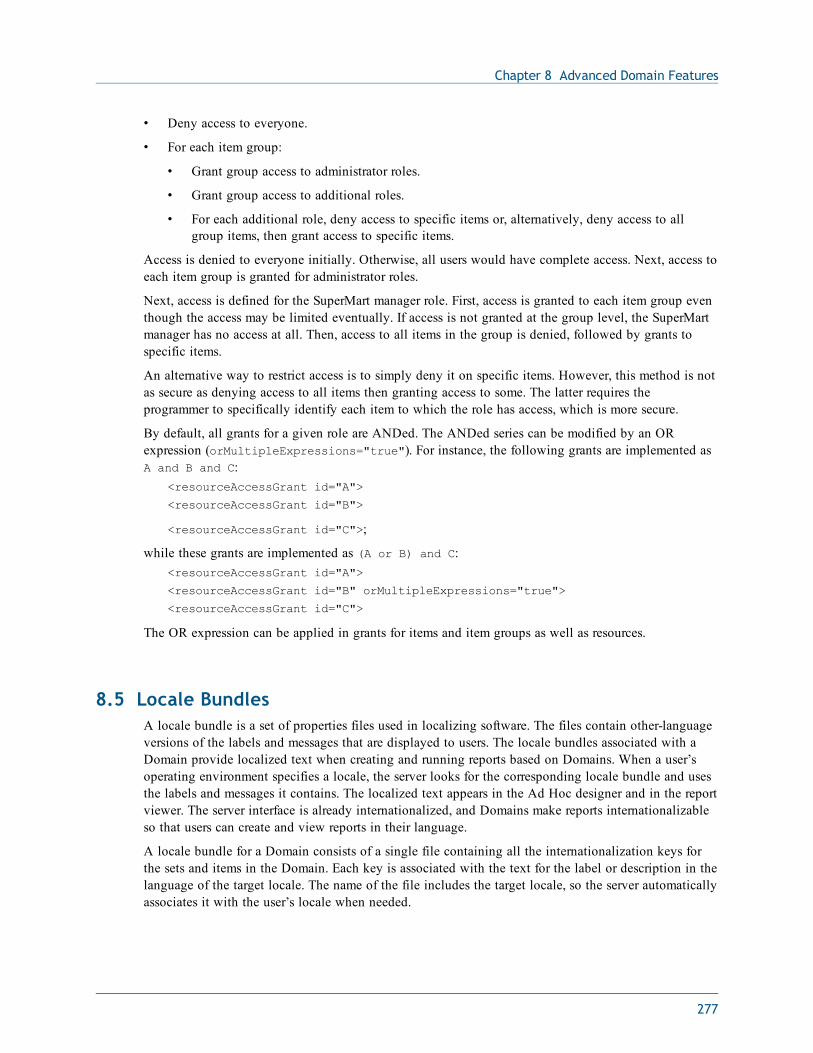
Chapter 8 Advanced Domain Features
• Deny access to everyone.
• For each item group:
• Grant group access to administrator roles.
• Grant group access to additional roles.
• For each additional role, deny access to specific items or, alternatively, deny access to allgroup items, then grant access to specific items.
Access is denied to everyone initially. Otherwise, all users would have complete access. Next, access toeach item group is granted for administrator roles.
Next, access is defined for the SuperMart manager role. First, access is granted to each item group eventhough the access may be limited eventually. If access is not granted at the group level, the SuperMartmanager has no access at all. Then, access to all items in the group is denied, followed by grants tospecific items.
An alternative way to restrict access is to simply deny it on specific items. However, this method is notas secure as denying access to all items then granting access to some. The latter requires theprogrammer to specifically identify each item to which the role has access, which is more secure.
By default, all grants for a given role are ANDed. The ANDed series can be modified by an ORexpression (orMultipleExpressions="true"). For instance, the following grants are implemented asA and B and C:
<resourceAccessGrant id="A">
<resourceAccessGrant id="B">
<resourceAccessGrant id="C">;
while these grants are implemented as (A or B) and C:<resourceAccessGrant id="A">
<resourceAccessGrant id="B" orMultipleExpressions="true">
<resourceAccessGrant id="C">
The OR expression can be applied in grants for items and item groups as well as resources.
8.5 Locale BundlesA locale bundle is a set of properties files used in localizing software. The files contain other-languageversions of the labels and messages that are displayed to users. The locale bundles associated with aDomain provide localized text when creating and running reports based on Domains. When a user’soperating environment specifies a locale, the server looks for the corresponding locale bundle and usesthe labels and messages it contains. The localized text appears in the Ad Hoc designer and in the reportviewer. The server interface is already internationalized, and Domains make reports internationalizableso that users can create and view reports in their language.
A locale bundle for a Domain consists of a single file containing all the internationalization keys forthe sets and items in the Domain. Each key is associated with the text for the label or description in thelanguage of the target locale. The name of the file includes the target locale, so the server automaticallyassociates it with the user’s locale when needed.
277
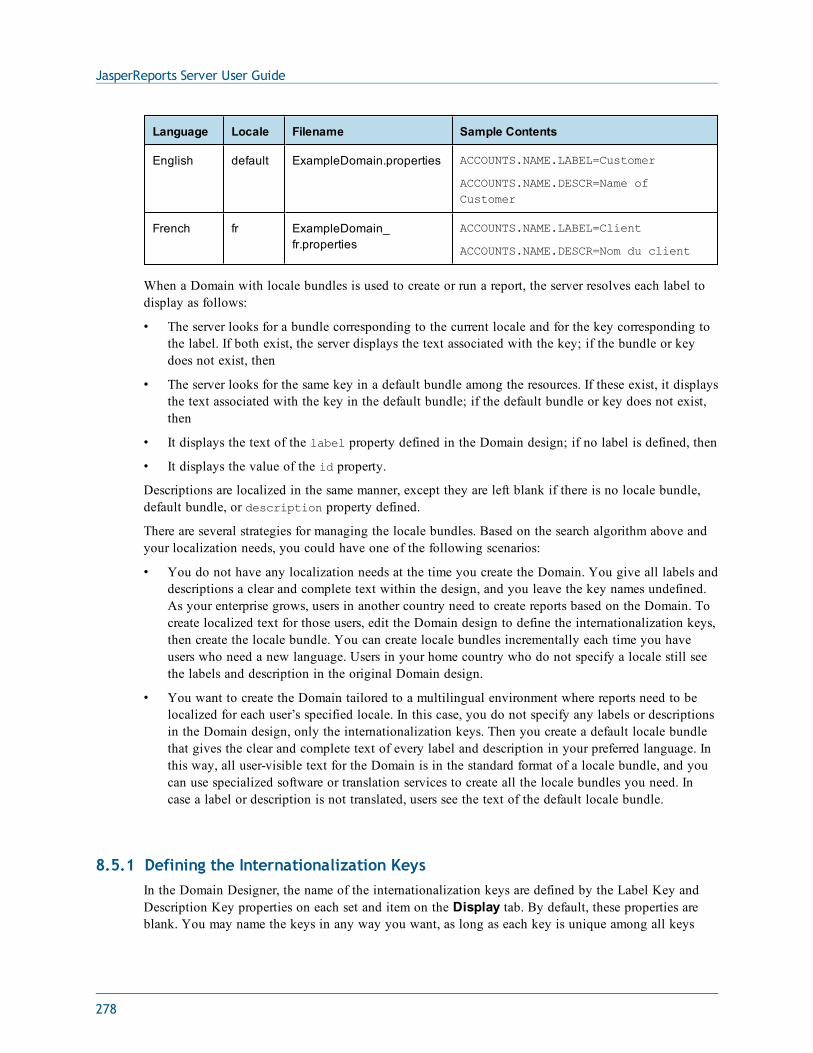
JasperReports Server User Guide
Language Locale Filename Sample Contents
English default ExampleDomain.properties ACCOUNTS.NAME.LABEL=Customer
ACCOUNTS.NAME.DESCR=Name ofCustomer
French fr ExampleDomain_fr.properties
ACCOUNTS.NAME.LABEL=Client
ACCOUNTS.NAME.DESCR=Nom du client
When a Domain with locale bundles is used to create or run a report, the server resolves each label todisplay as follows:
• The server looks for a bundle corresponding to the current locale and for the key corresponding tothe label. If both exist, the server displays the text associated with the key; if the bundle or keydoes not exist, then
• The server looks for the same key in a default bundle among the resources. If these exist, it displaysthe text associated with the key in the default bundle; if the default bundle or key does not exist,then
• It displays the text of the label property defined in the Domain design; if no label is defined, then
• It displays the value of the id property.
Descriptions are localized in the same manner, except they are left blank if there is no locale bundle,default bundle, or description property defined.
There are several strategies for managing the locale bundles. Based on the search algorithm above andyour localization needs, you could have one of the following scenarios:
• You do not have any localization needs at the time you create the Domain. You give all labels anddescriptions a clear and complete text within the design, and you leave the key names undefined.As your enterprise grows, users in another country need to create reports based on the Domain. Tocreate localized text for those users, edit the Domain design to define the internationalization keys,then create the locale bundle. You can create locale bundles incrementally each time you haveusers who need a new language. Users in your home country who do not specify a locale still seethe labels and description in the original Domain design.
• You want to create the Domain tailored to a multilingual environment where reports need to belocalized for each user’s specified locale. In this case, you do not specify any labels or descriptionsin the Domain design, only the internationalization keys. Then you create a default locale bundlethat gives the clear and complete text of every label and description in your preferred language. Inthis way, all user-visible text for the Domain is in the standard format of a locale bundle, and youcan use specialized software or translation services to create all the locale bundles you need. Incase a label or description is not translated, users see the text of the default locale bundle.
8.5.1 Defining the Internationalization KeysIn the Domain Designer, the name of the internationalization keys are defined by the Label Key andDescription Key properties on each set and item on the Display tab. By default, these properties areblank. You may name the keys in any way you want, as long as each key is unique among all keys
278
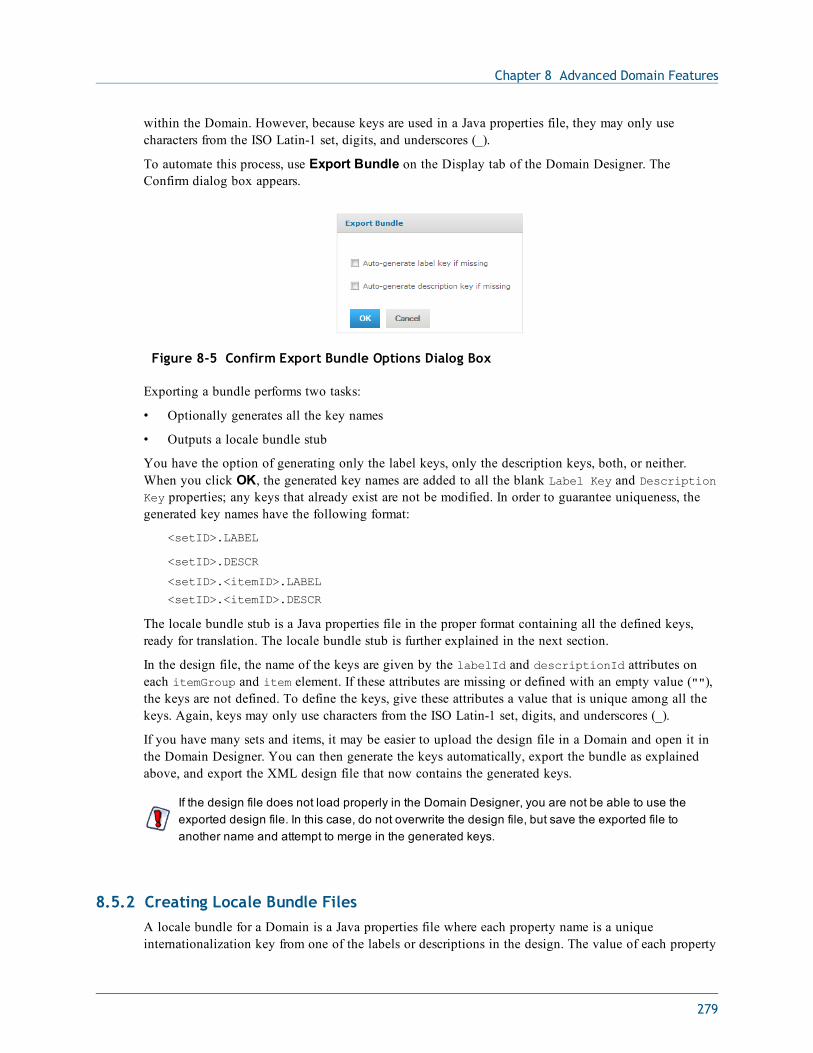
Chapter 8 Advanced Domain Features
within the Domain. However, because keys are used in a Java properties file, they may only usecharacters from the ISO Latin-1 set, digits, and underscores (_).
To automate this process, use Export Bundle on the Display tab of the Domain Designer. TheConfirm dialog box appears.
Figure 8-5 Confirm Export Bundle Options Dialog Box
Exporting a bundle performs two tasks:
• Optionally generates all the key names
• Outputs a locale bundle stub
You have the option of generating only the label keys, only the description keys, both, or neither.When you click OK, the generated key names are added to all the blank Label Key and DescriptionKey properties; any keys that already exist are not be modified. In order to guarantee uniqueness, thegenerated key names have the following format:
<setID>.LABEL
<setID>.DESCR
<setID>.<itemID>.LABEL
<setID>.<itemID>.DESCR
The locale bundle stub is a Java properties file in the proper format containing all the defined keys,ready for translation. The locale bundle stub is further explained in the next section.
In the design file, the name of the keys are given by the labelId and descriptionId attributes oneach itemGroup and item element. If these attributes are missing or defined with an empty value (""),the keys are not defined. To define the keys, give these attributes a value that is unique among all thekeys. Again, keys may only use characters from the ISO Latin-1 set, digits, and underscores (_).
If you have many sets and items, it may be easier to upload the design file in a Domain and open it inthe Domain Designer. You can then generate the keys automatically, export the bundle as explainedabove, and export the XML design file that now contains the generated keys.
If the design file does not load properly in the Domain Designer, you are not be able to use theexported design file. In this case, do not overwrite the design file, but save the exported file toanother name and attempt to merge in the generated keys.
8.5.2 Creating Locale Bundle FilesA locale bundle for a Domain is a Java properties file where each property name is a uniqueinternationalization key from one of the labels or descriptions in the design. The value of each property
279
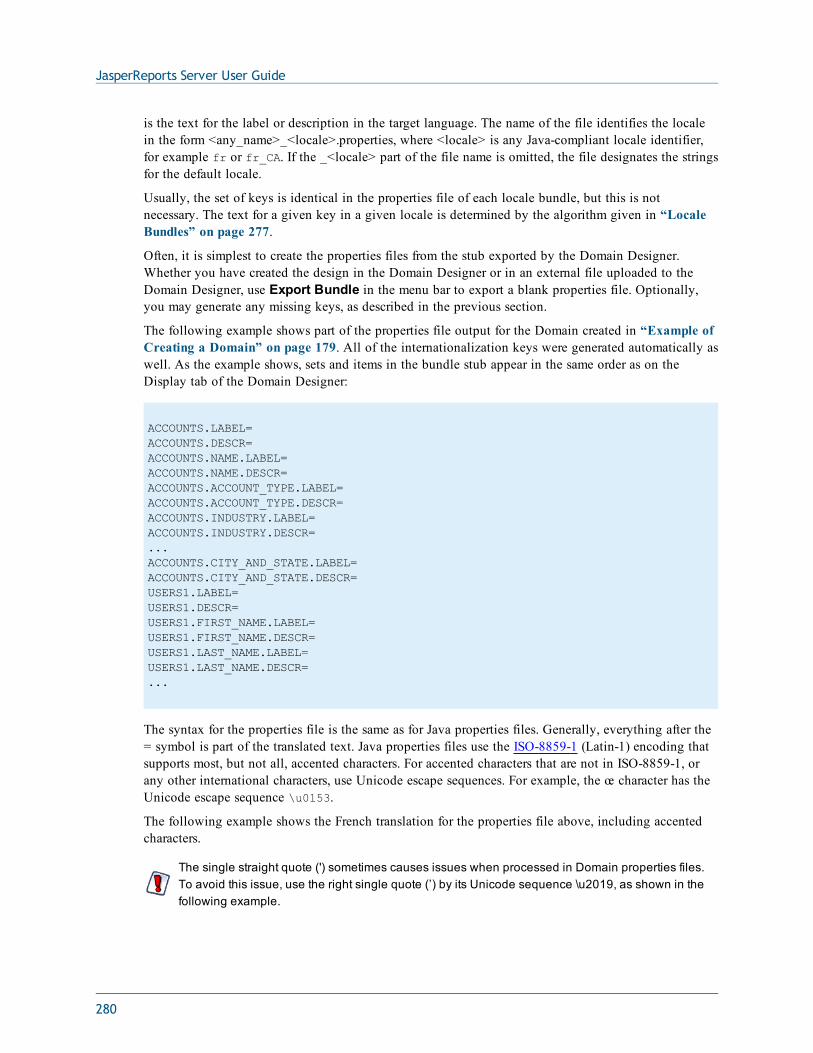
JasperReports Server User Guide
is the text for the label or description in the target language. The name of the file identifies the localein the form <any_name>_<locale>.properties, where <locale> is any Java-compliant locale identifier,for example fr or fr_CA. If the _<locale> part of the file name is omitted, the file designates the stringsfor the default locale.
Usually, the set of keys is identical in the properties file of each locale bundle, but this is notnecessary. The text for a given key in a given locale is determined by the algorithm given in “LocaleBundles” on page 277.
Often, it is simplest to create the properties files from the stub exported by the Domain Designer.Whether you have created the design in the Domain Designer or in an external file uploaded to theDomain Designer, use Export Bundle in the menu bar to export a blank properties file. Optionally,you may generate any missing keys, as described in the previous section.
The following example shows part of the properties file output for the Domain created in “Example ofCreating a Domain” on page 179. All of the internationalization keys were generated automatically aswell. As the example shows, sets and items in the bundle stub appear in the same order as on theDisplay tab of the Domain Designer:
ACCOUNTS.LABEL=ACCOUNTS.DESCR=ACCOUNTS.NAME.LABEL=ACCOUNTS.NAME.DESCR=ACCOUNTS.ACCOUNT_TYPE.LABEL=ACCOUNTS.ACCOUNT_TYPE.DESCR=ACCOUNTS.INDUSTRY.LABEL=ACCOUNTS.INDUSTRY.DESCR=...ACCOUNTS.CITY_AND_STATE.LABEL=ACCOUNTS.CITY_AND_STATE.DESCR=USERS1.LABEL=USERS1.DESCR=USERS1.FIRST_NAME.LABEL=USERS1.FIRST_NAME.DESCR=USERS1.LAST_NAME.LABEL=USERS1.LAST_NAME.DESCR=...
The syntax for the properties file is the same as for Java properties files. Generally, everything after the= symbol is part of the translated text. Java properties files use the ISO-8859-1 (Latin-1) encoding thatsupports most, but not all, accented characters. For accented characters that are not in ISO-8859-1, orany other international characters, use Unicode escape sequences. For example, the œ character has theUnicode escape sequence \u0153.
The following example shows the French translation for the properties file above, including accentedcharacters.
The single straight quote (') sometimes causes issues when processed in Domain properties files.To avoid this issue, use the right single quote (’) by its Unicode sequence \u2019, as shown in thefollowing example.
280
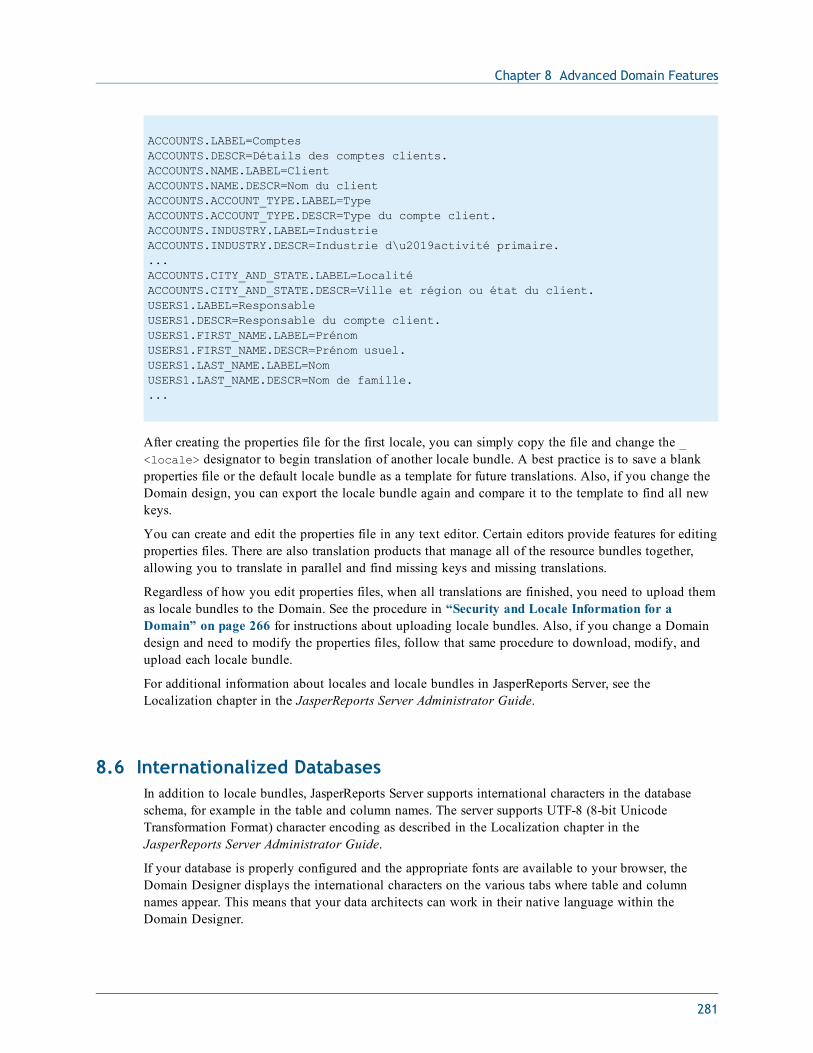
Chapter 8 Advanced Domain Features
ACCOUNTS.LABEL=ComptesACCOUNTS.DESCR=Détails des comptes clients.ACCOUNTS.NAME.LABEL=ClientACCOUNTS.NAME.DESCR=Nom du clientACCOUNTS.ACCOUNT_TYPE.LABEL=TypeACCOUNTS.ACCOUNT_TYPE.DESCR=Type du compte client.ACCOUNTS.INDUSTRY.LABEL=IndustrieACCOUNTS.INDUSTRY.DESCR=Industrie d\u2019activité primaire....ACCOUNTS.CITY_AND_STATE.LABEL=LocalitéACCOUNTS.CITY_AND_STATE.DESCR=Ville et région ou état du client.USERS1.LABEL=ResponsableUSERS1.DESCR=Responsable du compte client.USERS1.FIRST_NAME.LABEL=PrénomUSERS1.FIRST_NAME.DESCR=Prénom usuel.USERS1.LAST_NAME.LABEL=NomUSERS1.LAST_NAME.DESCR=Nom de famille....
After creating the properties file for the first locale, you can simply copy the file and change the _<locale> designator to begin translation of another locale bundle. A best practice is to save a blankproperties file or the default locale bundle as a template for future translations. Also, if you change theDomain design, you can export the locale bundle again and compare it to the template to find all newkeys.
You can create and edit the properties file in any text editor. Certain editors provide features for editingproperties files. There are also translation products that manage all of the resource bundles together,allowing you to translate in parallel and find missing keys and missing translations.
Regardless of how you edit properties files, when all translations are finished, you need to upload themas locale bundles to the Domain. See the procedure in “Security and Locale Information for aDomain” on page 266 for instructions about uploading locale bundles. Also, if you change a Domaindesign and need to modify the properties files, follow that same procedure to download, modify, andupload each locale bundle.
For additional information about locales and locale bundles in JasperReports Server, see theLocalization chapter in the JasperReports Server Administrator Guide.
8.6 Internationalized DatabasesIn addition to locale bundles, JasperReports Server supports international characters in the databaseschema, for example in the table and column names. The server supports UTF-8 (8-bit UnicodeTransformation Format) character encoding as described in the Localization chapter in theJasperReports Server Administrator Guide.
If your database is properly configured and the appropriate fonts are available to your browser, theDomain Designer displays the international characters on the various tabs where table and columnnames appear. This means that your data architects can work in their native language within theDomain Designer.
281
JasperReports Server User Guide
As with all values from your reporting database, table and column names are not localizable. Theycan only be displayed in the Domain Designer as they appear in the database. You can, however,have localized labels for these table and column names, so that they appear in the Ad Hoc designeraccording to the users’ locale.
All UTF-8 characters are allowed in IDs except the following symbols that will cause errors: ().,"=!+-></:[]*|?$. This limitation applies to table IDs in the database as well as user created IDs indesign files and in the Domain Designer. In addition, the straight single quote (', Unicode 0027) canappear in database table IDs but not in user-created IDs. In general, the best practice is to use alphabetcharacters, not punctuation or arithmetic symbols when creating Domains.
8.7 Copying a DomainIn some cases, for example, when you are making extensive changes to a Domain using the Domaindesigner, you may want to create a copy of a Domain. Because each Domain has a Resource ID, youmust copy the Domain to a different folder in the repository.
To copy a Domain via the UI:
1. Log in to the server as an administrator and select View > Search Results.
2. Locate the Domain.
a. Choose View > Search Results.
b. In the Filters panel, under Types, click More choices.
c. Click Domains.
3. Right-click an existing Domain and select Copy from the context-menu.
4. Select View > Repository from the menu.
5. Right-click a folder that does not contain the original Domain and select Paste from the context-menu.
To change the Resource ID of the Domain, export the Domain design file as described in“Exporting the Design File from a Domain” on page 242, manually edit the Domain’s resource ID,then upload the design file as described in “Uploading a Design File to a Domain” on page 258.
8.8 Switching the Data Source of a DomainYou can select a different data source for a Domain on the Edit Domain page or in the Manage DataSource dialog box. However, because the Domain design relies extensively on the data source, it islikely that some tables in your Domain won’t be valid and information such as derived tables andcalculated fields will be lost. Always back up a Domain before switching the data source, and makesure that the change makes sense for this Domain and data source. Examples where it may make senseto switch the data source include:
• Switching to a data source with a different database schema but with the same tables; forexample, when moving from staging to production.
282
Chapter 8 Advanced Domain Features
• Switching from a regular data source to a virtual data source that contains the original datasource. In this case, JasperReports Server attempts to locate the original data source inside thevirtual data source and create the correct prefix. Derived tables and calculated fields are notpreserved.
• Switching from a virtual data source to one of the data sources it includes. In this case, anyresources that are not in the selected data source are deleted along with any dependentinformation, such as joins or labels that depend on the deleted resources. Derived tables andcalculated fields are not preserved.
If you change to a data source with a different schema structure, the definitions in the Domaindesign are no longer valid and you cannot save the Domain.
To change the data source of a Domain:
1. Log in to the server as an administrator and select View > Search Results.
2. Locate the Domain.
a. Choose View > Search Results.
b. In the Filters panel, under Types, click More choices.
c. Click Domains.
3. Create a copy of the Domain as described in “Copying a Domain” on page 282.
4. Locate the Domain again, right-click it and select Edit from the context menu.
The Edit Domain page appears.
283
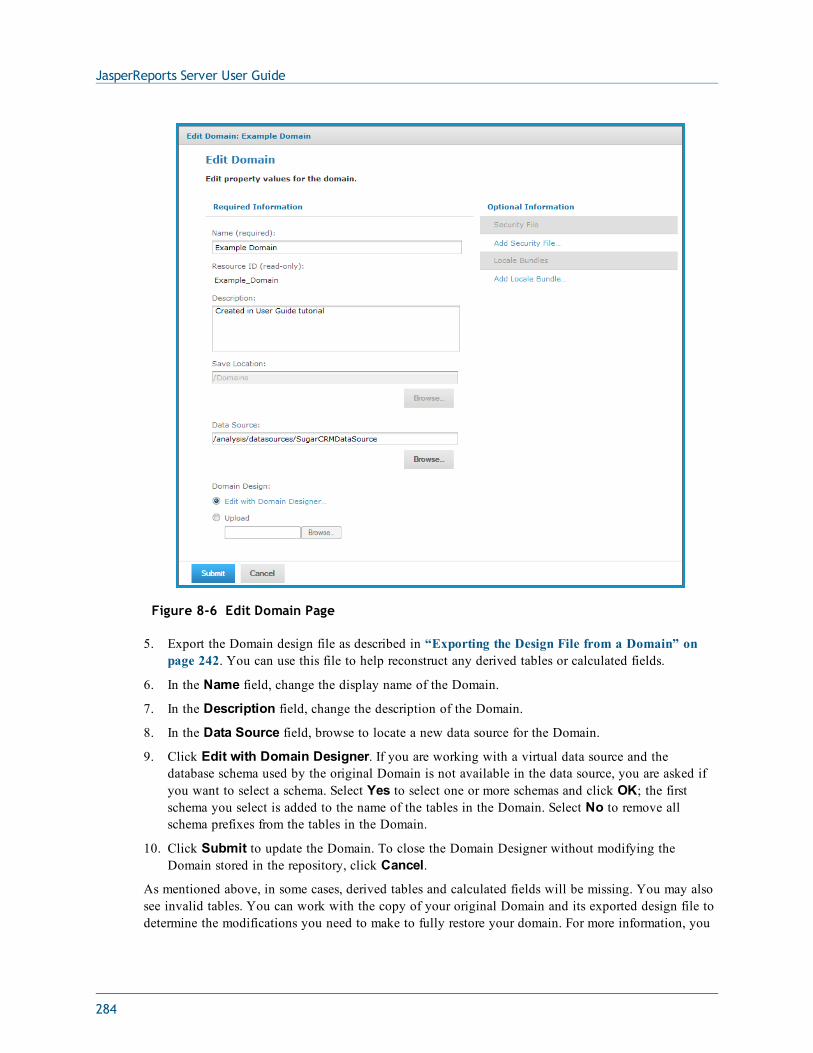
JasperReports Server User Guide
Figure 8-6 Edit Domain Page
5. Export the Domain design file as described in “Exporting the Design File from a Domain” onpage 242. You can use this file to help reconstruct any derived tables or calculated fields.
6. In the Name field, change the display name of the Domain.
7. In the Description field, change the description of the Domain.
8. In the Data Source field, browse to locate a new data source for the Domain.
9. Click Edit with Domain Designer. If you are working with a virtual data source and thedatabase schema used by the original Domain is not available in the data source, you are asked ifyou want to select a schema. Select Yes to select one or more schemas and click OK; the firstschema you select is added to the name of the tables in the Domain. Select No to remove allschema prefixes from the tables in the Domain.
10. Click Submit to update the Domain. To close the Domain Designer without modifying theDomain stored in the repository, click Cancel.
As mentioned above, in some cases, derived tables and calculated fields will be missing. You may alsosee invalid tables. You can work with the copy of your original Domain and its exported design file todetermine the modifications you need to make to fully restore your domain. For more information, you
284

Chapter 8 Advanced Domain Features
can export the design file of the modified Domain, as described in “Exporting the Design File from aDomain” on page 242, and compare it to the design file of the original Domain.
285

JasperReports Server User Guide
286
A
access grantsand scheduled reports 58Domain column-level 274Domain row level 272effect of grants 120, 269
Ad Hoc Editordefining filters in 105display mode 79exporting options 79how to use 72interaction with filters and input controls 105opening 72page options 79panels 72round function for custom fields 104saving views 79sources 73support for calculated (custom) fields 102tool bar 78
Ad Hoc View panelabout 78Layout Band 79
Ad Hoc viewsdecimal place support for 104laying out 74localizing 118saving 79
add function 103Add Resource 125adding a design file as a new Domain 258adding filters to advanced expressions 109adding reports 133advanced expression, editing 109advanced filters, editing 109alphabetical ascending 98, 100alternate group 79Always prompt 112AND 107area chart 91auto-refresh interval in dashboards 31available content 25
B
bar chart 91basic functions 103Boolean operators in Domains 47
C
calculated fields 102cascading input controls 57, 152CGP 104chart reports
and dashboards 34display options 91levels 87pivoting 89
INDEX
287
JasperReports Server User Guide
sample Topic 90, 92slider 87theme for 237types of charts 86, 91unique features 90, 92
chart views, compared with tables and crosstabs 74charts
Flash 51HTML5 50
Charts Pro 51collapse members 98column-level security in Domains 274column chart 91columns
conditional formatting 43formatting 42percent of column group parent 104show/hide 39
complex expressions 264conditional formatting 43constant calculated field 252controls. See input controls. 138count all 98Create menu, dashboard 13creating
dashboards 25, 34Domain security files 269Domain Topics 119reports 41, 119-120, 123, 133
creating reportsfrom the Ad Hoc Editor 80from the Home page 13
crosstab reportsand dashboards 34collapse members 98column group parent 104exclude 97expand group 98expand members 98keep only 97percent of group 104pivoting 97row group parent 104sample size 78sample Topic 96setting data formats 98
sorting 98, 100switch to column group 90, 97switch to row group 90, 97unique features 96
crosstab views, compared with tables and charts 77custom fields
add 103basic functions 103date functions 103default name 104divide 103multiply 103operators 103overview 102percent of group parent 103percent of total 103rank 103renaming 104round 103special functions 103subtract 103swap fields 103
custom URL in dashboards 25, 30
D
dashboardsadding content 26adding custom URLs 25adding logos 25area 26auto-refresh interval 31available items 25buttons 25containing other dashboards 36content deleted from repository 36creating 25, 34custom URLs in 30deleting content 32design considerations 34designer 26editing 28, 34embedded 36exceed area 26HTTP v. FILE protocol 30input controls for 28, 34-35limitations 35
288
Index
mapping input controls to URLs 31multiple selection 35opening 28overview 25parameters 35previewing 32refining the layout 32reports for 34screen size 33special content 33SuperMart dashboard 24title 32viewing 24working with 23, 35
Data Chooser wizard 113, 120-121data formats 98Data page 113Data Snapshots 40Data Source Selection panel, about 78data sources, access grants, and scheduled reports 58datatypes 139, 141date functions 103defaults, input controls 53, 56, 139dependent reports 81design files
adding as a new Domain 258editing 244exporting 242filters 259itemGroups element 245items element 245joins 249Oracle schema name 243resources element 245schema element 245schemaLocation attribute 245See also Domains.[design files
aaa] 242structure 244, 258uploading edited file 258version attribute 245xmlns attribute 245XSD 243
display mode 79distinct count 98divide function 103
Domain Designer wizard 179, 181, 189, 192Domain Expression Language. See DomEL. 259Domain plug-in
input controls 234parametrized queries 234using in iReport 233
Domain Topicsediting 121effect of access grants 120, 269saving 119
Domainsaccess grants and scheduled reports 58Boolean comparison operators 47defined 175design file 241designing a Domain 179, 189, 211Domain plug-in for iReport 222, 233DomEL 259editing 213effect of access grants 120, 269exporting designs to XML files 242filters 47, 265Groovy 270input controls 234item sets 187, 196joins 183, 194, 207locale bundles 277localization 277placeholders 216presentation and physical layers 270principal expressions 270profile attributes 263-264properties files 277referential integrity 215samples 178saving as Topics. See Domain Topics. 119See also design files. [Domains
aaa] 244Simple Domain 178SuperMart Domain 178typical uses 175using a Domain for a report 113using a virtual data source 189
DomEL 259dynamic filters 105
289
JasperReports Server User Guide
E
Editing advanced expressions 109editing, dashboard 28Event Details page 69expand members 98exporting Domain designs to XML design files 242external resources 136
F
fieldsOrganization 11Search 16
FILE protocol 30filters
columns 39compared to input controls 105filtering items in Domains 47in Domain plug-in 234in Domains 265in repository searches 16in the Ad Hoc Editor 105, 111in the Report Viewer 39in Topics 105reports with 54settings 18types 18using 106
Filters panel, about 80fixed sizing 33Flash charts 51folders
Dashboards 24moving 20-21repository 230
formats for report output 49formatting
columns 39, 42conditional 43
Fusion 51
G
Getting Started pagefor administrators 14for end users 12icons 13
return button 14Groovy 263, 270groups
expanding and collapsing 98pivoting and switching 79
H
help 14hide scroll bars 27hiding detail rows 86HTML5 50
I
IDsorganization 12sample user IDs 11
input controlsadding 138Always prompt option 149and dashboards 25, 28and parametrized queries 105cascading 57, 152check box type 143compared to filters 105dashboards 35date type 145default values 53, 56, 139, 149design tips 34display differences in dashboards 35drop-down type 144in reports run from Domain plug-in 234in the Ad Hoc Editor 79, 105in the Report Viewer 39limitations 35list type 144localizing 29mapped to custom URLs 31, 35Optional JSP Location option 149pop-up page 54query type 146reports with 54reuse of 35running a report with 53text 140types 138using 110
290
Index
Visible property 149installing JasperReports Server plug-in 222iReport
adding resources 230connecting to JasperServer 222creating JRXML file in 123designer 123Domain plug-in 222, 233JRXML files 232repository 223, 232running reports in 233
item sets 187, 196itemGroups element in design files 244-245items element in design files 245
J
JAR files 133, 136, 238JasperReport wizard
Controls & Resources 126, 134-135, 149, 153Data Source 118, 129, 150edit report unit 153Query 129, 132Set Up 118, 125-126, 134
Jaspersoft OLAP prerequisites 9Jobs List page 63jobs. See scheduling reports. 59joins
in Domains 183, 194, 207security 270
JRXML filesand Domain Topics 120and Topics 117external resources 136field names in 118, 154in iReport 232suggested file resources 126to create a new report 125, 133uploading 125validating in iReport 125
L
Layout Band 79layouts of views 74Library menu 13Library page
Created Date column 15
Modified Date column 15line chart 91locale bundles 277locales
expressions 154in Ad Hoc views 118showing 11
localization of Domains 277Locate File Resource page 128Locate Query page 130logging in
multiple organizations 12passwords 11with the default administrator login 11
M
Maps Pro 51menus
Create 13View 13
messages about system events 69Messages page 69Microsoft SQL Server Analytical Services 101Microsoft SSAS 101multi-level slider. See slider. 87multi-tenant server 12multiple organizations, logging in with 12multiple v. single controls in dashboard 25multiply function 103
N
NOT 107numeric ascending and descending 98, 100
O
OLAPcharts 87crosstabs 99
online help 14operators, boolean operators 107options for output 61OR 107Oracle
choosing schemas 180, 191, 197, 199-200, 202NVARCHAR2 202schema name in design file 243
291
JasperReports Server User Guide
synonyms 202output options, setting 61
P
parametrized queriesadding input controls 138and dashboards 31dashboards 35in reports run from Domain plug-in 234in the Ad Hoc Editor 79, 105running a report with parametrized queries 53See also filters. [parametrized queries
aaa] 105passwords 11percent of group parent functions 103-104percent of total function 103physical layer 270pie chart 91pivoting 79, 89, 97placeholders 216plug-ins
Domain 222, 233JasperReports Server 222
PostgreSQL, choosing schemas 180, 191, 202pre-filtering items in Domains 47prerequisites for Jaspersoft OLAP 9presentation layer 270preview 26principal expressions 270print view 25profile attributes 263properties, in locale bundles 277proportional sizing 33protocols, HTTP v. FILE 30
Q
queriesviewing SQL query in Ad Hoc Editor 80viewing the MDX query in the Ad Hoc
Editor 101query resource 130
R
rank function 103recurrence
calendar recurrence 66
simple recurrence 65types 59
redo 39, 79referential integrity 215Removing filters from advanced expressions 109report schedules, changing 64report units
adding to server 125complex 132overview 124saving 132
Report Viewer 54about 37Data Snapshots 40exporting 38saving reports 38toolbar 37
reportsadding 133attaching files 62changing schedules 64chart layout and formatting options 90, 92creating 72, 119-120, 123, 133creating from an Ad Hoc view 81crosstab layout and formatting options 96crosstab vs. table and chart 113dependent 81design 21designing in the Ad Hoc Editor 72effect of access grants 58, 120, 269empty 62exporting report output 49filters in 54Flash-enabled 51input controls in 54job schedules, changing 64localization 154output options 61report output 49running 40, 67, 233sample size 78saving 150saving in the Report Viewer 38saving report output 49scheduling 58
292
Index
See also scheduling reports and running reports.[reports
aaa] 58setting data formats 98simple 125sorting 84, 98, 100submitting 132summarizing rows and columns 78table vs. crosstab and chart 113types 72unit 124with input controls 53
repositoryadding reports directly 123browsing 16folders 21in iReport 223, 232list of reports 64overview 14panel 20resources 20searching 16system messages 69viewing 16
reset 25, 29resolution 33resource access permission 20resources
adding to iReport 230and Ad Hoc views 118and localizations 154bundles 157moving folders 21repository 20
resources element in design files 244-245RGP 104round function 103row-level security in Domains 272rows, percent of row group parent 104running reports
example 40, 53Flash charts 51from iReport 233in the Ad Hoc Editor 81in the background 67on a schedule 59
See also reports and scheduling reports. [runningreports
aaa] 59
S
sample Domains 178sample files
AllAccounts.jrxml 125for JasperReports 21logo.jpg 125SalesByMonth.jrxml 134SalesByMonthDetail.jrxml 135
sample reportsAccounts 41Freight 54library 21SalesByMonth 134
sample size 78sample Topics
foodmart data for crosstab 96Simple Domain Topic 178
sample user IDs 11samples
about 22locating 22
Save Topic page 121saving reports 150Scheduler wizard 59, 63scheduling
jobs 59reports 59wizard 59
scheduling reportsaccess grants and scheduled reports 58defining a job 59defining schedules 58editing a job 64recurrence 65See also reports and running reports. [scheduling
reportsaaa] 59
stopping 64viewing job schedules 63
schema element in design files 244-245schemaLocation attribute in design files 245
293
JasperReports Server User Guide
schemas. See design files. [schemasaaa] 242
screen sizes 33search field 17Search Results page 16searches
default settings 17filtering 17refining 18settings 17
searchingfilters 16repository 16
security filescolumn-level security 274effect of access grants 120filters 259principal expressions 270row-level security 272structure 269
servers, multi-tenant 12Set Up the Job pages 59Set Up the Report page 134Set Up the Report Page 125show scroll bars 27showing detail rows 86Simple Domain Topic 178single v. multiple controls in dashboard 25slice 97slider 87sorting
reports 39sorting reports 84, 98, 100sorting views 79spacer 84special content in dashboards 25, 29special functions 103SSAS 101standard controls in dashboards 25submit 25, 29submitting reports 132subtract function 103SuperMart 24switch to column group 90, 97switch to row group 90, 97switching groups 79
T
table reportsand dashboards 34compared with crosstab and chart 113hiding detail rows 86showing detail rows 86sorting 84spacer 84
table viewsdesigning layouts 74sorting 79
table views, compared with charts and crosstabs 74testProfileAttribute 263-264text label 25themes, for charts 237tool bar 78Topics
access grants and scheduled reports 58as JRXML files 117, 120creating 117defined 117field names in 118JRXML files 120localization 118parametrized queries 105saving Domains as Topics. See Domain
Topics. 119See also Domain Topics. [Topics
aaa] 119Simple Domain Topic 178uploading 117
Topics and Domains page 113
U
undo 38, 79uploading edited design files 258URLs in dashboards 30user IDs
logging in 11sample 11
utilitiesiReport 222messages 69
V
version attribute in design files 245
294
Index
View menucontents 13Repository 16Search Results 16
viewingdashboards 24fields and data in a Domain Topic 120repository 16scheduled reports 58
viewing the SQL query 80views
designing layouts 74types 74
virtual data sourcecreating a Domain 189
W
Widgets Pro 51wizards
Data Chooser 113, 120-121Domain Designer 181, 192Domain Designer, edit Domain 121JasperReport. See JasperReport wizard. 125report scheduler 58Scheduler 59, 63
X
XML Domain design files 242xmlns attribute in design files 245XSD of Domain design file 243
295

Index
296