c British Computer Society 2002 Java for On-line Distributed Monitoring of Heterogeneous Systems and Services PAOLO BELLAVISTA 1 ,ANTONIO CORRADI 1 AND CESARE STEFANELLI 2 1 Dipartimento di Elettronica, Informatica e Sistemistica, Universit` a di Bologna, Viale Risorgimento, 2, Bologna, Italy 2 Dipartimento di Ingegneria, Universit` a di Ferrara, Via Saragat, 1, Ferrara, Italy Email: [email protected]The control and management of Web-based service quality require the extension of the Internet infrastructure with monitoring functions to ascertain dynamically the state of networked resources. We describe the design and implementation of the Monitoring Application Programming Interface (MAPI), a Java-based tool for the on-line monitoring of Internet heterogeneous resources, which provides monitoring indicators at different levels of abstraction. At the application level, it instruments the Java Virtual Machine (JVM) to notify several different types of events triggered during the execution of Java applications, e.g. object allocation and method calls. At the kernel level, MAPI inspects system-specific information generally hidden by the JVM, e.g. CPU usage and incoming network packets, by integrating with Simple Network Management Protocol agents and platform-dependent monitoring modules. MAPI is the core part of a portable tool for distributed monitoring, control and management in the Internet environment. The tool is implemented in terms of mobile agents that move close to the monitored resources to enforce distributed management policies autonomously, with a significant reduction in both reaction time and traffic overhead. Received 1 November 2001; revised 22 April 2002 1. INTRODUCTION The Internet is becoming an open and global distributed system for service provision to an increasing number of users, interconnected by very different and heterogeneous devices, e.g. PCs, personal digital assistants and even cellular phones [1]. In addition, the enlarging market of multimedia Web services and the competition among service providers stress some innovative service properties that providers, network operators and final customers tend to consider more and more important. One of these properties is the quality of service (QoS), i.e. the ability to control, manage and possibly guarantee negotiated service levels independently of the dynamic conditions of resources in the involved networks and systems [2]. The providers offering services with differentiated QoS levels are interested in accounting users for their real resource consumption and in enforcing the desired billing policies effectively. In the untrusted Internet environment, another crucial service property is security, which permits one to identify and face all forms of misuse and attack, such as denial-of-service obtained by overloading resources to produce unavailability. In the last few years, several research efforts have introduced ad hoc protocols for QoS management at the network layer [3]. These solutions achieved interesting and effective results when applied to limited networks, but their approach clashes with the best-effort model of the Internet. They require any intermediate router traversed by service packet flows to implement the specific protocol, which is likely to pass through a long process of acceptance and diffusion. As a general consideration, network-layer solutions work at a level of abstraction that makes it difficult to embed some functions which are recognized as fundamental in the state-of-the-art of Internet service provisioning, such as application-specific adaptation and secure billing. Therefore, in order to integrate some forms of QoS differentiation/control with the standard best-effort Internet model, the service infrastructure should be informed of the current usage of heterogeneous resources at runtime. In other words, the service infrastructure should include an on-line monitoring tool able to detect the current condition of network, system and application components during execution. This is necessary to enable dynamic service management via runtime corrective operations. The monitoring information needed in QoS management covers different abstraction levels, from system conditions at each node (the usage of CPU, memory, bandwidth, etc.), called the kernel state in the following, to the state of application-level service components (the state of a service- specific daemon process, etc.), sometimes referred to as the application state [4]. In addition, the on-line requirement makes a short response time critical as well as the need to THE COMPUTER J OURNAL, Vol. 45, No. 6, 2002
Java for On-line DistributedMonitoring of Heterogeneous
Systems and ServicesPAOLO BELLAVISTA1 , ANTONIO CORRADI1 AND CESARE STEFANELLI2
1Dipartimento di Elettronica, Informatica e Sistemistica, Universita di Bologna, Viale Risorgimento, 2,Bologna, Italy
2Dipartimento di Ingegneria, Universita di Ferrara, Via Saragat, 1, Ferrara, ItalyEmail: [email protected]
The control and management of Web-based service quality require the extension of the Internetinfrastructure with monitoring functions to ascertain dynamically the state of networked resources.We describe the design and implementation of the Monitoring Application Programming Interface(MAPI), a Java-based tool for the on-line monitoring of Internet heterogeneous resources, whichprovides monitoring indicators at different levels of abstraction. At the application level, itinstruments the Java Virtual Machine (JVM) to notify several different types of events triggeredduring the execution of Java applications, e.g. object allocation and method calls. At the kernellevel, MAPI inspects system-specific information generally hidden by the JVM, e.g. CPU usage andincoming network packets, by integrating with Simple Network Management Protocol agents andplatform-dependent monitoring modules. MAPI is the core part of a portable tool for distributedmonitoring, control and management in the Internet environment. The tool is implemented in termsof mobile agents that move close to the monitored resources to enforce distributed management
policies autonomously, with a significant reduction in both reaction time and traffic overhead.
Received 1 November 2001; revised 22 April 2002
1. INTRODUCTION
The Internet is becoming an open and global distributedsystem for service provision to an increasing number ofusers, interconnected by very different and heterogeneousdevices, e.g. PCs, personal digital assistants and evencellular phones [1]. In addition, the enlarging marketof multimedia Web services and the competition amongservice providers stress some innovative service propertiesthat providers, network operators and final customers tend toconsider more and more important. One of these propertiesis the quality of service (QoS), i.e. the ability to control,manage and possibly guarantee negotiated service levelsindependently of the dynamic conditions of resources in theinvolved networks and systems [2]. The providers offeringservices with differentiated QoS levels are interested inaccounting users for their real resource consumption andin enforcing the desired billing policies effectively. Inthe untrusted Internet environment, another crucial serviceproperty is security, which permits one to identify and faceall forms of misuse and attack, such as denial-of-serviceobtained by overloading resources to produce unavailability.
In the last few years, several research efforts haveintroduced ad hoc protocols for QoS management at thenetwork layer [3]. These solutions achieved interestingand effective results when applied to limited networks, but
their approach clashes with the best-effort model of theInternet. They require any intermediate router traversedby service packet flows to implement the specific protocol,which is likely to pass through a long process of acceptanceand diffusion. As a general consideration, network-layersolutions work at a level of abstraction that makes itdifficult to embed some functions which are recognizedas fundamental in the state-of-the-art of Internet serviceprovisioning, such as application-specific adaptation andsecure billing. Therefore, in order to integrate some formsof QoS differentiation/control with the standard best-effortInternet model, the service infrastructure should be informedof the current usage of heterogeneous resources at runtime.In other words, the service infrastructure should include anon-line monitoring tool able to detect the current conditionof network, system and application components duringexecution. This is necessary to enable dynamic servicemanagement via runtime corrective operations.
The monitoring information needed in QoS managementcovers different abstraction levels, from system conditionsat each node (the usage of CPU, memory, bandwidth, etc.),called the kernel state in the following, to the state ofapplication-level service components (the state of a service-specific daemon process, etc.), sometimes referred to as theapplication state [4]. In addition, the on-line requirementmakes a short response time critical as well as the need to
THE COMPUTER JOURNAL, Vol. 45, No. 6, 2002
596 P. BELLAVISTA, A. CORRADI AND C. STEFANELLI
reduce the overhead in the observed target, thus forcing oneto collect only a restricted set of kernel and application stateindicators.
This paper presents the design of a Java-based MonitoringApplication Programming Interface (MAPI) for the on-linemonitoring of Web services. MAPI overcomes Internetplatform heterogeneity and permits one to observe the stateof systems/applications during execution. MAPI collectsmonitoring data at the different levels of abstraction asrequired. At the application level, it dynamically interactswith the Java Virtual Machine (JVM) to gather detailedinformation about the execution of Java-based services.At the kernel level, it enables access to system indicatorsat the monitored target (either Java-based or external tothe JVM), such as CPU and memory usage of all activeprocesses.
To overcome the transparency imposed by the JVM,MAPI exploits some recent extensions of the Javatechnology: the JVM Profiler Interface (JVMPI) [5] and theJava Native Interface (JNI) [6]. In addition, MAPI integrateswith external standard monitoring entities, particularly thosediffused in the network management domain, i.e. SimpleNetwork Management Protocol (SNMP) agents [7]. JVMPImakes it possible to instrument dynamically the JVM fordebugging and monitoring purposes, and MAPI exploits it tocollect, filter and analyze application-level events producedby Java applications, e.g. object allocation and methodinvocation. At the kernel level, MAPI collects system-dependent monitoring data, e.g. CPU usage and incomingnetwork packets, by interrogating SNMP agents that exportlocal monitoring data via their standard managementinformation base (MIB). To also enable the monitoring ofhosts without any SNMP agent in execution, MAPI exploitsJNI to integrate with platform-dependent monitoringmechanisms, which we have currently implemented for theWindows NT, Solaris and Linux platforms.
We claim that on-line monitoring components play acentral role in any distributed infrastructure for QoS-enabledservice provision in the Internet environment, to achievedynamic service adaptation, to enhance global performance,to charge subscribed users for accessed services and to detectpossible denial-of-service attacks. This is the reason whywe have included the MAPI tool as a core component of aJava-based distributed middleware, called Secure and OpenMobile Agent3 (SOMA), for the design, implementation anddeployment of Internet services. We have also implementeda MAPI-based distributed monitoring tool in terms ofSOMA Mobile Agents that cooperate to enforce distributedmanagement policies. Monitoring agents can migrate closeto the networked resources to observe and manage them au-tonomously on behalf of system administrators, with a sig-nificant reduction in both reaction time and traffic overhead.
The paper also reports measurements of the overheadintroduced by the local MAPI component and the MAPI-based distributed tool. The monitoring overhead depends
3SOMA, MAPI and the MAPI-based distributed monitoring tool areavailable at http://lia.deis.unibo.it/Research/SOMA/.
mainly on the level of detail of monitored indicators andon the time interval for their update. The overhead can betuned dynamically by service administrators in response toservice-/system-specific runtime conditions, and has beenshown to be acceptable for most classes of Web services,with good scalability results if compared with traditionalSNMP-based centralized solutions.
2. JAVA TECHNOLOGIES FOR MONITORING
The Java technology plays a fundamental role in the design,implementation and deployment of Web services over theInternet infrastructure. Apart from Java portability, dynamicclass loading and easy integration with the Web, the mainmotivation of Java diffusion is its virtual machine that hidesthe local operating system and presents a uniform vision ofall available computing resources and middleware facilities.
However, the monitoring perspective requires a completeand low-level visibility of both JVM internals andunderlying platforms. At the application level, theMAPI monitoring component exploits JVMPI to acquirevisibility of the JVM internal events. At the kernel level,MAPI employs modules external to the JVM, to gatherinformation about platform-dependent resources and non-Java application components. In MAPI, these externalmodules include both native monitoring mechanismsintegrated via JNI and standard monitoring components,i.e. SNMP agents. In the following, the paper brieflydescribes the JVMPI and JNI technologies, to provide theneeded background for the full understanding of the MAPIdesign and implementation.
2.1. The JVMPI
JVMPI is an experimental API of the Java 2 platform,mainly designed to help developers in monitoring Java-based applications during debugging, without imposingany modification in the application code. JVMPI is aninterface between the JVM and a dedicated profiler agent,often implemented as a platform-dependent native libraryfor the sake of performance. In one direction, the JVMnotifies several VM-internal events to the profiler agent; inthe other direction, the profiler agent can enable/disable thenotification of specific types of events and can perform somelimited management actions on the JVM.
With a finer degree of detail, several JVM conditionstrigger JVMPI events: Java thread state change (start, end,when blocking on a locked monitor); beginning/endingof invoked methods; class loading operations; objectallocation/deallocation; beginning/ending of the JVMgarbage collection. In addition, the profiler agent can useJVMPI to modify dynamically the behavior of monitoredapplications. Apart from notification enabling/disabling, theagent can intervene on the JVM by invoking a very smallset of JVMPI methods: management actions are limited tosuspend/resume Java threads and to enable/disable/force theimmediate execution of the JVM garbage collector.
The SUN distribution provides a simple implementationof the profiler agent for both Solaris and Windows NT
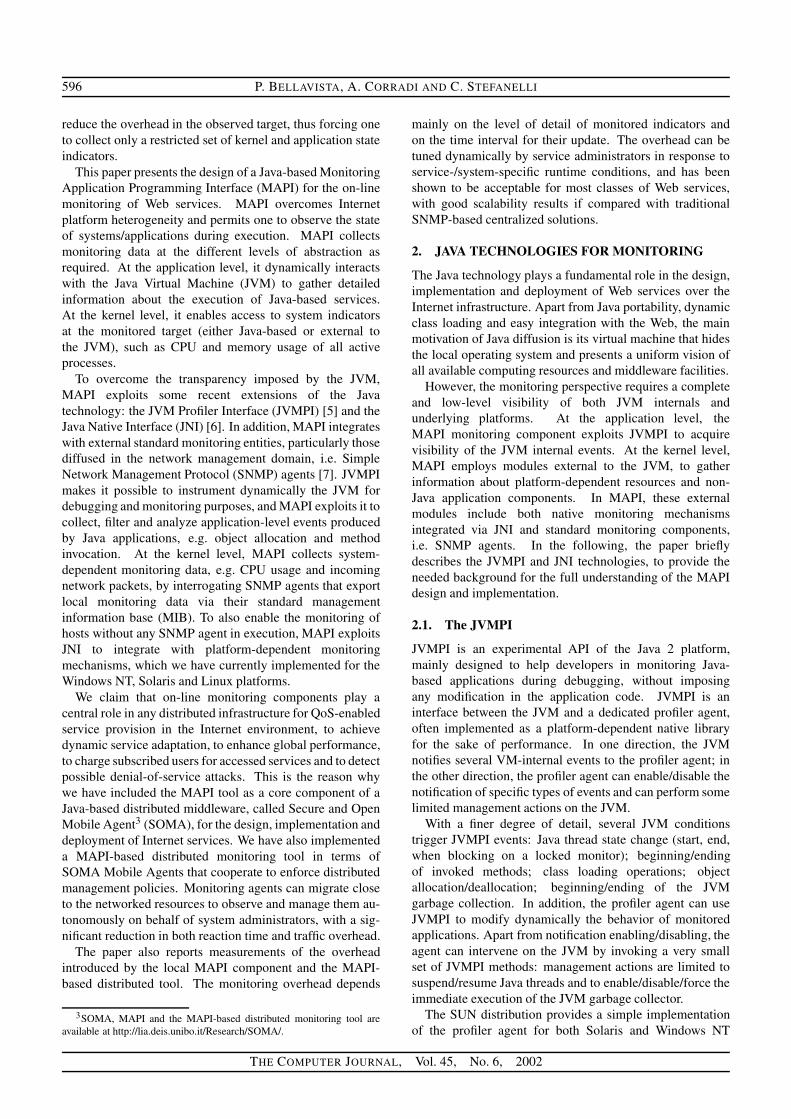
FIGURE 1. The architecture of the Java-based portable MAPI.
operating systems. This agent, called HPROF [5], collectsgeneral-purpose events and allows simple static configura-tions. It is not designed for on-line monitoring, but worksmainly as an off-line post-mortem tool for debugging andperformance analysis. In fact, it tends to collect a largevolume of monitoring data that requires heavy filtering andprocessing to obtain significant and concise service indica-tors. For this reason, some researchers have implementedtheir ad hoc profiler processes to organize HPROF data inimmediately readable graphic interfaces [8, 9].
2.2. The JNI
JNI permits Java threads to invoke native methods,i.e. platform-specific functions typically written in C/C++,usually available as Dynamic Link Libraries (DLL) in theWindows platform and shared object (SO) libraries underSolaris and Linux.
JNI is a two-way interface. In one direction, a Javaprogram can invoke a native method, by declaring themethod with the keyword native and with no body, and bybinding to the native method library including the requestedfunction. JNI specifies the details of method invocation: forinstance, it rules the parameter marshalling/unmarshallingbetween the Java invoking thread and the invoked nativemethod. In the other direction, from the native librarytowards the JVM, JNI allows native methods to interact withtheir invoking Java framework. JNI permits native code tocallback the Java environment and the invoking Java object,to access and modify object values, to call methods and toraise Java exceptions.
With regard to monitoring, MAPI exploits JNI to integratewith native monitoring libraries, in order to obtain the
visibility of kernel and application indicators not accessiblevia JVMPI. For instance, MAPI collects information aboutprocess CPU usage by invoking the execution of C-basednative libraries that extract the monitoring informationdifferently depending on the monitored target, from eitherthe Windows NT registry or the Solaris /proc directory.
3. THE MAPI COMPONENT FOR ON-LINEHETEROGENEOUS MONITORING
When dealing with the best-effort Internet, QoS controland adaptation require the capacity to monitor the level ofquality offered by service components. Service componentsoperate in an open and global distributed system, whichis intrinsically heterogeneous, and often include legacyelements that cannot be modified/instrumented for mon-itoring purposes [2, 3, 10]. In addition, the adaptationof Web-service quality requires monitoring informationto be available at runtime without imposing any servicesuspension.
This section presents the MAPI architecture and interface.MAPI permits the on-line monitoring of kernel/applicationresources independently of possible heterogeneity in theirplatform implementation. Figure 1 shows that theMAPI interface is implemented by the ResourceManagerclass, which integrates three different components: theMAPI Profiler Agent, the MAPI SNMP Agent and theMAPI*ResManager (MAPI NT ResManager for Windows,MAPI SVR4 ResManager for Solaris, etc.). MAPI is the coreportable component of the distributed monitoring frameworkdescribed in Section 5.
The MAPI Profiler Agent is able to gather application-level information about the Java environment of the
THE COMPUTER JOURNAL, Vol. 45, No. 6, 2002
598 P. BELLAVISTA, A. CORRADI AND C. STEFANELLI
FIGURE 2. The ResourceManager interface.
monitored target. It not only collects JVMPI eventsbut also filters and processes them on-line, to offerconcise monitoring indicators during service execution.These JVMPI-based monitoring functions are immediatelyportable on any host that runs the JVM version 2.
According to the SNMP terminology, the MAPI SNMPAgent acts as an SNMP manager that interrogates thestandard SNMP agent available on its local target to obtainkernel-level monitoring data. The MAPI SNMP Agent notonly provides a uniform Java interface by wrapping possiblynon-Java SNMP agents. It also implements several localoptimizations of the SNMP protocol, as described in thefollowing. In addition, it simplifies the configuration of thesecurity parameters needed in SNMPv3, by integrating withthe SOMA distributed security infrastructure [11].
To be portable even in the case when the monitoredtargets do not host the execution of suitable SNMP agents,
ResourceManager exploits the MAPI*ResManager classesto integrate with platform-dependent monitoring functionsvia JNI. These functions are implemented as native librarieswith uniform interfaces for different platforms (MAPIWindowsRM DLL on Microsoft Windows NT 4.0, MAPISolarisRM SO on SUN Solaris 7 and MAPI LinuxRM SOon SuSE Linux 6.2). ResourceManager achieves portabilityby sensing dynamically the implementation platform of thecurrent monitored target and by consequently loading atruntime the specific native library.
Figure 2 shows the MAPI set of methods that pro-vide concise monitoring parameters to summarize thecurrent state of the monitored target. MAPI has beendesigned and implemented to enable service administrators(or autonomous software-based service managers) to obtainkernel/application resource state for on-line service manage-ment and adaptation. In this scenario, the overhead is critical
THE COMPUTER JOURNAL, Vol. 45, No. 6, 2002
ON-LINE DISTRIBUTED MONITORING IN JAVA 599
and monitoring results should be prompt and immediatelyavailable to managers (see Section 7). For this reason, MAPIcan tune its intrusion to service-specific time constraints:all MAPI methods have a msec invocation parameter thatindicates the time interval to update the statistics of collectedJVMPI events, to interrogate SNMP agents and to invokenative monitoring libraries.
MAPI methods return either an object or an array ofobjects of the three classes ProcessInfo, Network-Info and FileSystemInfo described in Figure 2.The ProcessInfo object maintains all the data related tothe current pid process. Monitored data include the CPUusage (percentage and total time) for any specified process,its allocated memory (physical and virtual) and miscella-neous information on its composing threads. In addition,in the case of JVM threads, MAPI maintains the referenceto the Java thread object, its lifetime and the number ofloaded classes, used monitors, allocated objects, invokedmethods and network and file system operations. For non-Java threads, MAPI provides the thread identifier and thepercentage/effective time of CPU usage.
The NetworkInfo class reports aggregated monitoringdata about the usage of the communication infrastructure onthe target host. Monitored data include the total numberof sent/received UDP/IP packets, TCP connections andsent/received segments, the percentage of UDP/IP packetsreceived with errors and the percentage of discarded UDP/IPoutput packets. These parameters are sufficient to givean overall evaluation of the host traffic conditions and toidentify congestion situations.
Finally, the FileSystemInfo class maintains generalinformation about the file system of the target (disk freespace and its percentage on total size) and detailed dataabout currently opened files. In particular, for any activeprocess and for any file opened in the current session,the class returns the opening time and its opening mode(read/write/both/locked).
4. THE MAPI IMPLEMENTATION
We have implemented MAPI to be the portable corecomponent of an on-line distributed monitoring tool forthe open Internet infrastructure. On the one hand, thisimposes the need to achieve complete portability over themost diffused heterogeneous platforms, with the definiteimplementation constraint of not modifying the standardJVM. On the other hand, Internet openness and dynamicitycall for the possibility of monitoring service componentswithout requiring any intervention in either their sourcecode or their executables. The respect of this furtherimplementation constraint makes MAPI a completelyoriginal contribution in the Java-based monitoring arena, asdetailed further in Section 8.
MAPI has required the design and implementation ofseveral ad hoc modules: (1) the MAPI Profiler Agent fordynamically configurable on-line monitoring of the JVMstate; (2) the MAPI SNMP Agent to obtain monitoring datafrom SNMP agents in execution on the targets; (3) the
MAPI*ResManager and its native libraries (MAPI Win-dows/Solaris/Linux RM DLL/SO) for uniform data acquisi-tion via heterogeneous platform-dependent mechanisms.
4.1. The MAPI Profiler Agent
The SUN JVMPI components significantly constrain theprovision of monitoring information. Developers can onlyspecify whether the JVMPI supported events should benotified to the profiler agent, and the specification is coarse-grained, with no possibility of fine selection and dynamicrefinement. For instance, a profiler agent can only chooseto enable/disable all events related to all Java classes(or objects/methods/monitors), but it can neither focus onthe events generated by a specific class nor define user-/application-specific events.
The only way to obtain more fine-grained indicatorsis to implement ad hoc profiler agents, as our MAPIProfiler Agent, capable of filtering the events of interestand suitable for composing them in higher level indicators.In addition, the MAPI Profiler Agent gives the possibilityof changing the set of notifiable events with no suspensionof the monitoring execution, by implementing methods toenable/disable dynamically the event notification relatedto object allocation/deallocation, method invocation/exitand lock/unlock of Java monitors. Our profiler agentkeeps and updates statistics of the monitored events, toprovide immediately readable indicators without the need tomaintain huge logs of monitoring data. For instance, it tracesonly the size of the total memory allocated to a Java threadand does not log the full data related to the execution of anysystem call for memory allocation.
Figure 3 sketches a piece of the MAPI Profiler Agentcode. When a registered event occurs, JVMPI signalsan event ev to the profiler that performs event-specificactions. In particular, the figure shows the initializationsmade when the class SocketInputStream is loaded.After initializing the internal socketread variable,the profiler can trace any invocation of the methodsocketRead() by incrementing the stat->tcp readcounter, which maintains the account for the TCP readoperations of any Java thread in a specified time interval.These data represent a rough estimation of the incomingnetwork traffic produced by Java service components.If there is the need for more precise information about thetraffic due to specific Java threads, ResourceManager cancommand the profiler to examine dynamically the invocationparameters of the socketRead()/socketWrite()methods. This is possible via the JVMPI-based triggeringof JVMPI EVENT OBJECT DUMP of the required objects,at the maximum level of detail (JVMPI DUMP LEVEL 2).The MAPI Profiler Agent, of course, behaves differentlyat default to avoid the excessive overhead of the dynamicgeneration and processing of object dumps.
4.2. The MAPI SNMP Agent
The MAPI SNMP Agent refines and extends the SNMP com-ponent included in our MA-based MESIS framework for
FIGURE 3. Monitoring of the invocation of the socketRead() method in MAPI Profiler Agent.
network and service management [10]. It acts as an SNMPmanager that locally interrogates its co-located SNMP agent.The MAPI SNMP Agent is programmed to request monitor-ing information maintained not only in the standard MIB(monitoring data about network elements and protocols), butalso, where supported, in some Host Resources Groups MIBextensions, called Storage, Running Software and RunningSoftware Performance [12]. These groups provide the dataabout resource usage of processes currently in execution toobtain the MAPI ProcessInfo and FileSystemInfo,while NetworkInfo exploits the standard SNMP MIB.
The MAPI SNMP Agent significantly improves theefficiency of standard client/server SNMP operations,especially when dealing with the network transfer oflarge chunks of monitoring data. First, it transmitsonly the changed MAPI indicators to ResourceManager,which maintains old values for the non-received parameters.Most importantly, it locally interrogates its SNMP agentand pre-processes the obtained results to offer conciseindicators to possibly remote managers, thus significantlyreducing the generated network traffic. In fact, a single MIBvariable is usually at a lower level than the MAPI indicators,and an aggregation of multiple variables is required.These aggregations are known as health functions [13].For instance, the percentage of discarded IP output packetsis obtained by combining five MIB variables:
where ipOutDiscards, ipOutNoRoutes andipFragFails are the number of output IP datagramsdiscarded (for problems in buffer space, in routing and infragmentation, respectively), while ipOutRequests andipForwDatagrams are the total number of IP datagrams
transmitted (for locally generated packets and forwardedones, respectively) [7].
In addition, the MAPI SNMP Agent can perform all theoperations needed for the support of mutual authenticationin the case of interaction with SNMPv3 agents. It canobtain dynamically the needed security information fromthe public key infrastructure integrated with the SOMAprogramming framework [11, 14]. Finally, it can locallystore configuration parameters specific for its SNMP agent(e.g., the supported MIBs), in order to automate the possiblycomplex phase of initialization of the MAPI tool.
4.3. The MAPI*ResManager
To monitor target hosts not supporting either the SNMPagent or the Host Resources MIB extensions, MAPI alsointegrates native monitoring mechanisms. MAPI nativemodules extract uniform data by exploiting heterogeneousmonitoring mechanisms provided by the target operatingsystems. The ResourceManager class employs JNI toload the target-specific native library at runtime. We havecurrently implemented the native monitoring componentsfor Windows NT (MAPI WindowsRM DLL), Solaris (MAPISolarisRM SO) and Linux (MAPI LinuxRM SO), as depictedin Figure 1.
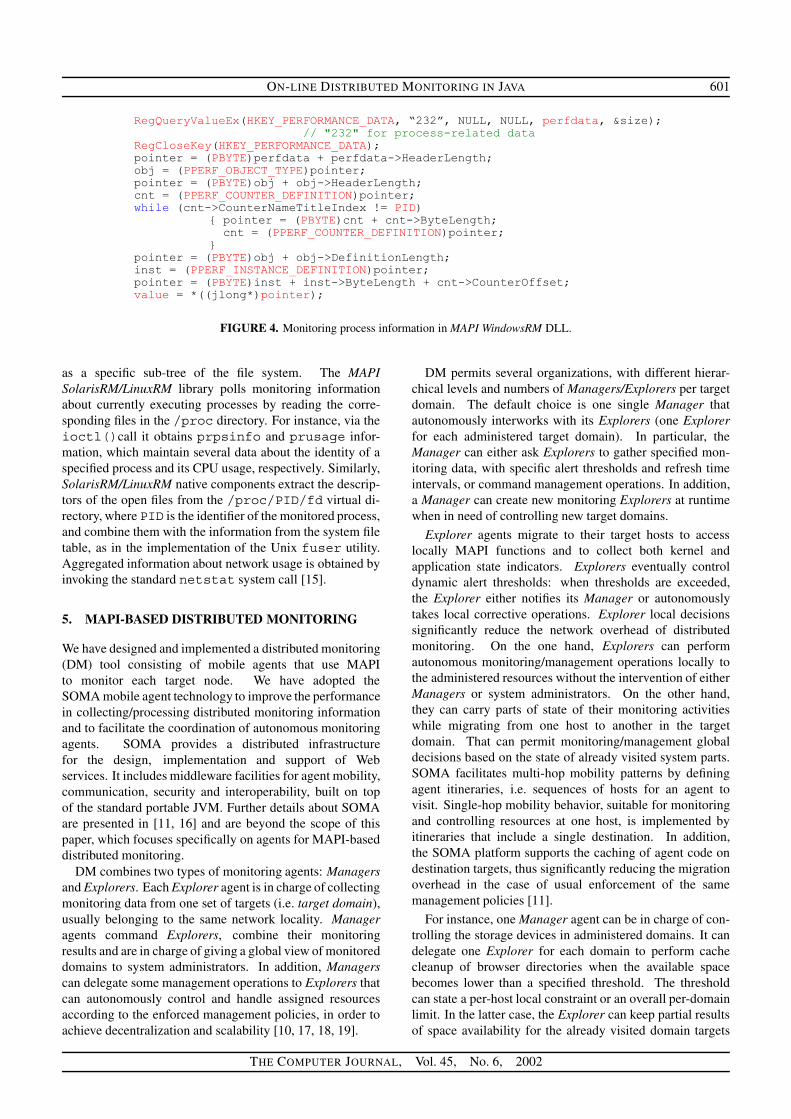
Figure 4 shows some lines of the MAPI WindowsRMDLL, which accesses kernel and application state indicatorsmaintained in Microsoft system registry keys. In particular,the figure reports the polling of the registry to obtain updatedinformation about the processes in execution. The systemcall RegQueryValueEx(HKEY PERFORMANCE DATA)returns a perfdata reference which is used as the baseto access the monitoring information about the process withidentifier PID.
For Solaris and Linux platforms, we have implementednative monitoring modules as dynamic SO libraries thatmainly exploit the /proc feature. /proc is a virtualdirectory that exports kernel/application state indicators
FIGURE 4. Monitoring process information in MAPI WindowsRM DLL.
as a specific sub-tree of the file system. The MAPISolarisRM/LinuxRM library polls monitoring informationabout currently executing processes by reading the corre-sponding files in the /proc directory. For instance, via theioctl()call it obtains prpsinfo and prusage infor-mation, which maintain several data about the identity of aspecified process and its CPU usage, respectively. Similarly,SolarisRM/LinuxRM native components extract the descrip-tors of the open files from the /proc/PID/fd virtual di-rectory, where PID is the identifier of the monitored process,and combine them with the information from the system filetable, as in the implementation of the Unix fuser utility.Aggregated information about network usage is obtained byinvoking the standard netstat system call [15].
5. MAPI-BASED DISTRIBUTED MONITORING
We have designed and implemented a distributed monitoring(DM) tool consisting of mobile agents that use MAPIto monitor each target node. We have adopted theSOMA mobile agent technology to improve the performancein collecting/processing distributed monitoring informationand to facilitate the coordination of autonomous monitoringagents. SOMA provides a distributed infrastructurefor the design, implementation and support of Webservices. It includes middleware facilities for agent mobility,communication, security and interoperability, built on topof the standard portable JVM. Further details about SOMAare presented in [11, 16] and are beyond the scope of thispaper, which focuses specifically on agents for MAPI-baseddistributed monitoring.
DM combines two types of monitoring agents: Managersand Explorers. Each Explorer agent is in charge of collectingmonitoring data from one set of targets (i.e. target domain),usually belonging to the same network locality. Manageragents command Explorers, combine their monitoringresults and are in charge of giving a global view of monitoreddomains to system administrators. In addition, Managerscan delegate some management operations to Explorers thatcan autonomously control and handle assigned resourcesaccording to the enforced management policies, in order toachieve decentralization and scalability [10, 17, 18, 19].
DM permits several organizations, with different hierar-chical levels and numbers of Managers/Explorers per targetdomain. The default choice is one single Manager thatautonomously interworks with its Explorers (one Explorerfor each administered target domain). In particular, theManager can either ask Explorers to gather specified mon-itoring data, with specific alert thresholds and refresh timeintervals, or command management operations. In addition,a Manager can create new monitoring Explorers at runtimewhen in need of controlling new target domains.
Explorer agents migrate to their target hosts to accesslocally MAPI functions and to collect both kernel andapplication state indicators. Explorers eventually controldynamic alert thresholds: when thresholds are exceeded,the Explorer either notifies its Manager or autonomouslytakes local corrective operations. Explorer local decisionssignificantly reduce the network overhead of distributedmonitoring. On the one hand, Explorers can performautonomous monitoring/management operations locally tothe administered resources without the intervention of eitherManagers or system administrators. On the other hand,they can carry parts of state of their monitoring activitieswhile migrating from one host to another in the targetdomain. That can permit monitoring/management globaldecisions based on the state of already visited system parts.SOMA facilitates multi-hop mobility patterns by definingagent itineraries, i.e. sequences of hosts for an agent tovisit. Single-hop mobility behavior, suitable for monitoringand controlling resources at one host, is implemented byitineraries that include a single destination. In addition,the SOMA platform supports the caching of agent code ondestination targets, thus significantly reducing the migrationoverhead in the case of usual enforcement of the samemanagement policies [11].
For instance, one Manager agent can be in charge of con-trolling the storage devices in administered domains. It candelegate one Explorer for each domain to perform cachecleanup of browser directories when the available spacebecomes lower than a specified threshold. The thresholdcan state a per-host local constraint or an overall per-domainlimit. In the latter case, the Explorer can keep partial resultsof space availability for the already visited domain targets
THE COMPUTER JOURNAL, Vol. 45, No. 6, 2002
602 P. BELLAVISTA, A. CORRADI AND C. STEFANELLI
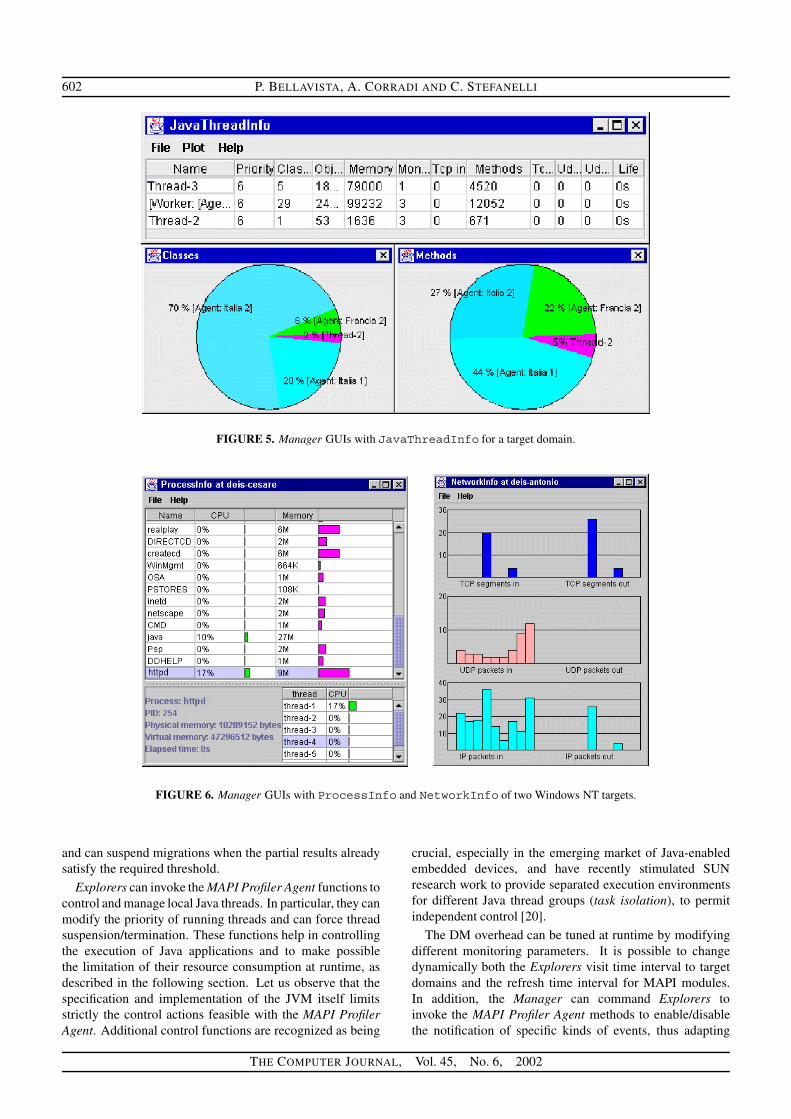
FIGURE 5. Manager GUIs with JavaThreadInfo for a target domain.
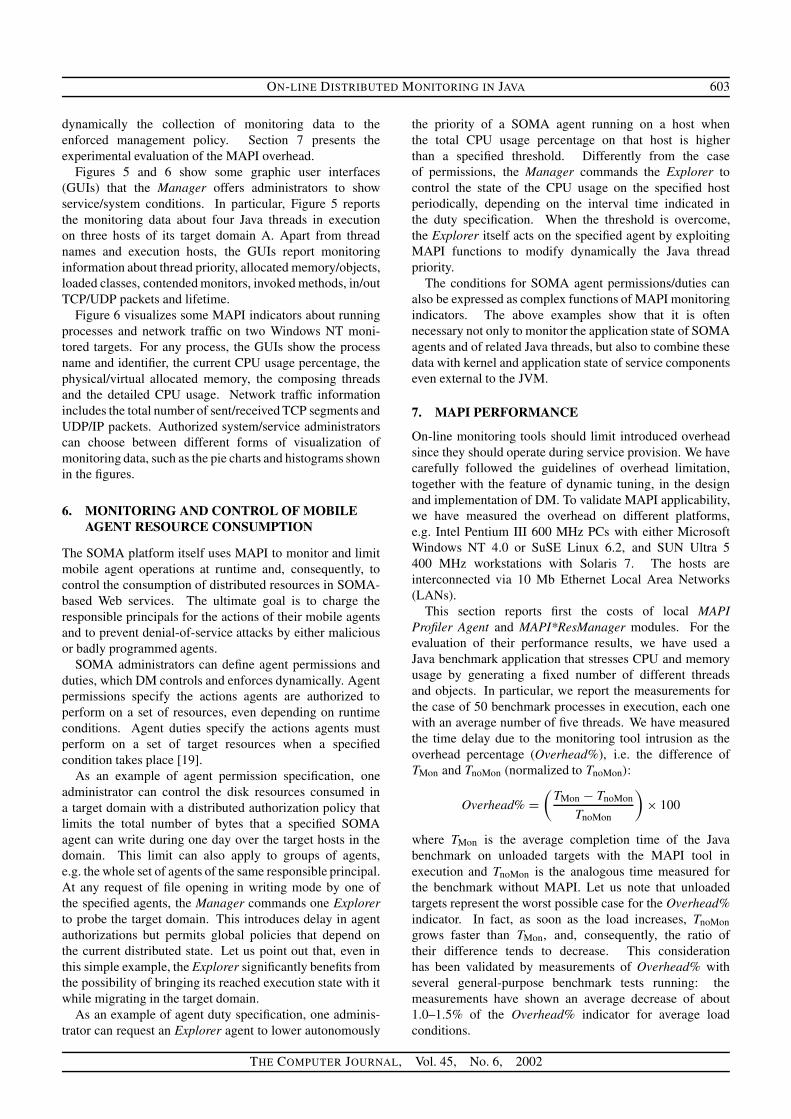
FIGURE 6. Manager GUIs with ProcessInfo and NetworkInfo of two Windows NT targets.
and can suspend migrations when the partial results alreadysatisfy the required threshold.
Explorers can invoke the MAPI Profiler Agent functions tocontrol and manage local Java threads. In particular, they canmodify the priority of running threads and can force threadsuspension/termination. These functions help in controllingthe execution of Java applications and to make possiblethe limitation of their resource consumption at runtime, asdescribed in the following section. Let us observe that thespecification and implementation of the JVM itself limitsstrictly the control actions feasible with the MAPI ProfilerAgent. Additional control functions are recognized as being
crucial, especially in the emerging market of Java-enabledembedded devices, and have recently stimulated SUNresearch work to provide separated execution environmentsfor different Java thread groups (task isolation), to permitindependent control [20].
The DM overhead can be tuned at runtime by modifyingdifferent monitoring parameters. It is possible to changedynamically both the Explorers visit time interval to targetdomains and the refresh time interval for MAPI modules.In addition, the Manager can command Explorers toinvoke the MAPI Profiler Agent methods to enable/disablethe notification of specific kinds of events, thus adapting
THE COMPUTER JOURNAL, Vol. 45, No. 6, 2002
ON-LINE DISTRIBUTED MONITORING IN JAVA 603
dynamically the collection of monitoring data to theenforced management policy. Section 7 presents theexperimental evaluation of the MAPI overhead.
Figures 5 and 6 show some graphic user interfaces(GUIs) that the Manager offers administrators to showservice/system conditions. In particular, Figure 5 reportsthe monitoring data about four Java threads in executionon three hosts of its target domain A. Apart from threadnames and execution hosts, the GUIs report monitoringinformation about thread priority, allocated memory/objects,loaded classes, contended monitors, invoked methods, in/outTCP/UDP packets and lifetime.
Figure 6 visualizes some MAPI indicators about runningprocesses and network traffic on two Windows NT moni-tored targets. For any process, the GUIs show the processname and identifier, the current CPU usage percentage, thephysical/virtual allocated memory, the composing threadsand the detailed CPU usage. Network traffic informationincludes the total number of sent/received TCP segments andUDP/IP packets. Authorized system/service administratorscan choose between different forms of visualization ofmonitoring data, such as the pie charts and histograms shownin the figures.
6. MONITORING AND CONTROL OF MOBILEAGENT RESOURCE CONSUMPTION
The SOMA platform itself uses MAPI to monitor and limitmobile agent operations at runtime and, consequently, tocontrol the consumption of distributed resources in SOMA-based Web services. The ultimate goal is to charge theresponsible principals for the actions of their mobile agentsand to prevent denial-of-service attacks by either maliciousor badly programmed agents.
SOMA administrators can define agent permissions andduties, which DM controls and enforces dynamically. Agentpermissions specify the actions agents are authorized toperform on a set of resources, even depending on runtimeconditions. Agent duties specify the actions agents mustperform on a set of target resources when a specifiedcondition takes place [19].
As an example of agent permission specification, oneadministrator can control the disk resources consumed ina target domain with a distributed authorization policy thatlimits the total number of bytes that a specified SOMAagent can write during one day over the target hosts in thedomain. This limit can also apply to groups of agents,e.g. the whole set of agents of the same responsible principal.At any request of file opening in writing mode by one ofthe specified agents, the Manager commands one Explorerto probe the target domain. This introduces delay in agentauthorizations but permits global policies that depend onthe current distributed state. Let us point out that, even inthis simple example, the Explorer significantly benefits fromthe possibility of bringing its reached execution state with itwhile migrating in the target domain.
As an example of agent duty specification, one adminis-trator can request an Explorer agent to lower autonomously
the priority of a SOMA agent running on a host whenthe total CPU usage percentage on that host is higherthan a specified threshold. Differently from the caseof permissions, the Manager commands the Explorer tocontrol the state of the CPU usage on the specified hostperiodically, depending on the interval time indicated inthe duty specification. When the threshold is overcome,the Explorer itself acts on the specified agent by exploitingMAPI functions to modify dynamically the Java threadpriority.
The conditions for SOMA agent permissions/duties canalso be expressed as complex functions of MAPI monitoringindicators. The above examples show that it is oftennecessary not only to monitor the application state of SOMAagents and of related Java threads, but also to combine thesedata with kernel and application state of service componentseven external to the JVM.
7. MAPI PERFORMANCE
On-line monitoring tools should limit introduced overheadsince they should operate during service provision. We havecarefully followed the guidelines of overhead limitation,together with the feature of dynamic tuning, in the designand implementation of DM. To validate MAPI applicability,we have measured the overhead on different platforms,e.g. Intel Pentium III 600 MHz PCs with either MicrosoftWindows NT 4.0 or SuSE Linux 6.2, and SUN Ultra 5400 MHz workstations with Solaris 7. The hosts areinterconnected via 10 Mb Ethernet Local Area Networks(LANs).
This section reports first the costs of local MAPIProfiler Agent and MAPI*ResManager modules. For theevaluation of their performance results, we have used aJava benchmark application that stresses CPU and memoryusage by generating a fixed number of different threadsand objects. In particular, we report the measurements forthe case of 50 benchmark processes in execution, each onewith an average number of five threads. We have measuredthe time delay due to the monitoring tool intrusion as theoverhead percentage (Overhead%), i.e. the difference ofTMon and TnoMon (normalized to TnoMon):
Overhead% =(
TMon − TnoMon
TnoMon
)× 100
where TMon is the average completion time of the Javabenchmark on unloaded targets with the MAPI tool inexecution and TnoMon is the analogous time measured forthe benchmark without MAPI. Let us note that unloadedtargets represent the worst possible case for the Overhead%indicator. In fact, as soon as the load increases, TnoMongrows faster than TMon, and, consequently, the ratio oftheir difference tends to decrease. This considerationhas been validated by measurements of Overhead% withseveral general-purpose benchmark tests running: themeasurements have shown an average decrease of about1.0–1.5% of the Overhead% indicator for average loadconditions.
THE COMPUTER JOURNAL, Vol. 45, No. 6, 2002
604 P. BELLAVISTA, A. CORRADI AND C. STEFANELLI
ProcessInfo
0.00
2.00
4.00
6.00
8.00
10.00
12.00
0.0 2.0 4.0 6.0 8.0 10.0 12.0
Refresh Time (sec)
Ove
rhea
d%
MAPI Window s ResManagerMAPI Solaris ResManagerMAPI Linux ResManager
FIGURE 7. Overhead% of MAPI*ResManagers for process monitoring.
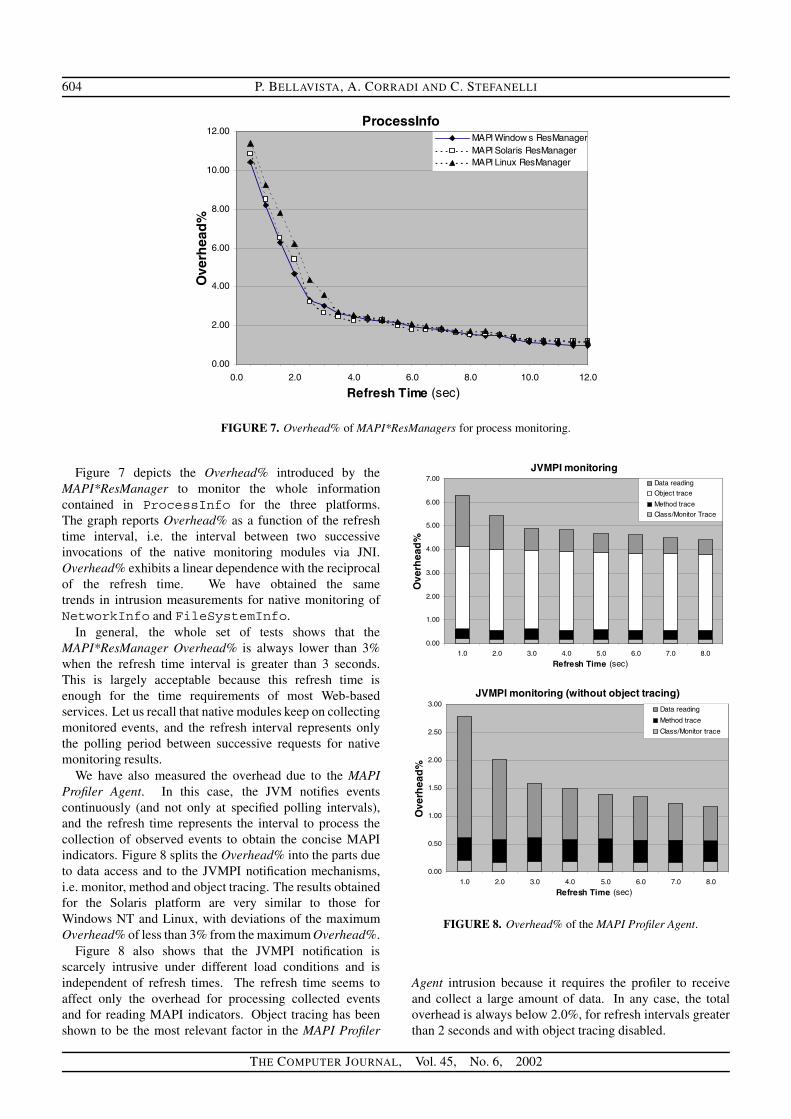
Figure 7 depicts the Overhead% introduced by theMAPI*ResManager to monitor the whole informationcontained in ProcessInfo for the three platforms.The graph reports Overhead% as a function of the refreshtime interval, i.e. the interval between two successiveinvocations of the native monitoring modules via JNI.Overhead% exhibits a linear dependence with the reciprocalof the refresh time. We have obtained the sametrends in intrusion measurements for native monitoring ofNetworkInfo and FileSystemInfo.
In general, the whole set of tests shows that theMAPI*ResManager Overhead% is always lower than 3%when the refresh time interval is greater than 3 seconds.This is largely acceptable because this refresh time isenough for the time requirements of most Web-basedservices. Let us recall that native modules keep on collectingmonitored events, and the refresh interval represents onlythe polling period between successive requests for nativemonitoring results.
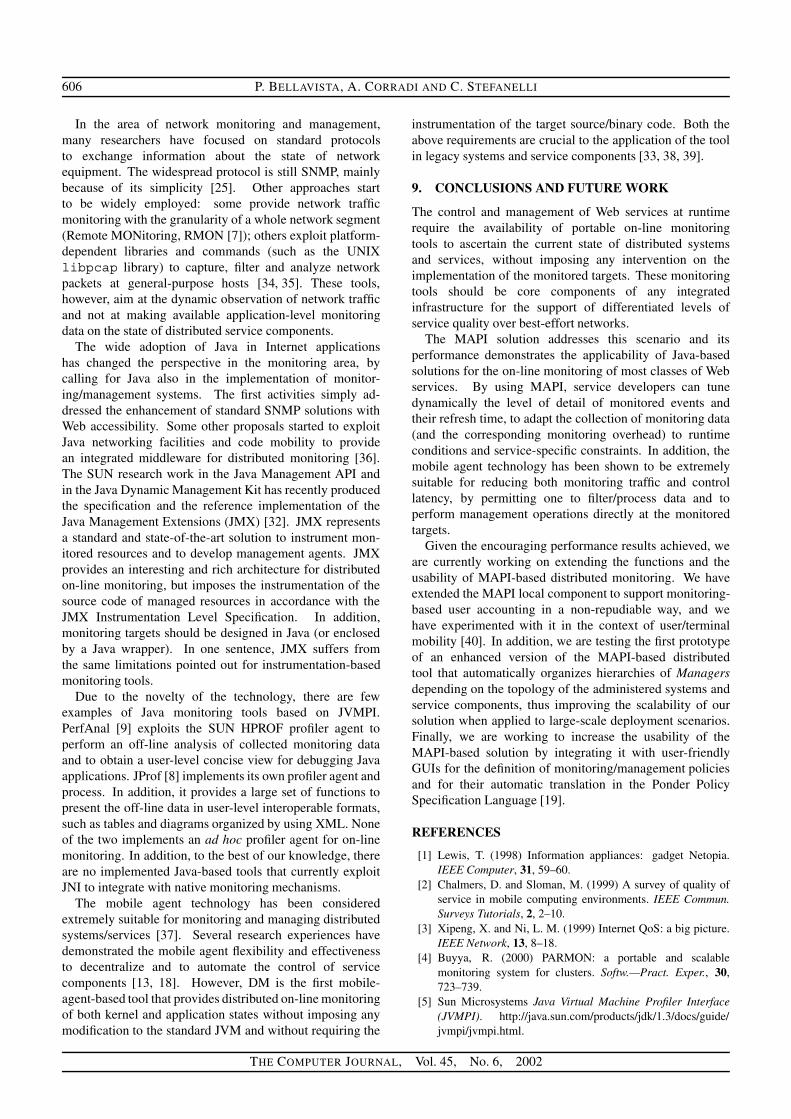
We have also measured the overhead due to the MAPIProfiler Agent. In this case, the JVM notifies eventscontinuously (and not only at specified polling intervals),and the refresh time represents the interval to process thecollection of observed events to obtain the concise MAPIindicators. Figure 8 splits the Overhead% into the parts dueto data access and to the JVMPI notification mechanisms,i.e. monitor, method and object tracing. The results obtainedfor the Solaris platform are very similar to those forWindows NT and Linux, with deviations of the maximumOverhead% of less than 3% from the maximum Overhead%.
Figure 8 also shows that the JVMPI notification isscarcely intrusive under different load conditions and isindependent of refresh times. The refresh time seems toaffect only the overhead for processing collected eventsand for reading MAPI indicators. Object tracing has beenshown to be the most relevant factor in the MAPI Profiler
JVMPI monitoring
0.00
1.00
2.00
3.00
4.00
5.00
6.00
7.00
1.0 2.0 3.0 4.0 5.0 6.0 7.0 8.0
Refresh Time (sec)
Ove
rhea
d%
Data reading
Object trace
Method trace
Class/Monitor Trace
JVMPI monitoring (without object tracing)
0.00
0.50
1.00
1.50
2.00
2.50
3.00
1.0 2.0 3.0 4.0 5.0 6.0 7.0 8.0
Refresh Time (sec)
Ove
rhea
d%
Data reading
Method trace
Class/Monitor trace
FIGURE 8. Overhead% of the MAPI Profiler Agent.
Agent intrusion because it requires the profiler to receiveand collect a large amount of data. In any case, the totaloverhead is always below 2.0%, for refresh intervals greaterthan 2 seconds and with object tracing disabled.
THE COMPUTER JOURNAL, Vol. 45, No. 6, 2002
ON-LINE DISTRIBUTED MONITORING IN JAVA 605
MAPI Explorer vs. SNMP Client/Server
0
2000
4000
6000
8000
10000
12000
0 2 4 6 8 10 12 14#hosts in target domain
Tim
e (m
sec)
Explorer agent
SNMP Client/Server
Explorer agent (dif ferent LANs)
SNMP Client/Server (different LANs)
FIGURE 9. MAPI Explorer versus SNMP client/server to monitor one target domain.
Finally, we have also validated the applicability of ourmobile-agent-based DM. The Explorer size varies fromabout 8 kB (at their first migration, without carrying anymonitoring indicator) to 15 kB (at the end of exploration,including all the monitoring state of the target domain).Let us note that Explorers need to transfer their code onlyat the first migration because the SOMA platform at thedestination host caches Java classes and triggers the codemigration only when it is not available locally [11]. Figure 9reports the time an Explorer takes to collect monitoringindicators by using MAPI SNMP Agents, depending on thenumber of hosts in the target domain. The average time hasbeen measured over a large set of experiments, by assuminga 30% probability of finding the needed agent classes alreadycached at the destination targets.
The presence of MAPI SNMP Agent permits the collectedmonitoring data to be filtered and pre-processed. For severaldifferent management policies, we have experienced that theMAPI SNMP Agent operations significantly reduce the sizeof MAPI data collected by the Explorer with respect to thesize of corresponding raw MIB values by a factor of three.This optimization is impossible in a traditional client/serverapproach where a centralized manager should remotely in-terrogate involved SNMP agents (SNMP client/server graphin the figure). The same experiments confirm that the MAtechnology is particularly suitable when the target domainincludes different LANs, interconnected by low bandwidthlinks (in our measurements, two Ethernet LANs with n/2hosts, connected via a 56 kb modem link). In this case,Explorer uses the slow link only once to migrate from oneLAN to the other. The client/server solution, instead, shouldoperate over the link at least for n/2 SNMP requests and n/2SNMP replies, wherever the centralized manager is located.
All these results show that, when data filtering is possibleand heterogeneity is present, the adoption of mobile agents
in DM reduces both time performance and generated traffic.Our results confirm model estimations and first experimentalmeasurements of research work on SNMP distributedmonitoring based on mobile agents [13, 21]. In addition,the results point out that the overhead of MAPI*ResManageris significantly higher than that of MAPI SNMP Agent.This has brought us to prefer the latter module when it isavailable at the target host and supports the Host ResourcesMIB extensions.
8. RELATED WORK
Recent research activities have worked on the definitionof methodologies, on the design of architectures andon the implementation of supports for local and dis-tributed monitoring by following very different approaches[4, 7, 22, 23, 24, 25, 26, 27, 28, 29, 30, 31, 32, 33].
Several distributed monitoring systems that are basedon code instrumentation have achieved interesting results,especially in limiting local overhead and network traffic[23, 26, 28]. However, they require instrumenting either thesource code or the binary of managed service components,and force one to recompile or at least restart the monitoredservices. In addition, the solutions that require source/binaryrewriting tend to be language- and platform-specific. Thisis the main reason why instrumentation-based tools arenot a viable solution for monitoring legacy heterogeneoussystems and service components in the open and globalInternet.
Other research efforts have specifically addressed on-line monitoring. They typically concentrate on tools thatminimize monitoring intrusion, by exploiting ad hoc mecha-nisms available only for specific operating systems [30, 31].These solutions also suffer from platform dependency andlack of portability.
THE COMPUTER JOURNAL, Vol. 45, No. 6, 2002
606 P. BELLAVISTA, A. CORRADI AND C. STEFANELLI
In the area of network monitoring and management,many researchers have focused on standard protocolsto exchange information about the state of networkequipment. The widespread protocol is still SNMP, mainlybecause of its simplicity [25]. Other approaches startto be widely employed: some provide network trafficmonitoring with the granularity of a whole network segment(Remote MONitoring, RMON [7]); others exploit platform-dependent libraries and commands (such as the UNIXlibpcap library) to capture, filter and analyze networkpackets at general-purpose hosts [34, 35]. These tools,however, aim at the dynamic observation of network trafficand not at making available application-level monitoringdata on the state of distributed service components.
The wide adoption of Java in Internet applicationshas changed the perspective in the monitoring area, bycalling for Java also in the implementation of monitor-ing/management systems. The first activities simply ad-dressed the enhancement of standard SNMP solutions withWeb accessibility. Some other proposals started to exploitJava networking facilities and code mobility to providean integrated middleware for distributed monitoring [36].The SUN research work in the Java Management API andin the Java Dynamic Management Kit has recently producedthe specification and the reference implementation of theJava Management Extensions (JMX) [32]. JMX representsa standard and state-of-the-art solution to instrument mon-itored resources and to develop management agents. JMXprovides an interesting and rich architecture for distributedon-line monitoring, but imposes the instrumentation of thesource code of managed resources in accordance with theJMX Instrumentation Level Specification. In addition,monitoring targets should be designed in Java (or enclosedby a Java wrapper). In one sentence, JMX suffers fromthe same limitations pointed out for instrumentation-basedmonitoring tools.
Due to the novelty of the technology, there are fewexamples of Java monitoring tools based on JVMPI.PerfAnal [9] exploits the SUN HPROF profiler agent toperform an off-line analysis of collected monitoring dataand to obtain a user-level concise view for debugging Javaapplications. JProf [8] implements its own profiler agent andprocess. In addition, it provides a large set of functions topresent the off-line data in user-level interoperable formats,such as tables and diagrams organized by using XML. Noneof the two implements an ad hoc profiler agent for on-linemonitoring. In addition, to the best of our knowledge, thereare no implemented Java-based tools that currently exploitJNI to integrate with native monitoring mechanisms.
The mobile agent technology has been consideredextremely suitable for monitoring and managing distributedsystems/services [37]. Several research experiences havedemonstrated the mobile agent flexibility and effectivenessto decentralize and to automate the control of servicecomponents [13, 18]. However, DM is the first mobile-agent-based tool that provides distributed on-line monitoringof both kernel and application states without imposing anymodification to the standard JVM and without requiring the
instrumentation of the target source/binary code. Both theabove requirements are crucial to the application of the toolin legacy systems and service components [33, 38, 39].
9. CONCLUSIONS AND FUTURE WORK
The control and management of Web services at runtimerequire the availability of portable on-line monitoringtools to ascertain the current state of distributed systemsand services, without imposing any intervention on theimplementation of the monitored targets. These monitoringtools should be core components of any integratedinfrastructure for the support of differentiated levels ofservice quality over best-effort networks.
The MAPI solution addresses this scenario and itsperformance demonstrates the applicability of Java-basedsolutions for the on-line monitoring of most classes of Webservices. By using MAPI, service developers can tunedynamically the level of detail of monitored events andtheir refresh time, to adapt the collection of monitoring data(and the corresponding monitoring overhead) to runtimeconditions and service-specific constraints. In addition, themobile agent technology has been shown to be extremelysuitable for reducing both monitoring traffic and controllatency, by permitting one to filter/process data and toperform management operations directly at the monitoredtargets.
Given the encouraging performance results achieved, weare currently working on extending the functions and theusability of MAPI-based distributed monitoring. We haveextended the MAPI local component to support monitoring-based user accounting in a non-repudiable way, and wehave experimented with it in the context of user/terminalmobility [40]. In addition, we are testing the first prototypeof an enhanced version of the MAPI-based distributedtool that automatically organizes hierarchies of Managersdepending on the topology of the administered systems andservice components, thus improving the scalability of oursolution when applied to large-scale deployment scenarios.Finally, we are working to increase the usability of theMAPI-based solution by integrating it with user-friendlyGUIs for the definition of monitoring/management policiesand for their automatic translation in the Ponder PolicySpecification Language [19].
REFERENCES
[1] Lewis, T. (1998) Information appliances: gadget Netopia.IEEE Computer, 31, 59–60.
[2] Chalmers, D. and Sloman, M. (1999) A survey of quality ofservice in mobile computing environments. IEEE Commun.Surveys Tutorials, 2, 2–10.
[3] Xipeng, X. and Ni, L. M. (1999) Internet QoS: a big picture.IEEE Network, 13, 8–18.
[4] Buyya, R. (2000) PARMON: a portable and scalablemonitoring system for clusters. Softw.—Pract. Exper., 30,723–739.
[5] Sun Microsystems Java Virtual Machine Profiler Interface(JVMPI). http://java.sun.com/products/jdk/1.3/docs/guide/jvmpi/jvmpi.html.
[6] Gordon, R. (1998) Essential Java Native Interface. Prentice-Hall, Upper Saddle River, NJ.
[7] Stallings, W. (1998) SNMP, SNMPv2, SNMPv3, and RMON 1and 2 (3rd edn). Addison-Wesley, Reading, MA.
[8] Pennington, G. and Watson, R. (2000) JProf—a JVMPI BasedProfiler. http://starship.python.net/crew/garyp/jProf.html.
[9] Meyers, N. (2001) PerfAnal: a Performance Analysis Tool.http://developer.java.sun.com/developer/technicalArticles/GUI/perfanal/index.html.
[10] Bellavista, P., Corradi, A. and Stefanelli, C. (2000) Anintegrated management environment for network resourcesand services. IEEE J. Selected Areas Commun. (SpecialIssue on Recent Advances in Network Management andOperations), 18, 676–685.
[11] Bellavista, P., Corradi, A. and Stefanelli, C. (2000) Protectionand interoperability for mobile agents: a secure andopen programming environment. IEICE Trans. Commun.(IEICE/IEEE Special Issue on Autonomous DecentralizedSystems), E83-B, 961–972.
[12] Waldbusser, S. and Grillo, P. (2000) Host Resources MIB,RFC2790. http://www.ietf.org/rfc/.
[13] Gavalas, D., Ghanbari, M., O’Mahony, M. and Green-wood, D. (2000) Enabling mobile agent technology for intel-ligent bulk management data filtering. In Proc. of NOMS’00,Honolulu, HI, April 11–13, pp. 865–876. IEEE Press, Piscat-away, NJ.
[15] Nemeth, E., Snyder, G., Hein, T. R. and Seebass, S. (2000)UNIX System Administration Handbook (3rd edn). Prentice-Hall, Upper Saddle River, NJ.
[16] Bellavista, P., Corradi, A. and Stefanelli, C. (2000) A mobileagent infrastructure for terminal, user and resource mobility.In Proc. of NOMS’00, Honolulu, HI, April 11–13, pp. 877–890. IEEE Press, Piscataway, NJ.
[17] Goldszmidt, G. and Yemini, Y. (1995) Distributed manage-ment by delegation. In Proc. of ICDCS’95, L’Aquila, Italy.IEEE Computer Society, Los Alamitos, CA.
[18] Pagurek, B., Wang, Y. and White, T. (2000) Integrationof mobile agents with SNMP: why and how. In Proc. ofNOMS’00, Honolulu, HI, April 11–13, pp. 609–622. IEEEPress, Piscataway, NJ.
[19] Corradi, A., Dulay, N., Montanari, R. and Stefanelli, C.(2001) Policy-driven management of agent systems. In Proc.of the Policy Workshop, Bristol, January 12–14, pp. 214–229,Springer, Berlin.
[20] Java Community Process. Application Isolation API Specifi-cation (Java Specification Request #121).http://www.jcp.org/jsr/detail/121.jsp.
[21] Baldi, M. and Picco, G. P. (1998) Evaluating the tradeoffsof mobile code design paradigms in network managementapplications. In Proc. of ICSE’98, pp. 146–155. IEEEComputer Society, Los Alamitos, CA.
[22] Al-Shaer, E., Abdel-Wahab, H. and Maly, K. (1999)HiFi: a new monitoring architecture for distributed systems
management. In Proc. of ICDCS’99, pp. 171–178. IEEEComputer Society, Los Alamitos, CA.
[23] Bakic, A., Mutka, M. W. and Rover, D. T. (2000) BRISK:a portable and flexible distributed instrumentation system.Softw.—Pract. Exper., 30, 1353–1373.
[24] Corradi, A. and Stefanelli, C. (1997) HOLMES: a tool formonitoring heterogeneous architectures. In Proc. of HPC’97,pp. 486–491. IEEE Computer Society, Los Alamitos, CA.
[25] Jiao, J., Naqvi, S., Raz, D. and Sugla, B. (2000) Towardefficient monitoring. IEEE J. Selected Areas Commun., 18,723–732.
[26] Lange, F., Kroeger, R. and Gergeleit, M. (1992) JEWEL:design and implementation of a distributed measurementsystem. IEEE Trans. Parallel Distrib. Syst., 3, 657–671.
[27] Liang, Z., Sun, Y. and Wang, C. (1999) ClusterProbe: anopen, flexible and scalable cluster monitoring tool. In Proc. ofIWCC’99, Melbourne, Australia, December 2–3, pp. 57–64.IEEE Computer Society, Los Alamitos, CA.
[28] Miller, B. P., et al. (1995) The Paradyn parallel performancemeasurement tools. IEEE Computer, 28, 37–46.
[29] Russ, S. H., et al. (1999) Hector: an agent-based architecturefor dynamic resource management. IEEE Concurrency, 7,47–55.
[30] Schroeder, B. A. (1995) On-line monitoring: a tutorial. IEEEComputer, 28, 72–78.
[31] Weiming, G., Eisenhauer, G., Schwan, K. and Vetter, J. (1998)Falcon: on-line monitoring for steering parallel programs.Concurr.—Pract. Exper., 10, 699–736.
[32] SUN Microsystems. Java Management Extensions (JMX).http://java.sun.com/products/JavaManagement/.
[33] Guiagoussou, M. H., Boutaba, R. and Kadoch, M. (2001)A Java API for advanced faults management. In Proc. ofIM’01, Seattle, WA, May 14–18, pp. 657–665. IEEE Press,Piscataway, NJ.
[34] Deri, L. and Suin, S. (2000) Effective traffic measurementusing Ntop. IEEE Commun. Mag., 38, 138–143.
[35] Kumar, A. et al. (2000) Nonintrusive TCP connectionadmission control for bandwidth management of an internetaccess link. IEEE Commun. Mag., 38, 160–167.
[36] Lee, J. (2000) Enabling network management using Javatechnologies. IEEE Commun. Mag., 38, 116–123.
[37] Fuggetta, A., Picco, G. P. and Vigna, G. (1998) Understandingcode mobility. IEEE Trans. Softw. Eng., 24, 342–361.
[38] Czajkowski, G. and von Eicken, T. (1998) JRes: a resourceaccounting interface for Java. In Proc. of OOPSLA’98,Vancouver, Canada, October 18–22, pp. 21–35. ACM Press,Broadway, NY.
[39] Suri, N., Bradshaw, J. M., Breedy, M. R., Groth, P. T.,Hill, G. A. and Jeffers, R. (2000) Strong mobilityand fine-grained resource control in NOMADS. In Proc.of ASA/MA’00, Zurich, Switzerland, September 13–15,pp. 2–15. Springer, Berlin.
[40] Bellavista, P., Corradi, A. and Vecchi, S. (2002) Mobile agentsolutions for accounting management in mobile computing.In Proc. of ISCC’02, Taormina, Italy, July 1–4, pp. 753–760.IEEE Computer Society Press, Los Alamitos, CA.