107
August 2006 (Last updated: February 2008) JBIC Project Development Department Development Assistance Operations Evaluation Office EVALUATION HANDBOOK FOR ODA LOAN PROJECTS
August 2006
(Last updated: February 2008)
JBIC Project Development Department
Development Assistance Operations Evaluation Office
EVALUATION HANDBOOK FOR
ODA LOAN PROJECTS


Table of Contents Chapter 1: A New Direction of Evaluation of Development Assistance .........................1
1.1 Evaluation as a tool of enhancing aid quality..........................................................1
(1) Managing for development results (MfDR) and aid evaluation ..............................1
(2) Enhancement of Impact Evaluation: investment in project
with attention to development results ....................................................................3
(3) Ownership of Evaluation on Developing Countries ...............................................4
1.2 Evaluation of Japan’s ODA.....................................................................................5
Chapter 2: Evaluation of JBIC ODA Loan Projects ..........................................................7
2.1 Purposes and background of ODA loan project evaluation ....................................7
2.2 JBIC’s project cycle and evaluation activities .........................................................8
2.3 Types of JBIC’s ex-post evaluation: individual project evaluation
and thematic evaluation .......................................................................................10
2.4 Efforts to improve evaluation of ODA loan projects .............................................. 11
(1) Strengthening the consistency of evaluations through introduction
of mid-term reviews and ex-post monitoring........................................................ 11
(2) Improvement of projects through feedback of evaluation results.........................12
(3) Improving the quality of evaluations through cooperation with universities .........13
(4) Expanding participation of developing countries in evaluations
(through joint evaluations) ...................................................................................13
(5) Aiming for High Quality Impact Evaluations with Wide Application......................14
Chapter 3: Tools of ODA Loan Evaluation ...................................................................15
3.1 Logical Framework ...............................................................................................15
(1) Definition and structure of logical framework.......................................................15
(2) The use of logical framework in project evaluation..............................................16
3.2 Performance indicators.........................................................................................19
(1) The use of performance indicators in development assistance ...........................19
(2) Operation and effect indicators – JBIC’s performance indicators in
project management............................................................................................20
3.3 Cost benefit analysis ............................................................................................23
3.4 Social Analysis .....................................................................................................27
(1) Purposes of social analysis .................................................................................27
(2) Typical social analysis tools for evaluation of ODA loans ....................................27
Chapter 4: Procedures of Ex-post Evaluation of ODA Loan Projects ..........................31

4.1 Work flow of ex-post evaluation of ODA loan projects ..........................................31
(1) Setting the evaluation framework (terms of reference) ........................................32
(2) Preparing the “evaluation skeleton” .....................................................................32
(3) Preparing questionnaires and other survey instruments......................................37
(4) Collecting data and information ...........................................................................38
(5) Preparing the evaluation summary sheet ............................................................39
(6) Writing the ex-post evaluation report ...................................................................45
4.2 Points of evaluation along with the DAC five criteria ............................................46
(1) Evaluation rating..................................................................................................46
(2) Relevance ...........................................................................................................48
(3) Efficiency .............................................................................................................50
(4) Effectiveness .......................................................................................................52
(5) Impact..................................................................................................................54
(6) Sustainability .......................................................................................................56
(7) Lessons Learned.................................................................................................58
(8) Recommendations...............................................................................................58
Chapter 5: Feedback of the Evaluation Findings...........................................................60
5.1 JBIC’s mechanism for feedback ...........................................................................60
(1) Feedback meeting ...............................................................................................60
(2) Ex-post monitoring sheet (use of recommendations) ..........................................60
(3) Follow-up facilities (use of recommendations).....................................................60
(4) Feedback to ex-ante evaluation (use of lessons learned) ...................................62
5.2 Feedback by developing countries .......................................................................63
(1) Feedback from ex-post evaluation.......................................................................63
(2) Feedback from ex-post monitoring ......................................................................63
References ......................................................................................................................65
Annexes ......................................................................................................................67
Annex 1: Sample terms of reference (TOR) for individual project evaluation ...........68
Annex 2: Sample questionnaire for executing agency..............................................72
Annex3: Types of Performance Indicators Used by the World Bank
and their Applications ..........................................................................................95
Annex 4: Economic/ financial evaluation of infrastructure development projects
(EIRR and FIRR) .................................................................................................97
Annex 5: Sample ex-post evaluation report ............................................................ 101

Boxes Box 1: Use of aid evaluation for developing countries ................................................4
Box 2: Improvement of evaluation aimed in the Medium-Term ODA
Strategy FY 2005-FY2007 ......................................................................................8
Box 3: Major characteristics of JBIC’s ex-post evaluation .............................................9
Box 4: Table of contents of Project Status Report (PSR) .............................................12
Box 5: Example of re-calculation of FIRR and EIRR at ex-post evaluation .................26
Box 6: Example of beneficiary survey in ex-post project evaluation ............................28
Box 7: Example of social impact analysis using Poverty Analysis
Macroeconomic Simulator (PAMS).......................................................................29
Box 8: Standard composition of questionnaire for the executing agency.....................37
Box 9: Example of beneficiary survey sheet (part of a structured interview sheet)......38
Box 10: Standard outline of the ex-post evaluation report ...........................................45
Box 11: Example of relevance evaluation: a project with high relevance.....................49
Box 12: Example of relevance evaluation: project with some concerns with
relevance..............................................................................................................49
Box 13: Example of efficiency evaluation: a project of high efficiency: ........................51
Box 14: Example of efficiency evaluation: two projects with low efficiency..................51
Box 15: Example of effectiveness evaluation: a project with high effectiveness..........53
Box 16: Example of impact evaluation: impacts on environment and relocated
people...................................................................................................................55
Box 17: Example of sustainability evaluation: a project with high sustainability...........57
Box 18: Example of sustainability evaluation: sustainability of
human resource development ..............................................................................57
Box 19: Example of SAPS following the ex-post evaluation ........................................62
Box 20: Format of the ex-ante evaluation report..........................................................62
Box 21: Example of feedback to ex-ante evaluation....................................................63
Box 22: Example of feedback from ex-post monitoring by developing countries .........64
Figures
Figure 1: Agencies responsible for ODA evaluation in Japan ........................................6
Figure 2: Three levels of JBIC’s results-based management.........................................7
Figure 3: JBIC’s project cycle and evaluation activities .................................................9
Figure 4: Vertical logic of the logframe ........................................................................16
Figure 5: Relating the DAC five evaluation criteria to the logframe for
project evaluation .................................................................................................17
Figure 6: Example of relating performance indicators to the logic model: ...................20
Figure 7: Logframe and operation and effect indicators...............................................21
Figure 8: Work flow of ex-post evaluation of ODA loan projects ..................................31
Figure 9: Differentiation of project objectives from project outline ...............................36
Figure 10: Flowchart for evaluation rating....................................................................47
Figure 11: Concept of relevance evaluation.................................................................48
Figure 12: Concept of efficiency evaluation .................................................................50
Figure 13: Concept of effectiveness evaluation ...........................................................52
Figure 14: Concept of impact evaluation .....................................................................54
Figure 15: Concept of sustainability evaluation ...........................................................56
Tables
Table 1: Type and timing of individual project evaluation of ODA loans....................... 11
Table 2: DAC five evaluation criteria and their use at different evaluation stages........ 11
Table 3: General composition of the Logical Framework .............................................15
Table 4: JBIC’s Logframe (Most common format used in the past)..............................17
Table 5: Example of the logical frameworks used in JBIC ...........................................18
Table 6: Sample Operation and Effect Indicators.........................................................21
Table 7: Example of the use of operation and effect Indicators in the
ex-ante project evaluation ....................................................................................22
Table 8: Sample format of the evaluation skeleton ......................................................33
Table 9: Example of the evaluation skeleton................................................................34
Table 10: Sample format of the evaluation summary sheet .........................................40
Table 11: Example of the evaluation summary sheet...................................................41
Table 12: Criteria for individual rating ..........................................................................46
Table 13: Examples of lessons learned and recommendations ...................................58
Table 14: Example of the ex-post monitoring sheet .....................................................61

1
Chapter 1: A New Direction of Evaluation of Development Assistance
1.1 Evaluation as a tool of enhancing aid quality
(1) Managing for development results (MfDR) and aid evaluation Since late 1990’s, efforts of the international development community to improve their evaluation activities have been in conjunction with a series of initiatives to enhance aid quality and thus its effectiveness. Key milestones include the Millennium Declaration with the adoption of the Millennium Development Goals (MDGs) in 2000, the Monterrey Consensus on Financing for Development in 2002, the Rome Declaration on Harmonization in 2003, the Marrakech Memorandum on Managing for Development Results in 2004, and the Paris Declaration on Aid Effectiveness in 2005. Through these initiatives, representatives of donor and partner countries as well as bilateral and multilateral aid institutions have discussed and committed a new partnership to strengthen and harmonize their systems and practices of development assistance. “Managing for development results (MfDR)” is one of the central issues emerged from such efforts. With the definition agreed in Marrakech as per the box below, MfDR calls for developing countries to increase their commitment to policies and actions that promote economic growth and reduce poverty, and developed countries to support them through more effective aid and trade policies.
Recent development of aid evaluation is directed towards the realization of the international consensus on “managing for development results (MfDR)” for enhancing aid effectiveness. To this direction, greater importance has been given to such issues as(i) enhancement of “impact evaluation” to rigorously measure the contribution of development projects/ programs, and (ii) evaluation capacity development of developing countries, where ownership of evaluation should lie.
Definition of MfDR: Managing for Development Results (MfDR) is a management strategy focused on development performance and on sustainable improvements in country outcomes. It provides a coherent framework for development effectiveness in which performance information is used for improved decision making, and it includes practical tools for strategic planning, risk management, progress monitoring, and outcome evaluation.
2
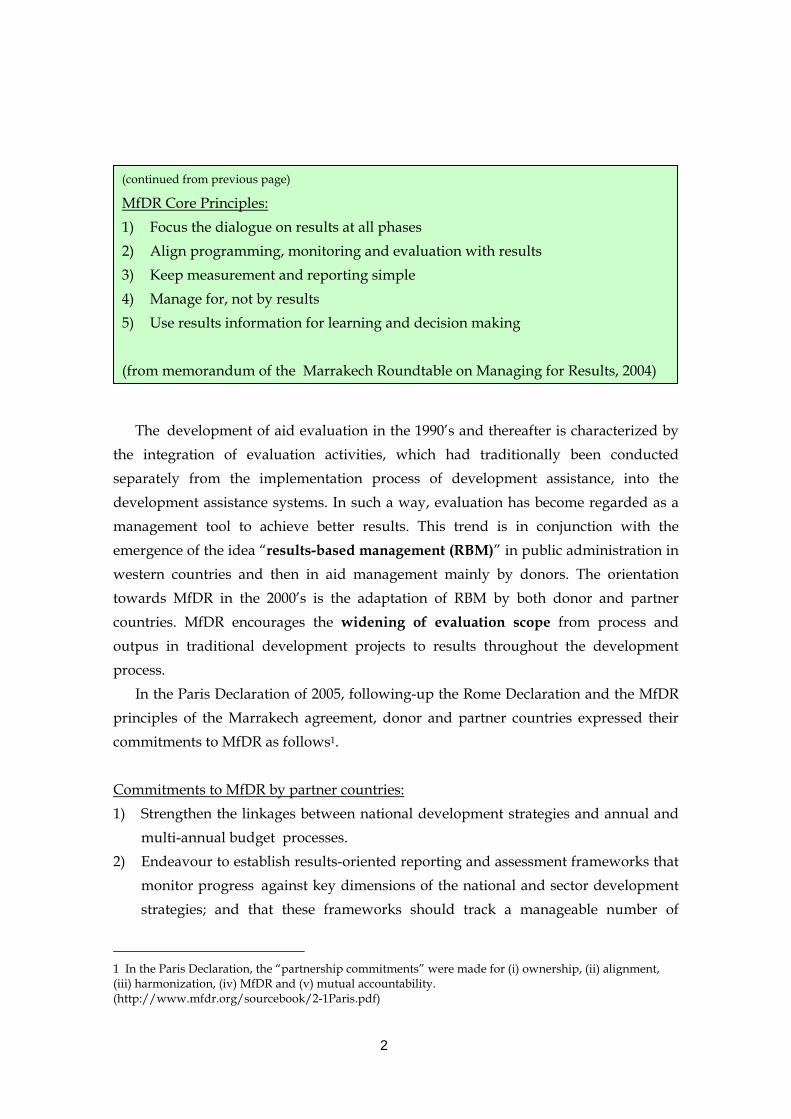
The development of aid evaluation in the 1990’s and thereafter is characterized by the integration of evaluation activities, which had traditionally been conducted separately from the implementation process of development assistance, into the development assistance systems. In such a way, evaluation has become regarded as a management tool to achieve better results. This trend is in conjunction with the emergence of the idea “results-based management (RBM)” in public administration in western countries and then in aid management mainly by donors. The orientation towards MfDR in the 2000’s is the adaptation of RBM by both donor and partner countries. MfDR encourages the widening of evaluation scope from process and outpus in traditional development projects to results throughout the development process. In the Paris Declaration of 2005, following-up the Rome Declaration and the MfDR principles of the Marrakech agreement, donor and partner countries expressed their commitments to MfDR as follows1. Commitments to MfDR by partner countries: 1) Strengthen the linkages between national development strategies and annual and
multi-annual budget processes. 2) Endeavour to establish results-oriented reporting and assessment frameworks that
monitor progress against key dimensions of the national and sector development strategies; and that these frameworks should track a manageable number of
1 In the Paris Declaration, the “partnership commitments” were made for (i) ownership, (ii) alignment, (iii) harmonization, (iv) MfDR and (v) mutual accountability. (http://www.mfdr.org/sourcebook/2-1Paris.pdf)
(continued from previous page)
MfDR Core Principles: 1) Focus the dialogue on results at all phases 2) Align programming, monitoring and evaluation with results 3) Keep measurement and reporting simple 4) Manage for, not by results 5) Use results information for learning and decision making (from memorandum of the Marrakech Roundtable on Managing for Results, 2004)

3
indicators for which data are cost-effectively available. Commitments to MfDR by donors: 1) Link country programming and resources to results and align them with effective
partner country performance assessment frameworks, refraining from requesting the introduction of performance indicators that are not consistent with partners’ national development strategies.
2) Work with partner countries to rely, as far as possible, on partner countries’ results-oriented reporting and monitoring frameworks.
3) Harmonize their monitoring and reporting requirements, and, until they can rely more extensively on partner countries’ statistical, monitoring and evaluation systems, with partner countries to the maximum extent possible on joint formats for periodic reporting.
Joint commitments to MfDR by partner countries and donors: 1) Work together in a participatory approach to strengthen country capacities and
demand for results based management.
(2) Enhancement of Impact Evaluation: investment in project with attention to development results From the viewpoint that evaluation is a tool for development results, it is important to select and use evaluation methods that could precisely measure results. In general, evaluation to know whether development projects/ programs have caused intended changes in target countries (i.e. whether development results have been obtained) is called “impact evaluation2”. As changes in a society and economy are brought by various factors, it is often hard to identify the effects of a specific project/ program. However, recent studies in development economics have developed so-called “rigorous impact evaluation methods” as a way to verify the net effects of the project/ programs in a scientific manner. Those methods have gradually been adopted in the practice of aid evaluation. Basically, the rigorous assessment methods are statistical analyses of differences between changes that are brought with- and without the project/ program
2 As mentioned later, JBIC applies the DAC Five Evaluation Criteria – Relevance, Effectiveness, Efficiency, Impact and Sustainability – as its criteria of ODA loan project evaluation. However, “impact” discussed in the current section is not exactly same as “impact” of the DAC Criteria.

4
intervention3. Advantages of conducting the rigorous impact evaluation include: (i) contribution to a realization of development results by allocating limited resources to the projects/ programs that are proven effective; and (ii) clear illustration of whether the resources allocated to the project/ program are well utilized (i.e. ensuring accountability)4. However, a proper application of the rigorous evaluation methods requires considerable human and monetary costs since data must be collected from the ex-ante stage (i.e. before the project). Therefore, if an organization is to institutionalize the rigorous impact evaluation, the purpose and scope of it should be carefully considered.
(3) Ownership of Evaluation on Developing Countries In the above-mentioned context, partnership in the conduct of evaluation has entered a new phase: ownership and initiative for evaluation should be more on developing countries so that they could better practice MfDR by making use of information to improve decision making and steer country-led development processes toward clearly defined goals. This is not to say the idea of partnership with donor and partner countries in evaluation had not existed before. The DAC Principles of Evaluation of Development Assistance of 19915
3 Typical scientific methodology of impact evaluation includes experimental and quasi-experimental designs. Both of them analyze gaps between before/after changes on beneficiaries (experimental group) and those on non-beneficiaries (control group). The difference between experimental and quasi-experimental designs is that the former assigns the experimental group and the control group randomly before the project intervention, and the latter identifies a non-randomized control group, at ex-post stage, from those who were not intervened but have similar characteristics with beneficiaries. In aid evaluation, purely experimental design is very difficult. There are various papers and web-sites on impact evaluation using this methodology. For example, see Baker (2000) Evaluating the Impact of Development Projects on Poverty: a handbook for practitioners. The World Bank. (http://siteresources.worldbank.org/INTISPMA/Resources/handbook.pdf) 4 Keitaro Aoyagi, “Trend of Impact Evaluation in International Development Community”, FASID (2007) Issues and Prospects of Evaluations for International Development. 5 The leading principles of aid evaluation called for by the Development Assistance Committee (DAC) of the Organization of Economic Cooperation and Development (OECD). In the principles, evaluation is defined as “an assessment, as systematic and objective as possible, of an on-going or completed project, program or policy, its design, implementation and results. The aim is to determine the relevance and fulfillment of objectives, developmental efficiency, effectiveness, impact and sustainability. An evaluation should provide information that is credible and useful, enabling the incorporation of lessons learned into the decision-making process of both recipients and donors.”
Box 1: Use of aid evaluation for developing countries
Evaluation enables countries to: 1) examine whether the project has
achieved its intended effects; 2) assess the distribution of benefits
among different groups; 3) analyze factors determining
effectiveness in achieving project objectives;
4) institutionalize experiences and lessons from project implementation and management; and
5) provide information for decision-making on “replicability” of the project in the future.

5
already mentions the significance of joint undertakings of evaluation by both parties for partner countries’ capacity building and for aid coordination as well as for the reduction of administrative burdens on them. In fact, a number of “joint evaluation” activities by donor and partner countries have been carried out since early 1990’s. However, many of them were led by donors, and the role of partner countries tended to be confined to supporting the data collection and commenting to evaluation findings drafted by donors. The “country-led evaluation” aimed in MfDR requires developing countries much more active initiatives for their own purposes (see Box 1), and thus evaluation capacity-development has become of greater significance. International actions for evaluation capacity-development include the further promotion of joint evaluation, seminars/ trainings and technical assistance for the establishment of monitoring and evaluation system. Also, the DAC Network of Development Evaluation is working on setting the DAC Evaluation Quality Standards and the assessment framework (tools) for peer review of countries’ evaluation systems.
1.2 Evaluation of Japan’s ODA
Development of Japan’s ODA evaluation has been in response to the above-mentioned international trends and as well as following some internal moves. Internationally, Japan has followed the DAC Evaluation Principles and expanded the evaluation scope to the whole range of ODA activities with evaluation by the Ministry of Foreign Affairs, JICA and JBIC. In 1996, the Japanese ODA evaluation system was appreciated as of well-established among major donors in DAC’s Development Cooperation Review of Japan in 1996. More recently, in order to fulfill the commitments in the Paris Declaration, Japan set up the Action Plan for Implementing the Paris Declaration. For the realization of MfDR, the Action Plan holds (i) introduction of results-based country programming into Japan’s country assistance programs (results-based CAS) in a step-by-step manner, and (ii) strengthening of review of ODA delivery at the country level, aligning with the result-based monitoring framework in each partner country6. Domestically, against the background of the slow-down of Japanese economy in the 1990’s, ODA came under pressure to change its direction from quantitative expansion to qualitative improvement. In the latest ODA Charter (2003) and the Mid-term policy on ODA (2005), ODA evaluation is referred as a tool to improve the quality of
6 Government of Japan (2005) Japan’s Action Plan for Implementing the Paris Declaration http://www.mofa.go.jp/policy/oda/category/coordinate/action.pdf

6
development assistance. Also, the development of Japan’s ODA evaluation has also been encouraged by the enactment of the Government Policy Evaluation Act (GPEA) in 2001. The Act stipulates a system under which each ministry adopts basic evaluation plans every 3-5 years. While main central ministry for the ODA policy evaluation is the Ministry of Foreign Affairs, the stipulations of the GPEA on the ex-ante and ex-post evaluation of individual ODA projects give JICA and JBIC deep connections with the work (See Figure 1).
This is the end of Chapter 1. From this chapter, you have learned:
Why is “managing for development results (MfDR)” important in aid activities?
How evaluation activities contribute to the realization of MfDR? Why are ownership of evaluation on developing countries and evaluation
capacity development important?
Figure 1: Agencies responsible for ODA evaluation in Japan
ODA EvaluationODA Implementation
Policy-level Evaluation-ODA Charter
-Medium-Term Policy on ODA-ODA Country Policy
- -ODA Policy on priority issues
Program-level Evaluation-Sector programs-Type of Aid, etc.
Project-level EvaluationIndividual project, etc.
Evaluation activitiesof the MoFA
Based on thePolicy Evaluation Law
Evaluation activities of JICA
Evaluation activitiesof JBIC
Source: Based on Ministry of Foreign Affairs of Japan (2006) ODA Evaluation Guidelines.

7
Chapter 2: Evaluation of JBIC ODA Loan Projects 2.1 Purposes and background of ODA loan project evaluation
JBIC conducted its first evaluation of ODA loan projects in 1975. Since then, it has widened the scope and types of evaluation, and developed evaluation methodology following the trends described in Chapter 1. The purposes of evaluation of ODA loan projects are set as the followings. Purposes of ODA loan project evaluation: 1) Improvement of assistance – utilize lessons learned and recommendations from
similar projects in the past; 2) A tool of project monitoring – feedback for effective resource-allocation; and 3) Assurance of accountability for tax payers. The project evaluation is conducted as part of JBIC’s results-based management system (RBM), which consists of the following three levels: (i) project level; (ii) policy level; and (iii) agency level (Figure 2). At the project level, which is the main subject of this handbook, JBIC manages individual project cycles in a coherent manner from ex-ante evaluation to feedback of evaluation findings to the planning of new projects (see 2.2 below). At the policy level, management is based on the JBIC’s the Medium-Term Strategy for Overseas Economic Cooperation Operations (the Mid Term ODA Strategy). This strategy is planned, implemented and evaluated in accordance with the ODA Mid Term
Figure 2: Three levels of JBIC’s results-based management
I. Project Level• Ex-ante Project
Evaluation →PerformanceMonitoring Indicators
• Implementation Monitoring & Portfolio Review
• Ex-post Evaluation• Evaluation Feedback
I. ProjectLevel
II. Policy Level
III. Agency Level
JBIC conducts evaluation of ODA loan projects for the purposes of (i) improving its assistance, (ii) monitoring and feedback for effective resource allocation, and (iii) assuring accountability. As part of its results-based management system, JBIC is trying to establish a coherent evaluation system throughout the project cycle and enhance joint evaluations for capacity development of developing countries.
8
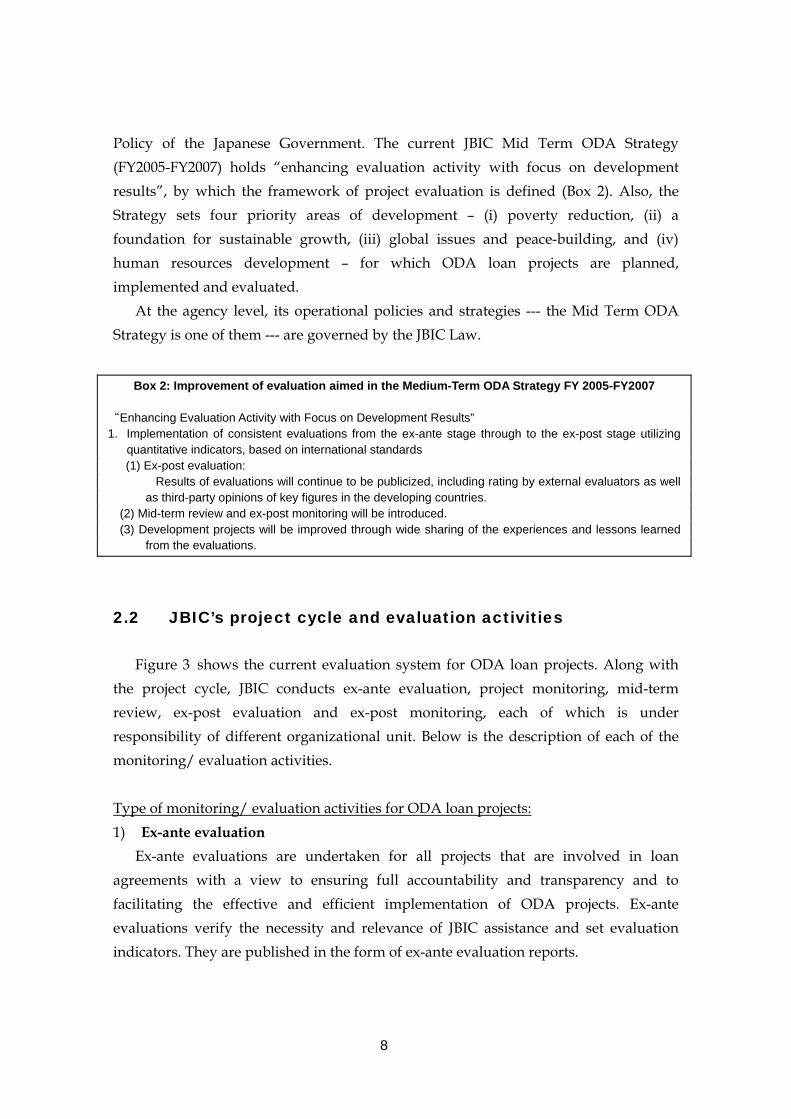
Policy of the Japanese Government. The current JBIC Mid Term ODA Strategy (FY2005-FY2007) holds “enhancing evaluation activity with focus on development results”, by which the framework of project evaluation is defined (Box 2). Also, the Strategy sets four priority areas of development – (i) poverty reduction, (ii) a foundation for sustainable growth, (iii) global issues and peace-building, and (iv) human resources development – for which ODA loan projects are planned, implemented and evaluated. At the agency level, its operational policies and strategies --- the Mid Term ODA Strategy is one of them --- are governed by the JBIC Law.
2.2 JBIC’s project cycle and evaluation activities
Figure 3 shows the current evaluation system for ODA loan projects. Along with the project cycle, JBIC conducts ex-ante evaluation, project monitoring, mid-term review, ex-post evaluation and ex-post monitoring, each of which is under responsibility of different organizational unit. Below is the description of each of the monitoring/ evaluation activities. Type of monitoring/ evaluation activities for ODA loan projects: 1) Ex-ante evaluation Ex-ante evaluations are undertaken for all projects that are involved in loan agreements with a view to ensuring full accountability and transparency and to facilitating the effective and efficient implementation of ODA projects. Ex-ante evaluations verify the necessity and relevance of JBIC assistance and set evaluation indicators. They are published in the form of ex-ante evaluation reports.
Box 2: Improvement of evaluation aimed in the Medium-Term ODA Strategy FY 2005-FY2007
“Enhancing Evaluation Activity with Focus on Development Results” 1. Implementation of consistent evaluations from the ex-ante stage through to the ex-post stage utilizing
quantitative indicators, based on international standards (1) Ex-post evaluation: Results of evaluations will continue to be publicized, including rating by external evaluators as well
as third-party opinions of key figures in the developing countries. (2) Mid-term review and ex-post monitoring will be introduced. (3) Development projects will be improved through wide sharing of the experiences and lessons learned
from the evaluations.

9
2) Mid-term review Mid-term reviews are conducted five years after conclusion of the loan agreement and prior to the ex-post evaluations that are undertaken two years after a project is completed when project effects are being more fully generated. Mid-term reviews focus on the relevance and effectiveness of project plans. Mid-term reviews will further strengthen the monitoring of the implementation stage. The review process has been applied to on-going projects since FY2004. 3) Ex-post evaluation Ex-post evaluations assess the relevance, effectiveness, efficiency, impacts, and sustainability of each project on the basis of international evaluation criteria. They are carried out for all projects two years after completion so as to ensure full accountability and to enhance effectiveness and efficiency of ODA operations. To ensure objectivity, all ex-post evaluations are carried out by the third party (external) evaluators and verified by experts from the developing countries where the concerned projects were implemented. Also, in order to fulfill
Figure 3: JBIC’s project cycle and evaluation activities
Mid-term Review
Ex-Post Evaluation
Ex-post monitoring Follow-up
Monitoring
Development Assistance
Department (DAD)
Development Assistance
Department (DAD)
-Evaluation Office-Consultants
-Evaluation Office-Consultants
Ex-Ante Evaluation(Appraisal)
DAD / Representative OfficeDAD / Representative Office
DAD / Representative OfficeDAD / Representative Office
-Evaluation Office-External Evaluator-Experts in RecipientCountries
-Evaluation Office-External Evaluator-Experts in RecipientCountries
-Evaluation Office-Consultants
-Evaluation Office-Consultants
PROJECT
CYCLE
DAD: Development Assistance Department
Box 3: Major characteristics of JBIC’s ex-post evaluation
Based on international evaluation
criteria; Undertaken entirely by external
evaluators; Ratings based on evaluation results; Including opinions of experts from
developing countries; Sharing evaluation results with
developing countries; Discussion by the Feedback
Committee including external experts in Japan;
All evaluation results are published.

10
JBIC’s responsibility to be accountable to the people, all evaluation results and the opinions from experts from developing countries are published. Chapters 3 and 4 of this handbook describe tools and procedures of ex-post evaluation for ODA loan projects. 4) Ex-post monitoring Ex-post monitoring assesses the effectiveness, impacts, and sustainability of a project seven years after completion. Following up on projects after an appreciable amount of time has passed is expected to encourage developing countries to apply the lessons learned and the recommendations outlined in the ex-post evaluation report, prepare statistical data, and establish their own mechanisms of monitoring. Ex-post monitoring has been conducted for projects that received ex-post evaluation after FY2004.
2.3 Types of JBIC’s ex-post evaluation: individual project evaluation and thematic evaluation Currently, JBIC conducts two types of ex-post evaluation – individual project evaluation and thematic evaluation. Characteristics of each type of evaluation are as follows: 1) Individual project evaluation Individual project evaluation is conducted for all projects two years after their completion. The standard evaluation criteria (DAC Five Evaluation Criteria – relevance, efficiency, effectiveness, impact and sustainability) are used, and evaluation results are rated using the four-grade rating scale (A, B, C and D). Chapter 4 of this handbook shows the procedures of individual project evaluation and rating in more detail. 2) Thematic Evaluation In addition to individual projects, JBIC conducts ex-post thematic evaluation for selected projects. In thematic evaluation, several projects are comprehensively evaluated together based on a specific theme. Themes are chosen based on the four priority areas set in the Med Term ODA Strategy (poverty reduction, a foundation for sustainable growth, global issues and peace building and human resources development) so that the lessons learned and recommendations may be obtained from a broader viewpoint and suggestions may be obtained for mid term strategies in the future. Procedures and evaluation criteria for thematic evaluation depend on each

11
evaluation.
2.4 Efforts to improve evaluation of ODA loan projects
(1) Strengthening the consistency of evaluations through introduction of mid-term reviews and ex-post monitoring JBIC has undertaken ex-post evaluations for all projects since FY2001. Moreover, JBIC decided to publish the ex-ante evaluation reports for all projects starting in FY2001, and has established a consistent evaluation system from ex-ante to ex-post evaluation using the same quantitative indicator. To further enhance the evaluation system, in FY2004 JBIC undertook, on a trial basis, mid-term reviews, which focus on relevance and effectiveness of projects, and ex-post monitoring, which assesses projects’ effectiveness, impacts, sustainability, etc. The current practice of JBIC’s monitoring and evaluation activities at different stages of the project cycle are summarized in Table 1 and Table 2.
Table 1: Type and timing of individual project evaluation of ODA loans Type of Evaluation Timing Target Projects
Ex-Ante Evaluation Prior to loan agreement All projects
Mid-Term Review 5th year after loan agreement 13 projects in FY2006
Ex-Post Evaluation 2nd year after project completion All projects
Ex-Post Monitoring 7th year after project completion 10 projects in FY2006
Table 2: DAC five evaluation criteria and their use at different evaluation stages DAC five
evaluation criteria
General description Ex-ante
evaluationMid-term review
Ex-post evaluation
Ex-post monitoring
Relevance Consistency of project objectives with development priorities and policies
Efficiency Efficiency of converting inputs to
outputs
Effectiveness Achievement of project purpose by use of outputs
Impact Direct and indirect project effects
including achievement of overall goals
Sustainability Continuity of project benefits in
medium and long term

12
Furthermore, JBIC has been replacing the reporting format at each stage of the project cycle – the project memorandum (planning stage), progress reports (implementation stage), and the project completion report (completion stage) – with a standard format called the Project Status Reports (PSR) to ensure consistency and to reduce costs for report preparation.
(2) Improvement of projects through feedback of evaluation results JBIC is constructing a mechanism for feedback of lessons learned and recommendations obtained from ex-post evaluations to new projects and projects in progress. Specifically, the evaluation results of similar past projects are reflected in ex-ante evaluations and Special Assistance Facility (SAF), and this leads to
Box 4: Table of contents of Project Status Report (PSR) 1. Project Description (Relevance) For each of the sections below, state original and the modification with reasons. 1-1 Project Objective 1-2 Necessity and Priority of the Project 1-3 Rationale of the Project Design (Timing, scale, technology of the project) 2. Project Implementation (Efficiency) For each of the sections below, state original and actual with reasons for modifications, if any. 2-1 Project Scope 2-2 Implementation Schedule 2-3 Project Cost 2-4 Organizations for Implementation (with performance of consultants and contractors) 2-5 Precautions (Measures to be adopted/ points which require special attention) 2-6 Photographs of output of the project (Attachment) 3. Benefit Derived from the Project (Effectiveness) 3-1 Operational and physical condition of each facility developed/ supplied by the project 3-2 Precautions (Measures to be adopted/ points which require special attention) 3-3 Environmental and Social Impacts (Issues and actions/ countermeasures taken) 3-4 Qualitative and Quantitative Data of Monitoring Indicators (original, target, actual) 3-5 Monitoring Plan for the Indicators (original and actual) 3-6 Achievement of the Project Objective 4. Operation and Maintenance (Sustainability) For each of the sections below, state original and actual 4-1 O&M and management 4-2 O&M Cost and Budget 5. Evaluation 5-1 JBIC and Borrower/ Executing Agency Performance 5-2 Overall Evaluation 5-3 Lessons Learned and Recommendations

13
improvements in projects. Moreover, based on ex-post evaluation results, the developing country and JBIC work to make the necessary improvements in projects, and the effects of these efforts are verified by ex-post monitoring. However, when there are concerns over the realization of effects, etc., SAPS (which is a part of SAF) and other studies will be undertaken to support the efforts of developing countries to ensure sustainability.
(3) Improving the quality of evaluations through cooperation with universities JBIC involves universities in evaluation work to utilize their academic resources and thereby to improve the quality of evaluation. Types of cooperation from universities include (i) undertakings of ex-post evaluation, focusing on impact evaluation in many cases, and (ii) development of curriculum and teaching materials on evaluation training and the conduct of training courses.
(4) Expanding participation of developing countries in evaluations (through joint evaluations) JBIC is active in evaluation capacity building for developing countries. In addition to regular holding of evaluation seminars inviting planning and executing agencies of developing countries, JBIC is promoting joint evaluations with the aim of having developing countries undertake evaluations themselves. In joint evaluations, the developing countries’ planning agencies, the executing agencies, etc. participate in the evaluation, and an external evaluator transfers to them the methods of data collection and analysis. There are also cases where the developing country draws up an action plan for the building of an evaluation system. The benefits of the joint evaluation system include (i) technology transfer (basic evaluation implementation in accordance with the five DAC evaluation criteria, (ii) strengthening of ownership by the developing countries (increased awareness of the evaluations), and (ii) system
coherence (study concerning introduction of JBIC’s evaluation system, including ratings). The need is large for development project evaluations in developing countries, and topics for the future include training of evaluation specialists in developing countries as well as building of evaluation systems that incorporate developing countries’ existing systems concerning endeavors to improve the evaluation systems of developing countries through joint evaluations.)
14
(5) Aiming for High Quality Impact Evaluations with Wide Application As mentioned in Chapter 1, there is an increasing need for rigorous and high quality impact evaluation. To increase accountability and provide useful references for the project formation in the future, JBIC is presently devoting efforts to strengthen its impact evaluations that will identify the effects of ODA loan projects in detail. Recent efforts include (i) organization of Impact evaluation Workshops, (ii) knowledge-sharing at the Evaluation Society, and (iii) development of Impact Evaluation Design Manuals. This is the end of Chapter 2. From this chapter, you have learned:
Why does JBIC conduct evaluation of its ODA loan project? What kind of evaluation activities JBIC undertakes in its project cycle? What are the main features of JBIC’s recent efforts to improve its ODA
evaluation activities?

15
Chapter 3: Tools of ODA Loan Evaluation
3.1 Logical Framework (1) Definition and structure of logical framework A logical framework (logframe) is a project summary chart which arranges the essential projects in a four by four matrix. The methodology of using a logframe to plan, implement and evaluate a project is generally known as the “Logical Framework Approach” (LFA)7. The general structure of the logframe is shown in Table 3: .
Table 3: General composition of the Logical Framework Summary Indicators Means of Verification Assumptions
Goal (Impacts) Long-term development effects
Measures for Goal
Data sources for Goal indicator
Purpose (Outcome) Direct benefits of the project
Measures for Purpose
Data sources for Purpose indicator
External conditions to achieve Goal
Outputs Goods and services produced by the project
Measures for Outputs
Data sources for Outputs indicators
External conditions to achieve Purpose
Activities Project actions to produce Outputs
Inputs Resources used in Activities to produce Outputs
External conditions to produce Outputs
The central concept of the logframe lies in the causal relationships on the four levels
7 The logframe was developed by the US Agency for International Development (USAID) in the 1960s, and went on to be adopted by UN agencies, the World Bank and many bilateral aid agencies. JICA has basically used this method for the planning, implementation and evaluation of all technical cooperation projects since 1994. Extended forms of LFA have been developed under names such as the Project Cycle Management (PCM) method. PCM method, which is used in many projects, emphasizes consensus building between all parties concerned in the project and carries out project planning, monitoring and evaluation processes that incorporate methods such as participatory workshops and analytical tools.
Tools that are widely used in ODA loan project evaluation include (i) logical framework, (ii) performance indicators (in JBIC, more specifically, operation and effect indicators), (iii) cost benefit analysis (calculation of economic and financial internal rates of return) and (iv) social analysis with various quantitative and qualitative data collection methods.

16
in the left-hand “summary” column, namely “Goal”, “Purpose”, “Outputs” and “Activities ” . The combination of these four and the “Assumptions” in the fourth column provides a systematic form to express “what is the project being carried out for?” and “what is necessary for the achievement of project objectives?”. This is called the “logic model” or “vertical logic” of the logframe (Figure 4). Different agencies in donor and partner countries use different formats of the logframe, but the basic concept is the same. JBIC uses the idea of logframe in some ex-post evaluation such as joint evaluation, where there is a need to share understanding among different stakeholders (Table 4).
(2) The use of logical framework in project evaluation The greatest advantage of using a logframe in evaluation is that the clear arrangement and definition of objectives and outputs in terms of measurable indicators produces well defined evaluation subjects and criteria. 1) Use of the logframe in ex-ante evaluation It is the ex-ante evaluation stage where the logframe is most useful: by formulating the logframe, the evaluator or planner could check the logical relationships among the essential project components, assess the likely values of the project, and improve the project plan accordingly. Currently, JBIC does not use the logframe directly in project planning, but a project plan summary (ex-ante evaluation sheet) based on the logframe is prepared at the ex-ante evaluation stage. 2) Use of the logframe in ex-post evaluation At the ex-post evaluation stage, points of evaluation could be determined in an exhaustive manner by relating the DAC five evaluation criteria (i.e., relevance, efficiency, effectiveness, impact and sustainability) to different levels of the project objectives, outputs and inputs (Figure 5). Even if the logframe does not exist before the ex-post evaluation, the formulation of the logframe, at least the “Summary” column, is needed to clarify what to decide the bases of the evaluation of “effectiveness” (i.e., what is the project purpose?), “impact” (what is the overall goal?), etc. For more details, see Chapter 4, “4.1 Work flow of ex-post evaluation of ODA loan projects, (2)
Figure 4: Vertical logic of the logframe
(for Outputs)Activities
(for Purpose)
Outputs
(for Goal)Purpose
GoalAssumptionsSummary
(for Outputs)Activities
(for Purpose)
Outputs
(for Goal)Purpose
GoalAssumptionsSummary

17
Preparing the evaluation design sheet, 1) Review of the project outline and construction of the logical framework”.
Table 4: JBIC’s Logframe (Most common format used in the past)
Country:
Project title: (L/A No. )
Executing Agency: Performance Indicators and target values
Project Summary Indicators Targets
Data Sources for actual
performance
Assumptions (Points to be Considered)
Overall Goal (Impacts) Long-term development effects
Measures for Overall Goal
Targets for Goal indicators
Data sources for Goal indicators
Project Purpose (Outcome) Direct benefits of the project
Measures for Project Purpose
Targets for Project Purpose indicators
Data sources for Project Purpose indicators
Necessary conditions for Overall Goal
Outputs Goods and services produced by the project
Breakdown of Outputs
Planned scale/ amount of Outputs
Data sources for Outputs indicators
Necessary conditions for Project Purpose
Inputs Project costs
Implementation Schedule Planned schedule of implementation
by work category
Data sources for project costs and schedule
Necessary conditions for Outputs
Figure 5: Relating the DAC five evaluation criteria to the logframe for project evaluation
Outputs
Effectiveness
Impact
Efficiency
Relevance
Sustainability
Inputs
Project Purpose(Outcomes)
Overall Goal (Impacts)
Policy
Program
Needs for the project
e.g. Economic growth
e.g. Enhance power supply stability
e.g. Power plant constructed/operated
Activities
Project outlines

18
Table 5: Example of the logical frameworks used in JBIC Country : Republic of Indonesia Project title : Bali International Airport Development
Project (2) (L/A No.) IP-428 Executing Agency
: Directorate General of Air Communications (DGAC), Ministry of Communications
Project Outlines: To respond to rapidly increasing demand for air traffic with improvements in safety by developing Bali International Airport, and thereby contribute to tourism industry in Bali Province.
Performance Indicators and target values
Project Summary Indicators Targets
Data Sources for actual performance
Assumptions (Points to be Considered)
Overall Goal (Impacts) Development of tourism industry in Bali Province
1) GRDP by sector of Bali Province
2) Number of tourists 3) Income from tourism
1) N.A. 2) 6-6.5 million/year by
1999 3) 18.6% increase/year
from 1994-1999
- Bali statistical yearbook - Negative impacts to surrounding communities are continuously alleviated
Project Purpose (Outcome) 1) To respond to increasing demand for
air traffic 2) To improve safety
1-1) Number of passengers 1-2) Cargo volume 1-3) Number of takeoff and landing2-1) Number of incidents/accidents3-1) FIRR 3-2) EIRR
1-1) 8.5 million in 2005 1-2) 8,7000 tons in 2005 1-3) N.A. 2-1) N.A. 3-1) 16.1% 3-2) N.A.
- DGAC - Beneficiary survey - National airport
company (PTAP)
- Proper operation and maintenance of the project facilities/ equipment
Outputs 1) Civil works 2) Architectural works 3) Air safety facilities 4) Utility works
1-1) Expansion of aprons 1-2) Development of taxiways 2-1) Expansion of international
passenger terminal building 2-2) Expansion of domestic
passenger terminal building 3-1) ATS system 3-2) Airfield lighting system 4-1) Expansion of power supply
system
1-1) West side 15,600m2 Center 25,800m2 East side 19,710m2 1-2) East side 14,710m2 2-1) 22,060m2 2-2) 9,180m2 4-1) 2 generators, power
distribution system, etc.
- PCR - DGAC
- Cooperation of a Hindi temples to be relocated and of its supporters (communities)
Inputs 13,901 million yen (JBIC 11,816 million yen)
Implementation Schedule 1) Consulting services July 1995 – January 2001 2) Construction November 1995 – January 2000 3) Warranty period January 2001
- PCR - DGAC
19
3.2 Performance indicators
(1) The use of performance indicators in development assistance Performance indicators (also called performance monitoring indicators) are criteria for evaluating the achievement of objectives by public policies and public works. Continuous measurement of performance indicators for policies and projects from the planning stage (ex-ante) through completion (ex-post) allows consistent gathering of information on their performance. This information gathering, and the use of the results to improve administration and operation, is called performance measurement8. It is widely used as an effective administrative management tool in the U.S. and elsewhere. In 2002, JBIC introduced its “Performance Measurement for Strategic Management” as an evaluation system for all its operations, including ODA loan operations. “Performance Monitoring Indicators: A Handbook for Task Managers” 9 , published by the World Bank in 1996, defines performance indicators as “measures of project impacts, outcomes, outputs, and inputs that are monitored during project implementation to assess progress towards project objectives”. For example, measures of output are “output indicators”, measures of outcomes are “outcome indicators”, and so on (See Annex for more varieties of performance indicators). The following common characteristics, among others, can be observed in the ways performance indicators are used in development assistance projects by many aid agencies 1) First the hierarchical cause and effect relationships are defined (the “vertical logic”
of the project summary of a logframe, see the previous section of this chapter) between inputs, activities, outputs, outcomes10 and impacts.
2) Within that hierarchy, the emphasis is not confined to monitoring “what did the project do?” in the input ~ output range, but extends to “what were the results of what the project did, and what did the project change for beneficiaries and the target economy and society”.
8 Performance measurement is called “performance evaluation” within the Policy Evaluation System introduced in central ministries in Japan. 9 World Bank (1996) Performance Monitoring Indicators: A Handbook for Task Managers. (http://www.worldbank.org/html/opr/pmi/contents.html) This instructive handbook explains the thinking behind performance indicators, how they are used and other aspects, as well as reporting many examples of indicators for each sector. 10 The outcomes (changes in the target social and economic situations that occur as a result of the outputs) of policies and projects are often the primary subject of performance indicators.

20
3) Baseline data is defined and collected before the project begins, and data collection continues consistently through project implementation and on to the ex-post stage.
(2) Operation and effect indicators – JBIC’s performance indicators in project management JBIC introduced operation and effect indicators in 2000 as performance indicators to enable project monitoring and evaluation on the basis of consistent indicators used from the ex-ante to ex-post stages. Operation and effect indicators are defined as follows. They are both basically equivalent to outcome indicators among the performance indicators used by the World Bank. In the logframe for ODA loan project, they are basically recorded as indicators for “project purpose”11.
11 This does not mean that indicators other than “outcome indicators" are not measured in ODA loan projects. Evaluation always involves the investigation of indicators to measure input (input value), indicators to measure output (in most cases the scale and specification of the facilities and equipment built or procured), and indicators to measure impact (different indicators are set depending on the project).
Figure 6: Example of relating performance indicators to the logic model: Port of Constantza-South Development Project
Long termdevelopment effects
Direct benefitsof the project
Goods and servicesproduced by theproject
Actions to convertinputs to outputs
Resourcesused in the project
Impact (Goal)Economic development of Romania
Outcomes (Purpose)Meeting the demand for increasing
container cargo traffic
OutputsContainer terminal and related facilities
ActivitiesCivil works, equipment procurement &
consulting services
Inputs17,067 million yen
(JBIC 12,800 million yen)
Impact Indicators- GDP growth rate, trade statististics, employment indicators- Indicators on domestic container transport
Outcome Indicators- Container handling volume- Gross tonnage of vessels- Berth occupation rate, etc.

21
Definition of operation and effect indicators: 1) Operation indicator: An indicator to measure, quantitatively, the operational
status of a project. 2) Effect indicator: An indicator to measure, quantitatively, the effects generated by a
project. In the logframes for ODA loan projects, two levels of matters are often written in the “project purpose” as a result of the facilities and equipment (outputs) built or procured by a project: (i) The outputs are operated and used appropriately and (ii) they have effects on the beneficiaries or target region. Operation indicators apply to (i) and effect indicators to (ii) (Figure 7).
JBIC has prepared “The Reference of Operation and Effect Indicators” as a working reference book for the setting of these indicators. The handbook lists operation and effect indicators that could be used in 19 representative sectors, with their definitions and points to consider in their selection. At the appraisal stage, JBIC staff, in consultation with the counterpart executing agency, selects suitable indicators from the handbook for the project concerned. Table 6 lists typical operation and effect indicators for several sectors. For some of them it is hard to define whether they are operation indicators or effect indicators. Flexible categorization on these should be made for each individual project.
Table 6: Sample Operation and Effect Indicators Sector name Typical Operation indicators Typical effect indicators
Irrigation Actual irrigated area (ha) Production volume of major crops (tons) Power generation Utilization factor (%) Net electric energy production (kWh) Flood control Annual highest water level (m) Annual maximum inundated area by levee
breach or overflow (km2)
Figure 7: Logframe and operation and effect indicators
Activities
Outputs
Project purpose indicators
Project Purpose
Goal
Activities
Outputs
Project purpose indicators
Project Purpose
Goal
Project Purpose(Outcome)
Outputs
Measured by effect indicators
Measured byoperation indicators
Use

22
Sector name Typical Operation indicators Typical effect indicators
Water supply Water supply volume (m3/day) Percentage of served population (%) Port Freight volume (ton or TEU/year) (Note) Reduction in average waiting time (minutes)Road Annual average traffic volume (no. of
vehicles/day) Reduction in transport times (hours/year)
Note: This is also an important effect indicator, as it indicates an increase in freight that can be handled by port users. JBIC conducts and makes public ex-ante evaluations of all projects for which the appraisal was conducted in 2001 or later. The Ex-ante Project Evaluation Reports set and use operation and effect indicators, and in principle the existing indicator values, target values and achievement schedules are stated (Table 7 shows an example, and Box 20 in Chapter 5 shows the format of the ex-ante evaluation report). At the time of the appraisal, JBIC and the executing agency agree on the setting of indicators. The following indicates general criteria for setting appropriate indicators. 1) Validity: Are the set indicators really able to measure the achievement of the
project purpose? 2) Reliability: Will the set indicator data yield the same - results, regardless of how
many times they are measured and regardless of who makes the measurements? 3) Ease of access: Will it be easy to access the indicator data set for the project? Are
there too many indicators, considering the cost and time required to gather them?
Table 7: Example of the use of operation and effect Indicators in the ex-ante project evaluation
“Arterial Road Links Development Project (VI)” in the Philippines
Indicator name Road name Baseline (2001)
Target (2009)
[1] Section between A and B 1,088 1,570Operation Indicators
Increase in traffic volume (vehicles/ day) [2] Section between B and C 932 1,342
[1] Section between A and B -- 164.90Decline in travel costs (millions of Pesos/ year) [2] Section between B and C -- 125.63
[1] Section between A and B 1.6 1.03Effect Indicators
Reduction in travel time (hours) [2] Section between B and C 1.17 0.75
After the initiation of the project, the executing agency is requested to measure and record the actual performance of the operation and effect indicators for the mid-term review, ex-post evaluation and ex-post monitoring until the seventh year after the project completion. The record of the actual performance is used to evaluate effectiveness of the project.

23
3.3 Cost benefit analysis Cost-benefit analysis is a method for evaluating cost performance of a project by estimating the costs and benefits of project implementation, expressing them as monetary values, and comparing them. Its main indicators are Net Present Value (NPV) and Internal Rate of Return (IRR). In project appraisals (ex-ante evaluation), JBIC calculates financial internal rate of return (FIRR) or economic internal rate of return (EIRR), or both. 1) Net present value (NPV): the present value of all cash inflows (benefits) minus the
present value of all cash outflows (costs) for the project. A present value is the value of future cash flows that is discounted to the value at the time of the investment using a specific discount rate (expected rate of return). A positive NPV (i.e., NPV is greater than zero) indicates that the project has an investment value.
2) Internal rate of return (IRR): any discount rate that results in a NPV of zero, and is usually interpreted as the size of the benefit generated by the project. IRR has the following variations: Financial internal rate of return (FIRR): cash inflows are estimated as the financial benefits (revenues) from the project. Economic internal rate of return (EIRR): cash inflows are estimated as the benefits of the project to the national economy (i.e., value-added by the project.
NPV can be calculated as follows: PVn = CFn / (1+r) n r = discount rate n = number of terms (e.g. year) CFn = cash flow at the nth term PVn = present value of cash flow at the nth term NPV = PV0 + PV1 + …. + PVn IRR = r where NPV = 0.
For example, when a one-year project with the project life (lifetime of the facilities, etc. developed by the project) of five years is likely to produce the cash flows (benefits minus costs) of -100 dollars in the year of investment, +20 dollars in the first year after the project completion, +20 dollars in the second year, +30 dollars in the third year, +40

24
dollars in the forth year and +50 dollars in the fifth year12, the NPV and IRR are as follows: Year of investment (Year 0) CF0 = -100 PV0 = -100 1st year after completion (Year 1) CF1 = 20 PV1 = 20 / (1+r)1 2nd year (Year 2) CF2 = 20 PV2 = 20 / (1+r)2 3rd year (Year 3) CF3 = 30 PV3 = 30 / (1+r)3 4th year (Year 4) CF4 = 40 PV4 = 40/ (1+r)4 5th year (Year 5) CF5 = 50 PV5 = 50 / (1+r)5 NPV = -100 + 20 / (1+r)1 + 20 / (1+r)2 + 30 / (1+r)3 + 40/ (1+r)4 + 50 / (1+r)5
When r ≈ 0.15, NPV ≈ -100 + 17.4 + 15.1 + 19.7 + 22.9 + 24.9 = 0 Thus, IRR ≈ 15% Calculation of FIRR is made for projects that have fee income, such as toll roads and power stations. EIRR is calculated wherever possible, but it is often omitted for projects in fields such as education and health, where it is difficult to monetarize and quantify the benefits. At the ex-post evaluation stage, the actual values of FIRR and EIRR are calculated using the same basis applied for the calculations at the time of the appraisal, as indicators for evaluating achievement of the project purpose13. The basic steps of re-calculation of FIRR and EIRR are as follows: 1) Identify the project framework to apply the same assumptions on cost and benefit
as those used at the appraisal. 2) Set a project life (i.e. lifetime of the project outputs). Evaluation period is the
period from the first year of the project investment until the last year of the project life.
3) Identify annual costs and benefits during the evaluation period.
12 This example is very much simplified for easy understanding. Usually, the project life (the lifetime of the project outputs) is much longer such as 20 years or 40 years after the completion in infrastructure development projects. 13 ADB and other agencies use IRR as an indicator for “efficiency” in the five evaluation criteria. JBIC, however, considers that IRR is a very important indicator for judging not only “efficiency” but also the overall success or failure of the project. This is because the verification of IRR in the evaluation reflects the benefits that are being achieved, as well as the future sustainability of these benefits.

25
4) Transform nominal prices into real prices (constant price of the base year) in order to exclude the inflation factor during the long project life.
5) For EIRR calculation, convert the “market prices” to “economic prices” to eliminate the effects of price distortion.
6) Calculate the cash flow (net benefits) by deducting costs from benefits. 7) Calculate the EIRR and FIRR. Use of computer software (e.g. Microsoft Excel) is an
easy way of calculation. If the values differ substantially from those calculated at the time of the appraisal, the cause is analyzed. Likely reasons include increased or decreased project costs and high or low levels of achievement of the project purpose. As numerical indicators, FIRR and EIRR are very clear, but the problem is that completely different results can be generated by changing the setting of cost and benefit items and their estimated values. Therefore when these values are used in evaluation, the analytical basis must be clearly stated alongside the calculation results. Box 5 shows an example of the re-calculation of FIRR and EIRR in ex-post evaluation. For detailed procedures of IRR calculation, see Annex 4.

26
Box 5: Example of re-calculation of FIRR and EIRR at ex-post evaluation Bali International Airport Development Project Phase II in Indonesia
In the ex-post evaluation of the project in 2003, the FIRR and EIRR of this project were recalculated using data obtained during the course of this evaluation. The FIRR worked out at 14.3 percent, which is on a par with the 14.2 percent estimated at appraisal. The project’s EIRR was not calculated at appraisal, but foreign currency spending by international tourists and time savings made by Indonesian passengers, as project benefits, were recorded in as much detail as possible to yield an estimated value of 19.3 percent. For the calculation of benefits, the results through August 2003 were used for the data on passenger numbers, with the growth rate in demand forecasts made in 2000 used to estimate the numbers thereafter. Accordingly, the impact of the terrorist bombings of October 2002 and of SARS in the early half of 2003 is reflected in the figure.
EIRR/ FIRR Re-calculation Terms Project life: 20 years from opening of facilities
Method used for Taking the year of project completion as the base year, calculating domestic and foreign currency costs were converted to constant prices: discounted constant prices using the consumer price index (CPI). Foreign currency-denominated constant prices were converted to local currency-denominated prices using the exchange rate for the base year.
Costs: Project costs, O&M costs (O&M costs for the Phase II Facilities estimated based on floor area of main facilities). NB. It was not possible to obtain data on investment Amounts for individual facilities, thus percentage area Ratio of facilities was used.
EIRR benefits: (i) Amount spent by incremental foreign tourists now able to visit Bali as the result of the project, (ii) time savings made by Indonesian passengers (substituted for domestic passengers)
FIRR benefits: Airport revenues (contribution of the Phase II project Estimated using floor area of main facilities: 39% which Is equivalent to the Phase I/ Phase II investment ratio)
27
3.4 Social Analysis (1) Purposes of social analysis Social analysis is a collective term for various analyses and assessments of social contexts of development policies, programs and projects. According to the World Bank, “social analysis enables the Bank to assess whether a proposed program or operation is likely to meet its social objectives and to recommend measures that will ensure that these objectives are met.”14 In general, social analysis deals with any aspect of social contexts and can be carried out at any stage of the project/program cycle. The stages where social analysis is most needed are appraisal and design stages. Among them, the use of social analysis in evaluation of development assistance tends to focus on analysis of social (and economic) impact of development intervention, which the World Bank calls “poverty and social impact analysis (PSIA)”15.
(2) Typical social analysis tools for evaluation of ODA loans Individual project evaluation In individual project evaluation, social analysis is often conducted for evaluating effectiveness and impact under the name of the “beneficiary survey”, focusing on the degree of satisfaction of beneficiaries and changes in their life before and after the project implementation. Since individual project evaluation covers various issues along with the DAC five evaluation criteria, social analysis is often only small part of evaluation activities. Therefore, simple quantitative and qualitative methods such as the followings tend to be used. Nevertheless, in order to contribute to development results discussed in Chapter 1, it is also important to conduct detailed analysis as much as possible by utilizing local consultants. Since FY2007, the conduct of beneficiary surveys in individual project evaluations is based on “The Reference of Beneficiary Survey”, a JBIC working reference book. 1) Simple quantitative analysis: structured (formal) questionnaire or interview survey
to the sampled beneficiaries and simple descriptive statistics such as average and frequency distribution. Questions to ask beneficiaries to recall their situation
14 World Bank (2003) Social Analysis Sourcebook: Incorporating Social Dimensions into Bank-Supported Projects. (http://www.worldbank.org/socialanalysissourcebook/) 15 For details, see the World Bank’s web-site on PSIA at http://web.worldbank.org/WBSITE/EXTERNAL/TOPICS/EXTPOVERTY/EXTPSIA/0,,menuPK:490139~pagePK:149018~piPK:149093~theSitePK:490130,00.html
28
before the project and to compare it with the current situation are most often used. Where possible, regression and cross tabulation to analyze different benefits to different types of beneficiaries or differences between beneficiaries and non-beneficiaries are useful.
2) Simple qualitative analysis: semi-structured or unstructured (informal) questionnaires or interviews and focus group discussions to limited number of beneficiaries (and non-beneficiaries), to understand the reasons behind the quantitative information.
Thematic evaluation JBIC has carried out social impact evaluation studies as part of its thematic evaluation activities. Choices of suitable tools for social analysis are rather wide compared to individual project evaluation. Some uses macro-economic models with various statistical analyses, and some uses rather qualitative and/or participatory tools such as institutional analysis and stakeholder analysis16. Box 7 shows an example of thematic evaluation using one of the social impact analysis tools.
16 Detailed description of each tool is found in the above-mentioned PSIA web-site.
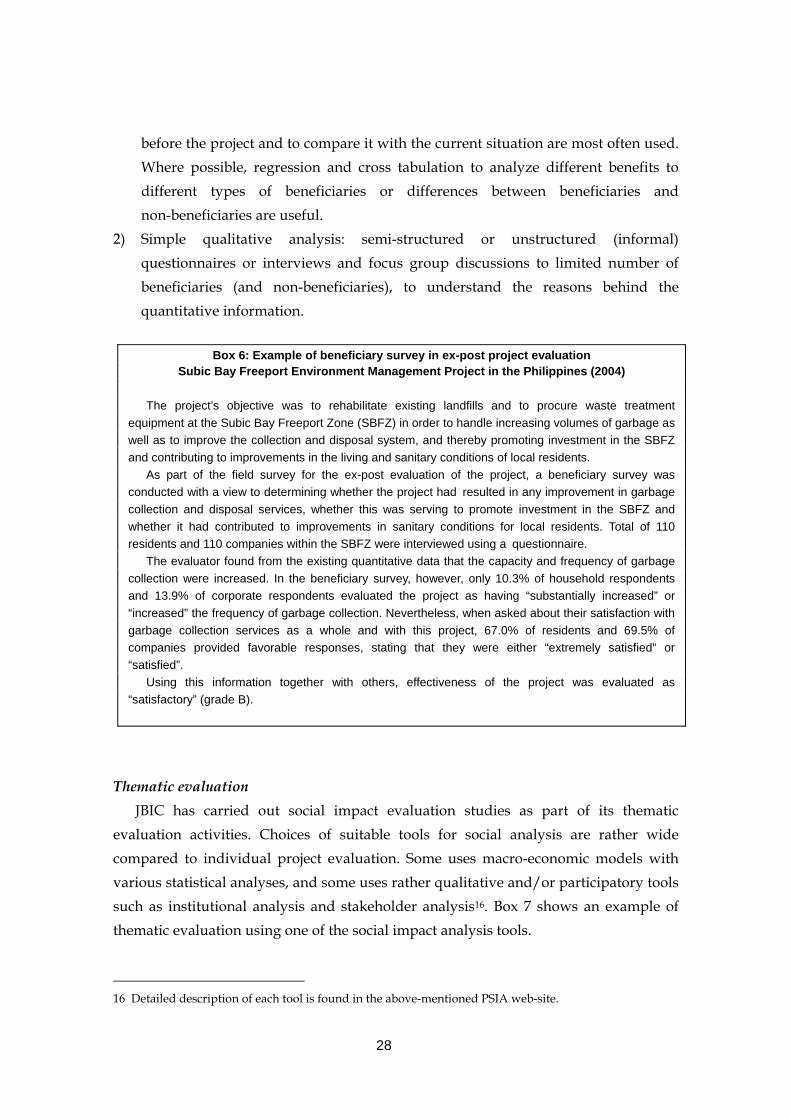
Box 6: Example of beneficiary survey in ex-post project evaluation Subic Bay Freeport Environment Management Project in the Philippines (2004)
The project’s objective was to rehabilitate existing landfills and to procure waste treatment equipment at the Subic Bay Freeport Zone (SBFZ) in order to handle increasing volumes of garbage as well as to improve the collection and disposal system, and thereby promoting investment in the SBFZ and contributing to improvements in the living and sanitary conditions of local residents. As part of the field survey for the ex-post evaluation of the project, a beneficiary survey was conducted with a view to determining whether the project had resulted in any improvement in garbage collection and disposal services, whether this was serving to promote investment in the SBFZ and whether it had contributed to improvements in sanitary conditions for local residents. Total of 110 residents and 110 companies within the SBFZ were interviewed using a questionnaire. The evaluator found from the existing quantitative data that the capacity and frequency of garbage collection were increased. In the beneficiary survey, however, only 10.3% of household respondents and 13.9% of corporate respondents evaluated the project as having “substantially increased” or “increased” the frequency of garbage collection. Nevertheless, when asked about their satisfaction with garbage collection services as a whole and with this project, 67.0% of residents and 69.5% of companies provided favorable responses, stating that they were either “extremely satisfied” or “satisfied”. Using this information together with others, effectiveness of the project was evaluated as “satisfactory” (grade B).
29
This is the end of Chapter 3. From this chapter, you have learned:
What is the use of logical framework (or logic model) in evaluation? What is the use of performance indicators, particularly “operation and effect
indicators” in evaluation? What is the use of cost-benefit analysis in evaluation? What is the use of social analysis in evaluation?
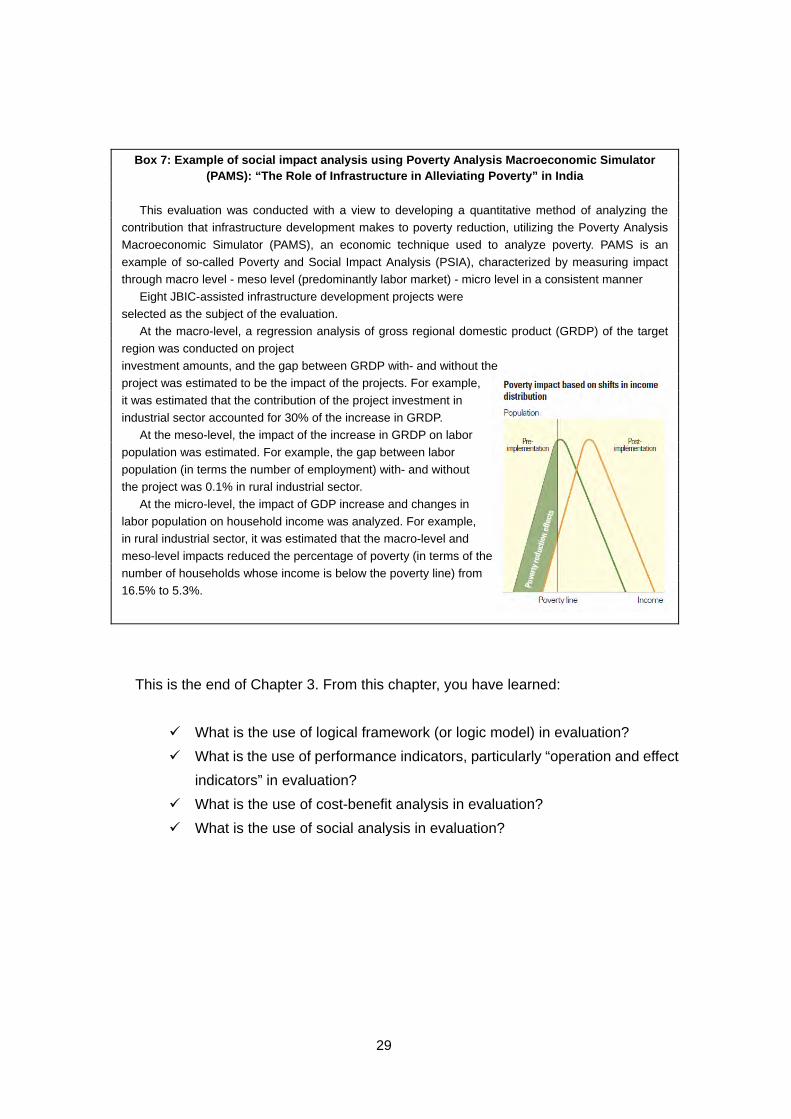
Box 7: Example of social impact analysis using Poverty Analysis Macroeconomic Simulator (PAMS): “The Role of Infrastructure in Alleviating Poverty” in India
This evaluation was conducted with a view to developing a quantitative method of analyzing the contribution that infrastructure development makes to poverty reduction, utilizing the Poverty Analysis Macroeconomic Simulator (PAMS), an economic technique used to analyze poverty. PAMS is an example of so-called Poverty and Social Impact Analysis (PSIA), characterized by measuring impact through macro level - meso level (predominantly labor market) - micro level in a consistent manner Eight JBIC-assisted infrastructure development projects were selected as the subject of the evaluation. At the macro-level, a regression analysis of gross regional domestic product (GRDP) of the target region was conducted on project investment amounts, and the gap between GRDP with- and without the project was estimated to be the impact of the projects. For example, it was estimated that the contribution of the project investment in industrial sector accounted for 30% of the increase in GRDP. At the meso-level, the impact of the increase in GRDP on labor population was estimated. For example, the gap between labor population (in terms the number of employment) with- and without the project was 0.1% in rural industrial sector. At the micro-level, the impact of GDP increase and changes in labor population on household income was analyzed. For example, in rural industrial sector, it was estimated that the macro-level and meso-level impacts reduced the percentage of poverty (in terms of the number of households whose income is below the poverty line) from 16.5% to 5.3%.

30

31
Chapter 4: Procedures of Ex-post Evaluation of ODA Loan Projects
4.1 Work flow of ex-post evaluation of ODA loan projects The procedures for ex-post evaluation of ODA loan projects can be broadly divided into four steps: (i) evaluation design, (ii) data collection, (iii) data analysis and (iv) reporting. Figure 8 shows the contents of each step. This work flow is a current standard, but it may be modified as appropriate to suit the purpose of the ex-post evaluation or constraints on its time and budget. Furthermore, the works are not necessarily carried out in the sequence shown in the figure. Multiple tasks can proceed in parallel, and the plan can be revised in light of new information obtained through data collection and analysis activities. Regarding beneficiary surveys conducted as part of evaluation of effectiveness and impact, JBIC incorporated the standard procedures provided in “The Reference of Beneficiary Surveys” to each relevant step of ex-post evaluation, in order to promote high-quality assessment.
In the sections below, each work is described, which are followed by the descriptions of each of the DAC five evaluation criteria (relevance, efficiency,
Figure 8: Work flow of ex-post evaluation of ODA loan projects
Evaluation Design
Data Collection
Data Analysis
Reporting
Outputs of the work * prepared by JBIC
1) Terms of reference *2) Evaluation design sheet3) Questionnaires/ other survey instruments
4) Answers to the questionnaires/ interviews; documentation; statistics, photographs, etc.
5) Evaluation summary sheet
6) Evaluation report
Procedures of beneficiary survey * prepared by JBIC
1) Allocate cost for beneficiary survey in contract with the evaluator *2) Select local consultant in social analysis3) Identify all stakeholders4) Specify groups to be surveyed5) Sample respondents6) Decide size of samples7) Decide methods of survey including fieldwork8) Prepare questionnaires
9) Conduct survey
10) Prepare survey report and follow up with data collected

32
effectiveness, impacts and sustainability), the standard evaluation criteria for ex-post evaluation of ODA loan projects.
(1) Setting the evaluation framework (terms of reference) At the beginning of each fiscal year, JBIC lists up the projects to be evaluated and prepare terms of references for each evaluation. The following information is included in the terms of reference (see Annex 1 for sample terms of reference): 1) Purposes of evaluation; 2) Scope of work; 3) Evaluator; and 4) Time frame and budget.
(2) Preparing the “evaluation skeleton” Once the evaluator is selected and the evaluation work is started, the evaluator prepares, in consultation with JBIC, a form called the “evaluation skeleton”. The evaluation skeleton shows the overall evaluation design stating the general information on the project to be evaluated, evaluation questions, information available before data collection, data collection strategies, and so on, and serves as the roadmap of the evaluation work that was agreed by both the evaluator and JBIC. The current format of the evaluation skeleton is as per Table 8, and the past example of it is as per Table 9.

33
Table 8: Sample format of the evaluation skeleton
External Evaluator: (organization) (name) Country Project title (L/A No.) Approved amount Disbursed amount L/A date Final disbursement date Borrower Executing agency Consultant Contractor
Project outline
Poverty reduction Growth Global issues/
Peace Human resources development
Contribution to four priority areas (check on relevant cell)
SAF (Type, Year, TOR) F/S (Organization, Year, TOR) Technical Assistance (outline)
JICA University LGUs NGOs Others Cooperation
(outline) Other aspects of special notice (if any) Criteria Ex-ante evaluation (appraisal) (year) Ex-post evaluation (year) /
Information available before field work (PCR)
Point of evaluation
1) Consistency with policies/ needs Relevance 2) Consistency with needs 1) Outputs 2) Project period
Efficiency
3) Project cost 1) Operation and effect indicators
Indicator Baseline (year) Target (year)
2) IRR FIRR: % Cost: Benefit: EIRR: % Cost: Benefit:
Effectiveness
3) Qualitative aspects 1) Benefits to target areas/ beneficiaries 2) Environmental impact
Impact
3) Land acquisition and resettlement 1) Organizational aspect of O&M 2) Technical aspect of O&M 3) Financial aspect of O&M
Sustainability
4) O&M status Lessons and Recommendations
Rating Column (If any, describe aspects that cannot be covered by DAC Five Criteria)

34
Table 9: Example of the evaluation skeleton Evaluator: XXXXX
Country Romania Project title (L/A No) Constantza South Port Development Project (ROM-P1) Approved amount 12,800 million yen Disbursed amount 9,303 million yen L/A date February 27, 1998 Final disbursement date January 4, 2005 Borrower Romania Executing Agency National Company Maritime Ports Administration SA Constantza (MPAC) Consultant Pacific Consultant International(Japan) Contractor PENTA-OCEAN CONSTRUCTION CO., LTD., TOMEN Corporation, MITSUBISHI HEAVY INDUSTRIES LTD. (Japan) Project outline To contribute to the economic development of Romania by meeting the demand generated by the sharp increase in the country’s container cargo traffic by developing the
container terminal at Pier 2 of the South-Port zone in the port of Constantza (Romania’s largest trading port facing the Black Sea) and its related facilities.
Poverty reduction Growth Global issues/ Peace Human resources development Contribution to four priority areas
SAF F/S Technical assistance SAPROF (1996)
JICA University LGUs NGOs Cooperation
Criteria Ex-ante evaluation (appraisal) (1997) Ex-post evaluation (2006)/ Information available (PCR) Point of evaluation Relevance 1) Consistency with policies
・ Economic reform promoted since new cabinet in 1996. Dev’t of economic infrastructure is given high priority of the reform.
・ Constantza port is important issue in PIP
・ Check consistency with current national development plan, PIP and transportation development plan.
2) Consistency with needs
・ Increasing volume of container traffic made the existing container terminal in the north port full. Thus, expansion of container terminal is urgently needed.
・ Check existence of needs in relation to conditions of pots around Black Sea.
Efficiency 1) Outputs
・ Works of container berths (two berths, 14.5m x 625 m) ・ Container yard improvement (360,000 ㎡), construction of
in-harbor railroad and road ・ Building construction (Container freight station etc) ・ Equipment (3 panamax gantry cranes, 8 rubber-tire transfer
cranes, 2 rail-mounted transfer cranes, trailers, etc. ・ Consulting services (foreign 92MM and local 522.5MM)
Same as planned except the followings: Modification/ addition: a new access flyover to replace railroad intersects, additional railway trucks, larger size of gantry cranes (post-panamax class), more trailers, etc., and increase in consulting services (foreign 130MM, local 545MM) Reason for modification: to meet increasing demand
・ Obtain confirmation of EA; observe the outputs.
2) Project period February 1998 – February 2002 (4 years and 1 months)
Total: Feb 1998 – Oct 2004 (6 years and 9 months) For original scope: Sept 2003 (5 years and 8 months) Start of operation of new terminal: April 2004 Reasons for delays: unusually severe weather in winter, bankruptcy of manufacturer, additional scope.
・ Check detailed schedule with EA.
3) Project cost 17,067million yen (JBIC loan 12,800 million yen) Foreign currency 6,073 mil. Yen, Local currency 10,994 mil. Yen)
10,985 mil. Yen (JBIC loan 9,303 mil. Yen) FC 9,303 mil. Yen, LC 1,682 mil. Yen
・ Check detailed cost with EA
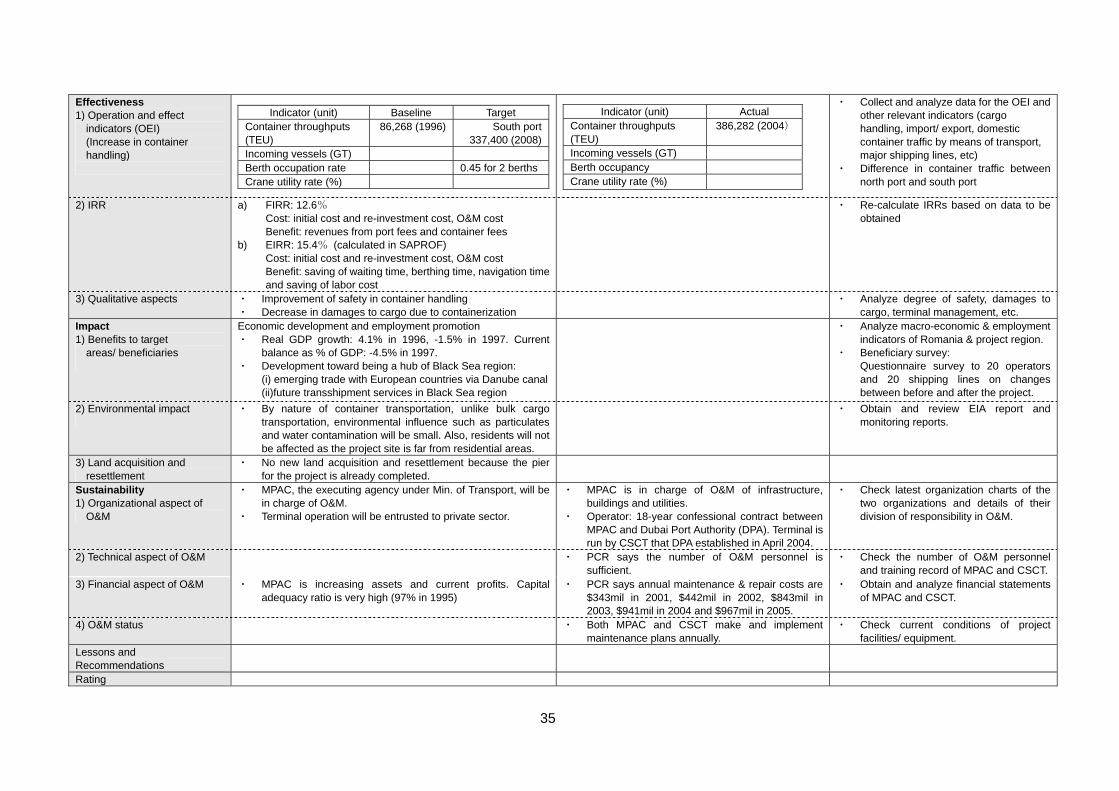
35
Effectiveness 1) Operation and effect
indicators (OEI) (Increase in container handling)
Indicator (unit) Baseline Target Container throughputs (TEU)
86,268 (1996) South port 337,400 (2008)
Incoming vessels (GT) Berth occupation rate 0.45 for 2 berthsCrane utility rate (%)
Indicator (unit) Actual Container throughputs (TEU)
386,282 (2004)
Incoming vessels (GT) Berth occupancy Crane utility rate (%)
・ Collect and analyze data for the OEI and other relevant indicators (cargo handling, import/ export, domestic container traffic by means of transport, major shipping lines, etc)
・ Difference in container traffic between north port and south port
2) IRR a) FIRR: 12.6% Cost: initial cost and re-investment cost, O&M cost Benefit: revenues from port fees and container fees
b) EIRR: 15.4% (calculated in SAPROF) Cost: initial cost and re-investment cost, O&M cost Benefit: saving of waiting time, berthing time, navigation time and saving of labor cost
・ Re-calculate IRRs based on data to be obtained
3) Qualitative aspects ・ Improvement of safety in container handling ・ Decrease in damages to cargo due to containerization
・ Analyze degree of safety, damages to cargo, terminal management, etc.
Impact 1) Benefits to target
areas/ beneficiaries
Economic development and employment promotion ・ Real GDP growth: 4.1% in 1996, -1.5% in 1997. Current
balance as % of GDP: -4.5% in 1997. ・ Development toward being a hub of Black Sea region:
(i) emerging trade with European countries via Danube canal (ii)future transshipment services in Black Sea region
・ Analyze macro-economic & employment indicators of Romania & project region.
・ Beneficiary survey: Questionnaire survey to 20 operators and 20 shipping lines on changes between before and after the project.
2) Environmental impact
・ By nature of container transportation, unlike bulk cargo transportation, environmental influence such as particulates and water contamination will be small. Also, residents will not be affected as the project site is far from residential areas.
・ Obtain and review EIA report and monitoring reports.
3) Land acquisition and resettlement
・ No new land acquisition and resettlement because the pier for the project is already completed.
Sustainability 1) Organizational aspect of
O&M
・ MPAC, the executing agency under Min. of Transport, will be in charge of O&M.
・ Terminal operation will be entrusted to private sector.
・ MPAC is in charge of O&M of infrastructure, buildings and utilities.
・ Operator: 18-year confessional contract between MPAC and Dubai Port Authority (DPA). Terminal is run by CSCT that DPA established in April 2004.
・ Check latest organization charts of the two organizations and details of their division of responsibility in O&M.
2) Technical aspect of O&M ・ PCR says the number of O&M personnel is sufficient.
・ Check the number of O&M personnel and training record of MPAC and CSCT.
3) Financial aspect of O&M ・ MPAC is increasing assets and current profits. Capital adequacy ratio is very high (97% in 1995)
・ PCR says annual maintenance & repair costs are $343mil in 2001, $442mil in 2002, $843mil in 2003, $941mil in 2004 and $967mil in 2005.
・ Obtain and analyze financial statements of MPAC and CSCT.
4) O&M status ・ Both MPAC and CSCT make and implement maintenance plans annually.
・ Check current conditions of project facilities/ equipment.
Lessons and Recommendations
Rating

36
The major tasks for preparing the evaluation design sheets include the followings. 1) Review of the project outline and construction of the logical framework The project outline is usually a single sentence describing the project objectives. This sentence contains different levels of objectives (overall goal and project purpose) as well as outputs of the logical framework. The original project outline set at the appraisal stage should be carefully reviewed at the ex-post evaluation stage in order to clearly understand what to evaluate. More specifically, levels of the project objectives and outputs must be differentiated and each level should be related to relevant evaluation criteria (Figure 9).
2) Setting evaluation questions for each of the DAC criteria Evaluation questions are individual matters to examine to evaluate the project along with individual evaluation criteria. Answers to each evaluation questions, in terms of conditions at the times of both ex-ante and ex-post evaluations, will constitute the evaluation findings and thus grounds for evaluation results. Points to look at when setting evaluation questions are described in Section 4.2 below. 3) Information available before data collection In preparing the evaluation skeleton, the evaluator refers to the project-related information archived in JBIC and fill in the columns, “Ex-ante evaluation” and “Information available before data collection (on conditions at the time of ex-post
Figure 9: Differentiation of project objectives from project outline
This project’s objective w as tocontribute to the economicdevelopment of Romania by meetingthe demand generated by the sharpincrease in the country’s containercargo traff ic by developing thecontainer terminal at Pier 2 of theSouth-Port zone in the port ofConstantza (Romania’s largest tradingport facing the Black Sea) and itsrelated facilities.
Project OutlineEconomic development ofRomania
Meeting demand forincreasing container cargotraff ic
Container terminal at Pier 2of South-Port zone in portof Constantza and itsrelated facilities
Overall goal
Project purpose
Outputs
DAC criteriaIMPACT
EFFECTIVENESS
EFFICIENCY

37
evaluation)” as much as possible. Relevant information sources include (i) the staff appraisal report and documents collected at the appraisal stage, (ii) project memorandum, (iii) contracts for the implementation of the project, (iv) progress reports, (v) project completion reports, (vi) disbursement records, and other related documents17. Also, (vii) past evaluation reports on related or similar projects published by JBIC or other organizations are often referred at this stage.
(3) Preparing questionnaires and other survey instruments Based on the evaluation skeleton, the evaluator prepares questionnaires. Usually, the following types of questionnaires are used: 1) Questionnaire for the executing
agency (for all evaluation): the central tool for data collection requesting the executing agency for the provision of data and information related to the project performance. The standard format of the questionnaire is shown in
2) Questionnaire for other related agencies (when necessary): for planning agencies, operation and maintenance agencies, supporting agencies, etc.
3) Beneficiary survey sheets (when necessary): instruments for beneficiary survey such as survey guidelines, questionnaires, interview sheet, guidelines for group meetings, etc, depending on the survey design (see Box 9).
17 For newly-implemented project after FY2004, project memorandum, progress reports and project completion report are replaced with the standardized format of “project status report (PSR)”.
Box 8: Standard composition of questionnaire for the executing agency
Cover page (survey objective, project summary) Block A: Relevance - Relevance to development policies/ programs - Relevance to needs - Relevance of project design Block B: Efficiency - Project scope (outputs) - Implementation schedule - Project costs Block C: Effectiveness - Performance of operation and effect indicators - Other quantitative and qualitative information - Re-calculation of internal rates of return (IRR) Block D: Impact - Performance of indicators for the overall goal - Other socio-economic impacts - Environmental impacts Block E: Sustainability - Operation and maintenance (O&M) agency - Technical capacity for O&M - Financial conditions for O&M - Present conditions of the project facilities Lessons Learned and Recommendations Block F: Comparison of Original Plan and Actual (table)

38
(4) Collecting data and information For each of the evaluation questions set above, the evaluator collects data and information. The typical data and information include the followings: 1) Documents available before the field visits: see “(2) 3) Information available
before data collection” above. Collection of information through internet is also very useful.
2) Answers to the questionnaire from the executing agency and other related agencies: the information might contain subjective opinions/ comments from the
Box 9: Example of beneficiary survey sheet (part of a structured interview sheet)

39
executing agency, quantitative data that it had collected/ measured such as the performance of the project implementation, operation and effect indicators and financial statements), and qualitative information such as official letters, maps, policy/ program documents.
3) Hearings from the executing agency, related agencies and other key informants: it is advised that the evaluator keeps records of the hearings and requests the informants for provision of data and information (evidence) that support what they spoke.
4) Observation/ direct measurement by the evaluator: this includes observation of the conditions of the project facilities and neighboring areas and measurement of project impacts (e.g., quality of discharged water from the project facilities). It is useful to prepare a checklist for observation before going to the field.
5) Results of formal surveys (questionnaires/ interviews): this type of data is useful for quantitative analysis of the project effectiveness and impacts (see “3.4 Social Analysis” above).
6) Results of informal surveys (questionnaires/ interviews): this type of data is useful for qualitative analysis of the factors behind efficiency, effectiveness, impact, sustainability of the project (see “3.4 Social Analysis” above).
7) Others: photographs, newspaper articles, pamphlets, etc. The methodology for each data collection activities should be decided before the field visits, but it should be flexibly adjusted at the fields according to the situation. Section 4.2 below describes suitable data collection methodology for each of the DAC evaluation criteria.
(5) Preparing the evaluation summary sheet The evaluator compiles the data/ information collected into a form called the evaluation summary sheet. As shown in Table 10, the basic structure of the evaluation summary sheet is same as that of the evaluation skeleton: the answers to evaluation questions (i.e., information used for evaluation along with each of the DAC criteria) as of both the ex-ante and the ex-post stages are set out side-by-side. Instead of the “points of the evaluation” in the last column of the skeleton, the summary sheet has the column “analysis of gaps” between the ex-ante (plan) and the ex-post (actual). Also, rating of the evaluation results is present in the sheet. In the current practice of JBIC’s ex-post project evaluation, the draft evaluation summary sheet must be commented and agreed by the executing agency and JBIC
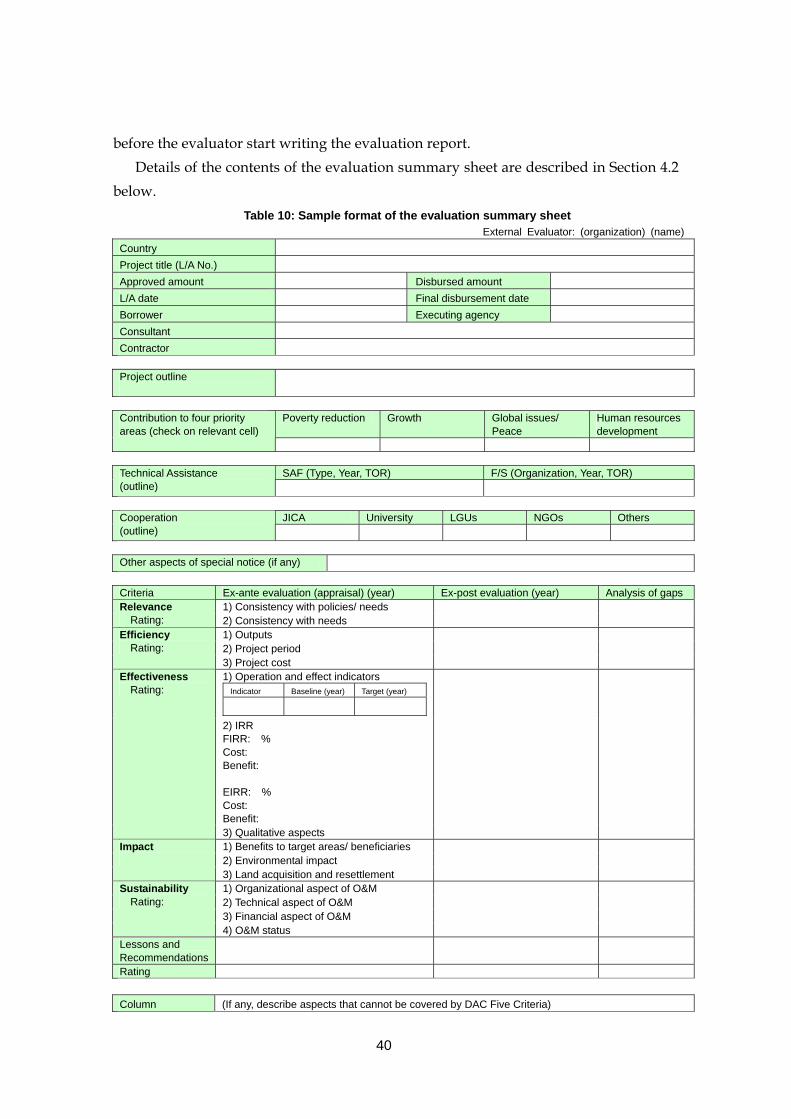
40
before the evaluator start writing the evaluation report. Details of the contents of the evaluation summary sheet are described in Section 4.2 below.
Table 10: Sample format of the evaluation summary sheet External Evaluator: (organization) (name)
Country Project title (L/A No.) Approved amount Disbursed amount L/A date Final disbursement date Borrower Executing agency Consultant Contractor
Project outline
Poverty reduction Growth Global issues/
Peace Human resources development
Contribution to four priority areas (check on relevant cell)
SAF (Type, Year, TOR) F/S (Organization, Year, TOR) Technical Assistance (outline)
JICA University LGUs NGOs Others Cooperation
(outline) Other aspects of special notice (if any) Criteria Ex-ante evaluation (appraisal) (year) Ex-post evaluation (year) Analysis of gaps
1) Consistency with policies/ needs Relevance Rating: 2) Consistency with needs
1) Outputs 2) Project period
Efficiency Rating:
3) Project cost 1) Operation and effect indicators
Indicator Baseline (year) Target (year)
2) IRR FIRR: % Cost: Benefit: EIRR: % Cost: Benefit:
Effectiveness Rating:
3) Qualitative aspects 1) Benefits to target areas/ beneficiaries 2) Environmental impact
Impact
3) Land acquisition and resettlement 1) Organizational aspect of O&M 2) Technical aspect of O&M 3) Financial aspect of O&M
Sustainability Rating:
4) O&M status Lessons and Recommendations
Rating Column (If any, describe aspects that cannot be covered by DAC Five Criteria)

41
Table 11: Example of the evaluation summary sheet Evaluator: XXXXX
Country Romania Project title (L/A No) Constantza South Port Development Project (ROM-P1) Approved amount 12,800 million yen Disbursed amount 9,303 million yen L/A date February 27, 1998 Final disbursement date January 4, 2005 Borrower Romania Executing Agency National Company Maritime Ports Administration SA Constantza (MPAC) Consultant Pacific Consultant International(Japan) Contractor PENTA-OCEAN CONSTRUCTION CO., LTD., TOMEN Corporation, MITSUBISHI HEAVY INDUSTRIES LTD. (Japan) Project outline To contribute to the economic development of Romania by meeting the demand generated by the sharp increase in the country’s container cargo traffic by developing the
container terminal at Pier 2 of the South-Port zone in the port of Constantza (Romania’s largest trading port facing the Black Sea) and its related facilities.
Poverty reduction Growth Global issues/ Peace Human resources development Contribution to four priority areas
SAF F/S Technical assistance SAPROF (1996)
JICA University LGUs NGOs Cooperation
Criteria Ex-ante evaluation (appraisal) (1997) Ex-post evaluation (2006) Analysis of gaps Relevance Rating: a 1) Consistency with policies
・ Economic reform promoted since new cabinet in 1996. Dev’t of economic infrastructure is given high priority of the reform.
・ Constantza port is important issue in PIP
・ Romania joined EU in Jan 2007. Its socio-economic development was aligned to regional development of EU. Based on NDP (2005) and EU Strategic Guidelines (2005), NRSF (2006) was prepared with priority on basic infrastructure development in EU framework & strengthening of long-term competitiveness of economy.
Importance of transportation infrastructure in national and regional development frameworks is high both at ex-ante and ex-post evaluations.
2) Consistency with needs
・ Increasing volume of container traffic made the existing container terminal in the north port full. Thus, expansion of container terminal is urgently needed.
・ Share of water transportation increased to 12% of domestic cargo transportation. Infrastructure of Danube-Black Sea canal is still poor.
・ Container handling is constantly increasing both worldwide and in Black Sea region.
(thousand TEU) 1997 2005 Total major 10 port 6,030 13,380Total Black Sea region 130 920Port of Constantza 90 770
Needs for container transportation are increasing worldwide.

42
Efficiency Rating: b 1) Outputs
・ Works of container berths (two berths, 14.5m x 625 m)
・ Container yard improvement (360,000 ㎡ ), construction of in-harbor railroad and road
・ Building construction (Container freight station etc)・ Equipment (3 panamax gantry cranes, 8
rubber-tire transfer cranes, 2 rail-mounted transfer cranes, trailers, etc.
・ Consulting services (foreign 92MM and local 522.5MM)
Same as planned except the followings: Modification/ addition: a new access flyover to replace railroad intersects, additional railway trucks, larger size of gantry cranes (post-panamax class), more trailers, etc., and increase in consulting services (foreign 130MM, local 545MM)
Infrastructures and buildings were completed almost as planned. Additional facilities were constructed. Container handling equipment increased in size and volume. Reasons for additional infrastructures: Earlier implementation of Phase 2 of the port development plan; to ease railway congestion Reasons for additional equipment: To handle large scale container vessels
2) Project period : b February 1998 – February 2002 (4 years and 1 months)
Total: Feb 1998 – Oct 2004 (6 years and 9 months) For original scope: Sept 2003 (5 years and 8 months) Start of operation of new terminal: April 2004 .
139% of plan (for original scope only) Reasons for delays: ・ 8 months delays due to delayed start of
consulting services ・ 6-8 months delays in civil works due to
serious weather in 2002/03 winter ・ 3 months delays in equipment procurement
due to bankruptcy of tractor manufacturer. 3) Project cost: a 17,067million yen (JBIC loan 12,800 million yen)
Foreign currency 6,073 mil. Yen Local currency 10,994 mil. Yen)
10,985 mil. Yen (JBIC loan 9,303 mil. Yen) FC 9,303 mil. Yen LC 1,682 mil. Yen
64% of plan (for original and additional scopes) Reasons for under run: ・ Cost decreased by 1,775mil yen for civil
works and 2,542mil yen for equipment due to competitive bidding.
・ Taxes decreased by 2,542mil yen as import for port development became tax-free in 2003
Effectiveness Rating: a 1) Operation and effect
indicators (OEI) (Increase in container handling)
Indicator (unit) Baseline Target Container throughputs (TEU)
86,268 (1996) South: 337,400 (2008)
Cargo volume (mil ton) Container 0.7 Bulk 28.3 Non-bulk 5.8
Gross tonnage of incoming vessels
Maximum cargo tonnage
Feeders only
Berth occupation rate 0.45 (2 berths) Crane utility rate
・ Container throughputs and volume of incoming vessels both increased in South Port, and already reaching capacity even with self-financed expansion work. Transshipment increased sharply.
Indicator (unit) Actual (year) Container throughputs (TEU) South: 871,000 (2006) Cargo volume (mil ton) Whole port:: container 9.8, bulk
42.7, non-bulk 4.8 (2007) Gross tonnage of incoming vessels (mil ton)
852 (2005)
Maximum cargo tonnage (ton) 61,749 (Post-panamax class) Average TEU/vessel 1,172 Berth occupation ratio 0.53 (3 berths) Weekly crane utility rate 0.8
Container throughputs are 267% of plan (including those from expanded terminal area after the project). ・ Container handling capacity: 1 million TEU in
whole port and 800 thousand TEU in south port. When the expansion plan is completed, the total capacity of south port will be 2 million TEU.
・ Decrease in non-bulk cargo might be due to containerization.
・ Major international and domestic shipping companies started regular lines of mother vessels.

43
2) IRR a) FIRR: 12.6% Cost: initial- and re-investment cost, O&M cost Benefit: revenues from port- and container fees
b) EIRR: 15.4% (calculated in SAPROF) Cost: initial- and re-investment cost, O&M cost Benefit: saving of waiting time, berthing time, navigation time and saving of labor cost
a) FIRR: 19.1% Cost and benefit items are same as those at appraisal. Unit price was the one collected in ex-post evaluation.
b) EIRR: 20.1% Cost and benefit items are same as those at appraisal.(Alternative calculation: EIRR=33.1% if saving of cost for feeder services due to visit of mother vessels is considered as benefit.)
a) Reasons for increased FIRR (152% of plan): (i) decrease in project cost, (ii) higher container handling fee than planned, (iii) increase in port use fee revenue due to visits of large-scale vessels.
b) Reasons for increased EIRR (131% of plan): higher berth occupation rate and crane efficiency.
3) Qualitative aspects ・ Improvement of safety in container handling ・ Decrease in damages to cargo due to
containerization
・ Safety was improved due to automation of container handling and training by supplier.
・ Information on damages to cargo was not available. However, it is obvious that damages decrease by containerization.
・ Modernized terminal facilities attracted international operators and led to provision of services of international standard.
・ Support of Consultant in preparation of tender documents of international standard was also effective.
Terminal operation of international quality was realized.
Impact 1) Benefits to target
areas/ beneficiaries
Economic development and employment promotion ・ Real GDP growth: 4.1% in 1996, -1.5% in 1997.
Current balance as % of GDP: -4.5% in 1997. ・ Development toward being a hub of Black Sea
region: (i) emerging trade with European countries via Danube canal (ii)future transshipment (T/S) services in Black Sea region
・ Growth: real GDP growth turned to positive at annual average 6.1% during 2002-2006. Per capita GDP (PPP) increased to $10,000 (though lowest among Central and Eastern European countries).
・ Trade and investment: Current deficit not shrunk, but export is growing faster than import in marine transport. Foreign investment has much increased since 2004.
・ Development as a hub at Black Sea: (i) sharp increase in T/S (75% of CSCT-handled containers in 2006) from Asian countries to CIS and European countries; (ii) container transport via Danube-Black Sea canal being just started in 2006.
・ Effects on Southeastern Romania (including Constantza): shipbuilding, transport, oil refinery, and manufacturing industry have developed with the Port. The project led to: (i) direct employment of more than 350 local residents to CSCT; (ii) expansion of road transport business to carry containers (more than 1,000 people started the business after the project).
・ Effects on other regions of Romania: containers are carried from all over the country to Constantza for export. For import, 76% of containers are designated to Bucharest. Little carried from neighboring countries.
The project contributed to economic development by being a hub at Black Sea. ・ Recent growth is due to increase in domestic
demand: import increased because domestic manufacturing sector is not competitive.
・ The entire Port became the Free Zone in 2007. More than 590 licenses issued to enterprises to operate within the Port.
・ Increase in T/S for European countries requires development of European Corridor.
・ According to MOT and Chamber of Commerce, inland container transportation is not yet very efficient due to poor infrastructures. Thus, benefits of the new container terminal to regions in Romania have not yet been maximized.
・ Results of Beneficiary Survey: we sent the questionnaire to 13 shipping lines and collected answers from 6 of them. Their satisfaction (in 6 grade scale between 0 and 5) is with: (i) quality of terminal services (average 4.17pt), (ii) efficiency of container handling (4.00pt), (iii) capacity of terminal (3.83pt), (iv) price level (3.33) and so on.
2) Environmental impact
・ By nature of container transportation, unlike bulk cargo transportation, environmental influence such as particulates and water contamination will be
・ EIA was conducted in 2004 and obtained Level 1 (no effects on environment).
・ Disposal of solid waste and waste water is outsourced.
No problem in particular.

44
small. Also, residents will not be affected as the project site is far from residential areas.
MPAC is implementing a project to construct waste disposal plant with EIB funding.
・ Annual monitoring report on wastewater quality is submitted to local environmental authority. No problem.
Sustainability 1) Organizational aspect of
O&M
・ MPAC, the executing agency under Min. of Transport, will be in charge of O&M.
・ Terminal operation will be entrusted to private sector.
・ MPAC is in charge of O&M of infrastructure, buildings and utilities.
・ Operator: 18-year confessional contract between MPAC and Dubai Port Authority (DPA). Terminal is run by CSCT that DPA established in April 2004.
No problem in particular.
2) Technical aspect of O&M ・ Supplier of cranes trained CSCT staff during the project. After the project, CSCT and DPA provide training.
・ 410 persons engaged in terminal operation (CSCT). PCR says the number of O&M personnel is sufficient.
No problem in particular.
3) Financial aspect of O&M ・ MPAC is increasing assets and current profits. Capital adequacy ratio is very high (97% in 1995)
・ General financial conditions of MPAC are good (maintains surplus). PCR says annual maintenance & repair costs are $343mil in 2001, $442mil in 2002, $843mil in 2003, $941mil in 2004 and $967mil in 2005.
・ Financial information of private operators is not disclosed. However, from increasing container traffic and large-scale expansion projects, it is likely that CSCT is in a good financial condition. CSCT spent $440,000 for maintenance of the terminal in 2006.
No problem in particular.
4) O&M status ・ Both MPAC and CSCT make and implement maintenance plans annually. Conditions of the facilities and equipment are mostly good, except garages around railway trucks and stacking of containers outside the container yard.
No serious problem.
Lessons and Recommendations
Lessons Learned: When constructing a container terminal for which demand is expected to increase, with appropriate coordination provided by MOT, etc., the impact of the container terminal can be maximized by simultaneously developing a surface transport network linked to the terminal.Recommendations: MPAC, CSCT and MOT are recommended to pursue their development plans for more benefits from the container terminal (see the right column).
(Note) MPAC projects: (i) expansion of the railroad marshal area of South Port; (ii) a shortcut bridge to the South Port and North Port. CSCT projects: (i) expansion of Pier 2; (ii) construction of Pier 3. MOT projects: (i) completion of Bucharest- Constantza motorway; (ii) bypass from highways.
Rating ・ Relevance: a ・ Effectiveness: a ・ Efficiency: b ・ Sustainability: a ・ OVERALL: A
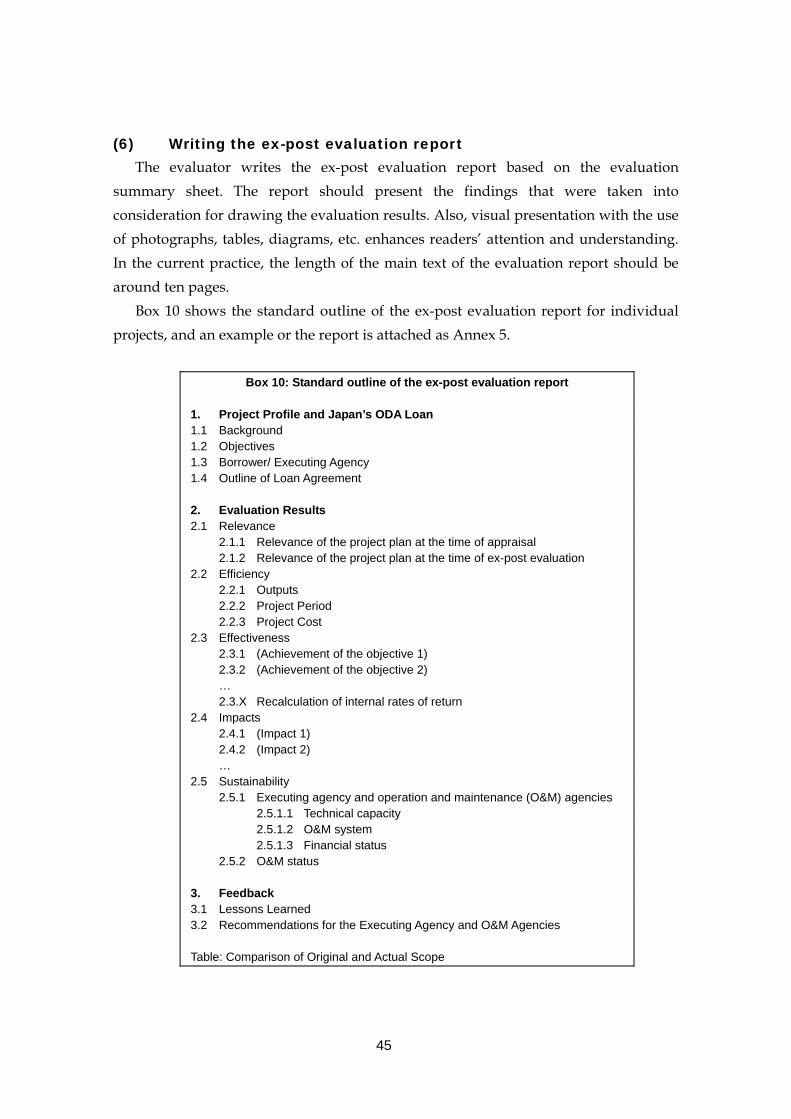
45
(6) Writing the ex-post evaluation report The evaluator writes the ex-post evaluation report based on the evaluation summary sheet. The report should present the findings that were taken into consideration for drawing the evaluation results. Also, visual presentation with the use of photographs, tables, diagrams, etc. enhances readers’ attention and understanding. In the current practice, the length of the main text of the evaluation report should be around ten pages. Box 10 shows the standard outline of the ex-post evaluation report for individual projects, and an example or the report is attached as Annex 5.
Box 10: Standard outline of the ex-post evaluation report 1. Project Profile and Japan’s ODA Loan 1.1 Background 1.2 Objectives 1.3 Borrower/ Executing Agency 1.4 Outline of Loan Agreement 2. Evaluation Results 2.1 Relevance 2.1.1 Relevance of the project plan at the time of appraisal 2.1.2 Relevance of the project plan at the time of ex-post evaluation 2.2 Efficiency 2.2.1 Outputs 2.2.2 Project Period 2.2.3 Project Cost 2.3 Effectiveness 2.3.1 (Achievement of the objective 1) 2.3.2 (Achievement of the objective 2) … 2.3.X Recalculation of internal rates of return 2.4 Impacts 2.4.1 (Impact 1) 2.4.2 (Impact 2) … 2.5 Sustainability 2.5.1 Executing agency and operation and maintenance (O&M) agencies 2.5.1.1 Technical capacity 2.5.1.2 O&M system 2.5.1.3 Financial status 2.5.2 O&M status 3. Feedback 3.1 Lessons Learned 3.2 Recommendations for the Executing Agency and O&M Agencies Table: Comparison of Original and Actual Scope
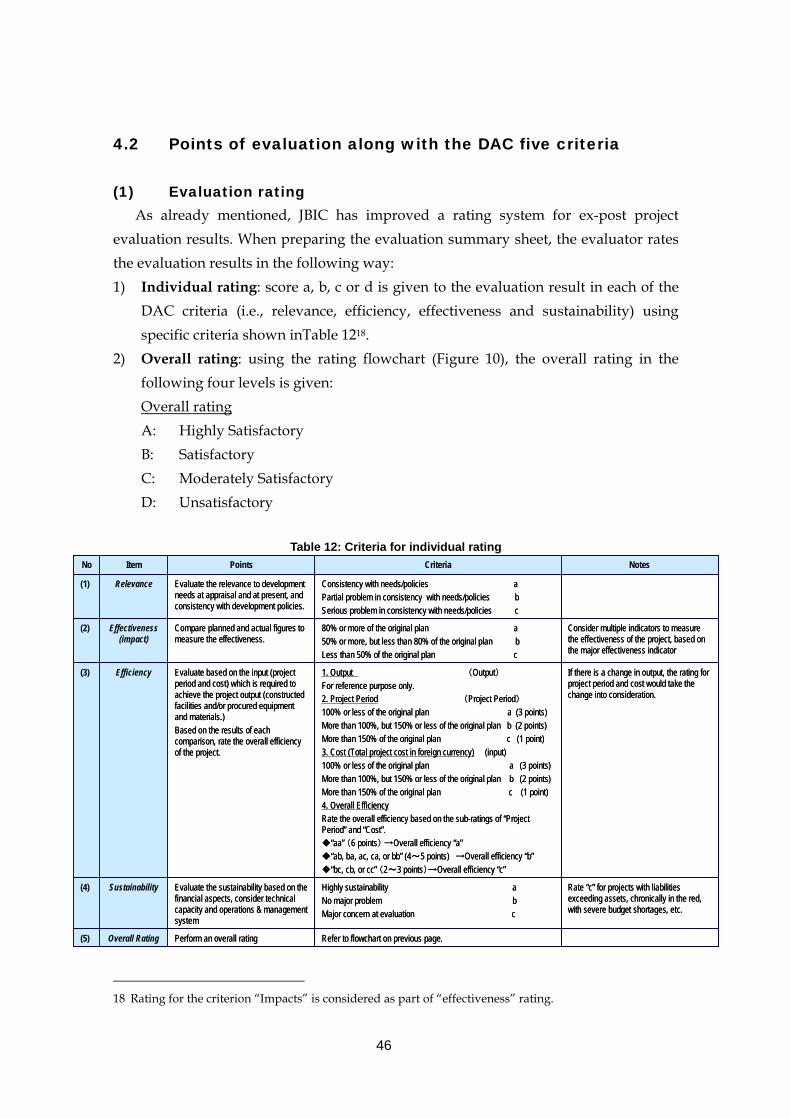
46
4.2 Points of evaluation along with the DAC five criteria
(1) Evaluation rating As already mentioned, JBIC has improved a rating system for ex-post project evaluation results. When preparing the evaluation summary sheet, the evaluator rates the evaluation results in the following way: 1) Individual rating: score a, b, c or d is given to the evaluation result in each of the
DAC criteria (i.e., relevance, efficiency, effectiveness and sustainability) using specific criteria shown inTable 1218.
2) Overall rating: using the rating flowchart (Figure 10), the overall rating in the following four levels is given: Overall rating A: Highly Satisfactory B: Satisfactory C: Moderately Satisfactory D: Unsatisfactory
Table 12: Criteria for individual rating
18 Rating for the criterion “Impacts” is considered as part of “effectiveness” rating.
Refer to flowchart on previous page.Perform an overall ratingOverall Rating(5)
Rate “c” for projects with liabilities exceeding assets, chronically in the red, with severe budget shortages, etc.
Highly sustainability aNo major problem bMajor concern at evaluation c
Evaluate the sustainability based on the financial aspects, consider technical capacity and operations & management system
Sustainability(4)
If there is a change in output, the rating for project period and cost would take the change into consideration.
1. Output (Output)For reference purpose only.2. Project Period (Project Period)
100% or less of the original plan a (3 points)More than 100%, but 150% or less of the original plan b (2 points)More than 150% of the original plan c (1 point)3. Cost (Total project cost in foreign currency) (input)100% or less of the original plan a (3 points)More than 100%, but 150% or less of the original plan b (2 points)More than 150% of the original plan c (1 point)4. Overall Efficiency Rate the overall efficiency based on the sub-ratings of “Project Period” and “Cost”.
“aa” (6 points) →Overall efficiency “a”“ab, ba, ac, ca, or bb” (4~5 points) →Overall efficiency “b”“bc, cb, or cc” (2~3 points)→Overall efficiency “c”
Evaluate based on the input (project period and cost) which is required to achieve the project output (constructed facilities and/or procured equipment and materials.)Based on the results of each comparison, rate the overall efficiency of the project.
Efficiency(3)
Consider multiple indicators to measure the effectiveness of the project, based on the major effectiveness indicator
80% or more of the original plan a50% or more, but less than 80% of the original plan b Less than 50% of the original plan c
Compare planned and actual figures to measure the effectiveness.
Effectiveness (impact)
(2)
Consistency with needs/policies a Partial problem in consistency with needs/policies bSerious problem in consistency with needs/policies c
Evaluate the relevance to development needs at appraisal and at present, and consistency with development policies.
Relevance(1)
NotesCriteriaPointsItemNo

47
Figure 10: Flowchart for evaluation rating
(1) Relevance
a
b
c
(2) Effectiveness (Impact)
(3) Efficiency
(4) Sustainability
(4) Sustainability
(4) Sustainability
AHighly
Satisfactory
B Satisfactory
C Moderately Satisfactory
D Unsatisfactory
(2) Effectiveness (Impact)
(3) Efficiency
(4) Sustainability
a
b
c
a
b
c
a
b
c
a
b
c
a
b
c
a
b
c
a
b
ca
b
c
Note: “Impact” is included in “effectiveness” for the purposes of ratings.Note: “Impact” is included in “effectiveness” for the purposes of ratings.
* The paths in bold show an example of evaluation rating where individual and overall rating turned out to be the followings: 1) Relevance: a (Consistency with needs/ policies) 2) Effectiveness (impact): a (80% or more of the original plan) 3) Efficiency: c (total points of period and cost sub-ratings are 2 or 3) 4) Sustainability: a (High sustainability) OVERALL RATING: B (Satisfactory)

48
(2) Relevance
Basic idea of Relevance Evaluation of relevance is based on the basic idea that a development projects should be planned and implemented in the larger context of development policies/ programs and be responsive to beneficiaries’ needs. Also, considering that development policies/ programs and needs might change overtime, relevance as of both before- and after the project should be examined. Typical evaluation questions for Relevance Evaluation questions for relevance include the followings: 1) Policy Level -- Consistency of the Project Objectives with national development
policies; 2) Program Level/ Needs -- Consistency of the Project Objectives with sector and/or
regional development programs and needs; and 3) Project Level -- Priority of the Project Objectives and Scope in relation to
development policies, programs and needs analyzed above. Typical data sources for Relevance 1) Policy Level – National development programs and policy papers at the time of
project appraisal (ex-ante evaluation) and ex-post evaluation. 2) Program Level/ Needs – Regional and/or sector development programs, demand
forecast and actual demand data, needs analysis, etc., at the time of project appraisal (ex-ante evaluation) and ex-post evaluation.
3) Project Level – Feasibility study (F/S) reports, SAPROF reports, appraisal document, etc.
Figure 11: Concept of relevance evaluation
Policy
Program
Needs
The country's:
RELEVANCE
Logframe
Overall Goal(Impacts)
Project Purpose(Outcome)
Outputs
Inputs
Relevance: consistency of the project objectives and design with policies and needs at the times of both before and after the project.

49
Rating criteria for Relevance Consistency with needs/policies a Partial problem in consistency with needs/policies b Serious problem in consistency with needs/policies c
For example…
Box 11: Example of relevance evaluation: a project with high relevance Bangkok Water Supply Improvement Project (4-2)(5) and
Networks System improvement Project in Thailand
The objectives of the project was to cope with increasing water demand and reduce water leakage, as well as to improve water quality by constructing water treatment plants and distribution pumping stations and improving distribution network systems in the Bangkok Metropolis, thereby contributing to improved public health and enhancing industrial and commercial activities. In the ex-post evaluation, a continuing need for solving the problems of poor capacity of water supply facilities and leakage was quantitatively verified. Also, it was found that both the 7th (at appraisal) and the 9th (at ex-post) National Economic and Social Development Plans put a high priority on the improvement of water supply facilities. From these findings, relevance of the project was evaluated as high and rated at “a”.
Box 12: Example of relevance evaluation: project with some concerns with relevance Locomotives Manufacturing Factory Project in Pakistan
The objectives of the project was to progressively promote the domestic manufacture of locomotives by constructing a locomotive manufacturing factory and transferring manufacturing technology to Pakistan, where railways play an important role in freight transport, and thereby contribute to economic development through stabilization of rail transport. In the ex-post evaluation, the consistency with the Pakistan’s development policies and programs was verified from the documentation review. However, although railway transport volume was forecasted to increase at the time of the appraisal, the freight transport volume actually declined by approximately 50% when the averages of 1986-1990 and of 1996-2000 are compared. The passenger transport volume was limited to an approximately 1% increase, and the railway’s share of domestic freight transport in 2003 plummeted to 5% (Figure). Due to these facts, it was concluded that the need for new locomotives is lower than expected, and relevance of the project was rated at “b”.
Changes in the railway’s share (%) of passenger and freight transport

50
(3) Efficiency
Basic idea of Efficiency A project is evaluated as efficient when the same or fewer inputs than planned were devoted to produce the planned scale/ amount of outputs19. In JBIC’s practice, inputs are measured by project period (in months) and project cost. When the there are significant gaps between the planned and actual inputs, it is important to look for the reasons in order to draw lessons on project implementation process. Typical evaluation questions for Efficiency Evaluation questions for relevance include the followings: 1) Outputs – Degree of completion of the planned outputs by category; 2) Project period – Actual project implementation period (total months and duration
of each group of tasks) compared to the original plan; and
3) Cost – Actual project cost by item and by disbursed year (both loan and local funding) compared to the original plan.
Typical data sources for Efficiency 1) Outputs – Appraisal documents, Project Completion Report (PCR), on-site
observation/direct measurement by the evaluator, etc. 2) Project period – Appraisal documents, PCR, progress reports, hearings from
project-related personnel, etc. 3) Cost – Appraisal documents, PCR, disbursement records of both JBIC and the
executing agency, etc.
19 There are variations in the idea of efficiency: comparison of the outputs - inputs ratio with some benchmarks (e.g., national standard and figures in similar projects), or comparison of benefits - inputs ratio with benchmarks or with originally-planned value.
Figure 12: Concept of efficiency evaluation Logframe
Overall Goal(Impacts)
Project Purpose(Outcome)
Outputs
Inputs
EFFICIENCY
Project periodProject cost
Efficiency: Productivity of inputs to produce outputs. Comparison of plan and actual performance of outputs, project period and cost.
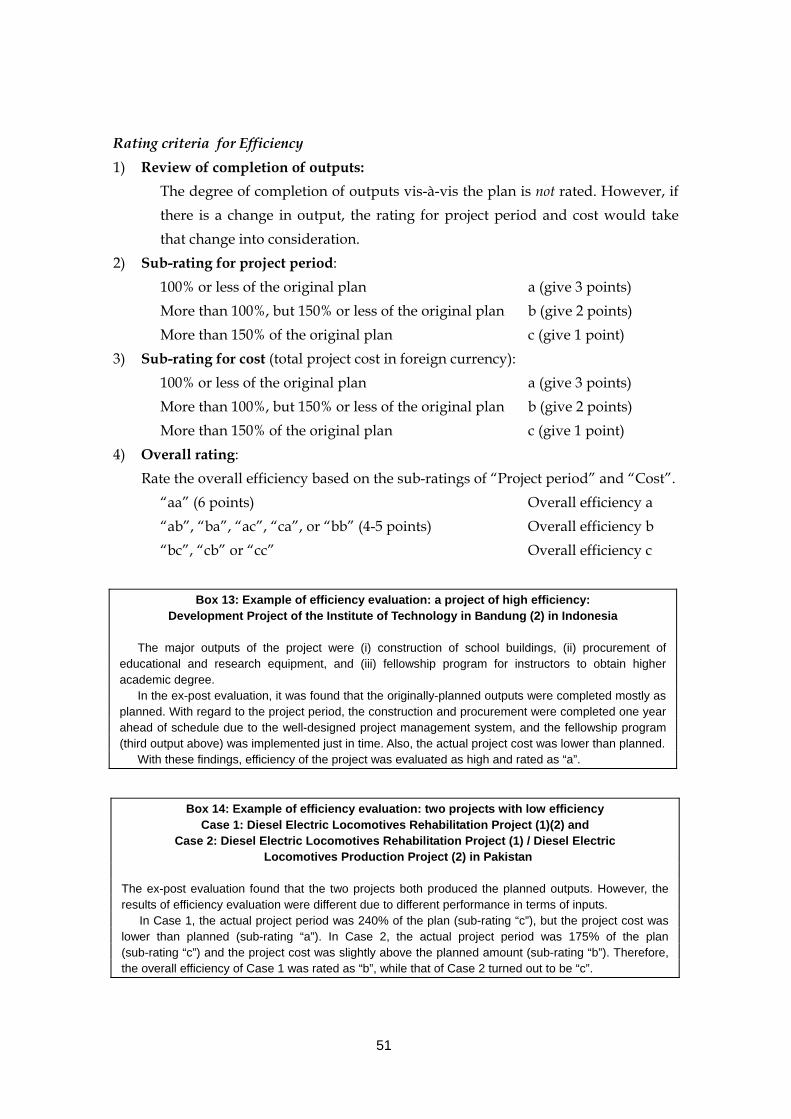
51
Rating criteria for Efficiency 1) Review of completion of outputs:
The degree of completion of outputs vis-à-vis the plan is not rated. However, if there is a change in output, the rating for project period and cost would take that change into consideration.
2) Sub-rating for project period: 100% or less of the original plan a (give 3 points) More than 100%, but 150% or less of the original plan b (give 2 points) More than 150% of the original plan c (give 1 point)
3) Sub-rating for cost (total project cost in foreign currency): 100% or less of the original plan a (give 3 points) More than 100%, but 150% or less of the original plan b (give 2 points) More than 150% of the original plan c (give 1 point)
4) Overall rating: Rate the overall efficiency based on the sub-ratings of “Project period” and “Cost”.
“aa” (6 points) Overall efficiency a “ab”, “ba”, “ac”, “ca”, or “bb” (4-5 points) Overall efficiency b “bc”, “cb” or “cc” Overall efficiency c
Box 13: Example of efficiency evaluation: a project of high efficiency: Development Project of the Institute of Technology in Bandung (2) in Indonesia
The major outputs of the project were (i) construction of school buildings, (ii) procurement of educational and research equipment, and (iii) fellowship program for instructors to obtain higher academic degree. In the ex-post evaluation, it was found that the originally-planned outputs were completed mostly as planned. With regard to the project period, the construction and procurement were completed one year ahead of schedule due to the well-designed project management system, and the fellowship program (third output above) was implemented just in time. Also, the actual project cost was lower than planned. With these findings, efficiency of the project was evaluated as high and rated as “a”.
Box 14: Example of efficiency evaluation: two projects with low efficiency Case 1: Diesel Electric Locomotives Rehabilitation Project (1)(2) and
Case 2: Diesel Electric Locomotives Rehabilitation Project (1) / Diesel Electric Locomotives Production Project (2) in Pakistan
The ex-post evaluation found that the two projects both produced the planned outputs. However, the results of efficiency evaluation were different due to different performance in terms of inputs. In Case 1, the actual project period was 240% of the plan (sub-rating “c”), but the project cost was lower than planned (sub-rating “a”). In Case 2, the actual project period was 175% of the plan (sub-rating “c”) and the project cost was slightly above the planned amount (sub-rating “b”). Therefore, the overall efficiency of Case 1 was rated as “b”, while that of Case 2 turned out to be “c”.

52
(4) Effectiveness
Basic idea of Effectiveness A project is evaluated as effective when the project purpose was achieved vis-à-vis the expected target by using the outputs. The degree of achievement of the purpose is examined primarily through quantitative analyses (i.e., operation and effect indicators and internal rates of return). However, qualitative analyses are also important to understand factors behind the quantitative findings and opinions of beneficiaries. Typical evaluation questions for Effectiveness Evaluation questions for effectiveness include the followings: 1) Performance of operation and effect indicators – Degree of achievement of
planned targets for the project purpose (including the degree of utilization of the project outputs);
2) Re-calculation of IRR – Financial internal rate of return (FIRR) and/or economic internal rate of return (EIRR) calculated based on the actual data (see p.65 for further details); and
3) Qualitative indicators – Degree of satisfaction of users/ beneficiaries of the project outputs and other positive changes brought by the project, promoting/inhibiting factors for the achievement of the project purpose.
Typical data sources for Effectiveness 1) Performance of operation and effect indicators – F/S and/or SAPROF reports,
appraisal document, operation records and other various reports and records by executing/ O&M agencies, direct measurement by the evaluator, etc.
2) Re-calculation of IRR – F/S and/ or SAPROF reports, appraisal document,
Figure 13: Concept of effectiveness evaluation
Logframe
Overall Goal(Impacts)
Project Purpose(Outcome)
Outputs
Inputs
EFFECTIVENESSUse ofOutputs
IRR
Effectiveness: Degree of achievement of the project purpose (outcome) based on the comparison between planned and actual performance of operation and effect indicators and internal rates of return (IRR), supplemented by relevant qualitative information.

53
disbursement record, record of operation and maintenance costs, record of revenue from the project outputs, reports showing economic benefits of the project, country financial statistics showing exchange rates, inflation rates, conversion factors from financial to economic prices of non-tradable goods, etc.
3) Qualitative information – Photographs showing the situations before and after the project, newspaper articles and various publications showing the benefits of the project, beneficiary survey, etc.
Rating criteria for Effectiveness For effectiveness evaluation rating, consider multiple indicators compared to the target values. Considering that the rating depends on choice of indicators, carefully select indicators that could measure the originally-intended effects of the project to avoid arbitrary rating. In cases where there are no target values set for the selected indicators, evaluators should set the appropriate targets based on various planning documents.
80% or more of the original plan (target) a 50% or more, but less than 80% of the original plan (target) b Less than 50% of the original plan c
Box 15: Example of effectiveness evaluation: a project with high effectiveness Xi'an-Ankang Railway Construction Project (1)-(3) in China
The project constructed an electrified single-track railway line between Xian and Ankang in Shaanxi Province for the purpose of increasing the transportation of energy resources, freight, and passengers to Northwestern and Southwestern China. In the ex-post evaluation in 2004, it was found that the passenger traffic has already exceeded the target volume. Supplemented by other quantitative and qualitative information, the project was evaluated as effective and rated at “a”.
Changes in freight traffic volume, passenger traffic volume, etc. after the project

54
(5) Impact Basic idea of Impacts Evaluation of impacts tries to make clear (i) the contribution of the project to long-term development objectives, such as national/ sector development goals and the Millennium Development Goals (MDGs), which might be somehow reflected on the overall goal of the project, and (ii) other positive and negative effects of the project. In association with the above, JBIC makes account of the contribution of the project in the four priority areas set in the JBIC Mid Term ODA Strategy (poverty reduction, a foundation for sustainable growth, global issues and peace-building, and human resource development). When evaluating impacts, the evaluator should try, as much as possible, to verify the causal relationship between the project and the goal, i.e., to differentiate the net benefit of the project from other contributing factors (See also “1.1 (2) Enhancement of Impact Evaluation” of this handbook). Typical evaluation questions for Impacts Evaluation questions for impacts include the followings: 1) Achievement of Overall Goal – Degree of achievement of planned targets for the
overall goal and the contribution of the project to the achievement; 2) Socio-economic impacts – Impacts on economic development, positive and
negative changes in life of the project-affected people (including beneficiaries and those affected by land acquisition and resettlement), and appropriateness of the countermeasures for alleviating negative impacts; and
3) Environmental impacts20 – Impacts of the project on the natural environment and
20 If the project is classified to Category A or equivalent on the JBIC Guidelines for Confirmation of Environmental and Social Considerations, the evaluator must examine whether the environmental
Figure 14: Concept of impact evaluation Logframe
Overall Goal(Impacts)
Project Purpose(Outcome)
Outputs
Inputs
IMPACTS Changes ineconomic, social
and environmentalconditions
Impact: Direct and indirect changes (both positive and negative) the project has brought to macro-economic, social and environmental conditions of the target country or areas.
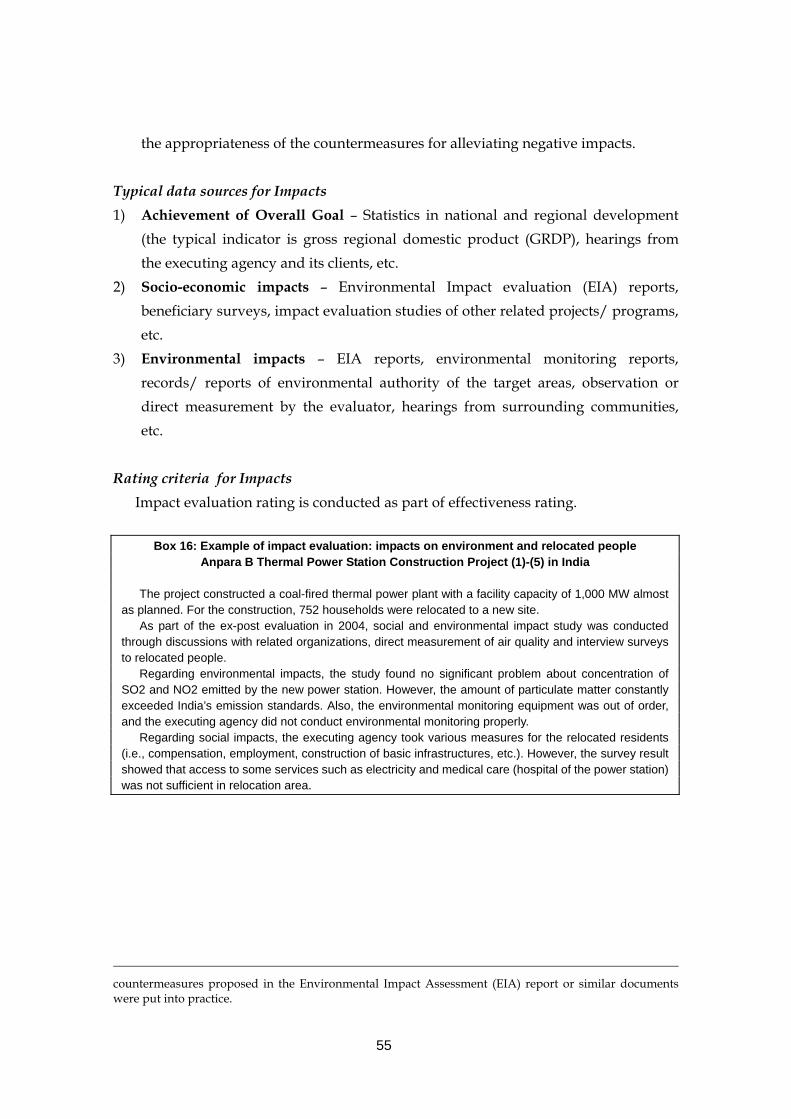
55
the appropriateness of the countermeasures for alleviating negative impacts. Typical data sources for Impacts 1) Achievement of Overall Goal – Statistics in national and regional development
(the typical indicator is gross regional domestic product (GRDP), hearings from the executing agency and its clients, etc.
2) Socio-economic impacts – Environmental Impact evaluation (EIA) reports, beneficiary surveys, impact evaluation studies of other related projects/ programs, etc.
3) Environmental impacts – EIA reports, environmental monitoring reports, records/ reports of environmental authority of the target areas, observation or direct measurement by the evaluator, hearings from surrounding communities, etc.
Rating criteria for Impacts Impact evaluation rating is conducted as part of effectiveness rating.
countermeasures proposed in the Environmental Impact Assessment (EIA) report or similar documents were put into practice.
Box 16: Example of impact evaluation: impacts on environment and relocated people Anpara B Thermal Power Station Construction Project (1)-(5) in India
The project constructed a coal-fired thermal power plant with a facility capacity of 1,000 MW almost as planned. For the construction, 752 households were relocated to a new site. As part of the ex-post evaluation in 2004, social and environmental impact study was conducted through discussions with related organizations, direct measurement of air quality and interview surveys to relocated people. Regarding environmental impacts, the study found no significant problem about concentration of SO2 and NO2 emitted by the new power station. However, the amount of particulate matter constantly exceeded India’s emission standards. Also, the environmental monitoring equipment was out of order, and the executing agency did not conduct environmental monitoring properly. Regarding social impacts, the executing agency took various measures for the relocated residents (i.e., compensation, employment, construction of basic infrastructures, etc.). However, the survey result showed that access to some services such as electricity and medical care (hospital of the power station) was not sufficient in relocation area.

56
(6) Sustainability
Basic idea of Sustainability A project is evaluated as sustainable when the completed outputs are likely to keep achieving the project purpose (outcome) in medium and long term (i.e., during the life time of the outputs). Generally, focus is on the status and capacity of the organizations in charge of operation and maintenance (O&M) of the outputs and the actual practice of O&M activities by those organizations. Typical evaluation questions for Sustainability Evaluation questions for sustainability include the followings: 1) Technical – Adequacy of the number and technical capacity of operation and
maintenance (O&M) staff for the project facilities (including information on training and development of O&M manuals);
2) O&M system – Degree to which the decision-making system and organizational control of the relevant organizations assure proper O&M activities;
3) Financial – Financial status of the executing and O&M agencies and their capacity to bear necessary O&M costs (including the degree of cost recovery or stability of subsidization from the government); and
4) O&M status – Appropriateness of on-going O&M practices (including daily, periodic, on-demand and preventive maintenance), availability of spare parts or fuel, and conditions of the project facilities at the time of ex-post evaluation
Typical data sources for Sustainability 1) Technical – PCR, staff list by technical level, training record of O&M staff, O&M
manuals, standard operating procedures (SOPs) for project facilities, hearings from O&M staff, observation by the evaluator, etc.
2) O&M system – PCR, latest organization charts of the executing and O&M agencies,
Figure 15: Concept of sustainability evaluation
Logframe
Overall Goal(Impacts)
Project Purpose(Outcome)
Outputs
Inputs
SUSTAINABILITYOperation &maintenance
Sustainability: Degree to which the project outputs are maintained and continuously give benefits in medium and long-term.

57
documents describing their mandate and decision-making system (e.g., decrees), hearings from the executing and O&M agencies, etc.
3) Financial – PCR, financial statements of the executing and O&M agencies, etc. 4) O&M status – PCR, O&M manuals, SOPs, records of O&M activities, inventory of
spare-parts, direct observation of the project facilities, hearings from O&M staff, etc..
Rating criteria for Sustainability
Highly satisfactory a Small concern, but no major problem at evaluation b Major concern at evaluation c
Box 17: Example of sustainability evaluation: a project with high sustainability Al-Zala Thermal Power Plant Project in Syria
In the ex-post evaluation of the project, no problem was seen in the organization and status of operation and maintenance (O&M), thus the evaluation rating for this criterion was “a”. As for technical capacity in O&M, staff at the Al-Zala Power Plant receives technical training overseas and at the training center in Syria that was built with grant aid from Japan. The O&M system functions well with the state-run Public Establishment of Electricity for Generation and Transmission (PEEGT, the executing agency) and eleven power plants including the Al-Zala Plant under the PEEGT umbrella. Financially, power plants are subsidized to compensate revenues from sales, as electricity tariff was kept lower than the generation cost by the government. However, incentives based on each power plant’s business performance have been introduced, and they include expansion of budget limits and additional special budgets for parts procurement and training.
Box 18: Example of sustainability evaluation: sustainability of human resource development Higher Education Loan Fund Project (HELP) in Malaysia
This project successfully helped increase the number of qualified engineers by providing scholarships to 310 Malaysians for the study of science and engineering in Japanese universities. In the ex-post evaluation, the evaluator assessed defined the project sustainability as: 1) the continuity of the project effects as realized through the graduates from the scholarship program; 2) the continuity of the overseas education project by the executing agency; and 3) the continuity of the need for study in Japan. Among these three issues, 2) and 3) are rather unique to human resource development projects in a sense that the continuity of not only the use of outputs (i.e. scholarship students) but also of the mechanism of producing outputs was counted. From the information collected, the conclusion was reached that a high degree of sustainability can be expected for 1) and 3), and while there is some slight cause for concern regarding 2), no serious problems are visible. Thus, the overall sustainability of the project was rated as “b”.

58
(7) Lessons Learned Lessons learned from the evaluated project are suggestions for future or other on-going projects. Lessons could be learned from both good and bad practices, and cover wide-ranging issues such as project design and planning, implementation supervision and monitoring, and operation and maintenance. JBIC keeps a database of past lessons, and the planner of every new project should search the database and apply relevant lessons to the concerned project at the ex-ante evaluation stage. In generalizing the findings from the evaluation, the evaluator should carefully examine the causal relationship between the action taken and its consequence.
(8) Recommendations Recommendations are suggestions that are useful for the improvement of the evaluated project. The evaluator gives recommendations based on the evaluation findings. A lot of recommendations are concerning the removal of inhibiting factors to the attainment of maximum project results (e.g., factors to inhibit the achievement of the project purpose or sustainability). Following the recommendations, the executing agency and JBIC take necessary actions to improve the conditions mentioned, and such actions are subject to the ex-post monitoring (see Chapter 5). Therefore, it is important that the evaluator proposes concrete and realistic recommendations, clearly mentioning who/ which organization should do what for what purpose.
Table 13: Examples of lessons learned and recommendations Country Project Lessons Learned
The Philippines Pampanga Delta Development Project, Flood Control Component (1) (overall rating: D)
Had adequate preparation been made for land acquisition and the process properly coordinated, project progress could have been expedited and local opposition transformed into approval. More specifically, had the budget secured for the resettlement program at an earlier stage and preparations of the resettlement site been timed to coincide with eviction orders, these measures might have helped to build consensus among affected residents and have facilitated the eviction process.
Indonesia Bogor Agricultural University Development Project (overall rating: A)
Since sophisticated laboratory equipment quickly becomes outdated, on projects that implement procurement of such equipment together with building construction work, particular attention must be paid to coordination between the equipment selection/tendering process and progress in construction work, and efforts need to be made to ensure that equipment with the appropriate specifications is installed promptly right after building work is completed for effective utilization.
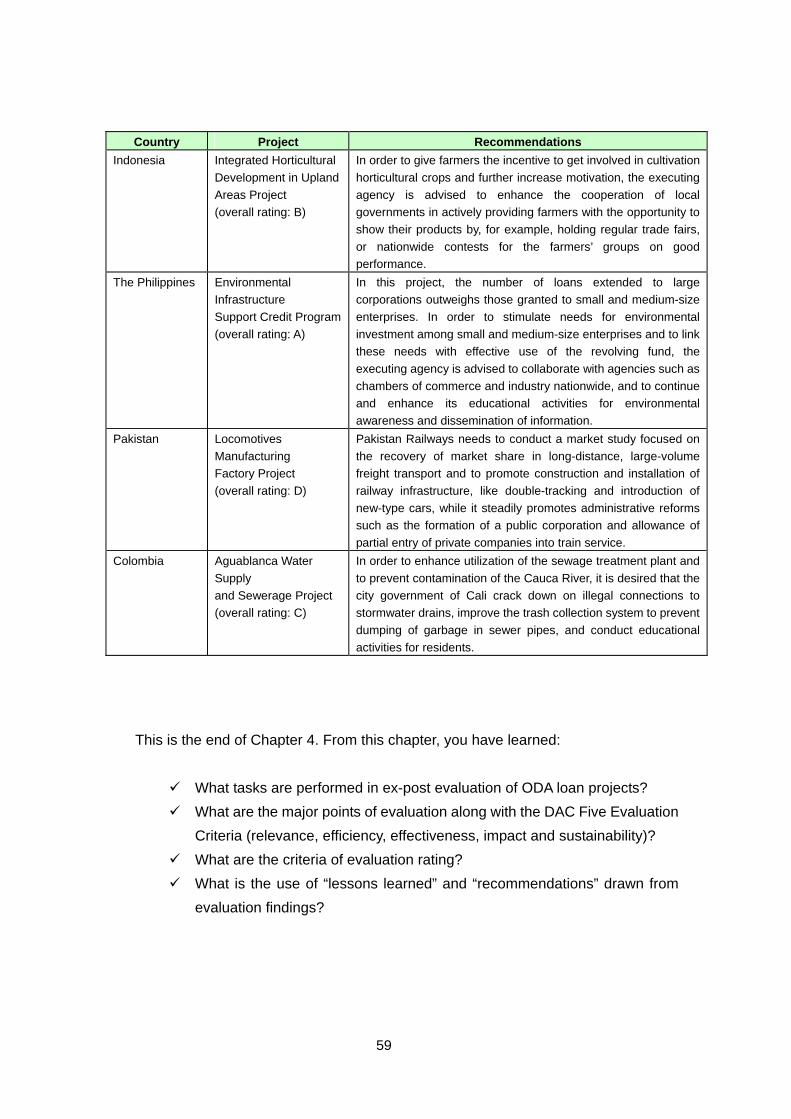
59
Country Project Recommendations Indonesia Integrated Horticultural
Development in UplandAreas Project (overall rating: B)
In order to give farmers the incentive to get involved in cultivation horticultural crops and further increase motivation, the executing agency is advised to enhance the cooperation of local governments in actively providing farmers with the opportunity to show their products by, for example, holding regular trade fairs, or nationwide contests for the farmers’ groups on good performance.
The Philippines Environmental Infrastructure Support Credit Program(overall rating: A)
In this project, the number of loans extended to large corporations outweighs those granted to small and medium-size enterprises. In order to stimulate needs for environmental investment among small and medium-size enterprises and to link these needs with effective use of the revolving fund, the executing agency is advised to collaborate with agencies such as chambers of commerce and industry nationwide, and to continue and enhance its educational activities for environmental awareness and dissemination of information.
Pakistan Locomotives Manufacturing Factory Project (overall rating: D)
Pakistan Railways needs to conduct a market study focused on the recovery of market share in long-distance, large-volume freight transport and to promote construction and installation of railway infrastructure, like double-tracking and introduction of new-type cars, while it steadily promotes administrative reforms such as the formation of a public corporation and allowance of partial entry of private companies into train service.
Colombia Aguablanca Water Supply and Sewerage Project (overall rating: C)
In order to enhance utilization of the sewage treatment plant and to prevent contamination of the Cauca River, it is desired that the city government of Cali crack down on illegal connections to stormwater drains, improve the trash collection system to prevent dumping of garbage in sewer pipes, and conduct educational activities for residents.
This is the end of Chapter 4. From this chapter, you have learned:
What tasks are performed in ex-post evaluation of ODA loan projects? What are the major points of evaluation along with the DAC Five Evaluation
Criteria (relevance, efficiency, effectiveness, impact and sustainability)? What are the criteria of evaluation rating? What is the use of “lessons learned” and “recommendations” drawn from
evaluation findings?

60
Chapter 5: Feedback of the Evaluation Findings
5.1 JBIC’s mechanism for feedback
(1) Feedback meeting After the ex-post evaluation work is completed, JBIC organizes a feedback meeting in the partner country, usually inviting the planning agency, executing agency and other project-related organizations/agencies. The purposes of the feedback meeting are to inform the executing agencies and other project-related parties of the results of the evaluation and receive comments from participants.
(2) Ex-post monitoring sheet (use of recommendations) As described in Chapter 2, JBIC requests the executing agency to conduct ex-post monitoring until the seventh year after the completion of the project. The ex-post monitoring sheet (Table 14) is drafted at the end of the ex-post evaluation, and the executing agency records the performance of the selected operation and effect indicators as well as the actions they have taken to respond to the recommendations on annual basis. The results of those actions are evaluated in the seventh year after the project completion (i.e., five years after the ex-post evaluation).
(3) Follow-up facilities (use of recommendations) Once JBIC decides necessary, it implements the Special Assistance for Project Sustainability (SAPS), which is one of the Special Assistance Facilities (SAF) and other studies to follow-up the recommendations made at the ex-post evaluation. An example of SAPS based on the ex-post evaluation is shown in Box 19.
Making use of evaluation findings for decision-making is the essential process of the “managing for development results” (MfDR) as mentioned in Chapter 1. For this purpose, JBIC is constructing a mechanism for feedback from ex-post evaluations to new projects and projects in progress, and assists partner countries in promoting feedback process in their own development management systems.

61
Table 14: Example of the ex-post monitoring sheet
Country: Indonesia Project: Jakarta Fishing Port/Market Development Project IV Executing Agency/ Monitoring Agency
DIT.GEN.OF CAPTURE FISHERIES, MINISTRY OF MARINE AFFAIRS AND FISHERIES/ UPT-PPSJ and PERUM-PPS
Evaluation Date: October 2004 Rating: B Monitoring Period: Year 2003 - 2009
Indicators Indicators 2003 2004 2005 2006 2007 2008 2009 1 Fish handling
volume (t) Actual Total
37,600 Export tuna 14,311
2 Number of times of floods on east revetment
Actual 0
[source] Actual: UPT-PPSJ * actual indicators can be substituted if there is other simple or easy access data/statistics.
Status of the Recommendations
Recommendations by Ex-Post Evaluation. SAPS recommendation (after ex-post evaluation only)
Action Taken by EA
For MMAF, a) Enforce regulation on port use for improved
cleanliness & hygiene and more efficient berthing of fishing vessels.
b) Take measures to ensure fresh water for improving hygiene and thus quality of fishery products (e.g. investigation and control of leakage, encouraging private investment to freshwater plant)
c) Coordinate with each other and with fishery companies operating at JFP in fulfilling current information system so that overall state of JFP can be easily grasped by anyone who is interested and such information is utilized for better operation of the port and to attract more investment.
(To be reported annually by the executing agency)
(To be reported annually by the executing agency)

62
(4) Feedback to ex-ante evaluation (use of lessons learned) As already mentioned, the lessons learned from the ex-post evaluation are kept in a database by sector. In the ex-ante evaluation of a new project, JBIC searches the database and incorporate relevant lessons in the planning. The result of ex-ante evaluations are disclosed as the ex-ante evaluation reports. The format of the ex-ante evaluation report and an example of feedback are shown in Box 20 and Box 21, respectively.
Box 19: Example of SAPS following the ex-post evaluation Yamuna Action Plan Project in India
In India’s Yamuna Action Plan Project which underwent ex-post evaluation in FY2004, the project achieved the planned level in terms of volume of wastewater treated, but the quality of the river water was not improved. Based on this, through SAPS a detailed analysis of the water quality was conducted and recommendations were made for improvement.
Box 20: Format of the ex-ante evaluation report
1 Name of the Project 2. Necessity and Relevance of JBIC’s Assistance 3. Project Objectives 4. Project Description (1) Target area, (2) Project outline, (3) Total project cost/ loan amount, (4) Schedule, (5) Implementation structure, (6) Environmental and social considerations, (7) Other important issues 5. Outcome Targets (1) Evaluation indicators, (2) Internal rate of return 6. External Risk Factors 7. Lessons Learned from Findings of Similar Project Undertaken in the Past 8. Plans for Future Evaluation
Feedback from ex-post evaluation

63
5.2 Feedback by developing countries
(1) Feedback from ex-post evaluation Once the necessary actions for the improvement of the project results are shared with the partner country through feedback meeting and the recommendations made by evaluator (see Section 5.1 above), the partner country is expected to plan and carry out those actions within its own project/ program management system.
(2) Feedback from ex-post monitoring As already mentioned, executing agencies are expected to conduct ex-post monitoring, i.e., periodically measure the outcomes/ impacts of the evaluated project for further improvement of the project results and ensuring their sustainability. The ex-post monitoring sheet is a useful tool for such monitoring activities, since only a few operation/effect indicators that are relevant and easy to measure are selected as the subject of monitoring (see Section 5.1 (2) for the idea and format of the sheet). When the executing agency finds the project performance after the ex-post evaluation is not satisfactory (e.g.., the actual figures of the selected operation/ effect indicators did not reach the targets or they are getting worse), undertakings of some corrective actions are expected. Such activities would enable the executing agency to secure good and sustainable project results.
Box 21: Example of feedback to ex-ante evaluation Second Hanoi Drainage Project for Environmental Improvement (I) in Viet Nam
The objectives of this project is to develop drainage and sewerage systems in Hanoi City in order to decrease flood damage, improve water quality and thereby contribute to improve urban sanitation and living environment. In the ex-ante evaluation, lessons from past ex-post evaluation were incorporated in the project strategy and described in the ex-ante evaluation report as follows: “Lessons Learned from Findings of Similar Projects Undertaken in the Past: In ex-post evaluations of similar projects in the drainage, sewerage, and sanitation sector in the past, recognition is given to the effectiveness of Japanese local governments’ collaboration in securing sustained effects from projects following their completion of construction. Based on this, the project will actively incorporate assistance from local governments is promoting awareness and behavioral change among local residents with regard to the environment.”
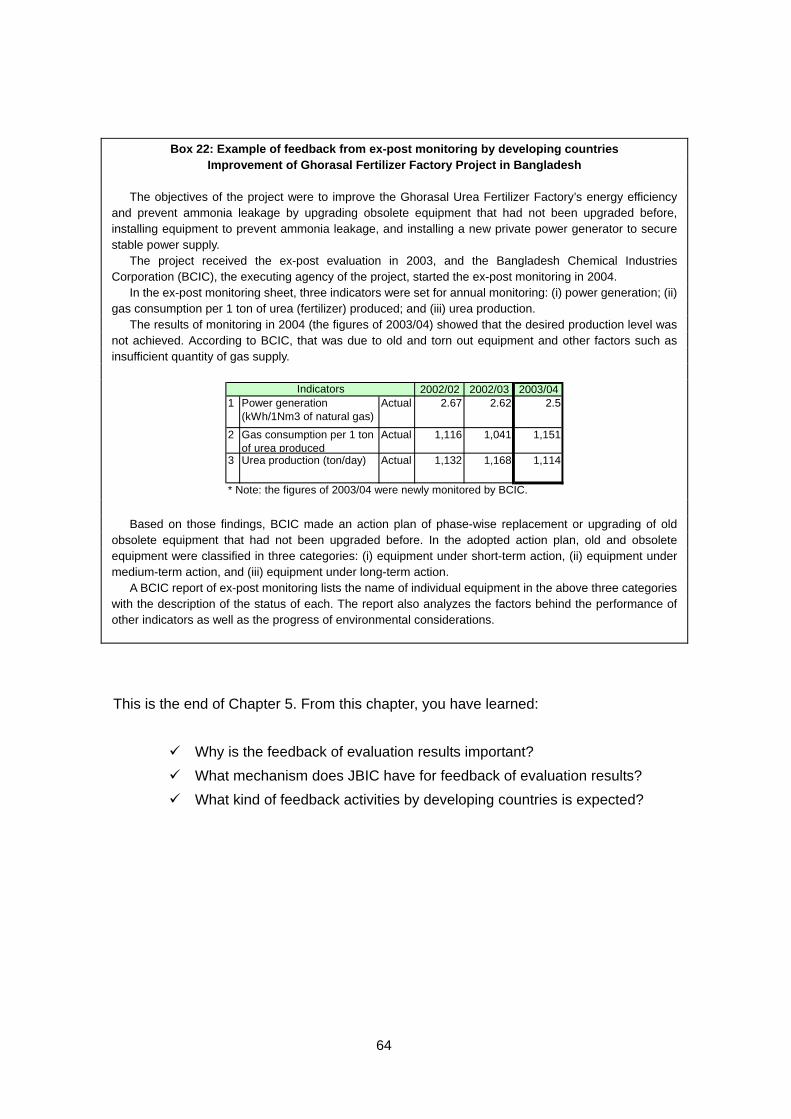
64
This is the end of Chapter 5. From this chapter, you have learned:
Why is the feedback of evaluation results important? What mechanism does JBIC have for feedback of evaluation results? What kind of feedback activities by developing countries is expected?
Box 22: Example of feedback from ex-post monitoring by developing countries Improvement of Ghorasal Fertilizer Factory Project in Bangladesh
The objectives of the project were to improve the Ghorasal Urea Fertilizer Factory’s energy efficiency and prevent ammonia leakage by upgrading obsolete equipment that had not been upgraded before, installing equipment to prevent ammonia leakage, and installing a new private power generator to secure stable power supply. The project received the ex-post evaluation in 2003, and the Bangladesh Chemical Industries Corporation (BCIC), the executing agency of the project, started the ex-post monitoring in 2004. In the ex-post monitoring sheet, three indicators were set for annual monitoring: (i) power generation; (ii) gas consumption per 1 ton of urea (fertilizer) produced; and (iii) urea production. The results of monitoring in 2004 (the figures of 2003/04) showed that the desired production level was not achieved. According to BCIC, that was due to old and torn out equipment and other factors such as insufficient quantity of gas supply.
2002/02 2002/03 2003/041 Power generation
(kWh/1Nm3 of natural gas)Actual 2.67 2.62 2.5
2 Gas consumption per 1 tonof urea produced
Actual 1,116 1,041 1,151
3 Urea production (ton/day) Actual 1,132 1,168 1,114
* Note: the figures of 2003/04 were newly monitored by BCIC.
Indicators
Based on those findings, BCIC made an action plan of phase-wise replacement or upgrading of old obsolete equipment that had not been upgraded before. In the adopted action plan, old and obsolete equipment were classified in three categories: (i) equipment under short-term action, (ii) equipment under medium-term action, and (iii) equipment under long-term action. A BCIC report of ex-post monitoring lists the name of individual equipment in the above three categories with the description of the status of each. The report also analyzes the factors behind the performance of other indicators as well as the progress of environmental considerations.

65
References Managing for Development Results OECD-DAC Joint Venture on Managing for Development Results (2006) Managing for Development Results Principles in Action: Sourcebook on Emerging Good Practices. (http://www.mfdr.org/sourcebook.html) Government of Japan (2005) Japan’s Action Plan for Implementing the Paris Declaration (http://www.mofa.go.jp/policy/oda/category/coordinate/action.pdf) Evaluation of development assistance (Japan) Ministry of Foreign Affairs, Japan (2003) ODA Evaluation Guidelines. (http://www.mofa.go.jp/policy/oda/evaluation/guideline.pdf) Ministry of Internal Affairs and Communications. Policy Evaluation in Japanese Government. (http://www.soumu.go.jp/english/kansatu/evaluation/index.html) Japan International Cooperation Agency (2004) JICA Guidelines for Project Evaluation. (http://www.jica.go.jp/english/evaluation/guides/guideline.html) Evaluation of development assistance (Other donors) OECD-DAC (1991) Principles for Evaluation on Development Assistance. (http://www.oecd.org/dataoecd/secure/9/11/31779367.pdf) OECD-DAC. DAC Criteria for Evaluating Development Assistance. (http://www.oecd.org/document/22/0,2340,en_2649_34435_2086550_1_1_1_1,00.html)
OECD-DAC. Glossary of Key Terms in Evaluation and Results Based Management. (http://www.oecd.org/dataoecd/29/21/2754804.pdf) United Nations Development Programme (2002) Handbook on Monitoring and Evaluation for Results. (http://www.undp.org/eo/methodologies.htm) Asian Development Bank. Project Performance Management System (http://www.adb.org/Documents/Slideshows/PPMS/default.asp?p=evaltool)

66
Canadian International Development Agency (2004) CIDA Evaluation Guide. (http://www.acdi-cida.gc.ca/INET/IMAGES.NSF/vLUImages/Performancereview5/$file/English_E_guide.pdf) Logical Framework Saldanha, C. and J. Whittle (1998) Using the Logical Framework for Sector Analysis and Project Design: A User's Guide. Asian Development Bank. (http://www.adb.org/Documents/Guidelines/Logical_Framework/default.asp) Performance indicators World Bank (1996) Performance Monitoring Indicators: A Handbook for Task Managers. (http://www.worldbank.org/html/opr/pmi/contents.html) Social analysis World Bank (2003) Social Analysis Sourcebook: Incorporating Social Dimensions into Bank-Supported Projects. (http://www.worldbank.org/socialanalysissourcebook/) Gosling, Louisa and Edwards, eds. (2003) Toolkits: a practical guide to planning, monitoring, evaluation and impact assessment. Save the Children. Impact evaluation Baker, Judy L. (2000) Evaluating the Impact of Development Projects on Poverty: a handbook for practitioners. The World Bank. (http://siteresources.worldbank.org/INTISPMA/Resources/handbook.pdf) Oakeley, Peater, et.al. (1998) Outcomes and Impact: Evaluating Change in Social Development. An INTRAC Publication.

67
Annexes
Annex 1: Sample terms of reference (TOR) for individual project evaluation
Annex 2: Sample questionnaire for executing agency
Annex 3: Types of Performance Indicators Used by the World Bank and their
Applications
Annex 4: Economic/ financial evaluation of infrastructure development projects (EIRR
and FIRR)
Annex 5: Sample ex-post evaluation report

ANNEX 1
68
Annex 1: Sample terms of reference (TOR) for individual project evaluation Note: This sample TOR is based on the TOR from JBIC to consulting firm to assist in individual project evaluation of ODA loan, but is partly modified for more general use.
Terms of Reference for Third-Party Evaluator in the Conduct of an Ex-Post Evaluation of an ODA Loan Project FY2006
Project Monitoring and Evaluation Unit (PMEU)
State Ministry of Planning and Development Project Title: Killiman Multipurpose Dam Construction Project (1) and (2) in the Republic of Impala 1. Background and Purpose of Evaluation 1.1 Background This ex-post evaluation study is a part of project evaluation activities of the Project Monitoring and Evaluation Unit (hereinafter “PMEU”) of the State Ministry of Planning and Development of the Republic of Impala. In FY2006, a total of twelve internationally-assisted projects are subject to ex-post evaluation, and three of them are ODA loan projects assisted by the Japan Bank for International Cooperation (hereinafter “JBIC”). 1.2 Purpose of ex-post evaluation The purpose of ex-post evaluation facilitated by PMEU is to obtain maximum development results through: (i) enhancement of the outcomes/ impacts and sustainability of completed projects by use of recommendations drawn from the evaluation; (ii) enhancement of the quality of on-going or future projects by the application of lessons learned from the evaluation; and (iii) ensuring accountability for taxpayers and donor countries.

ANNEX 1
69
1.3 Evaluation implementation arrangements To ensure objectivity of evaluation, ex-post evaluation studies are conducted by third-party evaluators selected by PMEU. The responsibility of the evaluator is to design, implement and report the evaluation study. The responsibility of PMEU is to (i) plan the evaluation, (ii) select the evaluator, (iii) fund the cost for evaluation, (iv) provide the evaluator with necessary information related to the project to be evaluated, (v) comment on the evaluation results submitted by the evaluator, and (vi) plan the feedback of the evaluation results. The items (iii) to (vi) above will be jointly performed by JBIC. 1.4 Publication The results of the ex-post evaluation studies FY2006 will be published as the annual evaluation report in FY2007. 2. Scope of Work 2.1 Project to be evaluated This study is an ex-post evaluation of the Killiman Multipurpose Dam Construction Project (1) and (2) (hereinafter “the Project”). Phase 1 and Phase 2 are to be regarded to compose one project. The executing agency of the Project is the Directorate General of Water Resources Development, Ministry of Public Works. 2.2 Evaluation criteria The Project is to be evaluated using the DAC Five Evaluation Criteria (i.e., relevance, efficiency, effectiveness, impact and sustainability), which is an international standard. 2.3 Tasks of the evaluator The evaluator is to perform the following tasks: 1) Design the ex-post evaluation study along with the DAC Five Evaluation Criteria and propose the design in the form of the evaluation design sheet. Submit the evaluation design sheet to PMEU and JBIC for their comments. 2) Prepare questionnaires and other survey instruments, such as checklists and interview sheets, to be used for the study. Submit those materials to PMEU and JBIC for their comments.

ANNEX 1
70
3) Collect data/ information for evaluation in such ways as documentation review, hearings from the executing agency and other Project-related organizations, surveys to direct and indirect beneficiaries, observation and direct measurement. 4) Analyze the collected data/ information and compile the evaluation findings in the form of the evaluation summary sheet. Give ratings to evaluation results for each of the DAC Five Evaluation Criteria and come up with the overall rating of the Project, following the methodology proposed by JBIC. Submit the evaluation summary sheet with the rating results to the executing agency, PMEU and JBIC for their comments. 5) Discuss the contents of the evaluation summary sheet with PMEU and JBIC and finalize them. 6) Prepare the ex-post evaluation report based on the finalized version of the evaluation summary sheet, and submit it to PMEU and JBIC for their comments. 7) Submit PMEU the final version of the ex-post evaluation report with the supplementary information collected through the study. 3. Qualification and Estimated Work Volume of the Evaluator. 3.1 Evaluator (1 person) The evaluator should have good communication skills and truck records in varieties of development activities, especially in project evaluation. The estimated work volume of the evaluator is 1.5 person months. 3.2 Research Assistant The evaluator may hire research assistants, who could be skillful in- and knowledgeable of the sector(s) concerned in the Project and/or social surveys. The TOR of the research assistants might include the follow-up of the data/ information collection by the evaluator as well as design, implementation and reporting of surveys to direct and indirect beneficiaries.

ANNEX 1
71
4. Time Frame (2006) July Selection of the evaluator, contract between PMEU and the evaluator,
commencement of the evaluation work. September Submission of the draft evaluation summary sheet from the evaluator to
PMEU. November Submission of the draft ex-post evaluation report from the evaluator to
PMEU. December Completion of the evaluation work. 5. Cost of Evaluation The maximum cost for the evaluation is $29,900 including taxes and duties. (US dollar)
Remuneration 5,000 /month x 1.5 months= 7,500Travel allowances 100 /day x 20 days= 2,000Airfare for fieldwork 150 /trip x 2 trips= 300Land transportation 100 /day x 45 days= 4,500Communication 100 /week x 6 weeks= 600Research assistant and survey cost lump-sum 15,000TOTAL 29,900

ANNEX 2
72
Annex 2: Sample questionnaire for executing agency
Questionnaire
for Post Evaluation Survey 2004
on JBIC-financed Projects
Jakarta Fishing Port/ Market Development Project (4) Objectives of the Survey: The main objectives of the survey are: 1) to review the implementation of the project and assess its effectiveness and impacts, so that
we may draw lessons to reflect in future JBIC projects thereby enhancing the quality of JBIC’s assistance operation; and
2) to review the current situation, operation, maintenance and management of the completed project, so that we may make recommendations, if necessary, to the Borrower/Executing Agency to ensure proper operation in the future.
Contact Person: (1) Name: (2) Position/Title: Basic Concept of Evaluation: Post evaluation on JBIC-financed projects is exercised in view of five evaluation criteria, i.e. (1) Relevance, (2) Efficiency in Implementation, (3) Effectiveness, (4) Impact, and (5) Sustainability. Questionnaire consists of six parts (from Block A to F). Each part/block has questions relating to five evaluation criteria. If information or data requested in this Questionnaire is not readily available, please kindly provide alternative indicators and data, which meet the objectives of this questionnaire survey under the five evaluation criteria.

ANNEX 2
73
Five Evaluation Criteria
Evaluation Criteria Expected Respondent to Questionnaire
(1) RELEVANCE Question whether project objectives, overall goals, and project scope were/are in line with the priority needs and concerns of the recipient country at the time of the project appraisal as well as the post evaluation. This criteria will focus on the recipient country’s development policy/plan, the needs of beneficiaries, and the donor’s policy.
(2) EFFICIENCY Measure how efficiently the various inputs are converted into outputs of the project during the implementation process (productivity of implementation process). This criterion will examine the appropriateness of inputs such as project cost and its volume, implementation schedule, timing, institutional/organizational function.
(3) EFFECTIVENESS Examine the extent to which the project objectives have been achieved in relation to the outputs. This criteria will include quantitative analysis based on operation and effect indicators of JBIC, and will also include a re-calculation of the Internal Rate of Return (IRR).
(4) IMPACT Identify the extent to which overall goal of the project has been achieved, and verify intended and unintended, direct and indirect, positive and negative changes in technical, social-economic, institutional and environmental aspects as a result of the project.
(5) SUSTAINABILITY Question whether project benefits are likely to continue after completion of the project. These criteria will include a study of technical, institutional, and financial aspects in O&M agency/ organization, condition and status of equipment/facilities procured by the project, technology transfer, and ownership of beneficiaries. It will also include an analysis of issues and constraints which may impede sustainability of the project.

ANNEX 2
74
Project Summary: (1) Background
The Jakarta Fishing Port (JFP) has played an important role in fishery activities of the capital city since the commencement of public operation in July 1984. JFP is the first and the only port of its kind throughout Indonesia. It not only serves as a major fishing port but also as a major, possibly the largest, wholesale fish market. At the same time it serves as an integrated center for processing fisheries products, and also as a major export-trade originating point.
The development of the JFP complex, which had been assisted by OECF through three-phase projects, and the demand of the customers utilizing the fishing port facilities have faced shortage of facilities. The necessity of upgrading services was pointed out in the Master Plan Report prepared in December 1988. In addition, the Government of Indonesia has stressed in REPELITA V (1989/90-1993/94) that high priority should be given to increase in the contribution of the fishery sub-sector in the solution of various national problems such as to guarantee the availability of animal protein food stuffs, to improve export of non-petroleum, to create productive working opportunity and to increase fishermen’s/fish farmers’ income.
Considering the above, the Directorate General of Fisheries (DGF), Ministry of Agriculture decided to implement the upgrading works of the fishery infrastructures and sanitary facilities of JFP in line with the recommendation of the Master Plan. The Phase IV Project was designed and implemented to assist these upgrading works.
(2) Objectives The project aims at upgrading fishery infrastructure and sanitary facilities in order to meet the increasing demand of fishing port activities and to maintain the fishing port premises clean. (3) Project Scope The project consists of (i) construction works (foul water in the port disposal culvert, rehabilitation works of revetment, reclamation, quaywall, dredging, soil improvement, etc.) and (ii) buildings and utilities (auction hall, administration office, dormitory, Port Affairs Control Station, toilet and shower house, sewerage works, seawater intake and supply, etc.), (iii) procurement of equipment (powered boat, garbage cart, garbage box, garbage boat, forklift, truck crane, dump truck computers, etc.), and (iv) consulting services. (4) Borrower/Executing Agency The Government of the Republic of Indonesia/Directorate General of Fisheries, Ministry of Agriculture (Directorate General of Capture Fisheries, Ministry of Marine Affairs and Fisheries since 1999) (5) Outline of Loan Agreement
Loan Amount Loan Disbursed Amount
4,009 million yen approx. 3,957 million yen
Date of Exchange of Notes Date of Loan Agreement
October, 1993 November, 1993
Terms and Conditions: Interest Rate Repayment Period (Grace Period) Procurement
2.6 % p.a.
30 years (10 years) General Untied
(LDC Untied for consulting services) Final Disbursement Date December 9, 2002
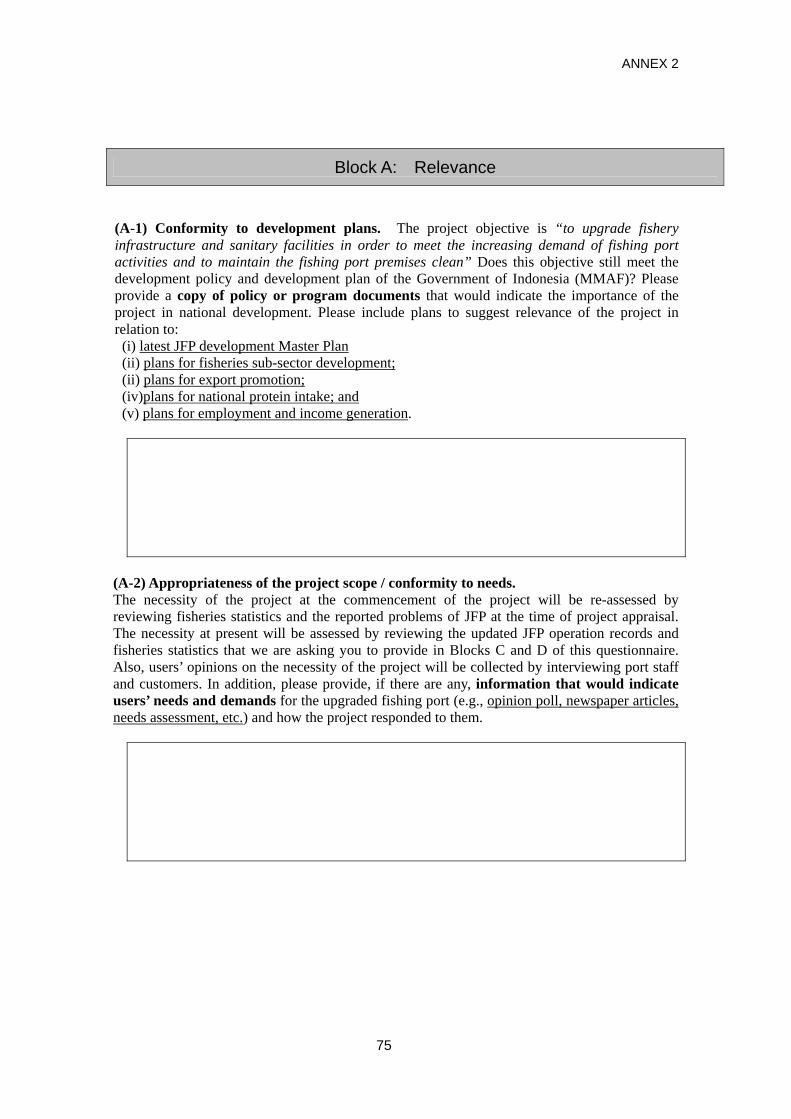
ANNEX 2
75
Block A: Relevance (A-1) Conformity to development plans. The project objective is “to upgrade fishery infrastructure and sanitary facilities in order to meet the increasing demand of fishing port activities and to maintain the fishing port premises clean” Does this objective still meet the development policy and development plan of the Government of Indonesia (MMAF)? Please provide a copy of policy or program documents that would indicate the importance of the project in national development. Please include plans to suggest relevance of the project in relation to: (i) latest JFP development Master Plan
(ii) plans for fisheries sub-sector development; (ii) plans for export promotion; (iv)plans for national protein intake; and (v) plans for employment and income generation.
(A-2) Appropriateness of the project scope / conformity to needs. The necessity of the project at the commencement of the project will be re-assessed by reviewing fisheries statistics and the reported problems of JFP at the time of project appraisal. The necessity at present will be assessed by reviewing the updated JFP operation records and fisheries statistics that we are asking you to provide in Blocks C and D of this questionnaire. Also, users’ opinions on the necessity of the project will be collected by interviewing port staff and customers. In addition, please provide, if there are any, information that would indicate users’ needs and demands for the upgraded fishing port (e.g., opinion poll, newspaper articles, needs assessment, etc.) and how the project responded to them.

ANNEX 2
76
Block B: Efficiency The following questions are based on the PCR (Project Completion Report), which was submitted to JBIC in September 2003 by the Director General of Captured Fisheries (DGCF). (B-1) Project Scope. (B-1-1) Comparison of Original and Actual. Please correct and complete the table below. In particular, please specify the quantity/size of each of the “Actual Scope”.
Table 1: Comparison of Original and Actual (Project Scope)
Items/Activities Original Scope (At time of L/A)
Actual Scope (PCR) Gap/Difference
1. Construction Works 1-1. Foul water in port disposal culvert L. sum Foul seawater cleaning
system: ? Change in seawater cleaning system?
1-2. Rehabilitation works of revetment L. sum ? 1-3. reclamation / sand filling 250,000m3 ? 1-4. Quaywall (D7.5m, W20m) 200m 200m 1-5. Dredging 250,000m3 ? 1-6. Soil improvement 25,000m2 Cancelled Cancellation of soil
improvement 1-7. Ship lifting facilities L. sum Ship repairing facilities: Change in type of facilities?
1-8. Additional Works: rehabilitation of the following facilities (1)Bitt and fender: (2)Breakwater:
- -
(3)Navigation aids:
Addition of bitt and fender, breakwater and navigation aids
2. Buildings and Utilities 2-1. Auction hall for fish from province 2,000m2 Auction hall: ?
Wholesale market: ? Tuna landing center: ?
Addition of Wholesale market and Tuna landing center
2-2. Administration office for UPT 1,500m2 ? 2-3. Dormitory for UPT 840m2 Cancelled Cancellation of dormitory
for UPT 2-4. Port Affairs Control Station L. sum ? 2-5. Toilet and shower house 15 units ? 2-6. Rehabilitation of existing buildings L. sum Rehabilitation of Auction
hall, wholesale market and fishermen hall
2-7. Road and parking L. sum ? 2-8. Planting 50,000m2 ? 2-9. Drainage 12,500m ? 2-10.Sewerage works L. sum ? 2-11.Seawater / intake and supply L. sum ? 2-12.Waste / refuse disposal incinerator L. sum Cancelled Cancellation of waste /
reuse disposal incinerator 2-13.Electric and lighting works L. sum ? 2-14.Water supply and bunkering L. sum ? 2-15.Fishing gear / outfitting repair yard L. sum Cancelled Cancellation of repair yard - - 2-16.Additional work: (1)Muara Baru Center bldg (2)Canteens
Addition of Muara Baru Center building and canteens

ANNEX 2
77
Items/Activities Original Scope (At time of L/A)
Actual Scope (PCR) Gap/Difference
3. Procurement of Equipment 3-1. Powered boat 1 unit Cancelled Cancellation of powered
boat 3-2. Garbage cart 3 units 12 units +9 units 3-3. Garbage box 30 units ? ? 3-4. Garbage boat 1 unit Cancelled Cancellation of garbage
boat 3-5. Forklift (Gasoline) 3 units Forklift solar: 3 units Change in type 3-6. Forklift (Battery) 4 units 5 units +1 unit 3-7. Truck crane 1 unit 2 units +1 unit 3-8. Dump truck 3 units 3 units 3-9. Pallet 100 units Cancelled Cancellation of pallet 3-10.Computer for data processing 5 units 3 units -2 units - - 3-11.Additional equipment (1)Towing tractor: 3 units (2)Backhoe loader: 1 unit (3)Motorcycle: 5 units (4)Computers (5)Vehicle: 4 units
Addition of towing tractor, backhoe loader, motorcycle and project office expenses (computers and vehicle)
4. Consulting Services 4-1. Feasibility study
4-2. Detailed design
Total 177MM (Pro A: 53MM, Pro B: 124MM)
?
4-3. Tendering 4-4. Construction supervision
Total 230MM (Pro A: 69MM, Pro B: 161MM)
?
- - 4-5.Additional work: Study on fisheries development policy formulation in Indonesia: MM?
Addition of study on fisheries development policy formulation
(B-1-2) Reasons for and Effects of Revision/Modification of Project Scope. PCR briefly states the reasons for some of the differences between the original and the actual project scopes. Please describe in more detail the reasons for each difference and positive or negative consequences of such a revision of scope. Cancellation of soil improvement (Item 1.6)
Reasons: Consequences of cancellation:
Addition of wholesale market and tuna landing center (Item 2.1)
Reasons: Consequences of addition:
Cancellation of waste/ refuse disposal incinerator (Item 2.12)
Reasons: (Solid waste will be transported to outside final disposal site) Consequences of cancellation: (Is all solid waste is disposed at outside disposal site?)
Other revision/ modification (please specify)
Modification: Reasons: Consequences:

ANNEX 2
78
(B-1-3) Appropriateness of the foul seawater cleaning system and 7.5m quaywall. According to the Minutes of Discussion dated at the appraisal stage, DGF agreed to conduct studies to re-consider the appropriateness of constructing (i) foul seawater cleaning facilities (culvert) and (ii) 7.5m quaywall. Please provide information about these studies and their results. Simulation study of using culvert for foul seawater cleaning
Report date: Conclusion:
Study on necessity for 7.5m quaywall
Report date: Conclusion:
(B-2) Implementation Schedule. (B-2-1) Comparison of Original and Actual. Please correct and complete the table below.
Table 2: Comparison of Original and Actual (Implementation Schedule)
Items/Activities Original Schedule
(At time of Appraisal) Actual Schedule
(PCR) Loan Agreement November 1993
Selection of consultants June 1993 – June 1994 September 1994 – May 1996
Engineering July 1994 – April 1995 June 1996 – April 1997
(Additional) July 2001 – October 2001 Tender/contract January 1995 – September 1996 (Accelerated*) November 1996 – March 1997
May 1997 – March 1998
Construction October 1996 – September 1998 (Accelerated*) April 1997 – April 1998 August 1998 – June 2001
November 2001 – October 2002
Maintenance (Accelerated*) May 1998 – August 1998 May 1998 – July 2002
(Additional) November 2002 – October 2003
Commencement of Commercial Operation
*Note: Procurement of equipment and sand filling works, which went ahead of other works to catch up with the schedule. (B-2-2) Reasons for delays. According to PCR, the main reasons for the delays in the implementation schedule are (i) delay in selection of consultants, (ii) Asian monetary crisis, and (iii) additional works. Please state your further comments on the reasons for delays, if any.
(B-2-3) Remedial action against delays. According to PCR, sand stockpile work was started separately in advance during design stage to keep up with the schedule. Please state your comment on (i) how effective this measure was to minimize the delays, (ii) other remedial actions taken (if any), and (iii) what could have been done to keep up with the schedule.

ANNEX 2
79
(i) Effectiveness of separate stockpile work: (ii) Other remedial actions: (iii) What could have been done:
(B-3) Project Cost. (B-3-1) Comparison of originally-estimated and actual expenditure (by item). Please correct (if necessary) and complete Tables 3 and 4, which are to show the originally-estimated and actual expenditures by item based on the appraisal documents and PCR, respectively.
Table 3: Originally Estimated Cost Foreign Local Total
Item Total Cost(Mil. Yen)
JBIC (Mil. Yen)
Total Cost(Mil. Rp)
JBIC (Mil. Rp)
Total Cost (Mil. Yen)
JBIC (Mil. Yen)
1. Port facilities 782 782 9,790 1,360
2. Buildings and utilities 839 839 12,213 1,559
3. Equipment 107 107 452 133
4. Price escalation 276 276 3,606 489
5. Tax 0 0 6,002 354
6. Physical contingency 100 100 1,603 195
7. Consulting services 363 363 4,472 627
Total 2,467 2,467 38,138 26,136 4,717 4,009(Exchange Rate used : Rp.1=0.059Yen in 1993 (at the time of the JBIC appraisal))
Table 4: Actual Expenditure (as shown in PCR)
Foreign Local Total Total Cost(Mil. Yen)
JBIC (Mil. Yen)
Total Cost(Mil. Rp)
JBIC (Mil. Rp)
Total Cost (Mil. Yen)
JBIC (Mil. Yen)
1. Construction works 21,900 19,976 1,193 1,151
2. Buildings and utilities 64,326 59,179 2,133 2,033
3. Equipment 3,621 3,280 146 135
4. Project Office 10 10 223 223 10 10
5. Consulting services 474 474 9,762 9,762 626 626
Total 99,832 92,421 4,108 3,955(Exchange Rate used : Rp.1 = JPY 0.016 (average rate at disbursements))
(B-3-2) Comparison of originally-estimated and actual expenditure (by year). Please correct (if necessary) and complete Tables 5 and 6, which are to show originally-estimated and actual yearly expenditures.

ANNEX 2
80
Table 5: Originally Estimated Yearly Expenditure
Foreign Local Total Breakdown of Cost
(Fiscal Year) Total Cost (Mil. Yen)
JBIC (Mil. Yen)
Total Cost (Mil. Yen)
JBIC (Mil. Yen)
Total Cost (Mil. Yen)
JBIC (Mil. Yen)
1994 109 79 188
1995 36 26 62
1996 409 322 731
1997 1,306 1,255 2,561
1998 607 568 1,175
TOTAL 2,467 2,250 4,717 (Exchange Rate used : Rp.1=0.059Yen in 1993 (at the time of the JBIC appraisal))
Table 6: Actual Yearly Expenditure (as shown in PCR) Foreign Local Total Breakdown of
Cost (Fiscal Year)
Total Cost (Mil. Yen)
JBIC (Mil. Yen)
Total Cost (Mil. Yen)
JBIC (Mil. Yen)
Total Cost (Mil. Yen)
JBIC (Mil. Yen)
1994 0
1995 0
1996 194
1997 365
1998 782
1999 1,025
2000 822
2001 369
2002 394
TOTAL 3,951(Exchange Rate used : current price in each year? ) (B-3-3) Reasons for difference between original cost and actual expenditure. According to PCR, there is no cost overrun despite some additional works and extension of construction period (and consequent extension of consulting services). Please state notable points in cost management, if any.
(B-4) Project Implementation System. (B-4-1) Consultant and contractor. PCR states that there were no problems with the
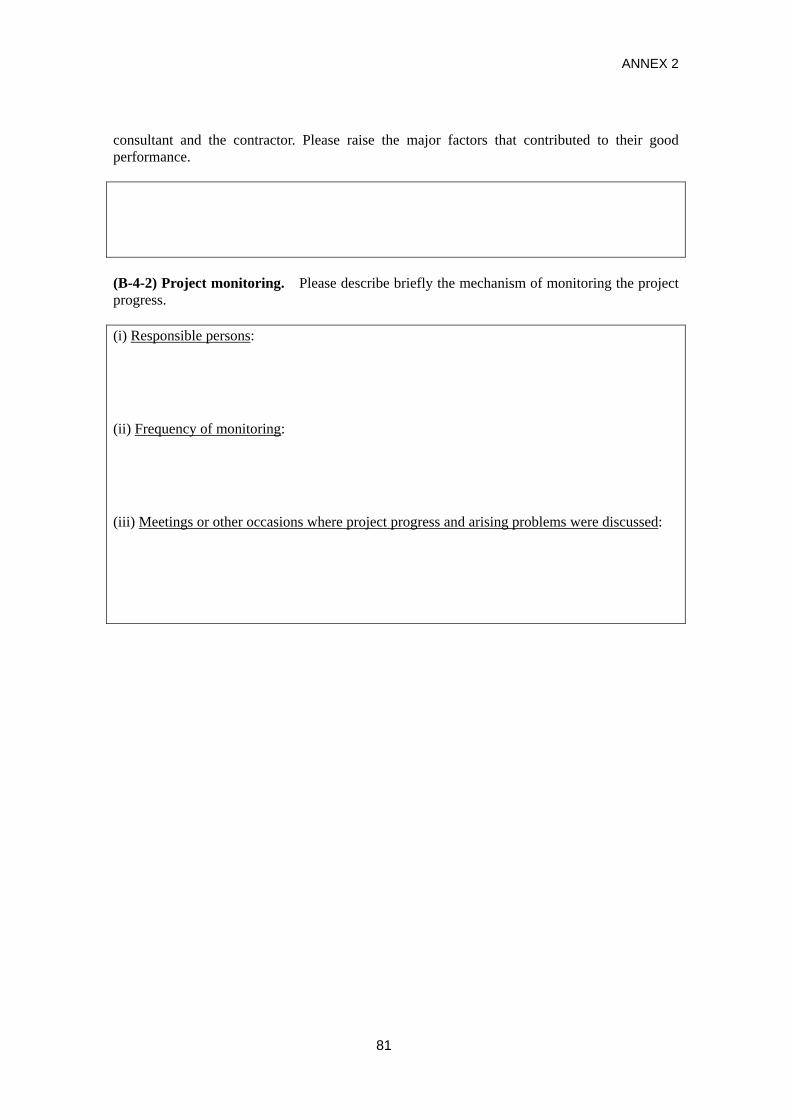
ANNEX 2
81
consultant and the contractor. Please raise the major factors that contributed to their good performance. (B-4-2) Project monitoring. Please describe briefly the mechanism of monitoring the project progress. (i) Responsible persons: (ii) Frequency of monitoring: (iii) Meetings or other occasions where project progress and arising problems were discussed:

ANNEX 2
82
Block C: Effectiveness (Achievement of Project Objective) (Note) Block C examines the extent to which the project objective, i.e. “to upgrade fishery infrastructure and sanitary facilities in order to meet the increasing demand of fishing port activities and to maintain the fishing port premises clean,” has been achieved by the outputs produced by the project. (C-1) Utilization of the Project Facilities and its Outcomes. (C-1-1) Operation of JFP. Please provide statistics related to fishing port activities for 1994-2004 by filling out the tables below.
Table 7: Projected Number of Fishing Vessels entering into Jakarta Fishing Port (Demand forecast at Appraisal) Fishing Vessel based on Gross Ton Year
<30 30-50 50-100 100-200 >200 Total
1994 1995 1996 1997 1998 1999 2000 2001 2002 2003 2004
Table 8: Actual Number of Fishing Vessels entered in Jakarta Fishing Port (Actual record)
Fishing Vessel based on Gross Ton Year <30 30-50 50-100 100-200 >200
Total
1993 1994 1995 1996 1,218 883 1,412 1,254 102 4,869 1997 2,969 529 1,278 1,100 107 5,983 1998 3,046 325 978 1,250 100 5,699 1999 3,038 579 1,169 1,320 129 6,235 2000 2,320 1,331 1,292 1,493 143 6,579 2001 2,557 700 1,376 2,034 133 6,800 2002 2003 2004
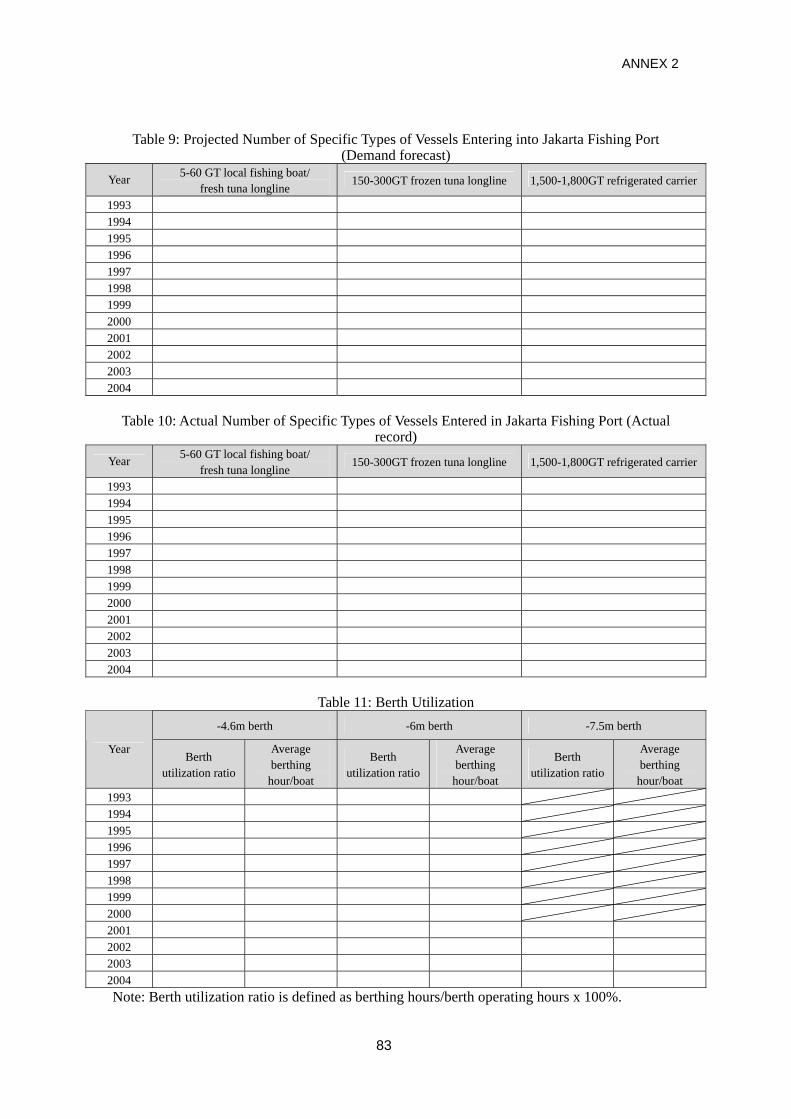
ANNEX 2
83
Table 9: Projected Number of Specific Types of Vessels Entering into Jakarta Fishing Port (Demand forecast)
Year 5-60 GT local fishing boat/ fresh tuna longline
150-300GT frozen tuna longline 1,500-1,800GT refrigerated carrier
1993 1994 1995 1996 1997 1998 1999 2000 2001 2002 2003 2004
Table 10: Actual Number of Specific Types of Vessels Entered in Jakarta Fishing Port (Actual
record) Year 5-60 GT local fishing boat/
fresh tuna longline 150-300GT frozen tuna longline 1,500-1,800GT refrigerated carrier
1993 1994 1995 1996 1997 1998 1999 2000 2001 2002 2003 2004
Table 11: Berth Utilization
-4.6m berth -6m berth -7.5m berth
Year Berth utilization ratio
Average berthing
hour/boat
Berth utilization ratio
Average berthing
hour/boat
Berth utilization ratio
Average berthing
hour/boat 1993 1994 1995 1996 1997 1998 1999 2000 2001 2002 2003 2004 Note: Berth utilization ratio is defined as berthing hours/berth operating hours x 100%.

ANNEX 2
84
For average berthing hours, please include boats that are berthed but not used (if any).
Table 12: Number of Fish Captured in Jakarta Fishing Port Year Fish from land (Ton) Fish from Sea (Ton)
1993 1994 1995 1996 26,077.57 52,047.38 1997 23.499,40 43,724.50 1998 27,754.50 44,291.70 1999 26,077.60 53,879.90 2000 27,904.20 53,470.50 2001 33,414.90 35,760.60 2002 20,476.08 21,792.00 2003 2004
Table 13: Number of Employers at JFP Complex
1993 1994 1995 1996 1997 1998 1999 2000 2001 2002 2003
No. of employers
Table 14: Number of Fish Processing Industries at JFP Complex
1993 1994 1995 1996 1997 1998 1999 2000 2001 2002 2003 Total no. of
industries at JFP 23
No. of HACCP-approved
plants
Please state your comment on the above indicators, if any (e.g. reasons for decreased catches). (C-1-2) Sanitation of JFP Complex. Please fill in the Tables below.
Table 15: Amount of Wastewater Treatment at JFP Complex
Year Hours of operation (per day)Amount of wastewater
treated (m3/day) Rate of wastewater treatment
facility utilization (%)
Target set at appraisal stage
24 1,400
2001
2002
2003
2004 Note: Rate of wastewater treatment facility utilization = average daily treatment amount /

ANNEX 2
85
installation capacity x 100%
Table 16: Treatment of Solid Waste Produced at JFP Complex
Before the Project (1993) After the Project (2004)
Way of solid waste treatment Leave at landfill Transport to final disposal site.
Daily amount of solid waste produced (unit: )
Daily amount of solid waste treated (unit: )
(C-1-3)Compliances with regulations/ standards. Pease provide the formal documents/reports/letters that show the state of compliances to environmental regulations/hygiene standards, such as the following:
- Environmental standards for sea water (in harbor); - Monitoring reports of sea water quality in harbor (Before and after the project phase
IV and recent data) - Standards/ regulations for hygiene of port facilities including fish landing place,
auction hall, wholesale market and fish processing industries; and - Monitoring reports of hygiene of port facilities (Before and after the project phase
IV and recent data) (C-1-4) Utilization of project facilities. If there are any facilities that were constructed/ provided by the project and have not been used for past one year, please list them and state: (i) the reasons for non-utilization and (ii) necessary measures to be taken. (C-1-5) Project Benefits perceived by Port Users. Employers and customers of the port and related facilities as well as neighborhood residents will be interviewed for project benefits for the before/after changes in respect of:
(i) Hygienic situation of the facilities; (ii) Convenience of the facilities: and (iii) Other benefits (including impacts on income) derived from the project.
(C-2) Promoting/Inhibiting Factors for Achievement of Project Objective. (C-2-1) Measures for long-berthed unused vessels. The Minutes of Discussions (MD) at the appraisal stage states, as one of the main points discussed, “DGF shall take necessary measures to arrange ships in the port (including reduction of unused vessels) for efficient utilization of the

ANNEX 2
86
quaywall.” Please describe the measures actually taken by DGF/DGCF or other parties. (C-2-2) Other Factors. Please indicate other factors that promoted/inhibited the effective utilization of the project facilities and the increase in/improvement of fish handlings and port hygiene. Please include, if relevant, the following points, which were mentioned in PCR:
- Subsidence of facilities developed in previous phase projects and countermeasures; - Development of access roads to JFP; - JFP’s policy for utilization of the sewerage wastewater treatment plant (STP); - Effect monitoring system; etc.
Promoting Factors
Inhibiting Factors
(C-3) FIRR (Annual Revenue and O&M Expense of the Project). (C-3-1) Revenue and O&M expenditures. The Financial Internal Rate of Return (FIRR) will be re-calculated based on the same assumption of JBIC appraisal report by using the data stated in Tables 17and 18 below. In filling out the tables, please (i) highlight the revenue items that are developed by this project (i.e. Phase IV) and (ii) exclude depreciation and interest payments.
Table 17: Operating Revenue of Jakarta Fishing Port (Actual record) Unit: Million Rp.
Year 1 1994
Year 2 1995
Year 31996
Year 41997
Year 51998
Year 61999
Year 72000
Year 8 2001
Year 9 2002
Year 102003
Wharfage Cold storage rental fee
Freezer rental fee Ice sales revenue Office/ building rental revenue
Land rental revenue Entrance fee revenue
Fresh water sales revenue
Fuel tank rental revenue
Equipment rental revenue
Retribution of fish auction
Charge for transshipment of frozen fish
Total

ANNEX 2
87
Table 18: Investment and Operation and Maintenance Expenditures for the Project (Unit: Million Rp.)
Year 1 1994
Year 2 1995
Year 3 1996
Year 4 1997
Year 5 1998
Year 6 1999
Year 7 2000
Year 8 2001
Year 9 2002
Year 102003
Project Cost
Operation Cost
Maintenance Cost
(C-4-2) Projected revenue and O&M expenses. Please provide a forecast/estimate of revenue and O&M expense in the following table. If revenue forecast has been revised due to external factors, please put the revised figures on the line “Revenue A’”. In filling out the table, please exclude (i) revenue from infrastructures that were not developed by the Phase IV project and (ii) depreciation and interest payments.
Table 19: Revenue and O&M Expenses (Estimates) for the Project (Unit: Million Rp.) (Year11)
2004 (Year12)
2005 (Year13)
2006 (Year14)
2007 (Year15)
2008 (Year16)
2009 (Year17)
2010 (Year18)
2011 (Year19)
2012 (Year20)
2013
Revenue
Operation Cost
Maintenance Cost
(Year21)
2014 (Year22)
2015 (Year23)
2016 (Year24)
2017 (Year25)
2018 (Year26)
2019 (Year27)
2020 (Year28)
2021 (Year29)
2022 (Year30)
2023
Revenue
Operation Cost
Maintenance Cost
Please state assumptions for the revised forecast/estimate in the above table.
(C-4-3) Existing FIRR and EIRR calculations. If there are any recent calculations of FIRR and the economic internal rate of return (EIRR), please provide them with the background documents.

ANNEX 2
88
Block D: Impact (D-1) Impact on Fisheries Development. Please fill in the Table 20 below, or designate the statistical documents that contain the required data.
Table 20: Fisheries Statistics of Indonesia
1994 1995 1996 1997 1998 1999 2000 2001
2002
2003
Fish catches (000 ton) Per capita consumption of fishery product (kg/year)
Per capita animal protein intake (kg/year)
Export of fishery product (Million US$) Total
Handled at JFP Fish processing products (ton) Total
From JFP Complex Nominal GDP (unit: ) Total
Fisheries sub-sector Real GDP Growth (%) Total
Fisheries sub-sector Private investment in fisheries sub-sector (Unit: ) Total
JFP Complex Employments in fisheries sub-sector (person) Total
Number of fishermen Income of fishermen (Unit: ) National
At JFP No. of fishing vessels (Unit: )

ANNEX 2
89
(D-2) Impact to Surrounding Ocean Area. (D-2-1) Conditions of Sediments. Please provide answers to the following questions and attach some evidences for your answers.
(i) Did the flip-out of sediments occur due to dredging works?
(ii) If the answer to (i) is yes, what countermeasures were taken?
(iii) Isn’t sedimentation of toxic substances such as dioxin or PCB confirmed?
(D-2-2) Disposal of dredged soil. Please provide answers to the following questions and attach some evidences for your answers.
(i) How was dredged soil disposed (i.e. disposed off shore or land filled)?
(ii) In case of off shore disposal, did turbidity of the ocean water occurred?
(iii) In case of off shore disposal, did you have enough information on impact of turbidity to
ecosystem or fishing activities? What measures were taken to mitigate this problem?
(iv) In case land filling by use of dredged soil, was there a problem of effluent spill? In such a
case, what measures were taken to mitigate the problem?
(D-3) Other Impacts. If there are any other positive and/or negative impacts, including those that were not foreseen at the time of the project appraisal, please describe them below with some evidences (for example, positive impacts might include improvement of living climate and effects of mangrove plantation). In case of negative impacts, please explain any counter- measures currently being taken.
Positive Impacts
Negative Impacts

ANNEX 2
90
Block E: Sustainability (Note) According to PCR, PERUM PPS Cabang Jakarta and UPT-PPSJ are to be responsible for Operation and Maintenance (O&M) of the project facilities. Block E examines sustainability or self- sufficiency of the project from an institutional, technical and financial perspective. (E-1) O&M organizations. (E-1-1) Division of O&M Roles. Please complete the table below. In filling out the table, please highlight the infrastructures developed by this project (i.e. Phase IV).
Table 21: Roles of O&M Agencies
Planned (M/D) Actual (As of August 2004)
O&M tasks PERUM UPT PERUM UPT Others
(specify)
1. Port facilities 1.1 Entrance channel and basin * 1.2 Breakwater * 1.3 Revetment * 1.4 Quaywall * 1.5 Reclamation * 1.5 Beacon * 2. Infrastructure 2.1 Road * 2.2 Parking * 2.3 Drainage * 2.4 Sewerage * 2.5 Water supply * 2.6 Electrical supply * 2.7 Outdoor lighting * 2.8 Fuel oil supply * 2.9 Landscaping * 3. Refrigeration facilities 3.1 Cold storage * 3.2 Freezer * 3.3 Ice plant * 3.4 Handling equipment * 4. Other buildings 4.1 Administration office * 4.2 Auction hall * 4.3 Fish market hall * 4.4 Sheds * 4.5 Workshop * 4.6 Workhouse * 4.7 Gate * 4.8 Police office * 4.9 Fishermen meeting hall * 4.10 Public toilets * 4.11 Security guard *

ANNEX 2
91
Planned (M/D) Actual (As of August 2004)
O&M tasks PERUM UPT PERUM UPT Others
(specify)
4.12 Dormitory (wisma mina) * 4.13 Seawater intake * 4.14 Workshop * 5. Ship repairing facilities * 6. Fisheries industrial area * 7. Stevedore * 8. Garbage and cleaning * 9. Fishing boat entrance control * Others (specify)
In case there are changes from the original division of roles for O&M, please state the reasons for differences.
(E-1-2) Organizational Structures. Please provide the latest organization charts of DGCF, PERUM and UPT, if they are revised from those attached in PCR.
(E-1-3) O&M Staff Allocation. Please complete Table 22, which is to show the number of technicians of PERUM and UPT.
Table 22: O&M staff allocation PERUM UPT
Section/Position Number of O&M staff
Average employment
period
Number of O&M staff
Average employment
period
PCR states that the number of O&M staff is insufficient. Please state the condition at present (including the required number of O&M staff) and what could be done to improve the situation.
(E-1-4) O&M Training. Please provide information on staff training after the completion of the project.

ANNEX 2
92
Table 23: State of Current Staff Training at PERUM (Year: )
Name of training
organization
Training title/
subject
Location Length of training course
Qualification of trainees
Total No. of
Trainees
Fee
Table 24: State of Current Staff Training at UPT (Year: )
Name of training
organization
Training title/
subject
Location Length of training course
Qualification of trainees
Total No. of
Trainees
Fee
(E-2) Financial Status of O&M agency. Please provide the financial statements (balance sheet, profit-and-loss statement and cash flow table) of PERUM and UPT of past three years. Also, please provide your comment and recommendations concerning the present financial status.
(E-3) Current Conditions of Project Facilities. (E-3-1) Overall Conditions. Please fill out Table 25 below. Also, please show, on occasion of the site observation of the evaluation teams, some of the O&M records.
Table 25: Current condition of project facilities/ equipment Item Condition
(Good, Fair, Poor) Problems arisen and
measures taken Sewerage wastewater treatment plant (STP)
Buildings Ship Repairing Slipway
Quaywall Other facilities/equipment (specify)
(E-3-2) Dredging. Please provide the recent and planned dredging works after the completion of the project facilities, if any.
Table 26: Dredging Works Implemented Year Amount Cost Comments and problems
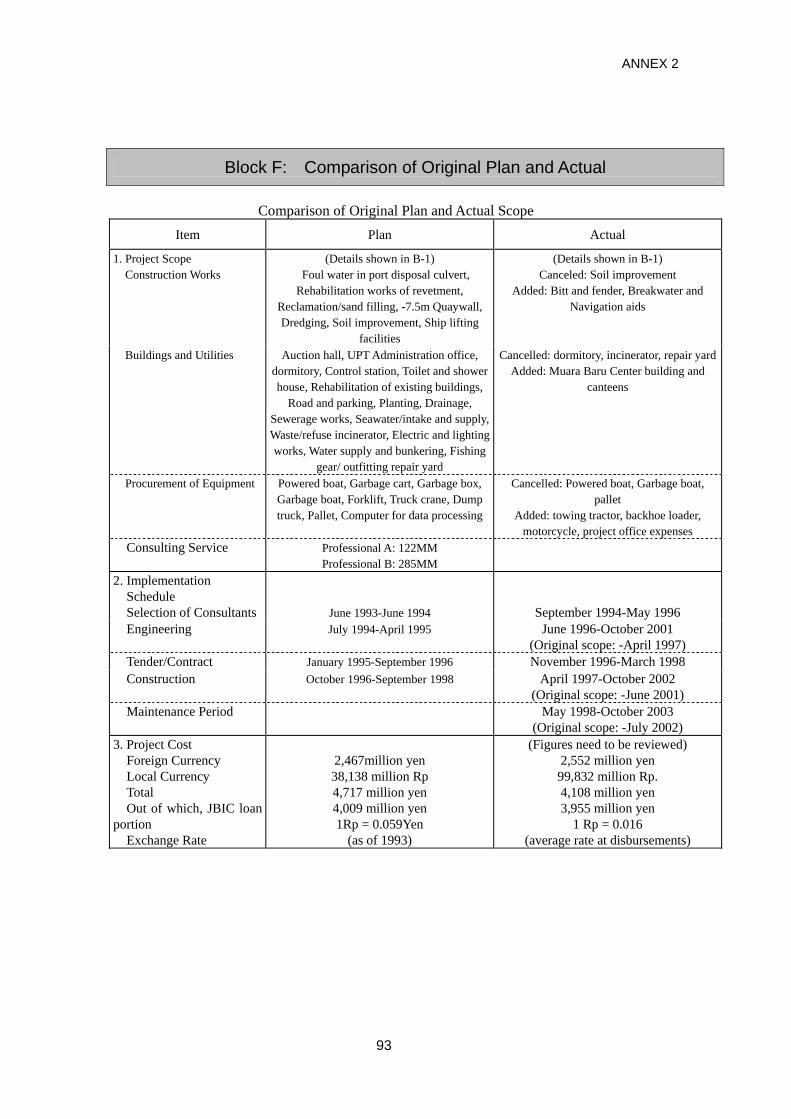
ANNEX 2
93
Block F: Comparison of Original Plan and Actual
Comparison of Original Plan and Actual Scope Item Plan Actual
1. Project Scope Construction Works
(Details shown in B-1) Foul water in port disposal culvert,
Rehabilitation works of revetment, Reclamation/sand filling, -7.5m Quaywall, Dredging, Soil improvement, Ship lifting
facilities
(Details shown in B-1) Canceled: Soil improvement
Added: Bitt and fender, Breakwater and Navigation aids
Buildings and Utilities Auction hall, UPT Administration office, dormitory, Control station, Toilet and shower house, Rehabilitation of existing buildings,
Road and parking, Planting, Drainage, Sewerage works, Seawater/intake and supply, Waste/refuse incinerator, Electric and lighting works, Water supply and bunkering, Fishing
gear/ outfitting repair yard
Cancelled: dormitory, incinerator, repair yardAdded: Muara Baru Center building and
canteens
Procurement of Equipment Powered boat, Garbage cart, Garbage box, Garbage boat, Forklift, Truck crane, Dump truck, Pallet, Computer for data processing
Cancelled: Powered boat, Garbage boat, pallet
Added: towing tractor, backhoe loader, motorcycle, project office expenses
Consulting Service Professional A: 122MM Professional B: 285MM
2. Implementation Schedule
Selection of Consultants
June 1993-June 1994
September 1994-May 1996 Engineering July 1994-April 1995 June 1996-October 2001
(Original scope: -April 1997) Tender/Contract January 1995-September 1996 November 1996-March 1998 Construction October 1996-September 1998 April 1997-October 2002
(Original scope: -June 2001) Maintenance Period May 1998-October 2003
(Original scope: -July 2002) 3. Project Cost
Foreign Currency Local Currency Total Out of which, JBIC loan
portion Exchange Rate
2,467million yen 38,138 million Rp 4,717 million yen 4,009 million yen 1Rp = 0.059Yen
(as of 1993)
(Figures need to be reviewed) 2,552 million yen 99,832 million Rp. 4,108 million yen 3,955 million yen
1 Rp = 0.016 (average rate at disbursements)
ANNEX 2
94
Profile of Respondent to Questionnaire Name:
Organization and Title: TEL/FAX:
E-mail: Date of Answer:
Profile of JBIC Evaluator (Interviewer)
Name: Organization and Title: Period of Site Survey:
TEL/FAX: E-mail:
Local Contact: TEL/FAX:

ANNEX 3
95
Annex3: Types of Performance Indicators Used by the World Bank and their Applications 1. Types of performance indicators According to the Performance Monitoring Indicators Handbook (1996), the World Bank sets performance indicators for the following types according to their causal relationships (vertical logic) with project components. The underlined indicators are those deemed necessary for inclusion in all World Bank projects.
Types of World Bank Performance Indicators and their Relationships
Source: Prepared with reference to World Bank (1996) Performance Monitoring Indicators Handbook
Definitions of performance indicators (with examples)
Results indicators: Indicators to measure the results of a project. Also known as direct indicators. • Input indicators: Indicators to measure the resources input in order to carry out
project activities (e.g. funds, personnel, quantities and usage of equipment and materials)21
• Output indicators: Indicators to measure the goods and services produced from the project inputs (e.g. total length of roads built, numbers of people vaccinated).
• Outcome and impact indicators: Indicators to measure social and economic changes (outcomes) produced by the goods and services provided by the project
21 The World Bank’s Performance Monitoring Indicators Handbook includes “funds used for civil works and consulting services” under input usage for input indicators, and “training activities” and “educational programs” under activity indicators.
RISK INDICATORS RESULTS (DIRECT) INDICATORS EFFICACY INDICATORS
Risks
Relevance
Outcomes and Impacts
Outputs
Inputs
Sustainability
Effectiveness
Risks
Risks
Efficiency

ANNEX 3
96
(e.g. increase in traffic volume, reductions in disease due to vaccinations). • Relevance indicators: These indicators measure the influence of project impacts
and outcomes on higher-order or wider-ranging policy tasks (e.g. economic progress due to reduced transport costs, achievement of national health targets).
Risk indicators: These indicators measure the degree of risk manifestation, which has a strong impact on the success or failure of the project.
Efficacy indicators: Indicators that measure the degree to which achievement of objectives on one level lead to achievement of objectives on the next level. • Efficiency indicators: The ratio of inputs to the outputs generated by the project. • Effectiveness indicators: The ratio of outputs (or inputs) to outcomes and impacts
(e.g. number of vaccinations or vaccine cost per unit reduction in disease incidence rates, number of kilometers of road construction per unit increase in vehicle usage rate).
• Sustainability indicators: The level of long-term sustainability of the project (e.g. movements in disease incidence rates after the end of a vaccination project, road maintenance condition after the completion of construction).
2. World Bank Project Cycle and Performance Indicators The Performance Monitoring Indicators Handbook covers the stages of the World Bank’s project cycle and performance indicators as described below. How performance indicators are used in the project cycle
The project identification, preparation and pre-appraisal stages. • Carry out a baseline survey. • Analyze sector data. • Identification of risk factors and enabling factors.
Appraisal and negotiation stages • Set performance indicators for inputs, outputs, outcomes, impacts and risks. • For each of the above indicator categories, the World Bank selects not more than
six main performance indicators, which are stated in the appraisal record and the loan agreement as a benchmark for monitoring.
Implementation and supervision stages • Collect data on the set performance indicators at regular intervals. • If the initially set indicators become inappropriate due to changes in assumptions
or revised project design, the Bank and borrower may set new indicators. Evaluation stage
• Evaluate the level of achievement (outcome and impact indicators) of development objectives after the project is completed.

ANNEX 4
97
Annex 4: Economic/ financial evaluation of infrastructure development projects (EIRR and FIRR) ~Economic Internal Rate of Return (EIRR) / Financial Internal Rate of Return (FIRR)~
JBIC uses the method of Economic Internal Rate of Return (EIRR) and/or Financial
Internal Rate of Return (FIRR), for assessing economic and financial feasibility of projects at
the time of appraisal. EIRR and FIRR are recalculated during and after the project.
1. Definition of IRR (Internal Rate of Return)
(1) Economic Evaluation and EIRR
(a) Economic Evaluation assesses the economic value of a project by means of cost-benefit analysis, by which project benefits to the national economy are quantitatively compared with the project costs.
(b) EIRR is one standard indicator for economic evaluation, and JBIC normally requires EIRR to be estimated for its ex-ante evaluation. This is to be reviewed at mid-term review and recalculated at ex-post evaluation.
(c) Definition of EIRR: The discount rate at which cost and benefit streams (on the cash flow) over the evaluation period are equalized.
(2) Financial Evaluation and FIRR
(a) Financial evaluation assesses the financial profitability of a project from the viewpoint of the executing agency.
(b) For projects that generate revenues, JBIC normally requires FIRR to be estimated for its ex-ante evaluation. This is to be reviewed at mid-term review and recalculated at ex-post evaluation.
(c) Definition of FIRR: The discount rate at which cost and revenue streams (on the cash flow) over the evaluation period are equalized.
2. Principle of IRR Calculation: Incremental Analysis
Costs and benefits will be compared between the following two cases.
(a) With Project Case: The project will be implemented. (E.g. The facility will supply raw water for residential and industrial use.)
(b) Without Project Case: No investment will be made. (E.g. There is no new water supply facility, thus no improvement in the supply of raw water for residential and industrial use. The deterioration of the existing facility will cause decrease in water supply.)
See the next figure for With / Without comparison of project.

ANNEX 4
98
Figure : With / Without Comparison of an Multipurpose Dam Construction Project
3. Basic Steps for IRR Calculation
(a) Identify the project framework for differentiating the change caused by the project. (set the “With-Project Case” and “Without-Project Case”.)
(b) Set a project life. See Sections 4 for details. Evaluation period is the period from the first year of the project investment until the last year of the project life.
(c) Identify annual costs and benefits during the evaluation period. See Sections 5 and 6 for details.
(d) Transform nominal prices into real prices (constant prices of the base year), in order to exclude the inflation factor during a long project life.
(e) For EIRR calculation, convert the “market prices” into “economic prices” to eliminate the effects of price distortion. See Section 7 for details.
(f) Calculate the cash flow (net benefits) by deducting costs from benefits. (g) Calculate the EIRR and FIRR from the annual cash flow.
4. Project life
Project life, which is the lifetime of the infrastructure to be developed, depends on the
type of the infrastructure. The following table shows average project life of selected types
of infrastructure.
Users of water and electricity supply
Increase by the Project Implementation
Maximum water supply capacity: Without case
Demand forecast
Maximum water supply capacity: With case
Year
Evaluation Period
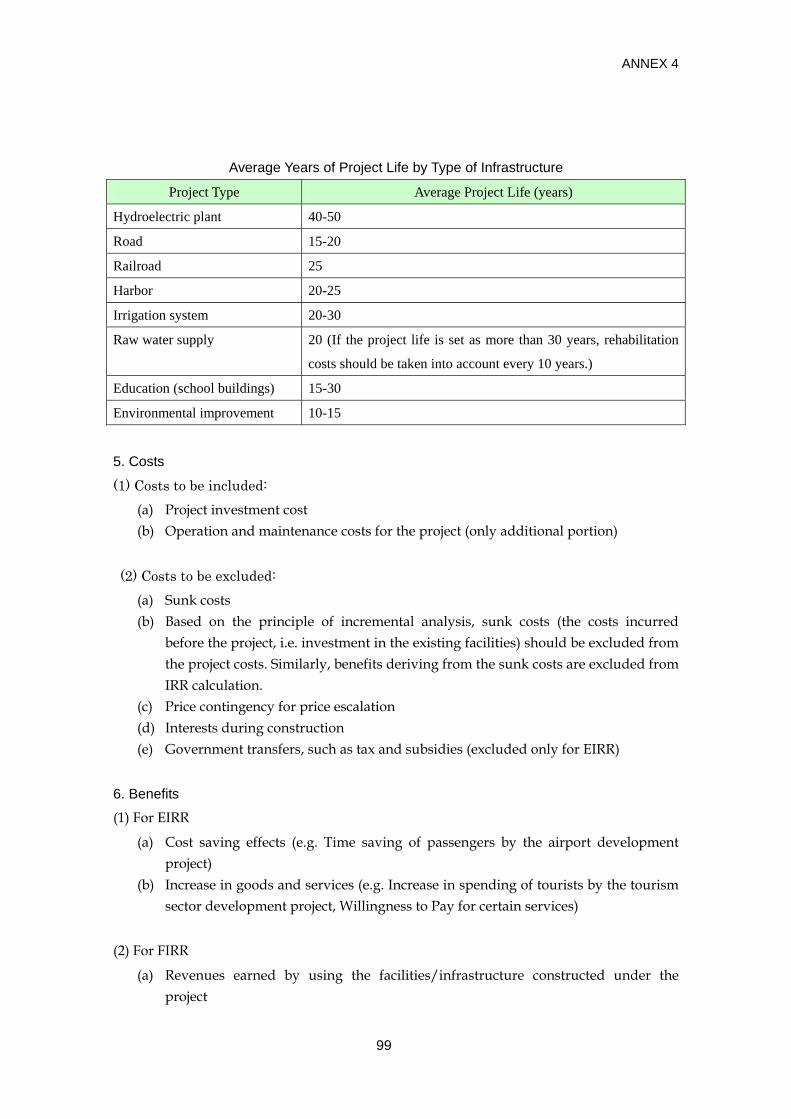
ANNEX 4
99
Average Years of Project Life by Type of Infrastructure
Project Type Average Project Life (years)
Hydroelectric plant 40-50
Road 15-20
Railroad 25
Harbor 20-25
Irrigation system 20-30
Raw water supply 20 (If the project life is set as more than 30 years, rehabilitation
costs should be taken into account every 10 years.)
Education (school buildings) 15-30
Environmental improvement 10-15
5. Costs
(1) Costs to be included: (a) Project investment cost (b) Operation and maintenance costs for the project (only additional portion)
(2) Costs to be excluded:
(a) Sunk costs (b) Based on the principle of incremental analysis, sunk costs (the costs incurred
before the project, i.e. investment in the existing facilities) should be excluded from the project costs. Similarly, benefits deriving from the sunk costs are excluded from IRR calculation.
(c) Price contingency for price escalation (d) Interests during construction (e) Government transfers, such as tax and subsidies (excluded only for EIRR)
6. Benefits
(1) For EIRR
(a) Cost saving effects (e.g. Time saving of passengers by the airport development project)
(b) Increase in goods and services (e.g. Increase in spending of tourists by the tourism sector development project, Willingness to Pay for certain services)
(2) For FIRR
(a) Revenues earned by using the facilities/infrastructure constructed under the project
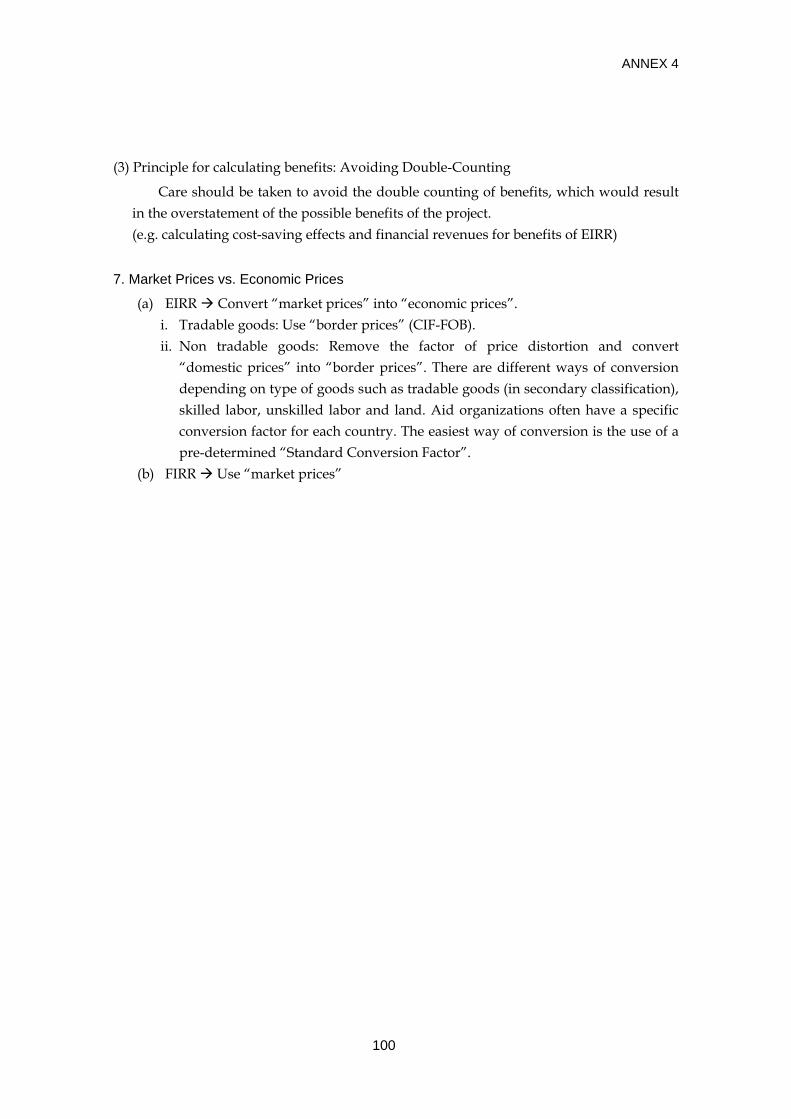
ANNEX 4
100
(3) Principle for calculating benefits: Avoiding Double-Counting
Care should be taken to avoid the double counting of benefits, which would result in the overstatement of the possible benefits of the project. (e.g. calculating cost-saving effects and financial revenues for benefits of EIRR)
7. Market Prices vs. Economic Prices
(a) EIRR Convert “market prices” into “economic prices”. i. Tradable goods: Use “border prices” (CIF-FOB). ii. Non tradable goods: Remove the factor of price distortion and convert
“domestic prices” into “border prices”. There are different ways of conversion depending on type of goods such as tradable goods (in secondary classification), skilled labor, unskilled labor and land. Aid organizations often have a specific conversion factor for each country. The easiest way of conversion is the use of a pre-determined “Standard Conversion Factor”.
(b) FIRR Use “market prices”

ANNEX 5
101
Annex 5: Sample ex-post evaluation report Romania
Port of Constantza-South Development Project Evaluator: Field Study: February 2007
1.Project Profile and Japanese ODA Loan
Map of project area Container yard and container berth 1.1 Background The port of Constantza faces the Black Sea and is the largest port in Romania. It handles some 70% of all freight in Romania (1995). Also, it is the only port in Romania equipped with berths especially designed to handle containers. The port of Constantza is comprised of two parts: (i) the North Port (with a total area of 789 ha), which was completed in 1973; and (ii) the South Port (with a projected total area of 2,837 ha when completed). The construction of the South Port commenced in 1976. The volume of freight handled by the port of Constantza had been decreasing since 1989 due to its aging facilities and the downturn in economic activities in the aftermath of the fall of the socialist regime. However, since 1993, accompanying the economic recovery, the freight handling volume has again tended to increase. Regarding container cargo traffic, in addition to the increase in freight volume, and as a result of the progress made in the containerization of cargo, container cargo traffic has increased sharply from 30,370 TEU in 1993 to 86,268 TEU in 1996. However, the existing container terminal in the North Port (freight handling volume: 90,000 TEU) was almost at saturation point so that further large-scale expansion was out of the question. Consequently, provision of a new container terminal was urgently needed.
Ukraine
Yugoslavia
Moldova
Bulgaria Project Site
Constantza Bucharest
Romania
Hungary


