30
J.C. Guarneri, H.O. Liechty, J.D. Carr, D.A. Marion, J.A. Clingenpeel, and H.L. Adams University of Arkansas at Monticello

J.C. Guarneri, H.O. Liechty, J.D. Carr, D.A. Marion, J.A. Clingenpeel, and H.L. Adams
University of Arkansas at Monticello


Inte
rpol
atio
n M
etho
ds
Inverse Distance Weighted
Local Polynomials
Radial Basis Functions
Kriging
IDW
First Order (LocalF)
Second Order (LocalS)
Multiquadric (MULTI)
Inverse Multiquadric (INVM)
Thin Plate Spline (TPS)
Completely Regularized Spline (REG)
Ordinary Kriging


Statistical analysis did not give an indication of channel arrangement or catchment characteristics

Study Objective Compare channel and catchment
characteristics among various interpolators and cell sizes to see if there are any improvements
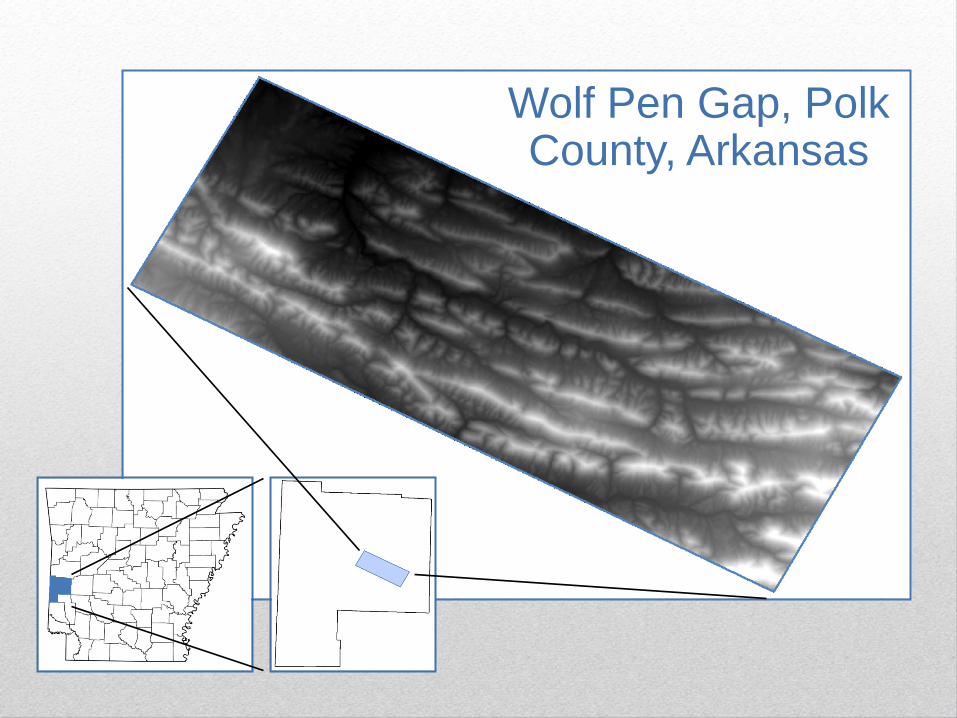
Wolf Pen Gap, Polk County, Arkansas
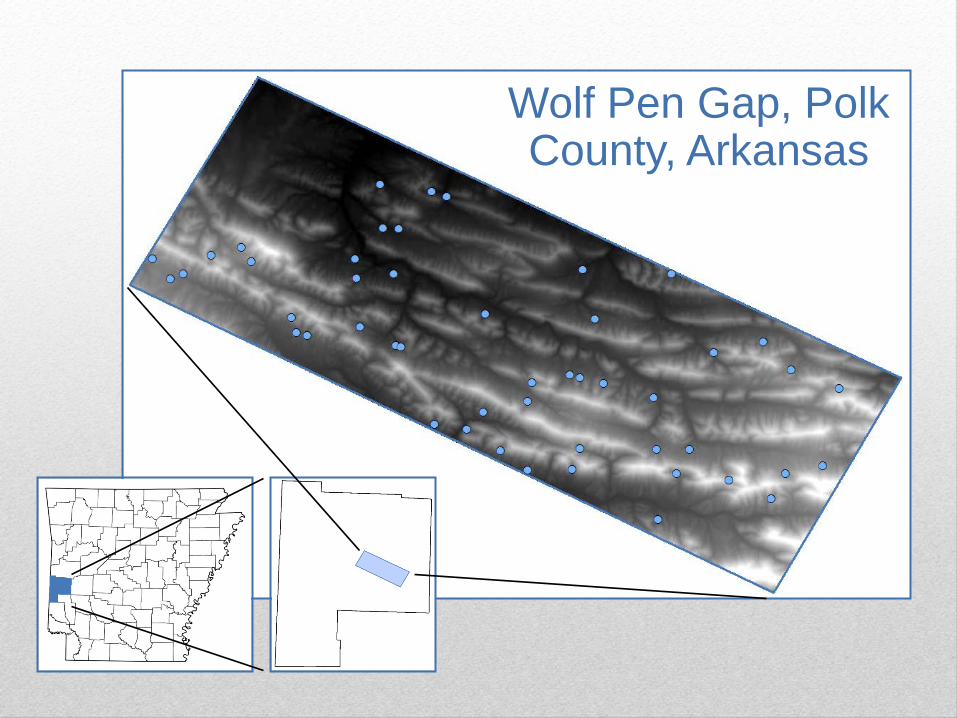
Wolf Pen Gap, Polk County, Arkansas

Watershed Parameters of Interest Catchment Perimeter

Watershed Parameters of Interest Catchment Perimeter
Stream Order

Watershed Parameters of Interest Catchment Perimeter
Stream Order Stream Frequency

Watershed Parameters of Interest Catchment Perimeter
Stream Order Stream Frequency
Stream Length

Watershed Parameters of Interest Catchment Perimeter
Stream Order Stream Frequency
Stream Length Bifurcation Ratio

Watershed Parameters of Interest Catchment Perimeter
Stream Order Stream Frequency
Stream Length Bifurcation Ratio
Drainage Density

Watershed Parameters of Interest Catchment Perimeter
Stream Order Stream Frequency
Stream Length Bifurcation Ratio Drainage Density
Relief Ratio

Watershed Parameters of Interest Catchment Perimeter
Stream Order Stream Frequency
Stream Length Bifurcation Ratio Drainage Density
Relief Ratio Stream Slope

Watershed Parameters of Interest Catchment Perimeter
Stream Order Stream Frequency
Stream Length Bifurcation Ratio Drainage Density
Relief Ratio Stream Slope
Catchment Shape

- Estimated each of the 9 watershed parameters for each interpolation method and cell size
- Compared them to the reference dataset
Inverse Distance Weighted (IDW, 2.5 & 5 meters)
Inverse Multiquadric (INVM, 2.5 & 5 meters)
Completely Regularized Spline (REG, 2.5 & 5 meters)
Digital Elevation Model (DEM_WOLF, 10 meters)

- Performed Kruskal–Wallis and signed-rank tests in SPSS to compare each parameter by
watershed
- Compared differences (interpolator – reference data) using PROC GLM in SAS (n = 49, α = 0.05) to compare each parameter by
watershed

α = 0.05
Comparison of 8 interpolation methods in PROC GLM
F p
Catchment Perimeter 5.53 <.01
Stream Order 0.49 0.82
Stream Frequency 1.08 0.38
Stream Length 0.79 0.58
Bifurcation Ratio 0.47 0.83
Drainage Density 2.39 0.03
Relief Ratio 0.55 0.77
Stream Slope 0.88 0.51
Catchment Shape 0.76 0.60

Difference (interpolator – reference data) for Perimeter by interpolation method
-30
-20
-10
0
10
20
30
40
50
60
DEM_WOLF IDW, 2.5m IDW, 5m INVM, 2.5m INVM, 5m REG, 2.5m REG, 5mAver
age
Diff
eren
ce
Interpolation Method
C
A A
AB AB
BC BC

Difference for Drainage Density by interpolation method
-0.00065
-0.00055
-0.00045
-0.00035
-0.00025
-0.00015
-0.00005DEM_WOLF IDW, 2.5m IDW, 5m INVM, 2.5m INVM, 5m REG, 2.5m REG, 5m
Aver
age
Diff
eren
ce
Interpolation Method
AB
A
A
B
B B B

Conclusions… • Catchment perimeter best described with
Inverse Multiquadric (5m) & Completely Regularized Spline (5m) interpolation methods
Conclusions… • Catchment perimeter best described with
Inverse Multiquadric (5m) & Completely Regularized Spline (5m) interpolation methods

Conclusions… • Catchment perimeter best described with
Inverse Multiquadric (5m) & Completely Regularized Spline (5m) interpolation methods
• Drainage density best described with the Inverse Distance Weighted interpolation method
Conclusions… • Catchment perimeter best described with
Inverse Multiquadric (5m) & Completely Regularized Spline (5m) interpolation methods

Conclusions… • Catchment perimeter best described with
Inverse Multiquadric (5m) & Completely Regularized Spline (5m) interpolation methods
• Drainage density best described with the Inverse Distance Weighted interpolation method
• There was no difference in other parameters of interest due to interpolation method or cell size


Questions?
This study was funded by:


