1 Technical Roundtables on EPA’s Study of the Potential Impacts of Hydraulic Fracturing on Drinking Water Resources WELL INJECTION Jeanne Briskin November 15, 2012 Office of Research and Development
Transcript
1
Technical Roundtables on EPA’s Study of the Potential Impacts of Hydraulic
Fracturing on Drinking Water Resources WELL INJECTION
Jeanne Briskin
November 15, 2012
Office of Research and Development
2
Well Injection
What are the possible impacts of the injection and fracturing process on drinking water resources?
3
Well Injection Research Projects
Secondary Research Questions Applicable Research Projects
1. How effective are current well construction practices at containing gases and fluids before, during, and after fracturing?
Literature Review Service Company Analysis Well File Review Subsurface Migration Modeling Dunn County, ND Bradford County, PA
2. Can subsurface migration of fluids or gases to drinking water resources occur, and what local geologic or man-made features might allow this?
Literature Review Service Company Analysis Well File Review Subsurface Migration Modeling Las Animas County, CO
4
Analysis of Existing Data: Literature Review
Data Sources: • Existing papers and reports, focusing on peer-reviewed literature.
Anticipated Data: • Information on well construction practices related to hydraulic fracturing
and possible subsurface fluid migration.
Research Progress: • Identifying, reviewing, and evaluating existing literature following
procedures in the study plan.
Next Steps: • Continue to review and assess literature related to well injection
according to research questions in the study plan.
5
Analysis of Existing Data: Service Company Data
Data Sources: • Data and information provided by nine hydraulic fracturing service companies.
Anticipated Data: • Information on practices related to establishing mechanical integrity of wells and the
procedures used during hydraulic fracturing.
Research Progress: • Requested information on standard operating procedures (SOPs) for drilling,
response plans to address unexpected circumstances, determinations of material choices for wells and appropriate pressures, and which wells they hydraulically fractured the year prior.
• Seven companies reported 231 protocols. • EPA is assessing the extent to which companies use SOPs and is seeking to
understand well construction practices and maintenance • Performed spatial analysis of the ~25,000 reported wells using GIS.
Next Steps: • Describe the range of operations conducted by the nine service providers. Include
information on the role of the service companies during each stage of the hydraulic fracturing water cycle.
6
Purpose To determine whether drinking water contamination has occurred at the case study locations and if so, identify the cause of contamination.
Retrospective Case Studies
7
Approach • Solicited potential case studies from stakeholders
during public meetings and through the public comment process.
• Identified and narrowed case study candidates based on rigorous criteria.
• Prioritized case studies based on additional criteria. • Selected five case studies to investigate reported
drinking water impacts from shale gas development in the area.
Retrospective Case Studies
8
Approach (cont.) • Case study locations
• Bradford County, PA • Las Animas/Huerfano Counties, CO
• Dunn County, ND • Washington County, PA
• Wise County, TX
Retrospective Case Studies
9
General Analyte List • Gasoline Range Organics and Diesel Range Organics • Volatile and Semi-Volatile Organic Compounds • Major and Trace Cations (Metals) and Anions • Dissolved Organic and Inorganic Carbon • Dissolved Gases (such as methane) • Stable Isotopes • Glycols and Alcohols • Low Molecular Weight Acids • General Water Quality Parameters (e.g., pH, temperature,
specific conductance)
Retrospective Case Studies
10
Bradford County, PA • Areas for research
• Reported ground water and drinking water well contamination • Suspected surface water contamination from a spill of fracturing
fluids • Reported methane contamination of multiple drinking water wells
• Sampling rounds: October/November 2011, April/May 2012 • Sampling locations: domestic wells, springs, stream, pond • Analytical results for first two rounds will be released
concurrently with the 2012 progress report • Working with partners to determine focus and extent of
future sampling events
Retrospective Case Studies
11
Dunn County (Killdeer), ND • Areas for research
• Production well failure during hydraulic fracturing • Suspected drinking water aquifer contamination • Possible soil contamination
• Sampling rounds: July 2011, October 2011, October 2012 • Sampling locations: monitoring wells, drilling supply wells,
domestic wells, municipal well • Analytical results for first two rounds will be released
concurrently with the 2012 progress report • Working with partners to determine focus and extent of
future sampling events
Retrospective Case Studies
12
Las Animas/Huerfano Counties (Raton Basin), CO • Areas for research
• Potential drinking water well contamination (methane and other contaminants) in an area where hydraulic fracturing is occurring within an aquifer
• Sampling rounds: October 2011, May 2012, November 2012 • Sampling locations: domestic wells, production wells,
monitoring wells, stream • Analytical results for first two rounds will be released
concurrently with the 2012 progress report • Working with partners to determine focus and extent of
future sampling events
Retrospective Case Studies
13
Washington County, PA • Areas for research
• Changes in water quality in drinking water, suspected contamination
• Stray gas in wells • Leaky surface pits
• Sampling rounds: July 2011, March 2012 • Sampling locations: domestic wells, springs, stream • Analytical results for first two rounds will be released
concurrently with the 2012 progress report • Working with partners to determine focus and extent of
future sampling events
Retrospective Case Studies
14
Wise County, TX • Areas for research
• Spills and runoff leading to suspected drinking water well contamination
• Sampling rounds: September 2011, March 2012, September 2012 (limited sampling), December 2012 (anticipated)
• Sampling locations: domestic wells, industrial well, production well, ponds
• Analytical results for first two rounds will be released concurrently with the 2012 progress report
• Working with partners to determine focus and extent of future sampling events
Retrospective Case Studies
15
OBJECTIVE: To evaluate the potential for fluids (e.g., natural gas, introduced chemicals, native brines) to move from the fracturing zone to drinking water aquifers using numerical modeling of subsurface fluid migration scenarios. APPROACH: • Collaboration with Lawrence Berkeley National Lab (LBNL). • Design representative scenarios of potential pathways using literature
review and expert judgment. • Upgrade the LBNL model to simulate flow and transport of gas, water,
and dissolved contaminants concurrently in fractures and porous low permeability rock matrix.
• Create numerical grids to solve linked geomechanics (fracture dynamics) and fluid flow.
• Is pathway creation physically possible? • What are potential impacts?
Subsurface Migration Modeling
16
Critical Path for Subsurface Migration Modeling
Run geo-mechanics, flow , transport
models
Literature review
Scenario: production
well pathway
Scenario: induced fractures pathway
Scenario: fault
pathway
Interviews of experts
Empirical data
Scenario: offset wells
pathway
Is pathway physically possible?
Given pathway, what is potential impact on drinking water aquifer (subsurface
residence times, concentrations, fluxes)
CSysun
+ None of the images on this page that need alternate text have it.
CSysun
Content that is not attached to the structure tree will not be read by assistive technology like screen readers.
CSysun
Content that is not attached to the structure tree will not be read by assistive technology like screen readers.
CSysun
Content that is not attached to the structure tree will not be read by assistive technology like screen readers.
CSysun
Content that is not attached to the structure tree will not be read by assistive technology like screen readers.
CSysun
Content that is not attached to the structure tree will not be read by assistive technology like screen readers.
CSysun
Content that is not attached to the structure tree will not be read by assistive technology like screen readers.
CSysun
Content that is not attached to the structure tree will not be read by assistive technology like screen readers.
CSysun
Content that is not attached to the structure tree will not be read by assistive technology like screen readers.
CSysun
Content that is not attached to the structure tree will not be read by assistive technology like screen readers.
CSysun
Content that is not attached to the structure tree will not be read by assistive technology like screen readers.
17
.
LBNL TOUGH: Transport of Unsaturated Groundwater and Heat
FLOW
coupling
TOUGH+RGasH2OCont real gas mixtures plus water plus dissolved contaminants
TOUGH+Rgas real gas mixtures
FLAC3D fault reactivation
ROCMECH fracture creation and propagation
GEOMECHANICS
TOUGH+RGasH2O real gas mixtures plus water
18
Scenario A: Pathway provided by the production well
Well design Well construction? Hydraulic fracturing operation? Physically possible? If present, nature of impact?
Subsurface Migration Modeling
19
Scenario B: Pathway provided by fractures in the overburden
Well design Well construction Hydraulic fracturing operation? Physically possible? If present, nature of impact?
Subsurface Migration Modeling
20
Scenario C: Pathway provided by an activated fault Well design? Well construction Hydraulic fracturing operation? Physically possible? If present, nature of impact?
Subsurface Migration Modeling
21
Scenario D: Pathway provided by offset wells Well design?
Well construction Hydraulic fracturing operation? Physically possible? If present, nature of impact?
Subsurface Migration Modeling
22
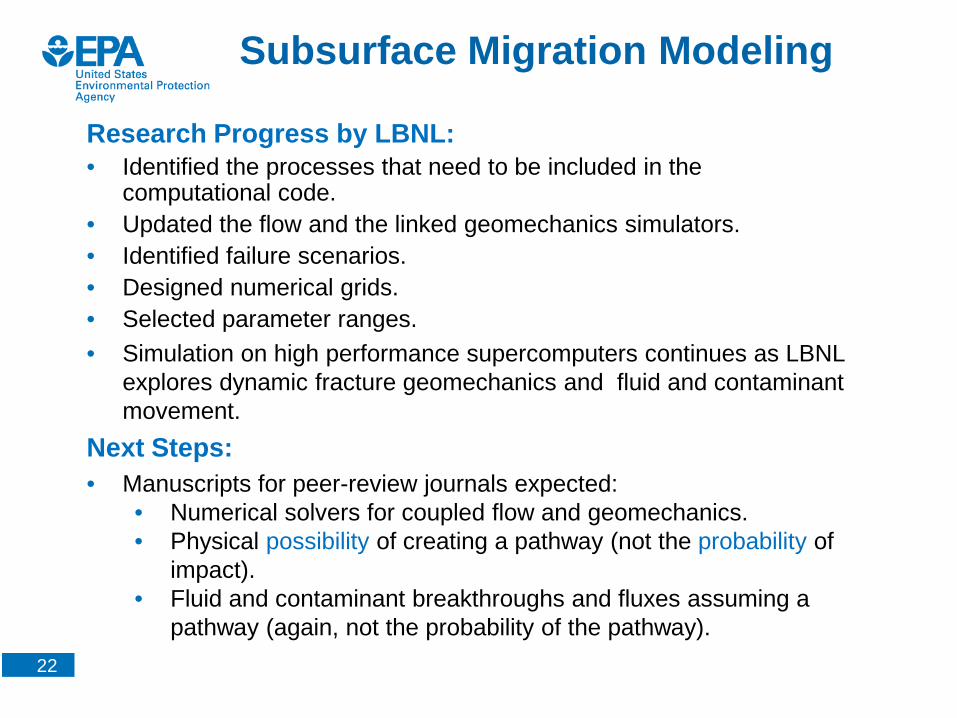
Research Progress by LBNL: • Identified the processes that need to be included in the
computational code. • Updated the flow and the linked geomechanics simulators. • Identified failure scenarios. • Designed numerical grids. • Selected parameter ranges. • Simulation on high performance supercomputers continues as LBNL
explores dynamic fracture geomechanics and fluid and contaminant movement.
Next Steps: • Manuscripts for peer-review journals expected:
• Numerical solvers for coupled flow and geomechanics. • Physical possibility of creating a pathway (not the probability of
impact). • Fluid and contaminant breakthroughs and fluxes assuming a
pathway (again, not the probability of the pathway).
Subsurface Migration Modeling
23
OBJECTIVE: Review files from hydraulically fractured wells in different geographic areas, from different types of wells, and operated by various size companies to identify practices that may have the potential to impact drinking water.
APPROACH: Selected 9 operators to receive a request for well file information
• Compile list of wells hydraulically fractured between September 2009 and September 2010 from list provided to EPA by hydraulic fracturing service companies
• Use groupings to randomly select 350 wells from nine operators across geographic regions and size groups
Requested information for the 350 wells on five topic areas • Geologic maps and cross sections • Drilling and completion information • Water quality, volume, and disposition • Hydraulic fracturing • Environmental releases
Well File Review
24
Research Progress: • Received well files for 333 wells. • Some data were claimed as confidential business information under the Toxic
Substances Control Act (TSCA). • Currently extracting data from the well files and evaluating it to assess the
potential impact on drinking water resources.
Well File Review
25
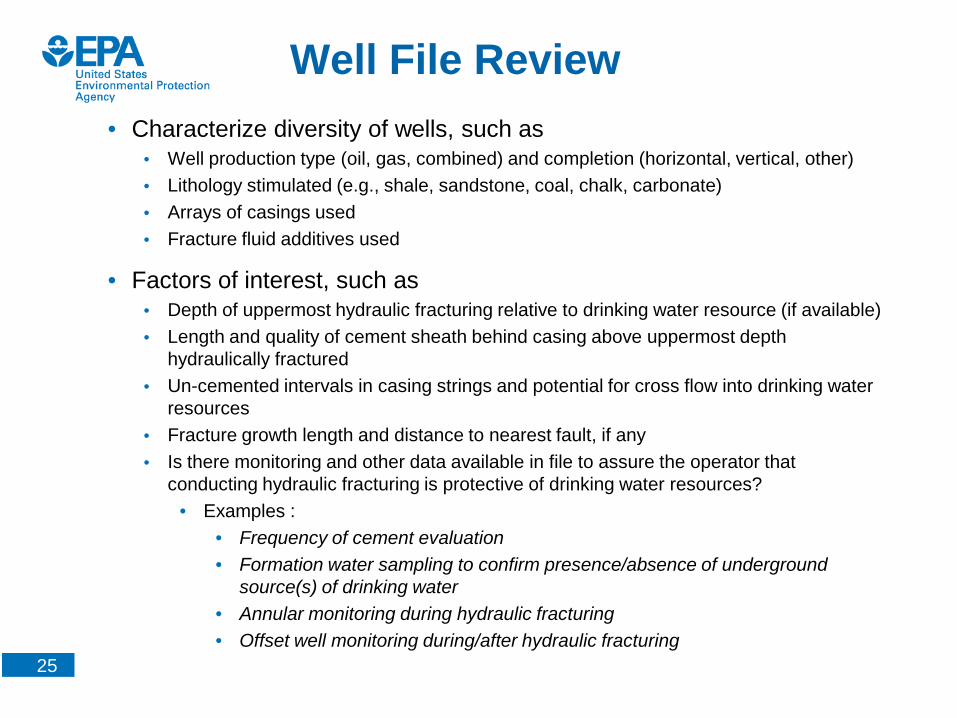
• Characterize diversity of wells, such as • Well production type (oil, gas, combined) and completion (horizontal, vertical, other) • Lithology stimulated (e.g., shale, sandstone, coal, chalk, carbonate) • Arrays of casings used • Fracture fluid additives used
• Factors of interest, such as • Depth of uppermost hydraulic fracturing relative to drinking water resource (if available) • Length and quality of cement sheath behind casing above uppermost depth
hydraulically fractured • Un-cemented intervals in casing strings and potential for cross flow into drinking water
resources • Fracture growth length and distance to nearest fault, if any • Is there monitoring and other data available in file to assure the operator that
conducting hydraulic fracturing is protective of drinking water resources? • Examples :
• Frequency of cement evaluation • Formation water sampling to confirm presence/absence of underground
source(s) of drinking water • Annular monitoring during hydraulic fracturing • Offset well monitoring during/after hydraulic fracturing
Well File Review
26
cement
cement
cement
cement
HF
zon
e
Un-
Cem
ente
d In
terv
al
Generic Well Diagram
Is water zone present?
HC shows present?
0
100
200
Fully Cemented Casings
Neither HC Show nor
Water Zone
Only Water Zone(s)
Only HC Show(s)
Both HC Show(s)
and Water Zone(s)
Not Fully Cemented Casing(s)
Cou
nts
of C
asin
gs
Bar Graph: Number of Casings by Completeness of Cementing and Shows of Hydrocarbons (HC) and Presence of Water Zones in Un-cemented
Depths
Less More
Inherent Construction Protectiveness
Well File Review
CSysun
+ None of the images on this page that need alternate text have it.
CSysun
Content that is not attached to the structure tree will not be read by assistive technology like screen readers.
CSysun
Content that is not attached to the structure tree will not be read by assistive technology like screen readers.
CSysun
Content that is not attached to the structure tree will not be read by assistive technology like screen readers.
CSysun
Content that is not attached to the structure tree will not be read by assistive technology like screen readers.
CSysun
Content that is not attached to the structure tree will not be read by assistive technology like screen readers.
CSysun
Content that is not attached to the structure tree will not be read by assistive technology like screen readers.
CSysun
Content that is not attached to the structure tree will not be read by assistive technology like screen readers.
CSysun
Content that is not attached to the structure tree will not be read by assistive technology like screen readers.
CSysun
Content that is not attached to the structure tree will not be read by assistive technology like screen readers.
CSysun
When non-text elements do not have text equivalents, their content is lost to screen readers and environments with limited graphics capabilities.
27
cement
cement
cement
cement
HF
zon
e
Generic Well Diagram
Vert
ical
Sep
arat
ion
Lowermost Drinking Water 0 50 100 150 200
-1,000 - 0
0 - 1,000
1,000 - 2,000
2,000 - 3,000
3,000 - 4,000
4,000 - 5,000
5,000 - 6,000
6,000 - 7,000
Counts of Wells
Dep
th (f
t)
Bar Graph: Counts of Wells by Depth Differential Between Uppermost Hydraulically Fractured Zone
and Lowermost Drinking Water
Vertical Separation
Less
More
Well File Review
CSysun
+ None of the images on this page that need alternate text have it.
CSysun
Content that is not attached to the structure tree will not be read by assistive technology like screen readers.
CSysun
Content that is not attached to the structure tree will not be read by assistive technology like screen readers.
CSysun
Content that is not attached to the structure tree will not be read by assistive technology like screen readers.
CSysun
Content that is not attached to the structure tree will not be read by assistive technology like screen readers.
CSysun
Content that is not attached to the structure tree will not be read by assistive technology like screen readers.
CSysun
Content that is not attached to the structure tree will not be read by assistive technology like screen readers.
CSysun
Content that is not attached to the structure tree will not be read by assistive technology like screen readers.
CSysun
Content that is not attached to the structure tree will not be read by assistive technology like screen readers.
CSysun
Content that is not attached to the structure tree will not be read by assistive technology like screen readers.
CSysun
When non-text elements do not have text equivalents, their content is lost to screen readers and environments with limited graphics capabilities.
28
cement
cement
cement
cement
HF
zon
e
Un-
Cem
ente
d In
terv
al
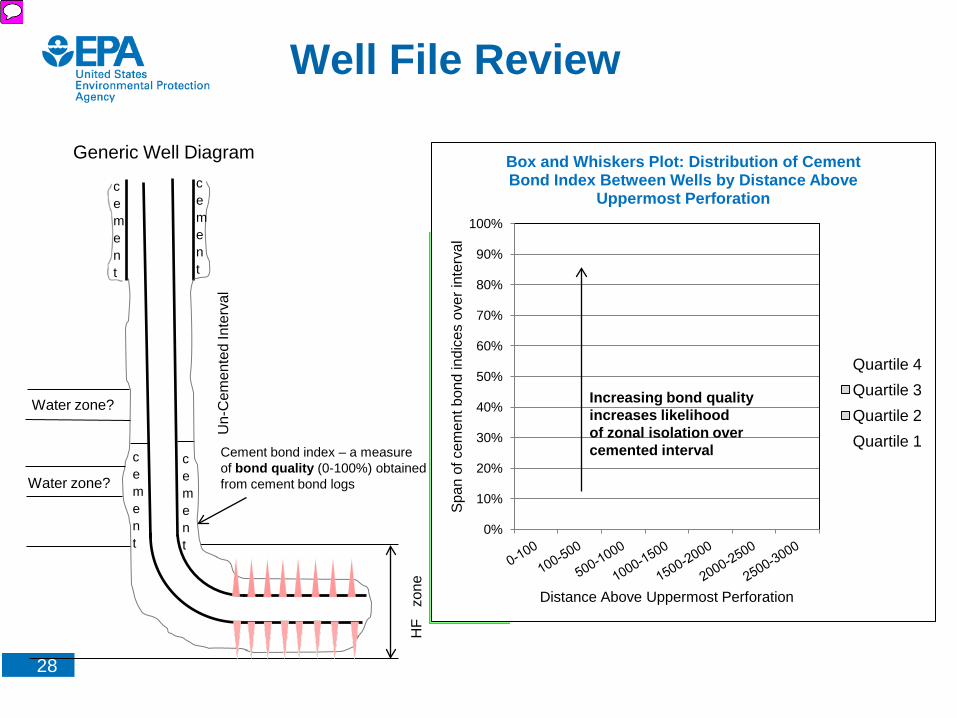
Generic Well Diagram
Cement bond index – a measure of bond quality (0-100%) obtained from cement bond logs
0%
10%
20%
30%
40%
50%
60%
70%
80%
90%
100%
Span
of c
emen
t bon
d in
dice
s ov
er in
terv
al
Distance Above Uppermost Perforation
Box and Whiskers Plot: Distribution of Cement Bond Index Between Wells by Distance Above
Uppermost Perforation
Quartile 4 Quartile 3 Quartile 2 Quartile 1
Increasing bond quality increases likelihood of zonal isolation over cemented interval
Water zone?
Water zone?
Well File Review
CSysun
+ None of the images on this page that need alternate text have it.
CSysun
Content that is not attached to the structure tree will not be read by assistive technology like screen readers.
CSysun
When non-text elements do not have text equivalents, their content is lost to screen readers and environments with limited graphics capabilities.
29
0 0.1 0.2 0.3 0.4 0.5 0.6 0.7 0.8 0.9
1
Num
ber o
f Wel
ls
Distance Between Wellbore and Offset Fault (ft)
Bar Graph: Count of Wells by Distance Between Wellbore and Offset Fault
Content that is not attached to the structure tree will not be read by assistive technology like screen readers.
CSysun
When non-text elements do not have text equivalents, their content is lost to screen readers and environments with limited graphics capabilities.
30
NEXT STEPS • Continue evaluating data
• Review well files • Create summaries of data • Discuss data with well file owners • Ensure CBI claims are protected • Assess the data to answer research questions
• Prepare research findings • Peer review findings and issue paper/report
Well File Review
31
Questions for Discussion
• Are there additional datasets available to help evaluate the parameterization and performance of the simulations?
• Are there opportunities to compare the simulations to other modeling systems, public or proprietary?