64
Welcome to the 7 th Annual Real Estate Symposium for The Lake of the Ozarks September 25 th, 2014 Osage National Golf Resort

Welcome to the 7th Annual Real Estate Symposium
for The Lake of the Ozarks
September 25th, 2014
Osage National Golf Resort

Missouri State Representative District 124
Rocky Miller
National Housing Market

National Housing Market
Current Housing Trends:
A Steady Recovery
September 25, 2014
Shaun White Vice President - RE/MAX, LLC
Denver, Colorado
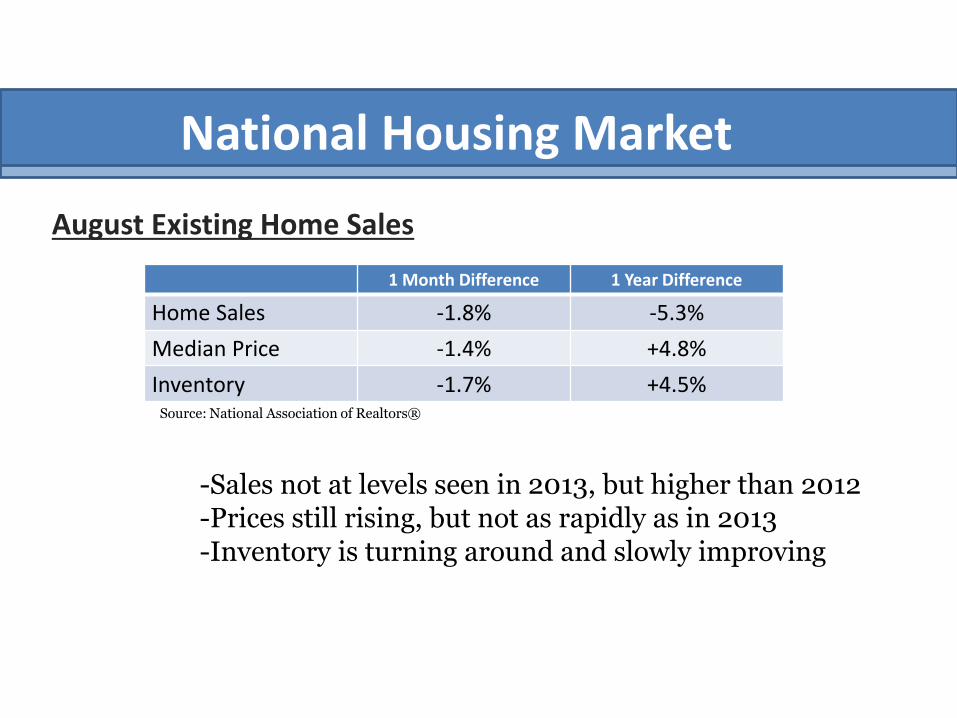
National Housing Market
August Existing Home Sales
1 Month Difference 1 Year Difference
Home Sales -1.8% -5.3%
Median Price -1.4% +4.8%
Inventory -1.7% +4.5% Source: National Association of Realtors®
-Sales not at levels seen in 2013, but higher than 2012 -Prices still rising, but not as rapidly as in 2013 -Inventory is turning around and slowly improving
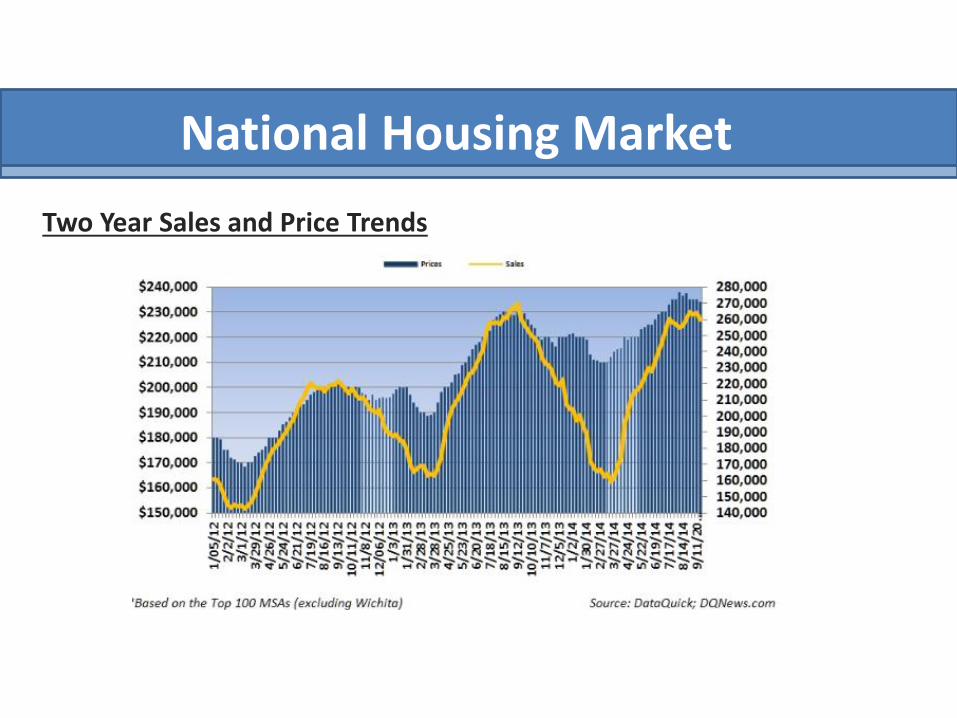
National Housing Market
Two Year Sales and Price Trends
National Housing Market
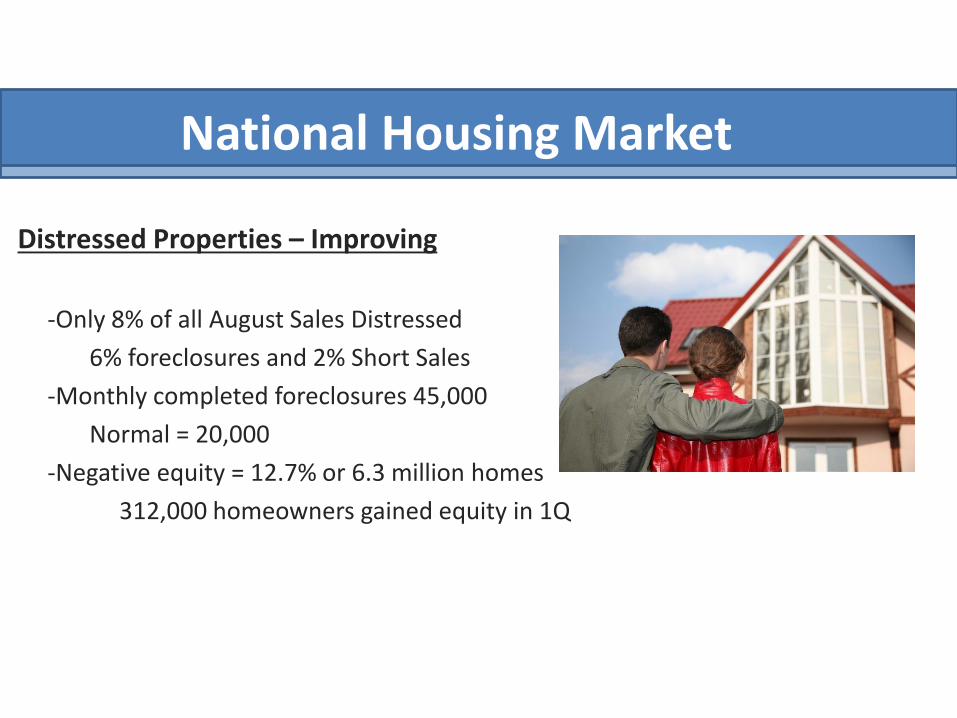
Distressed Properties – Improving
-Only 8% of all August Sales Distressed
6% foreclosures and 2% Short Sales
-Monthly completed foreclosures 45,000
Normal = 20,000
-Negative equity = 12.7% or 6.3 million homes
312,000 homeowners gained equity in 1Q
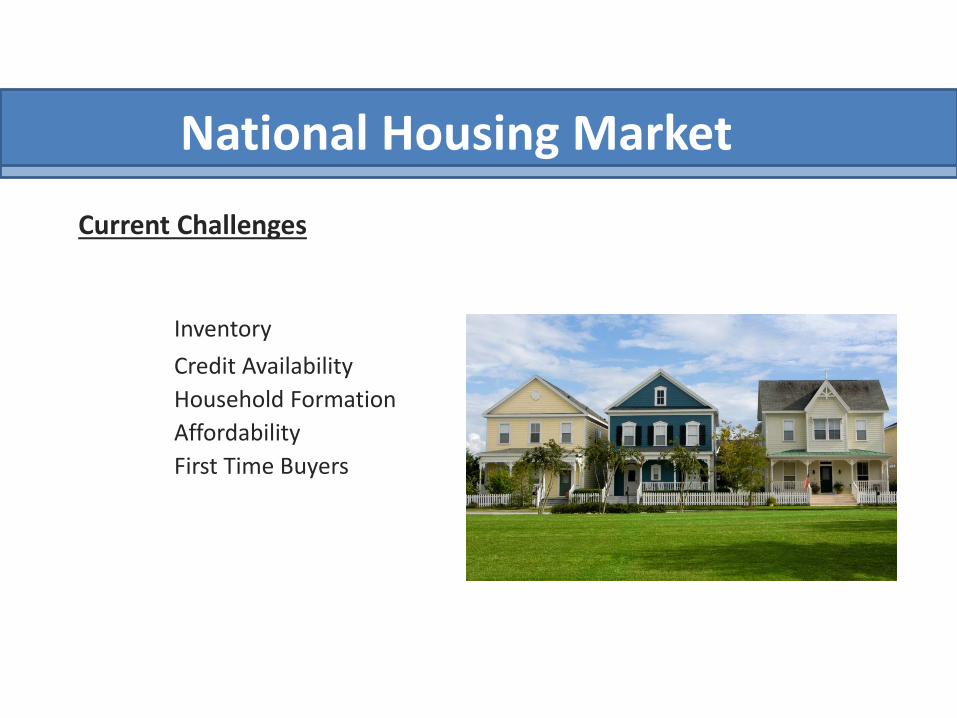
National Housing Market
Current Challenges
Inventory
Credit Availability
Household Formation
Affordability
First Time Buyers
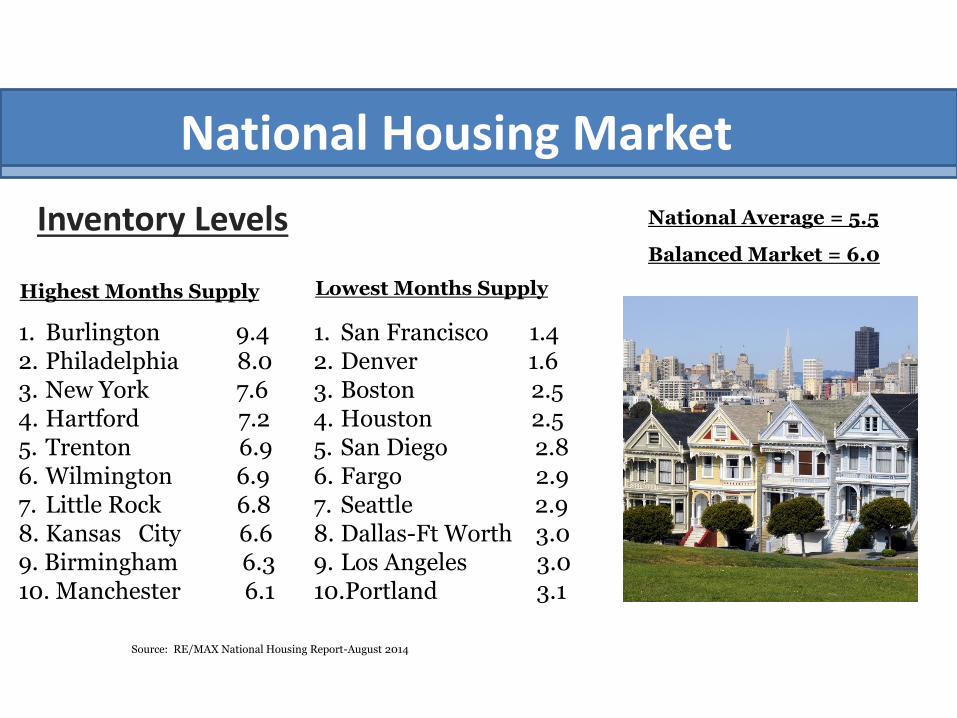
National Housing Market
Inventory Levels
1. San Francisco 1.4 2. Denver 1.6 3. Boston 2.5 4. Houston 2.5 5. San Diego 2.8 6. Fargo 2.9 7. Seattle 2.9 8. Dallas-Ft Worth 3.0 9. Los Angeles 3.0 10.Portland 3.1
Lowest Months Supply Highest Months Supply
1. Burlington 9.4 2. Philadelphia 8.0 3. New York 7.6 4. Hartford 7.2 5. Trenton 6.9 6. Wilmington 6.9 7. Little Rock 6.8 8. Kansas City 6.6 9. Birmingham 6.3 10. Manchester 6.1
Source: RE/MAX National Housing Report-August 2014
National Average = 5.5
Balanced Market = 6.0
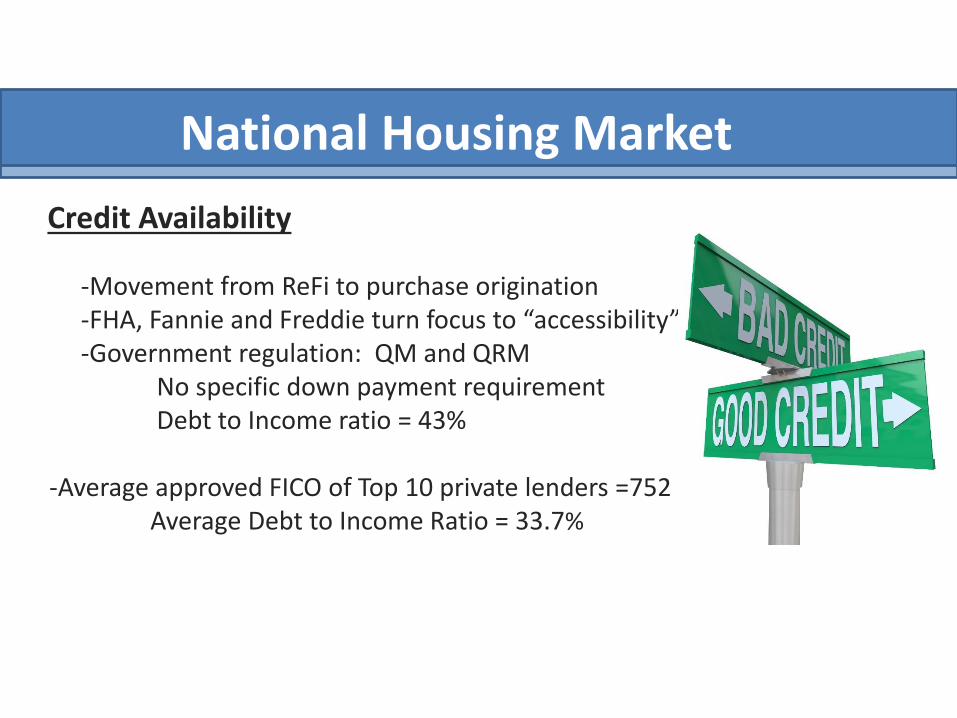
National Housing Market
Credit Availability -Movement from ReFi to purchase origination -FHA, Fannie and Freddie turn focus to “accessibility” -Government regulation: QM and QRM No specific down payment requirement Debt to Income ratio = 43% -Average approved FICO of Top 10 private lenders =752 Average Debt to Income Ratio = 33.7%
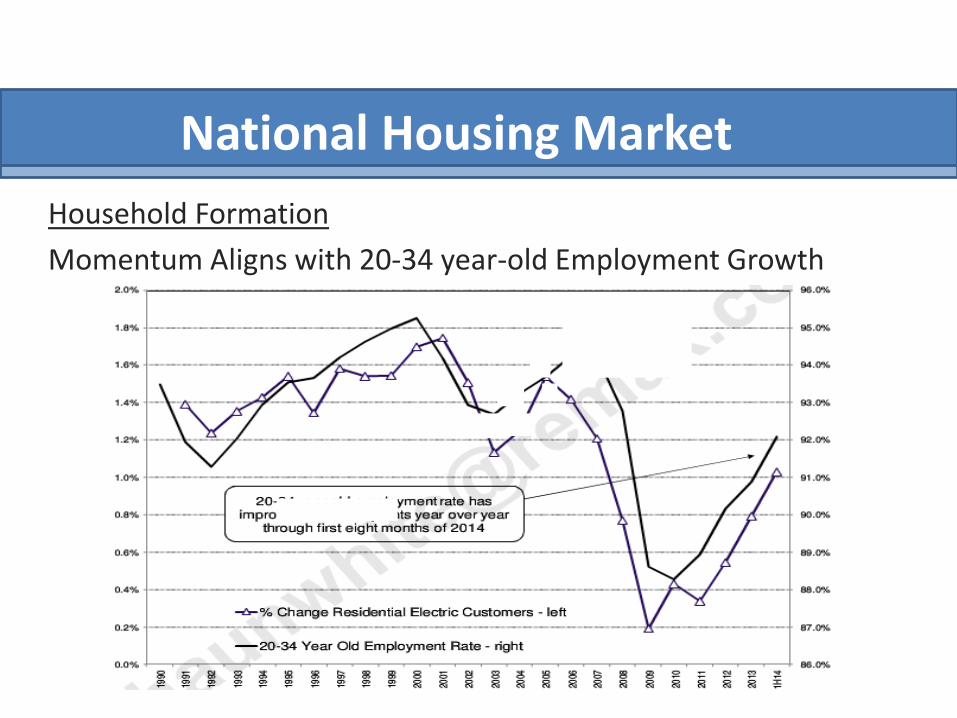
National Housing Market
Household Formation
Momentum Aligns with 20-34 year-old Employment Growth
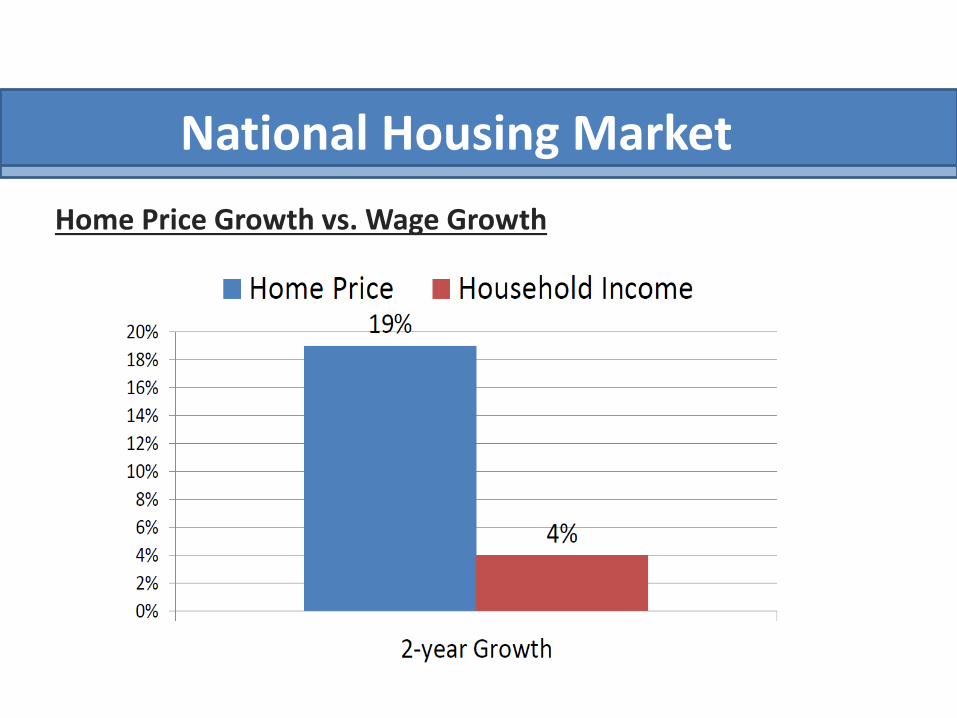
National Housing Market
Home Price Growth vs. Wage Growth
National Housing Market
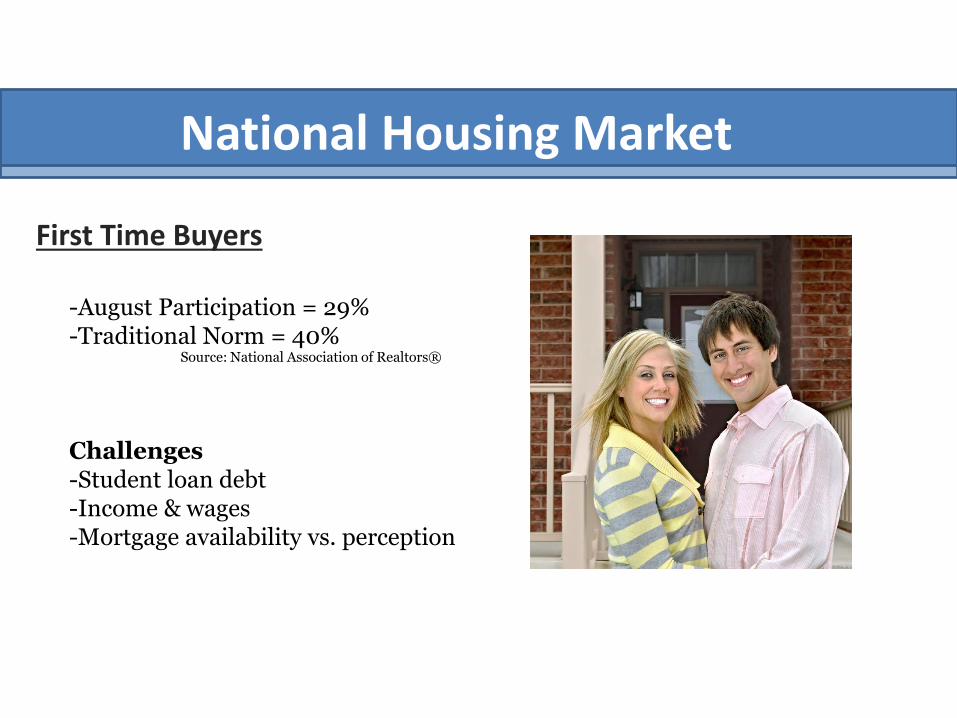
First Time Buyers
-August Participation = 29% -Traditional Norm = 40% Challenges -Student loan debt -Income & wages -Mortgage availability vs. perception
Source: National Association of Realtors®
National Housing Market
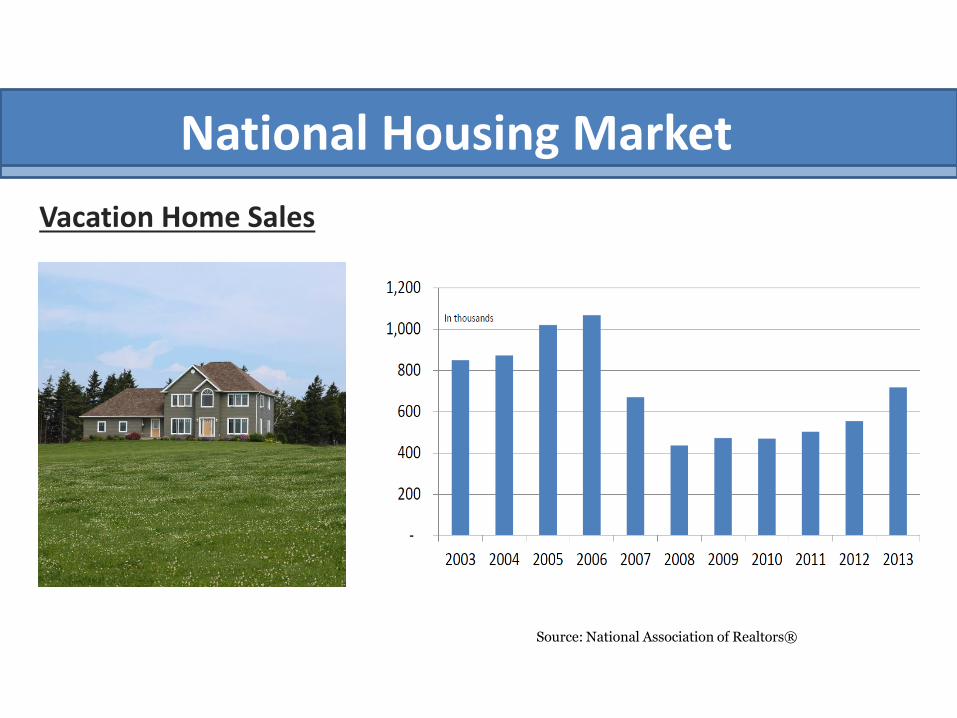
Vacation Home Sales
Source: National Association of Realtors®
National Housing Market
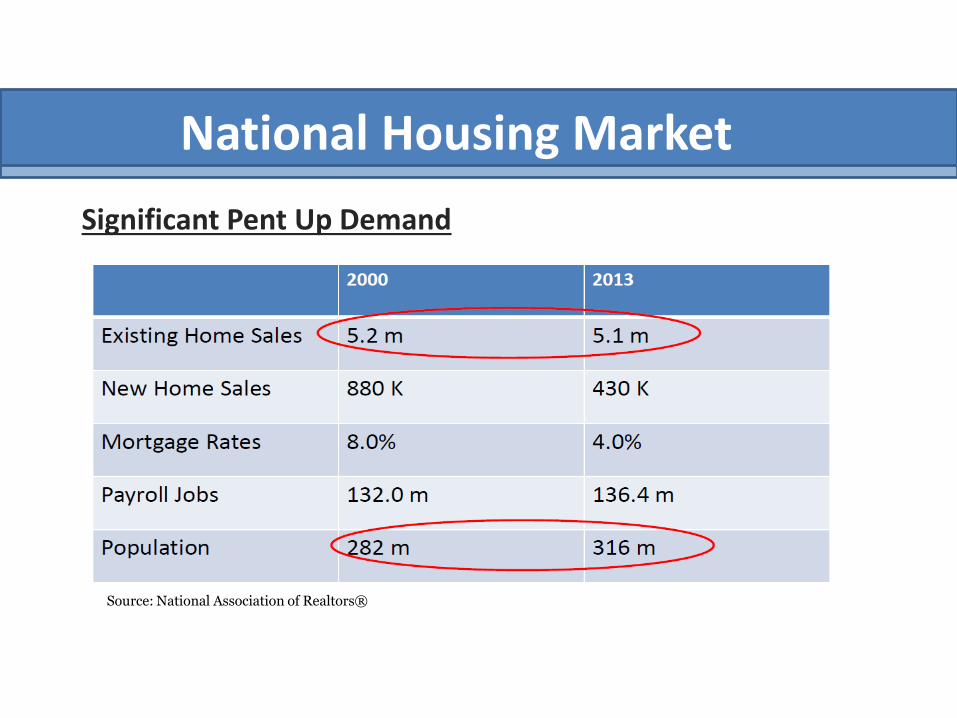
Significant Pent Up Demand
Source: National Association of Realtors®
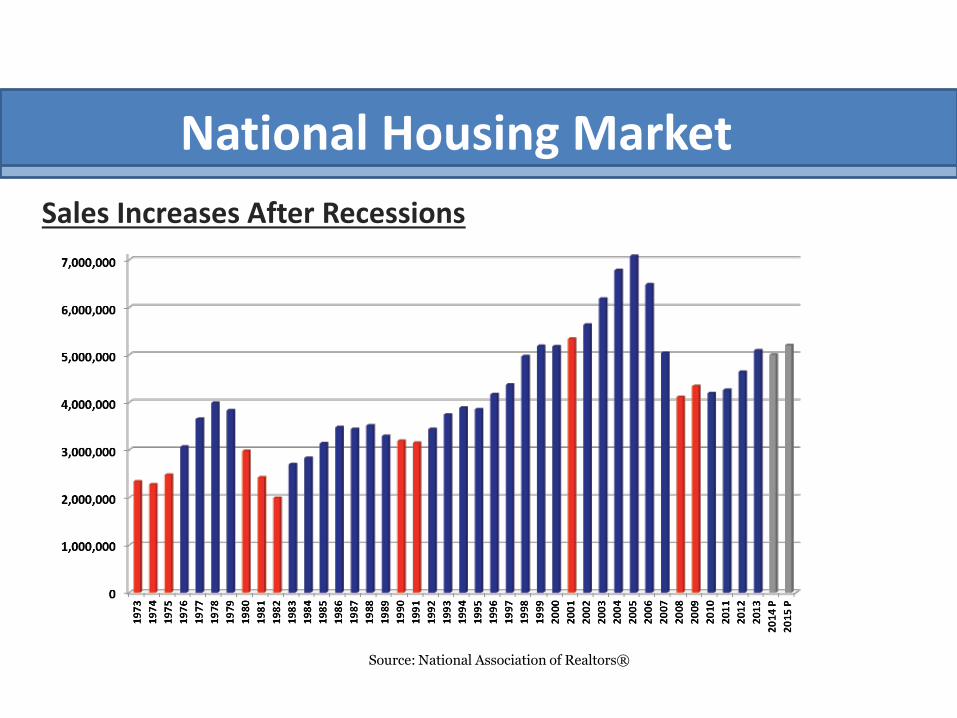
National Housing Market
Sales Increases After Recessions
Source: National Association of Realtors®
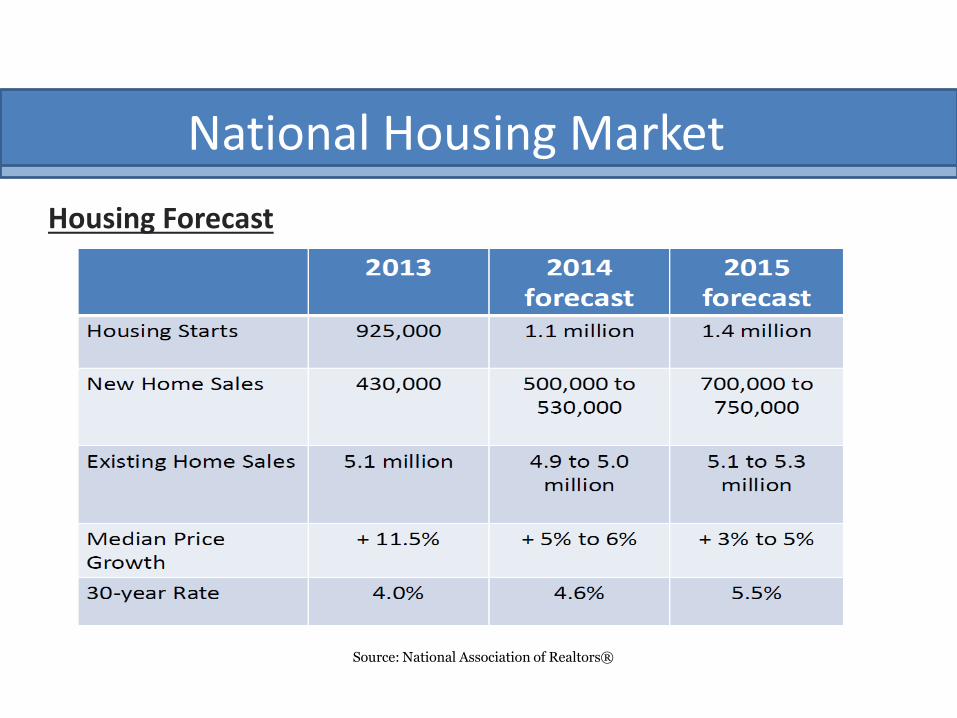
National Housing Market
Housing Forecast
Source: National Association of Realtors®

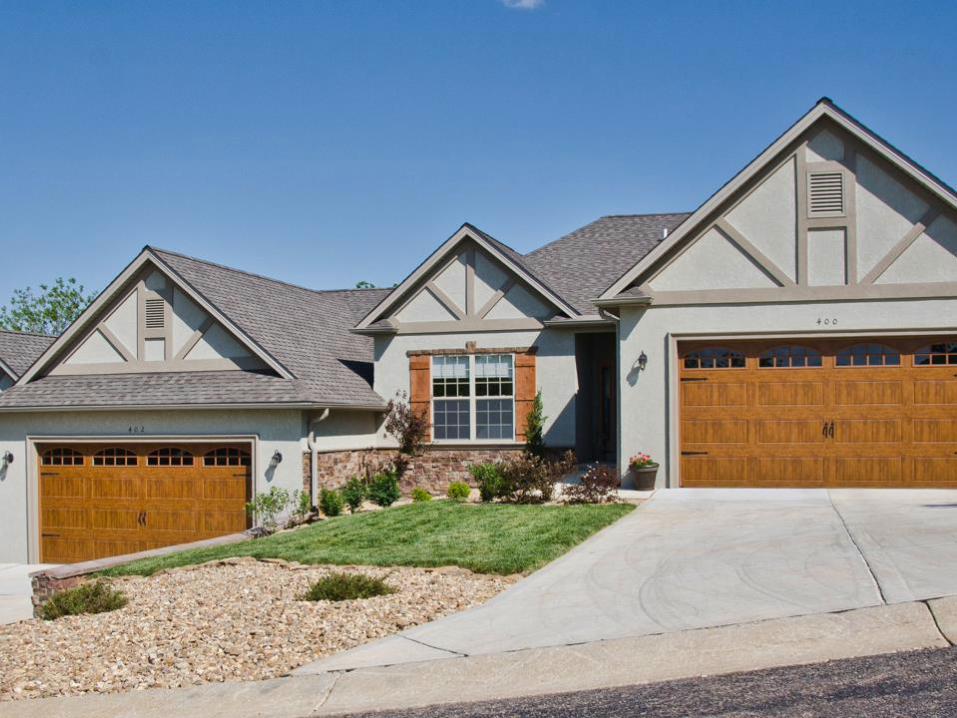
Jeff Krantz The Lake of the Ozarks
Real Estate Market
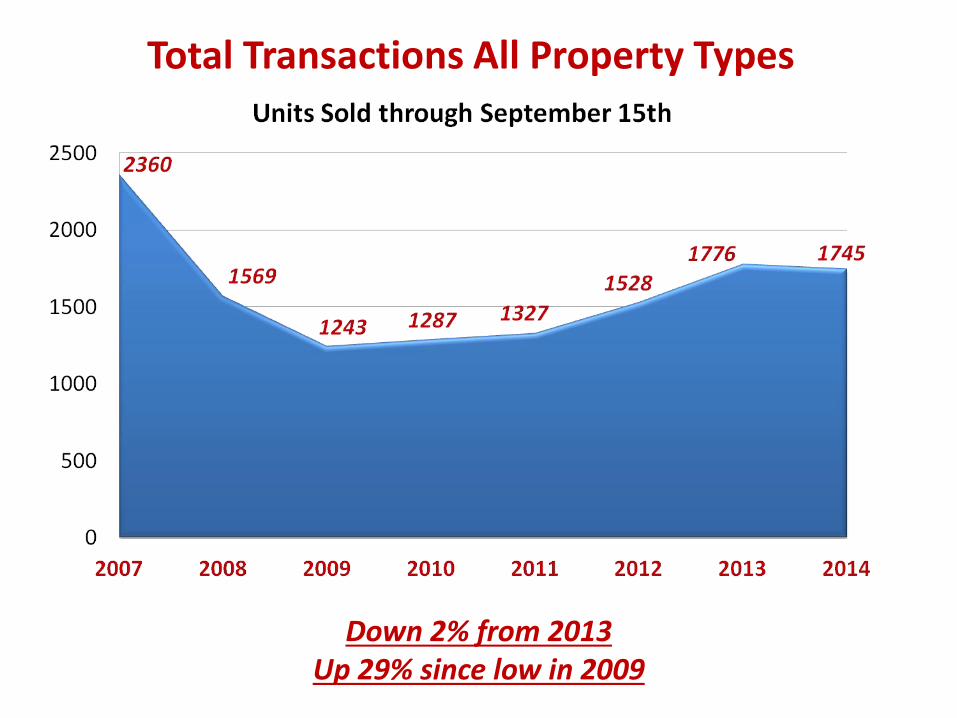
Total Transactions All Property Types
Down 2% from 2013 Up 29% since low in 2009
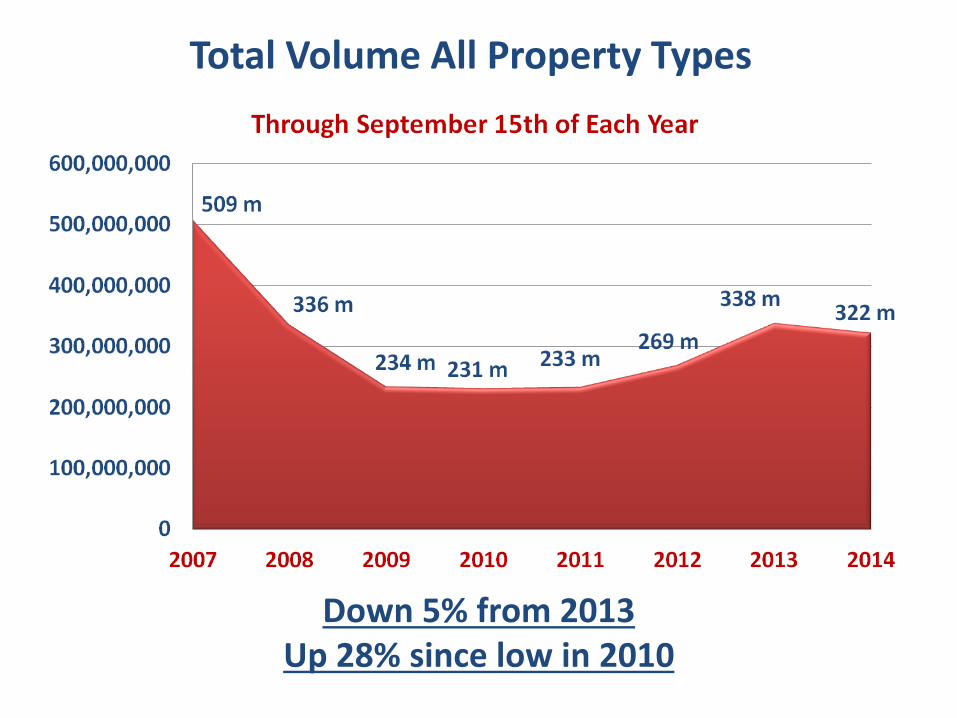
Total Volume All Property Types
Down 5% from 2013 Up 28% since low in 2010
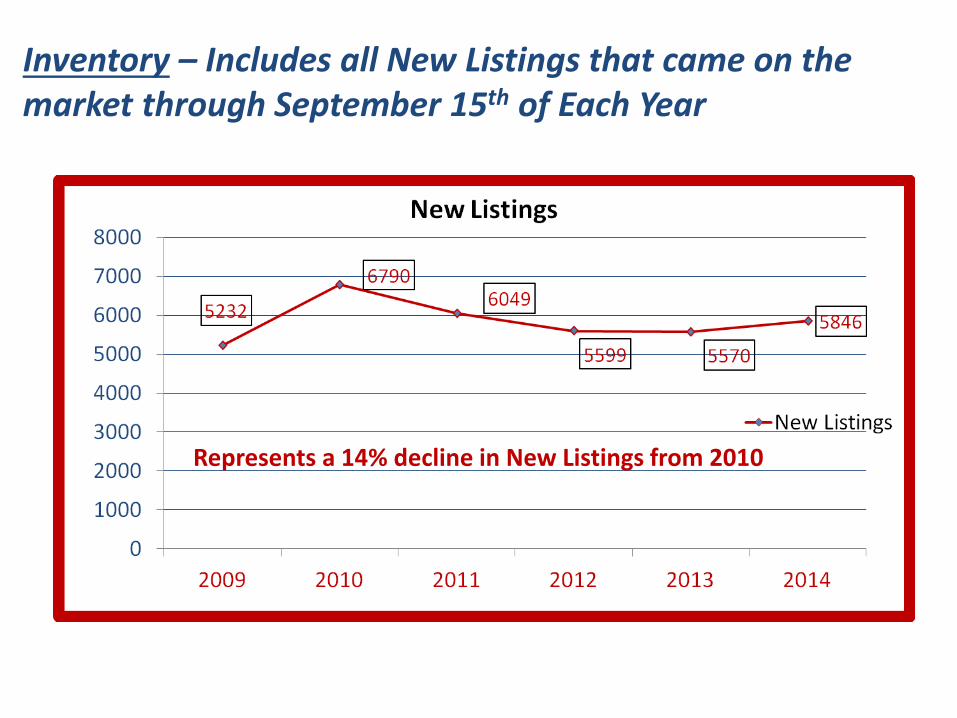
Inventory – Includes all New Listings that came on the market through September 15th of Each Year
Represents a 14% decline in New Listings from 2010
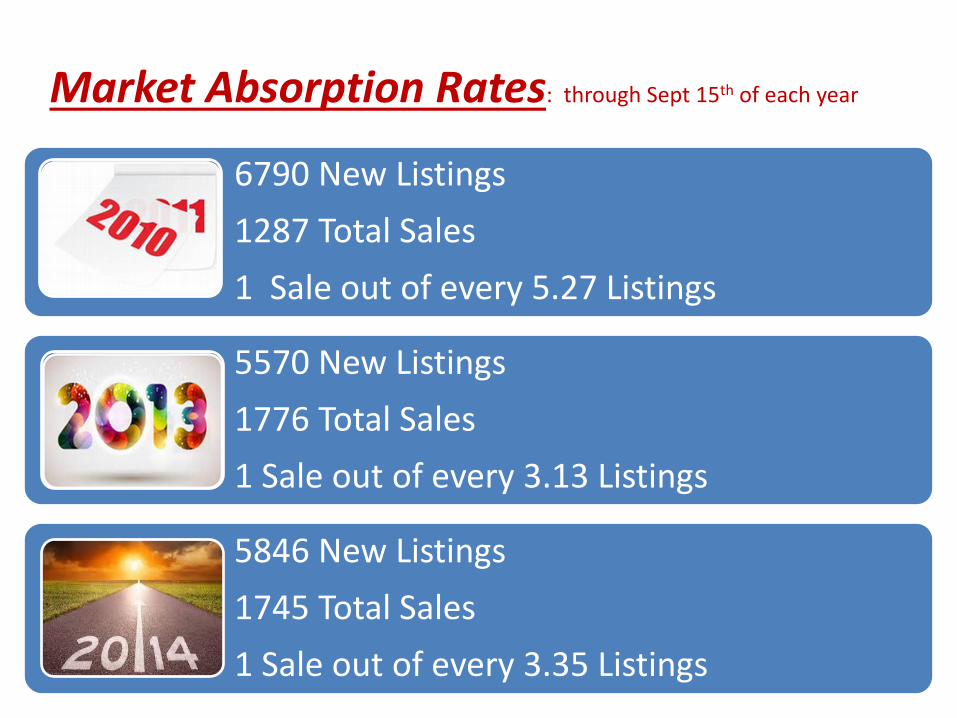
6790 New Listings
1287 Total Sales
1 Sale out of every 5.27 Listings
5570 New Listings
1776 Total Sales
1 Sale out of every 3.13 Listings
5846 New Listings
1745 Total Sales
1 Sale out of every 3.35 Listings
Market Absorption Rates: through Sept 15th of each year
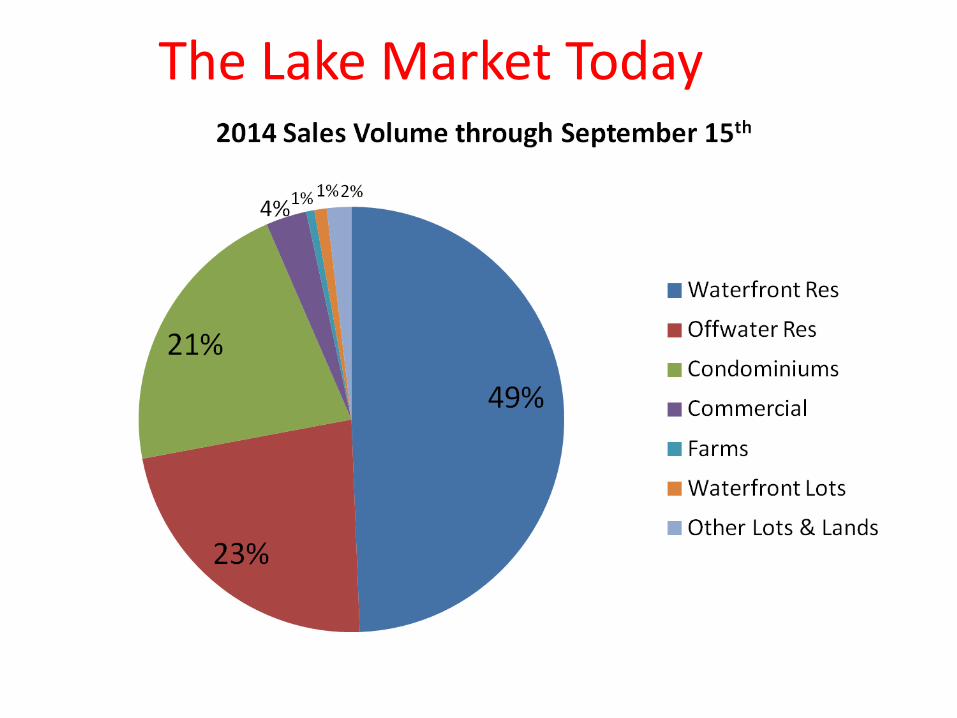
The Lake Market Today
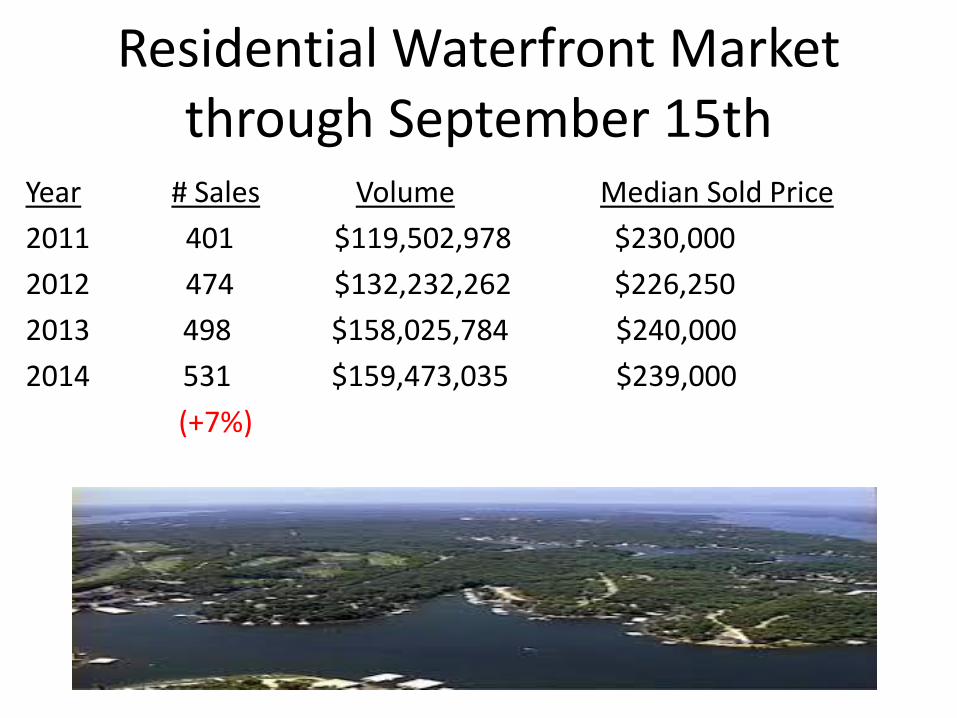
Residential Waterfront Market through September 15th
Year # Sales Volume Median Sold Price
2011 401 $119,502,978 $230,000
2012 474 $132,232,262 $226,250
2013 498 $158,025,784 $240,000
2014 531 $159,473,035 $239,000
(+7%)
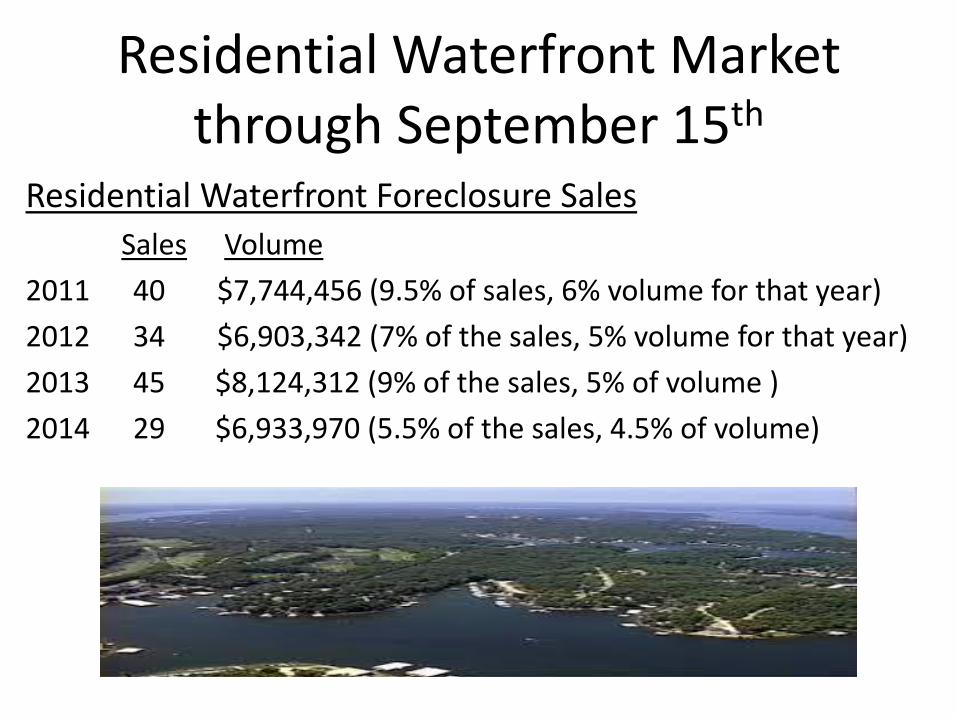
Residential Waterfront Market through September 15th
Residential Waterfront Foreclosure Sales
Sales Volume
2011 40 $7,744,456 (9.5% of sales, 6% volume for that year)
2012 34 $6,903,342 (7% of the sales, 5% volume for that year)
2013 45 $8,124,312 (9% of the sales, 5% of volume )
2014 29 $6,933,970 (5.5% of the sales, 4.5% of volume)
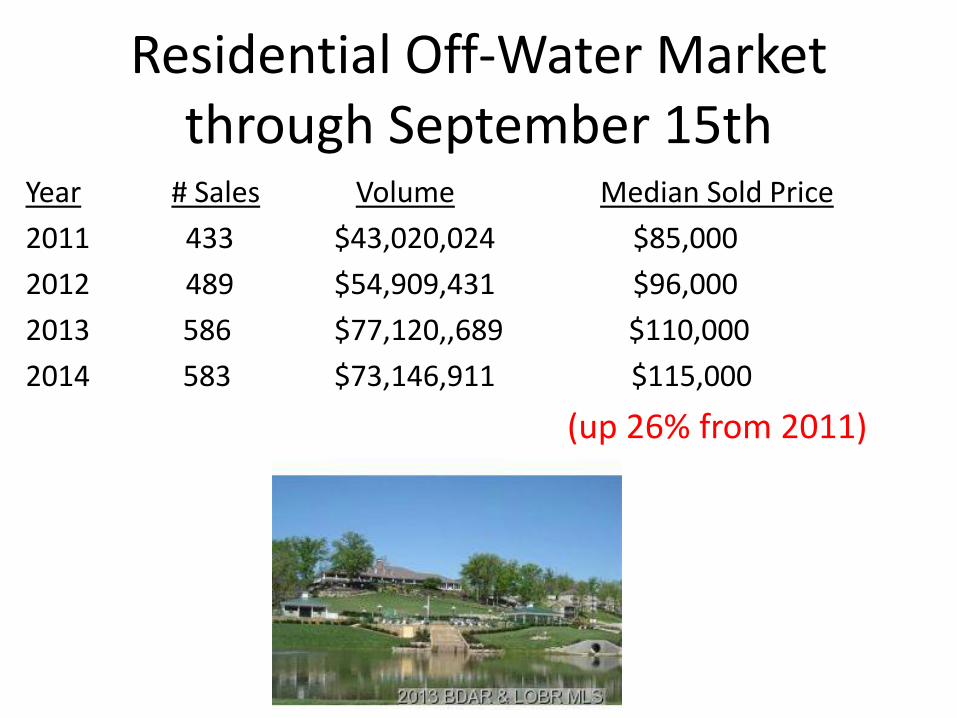
Residential Off-Water Market through September 15th
Year # Sales Volume Median Sold Price
2011 433 $43,020,024 $85,000
2012 489 $54,909,431 $96,000
2013 586 $77,120,,689 $110,000
2014 583 $73,146,911 $115,000
(up 26% from 2011)
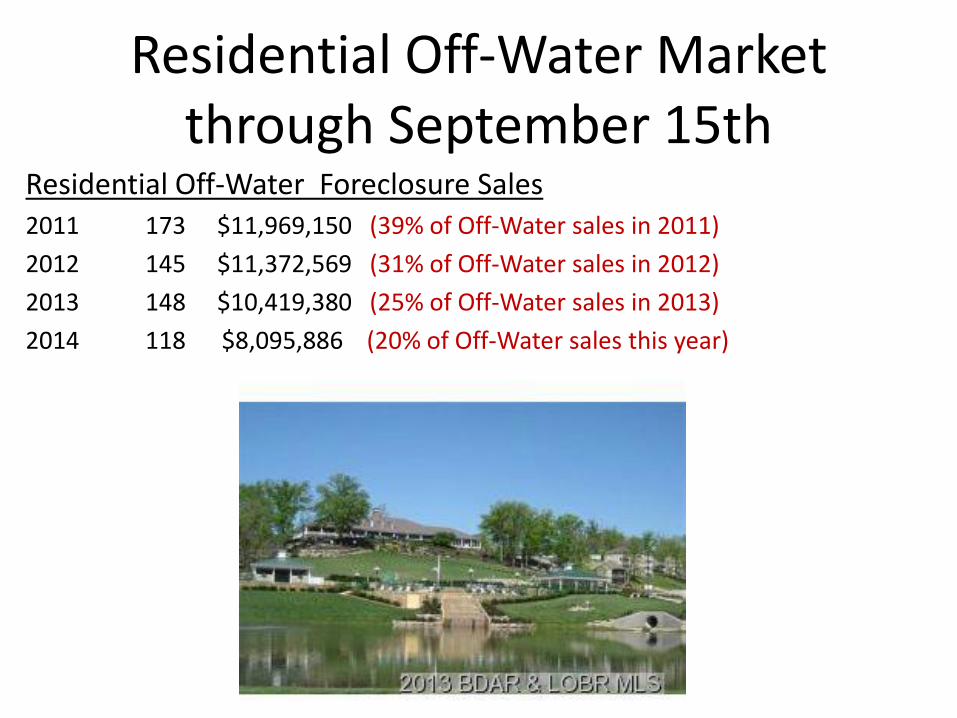
Residential Off-Water Market through September 15th
Residential Off-Water Foreclosure Sales 2011 173 $11,969,150 (39% of Off-Water sales in 2011)
2012 145 $11,372,569 (31% of Off-Water sales in 2012)
2013 148 $10,419,380 (25% of Off-Water sales in 2013)
2014 118 $8,095,886 (20% of Off-Water sales this year)
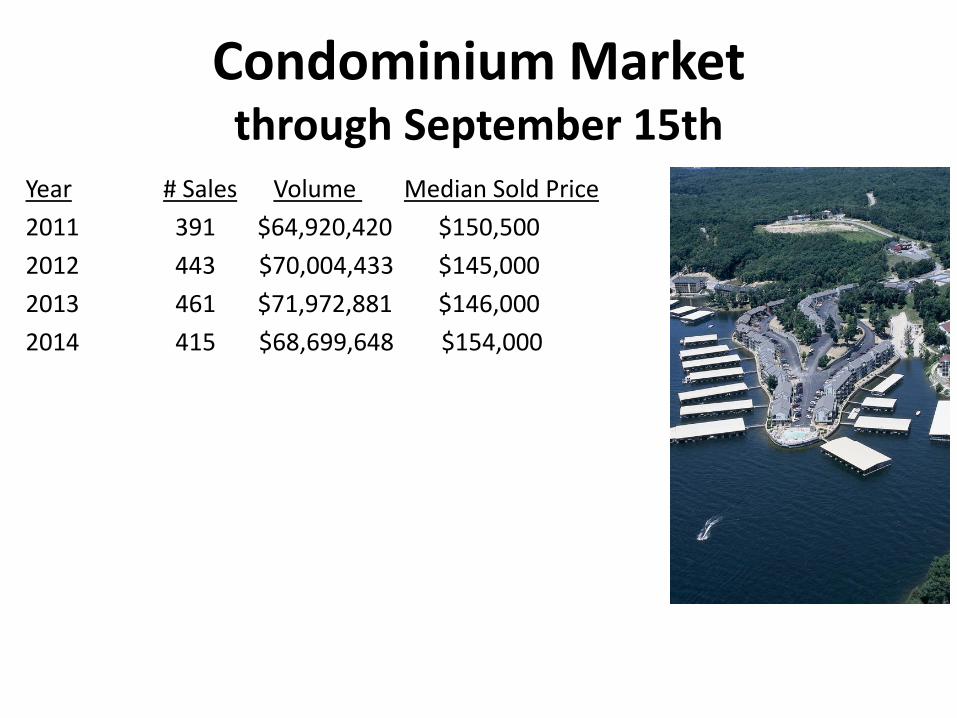
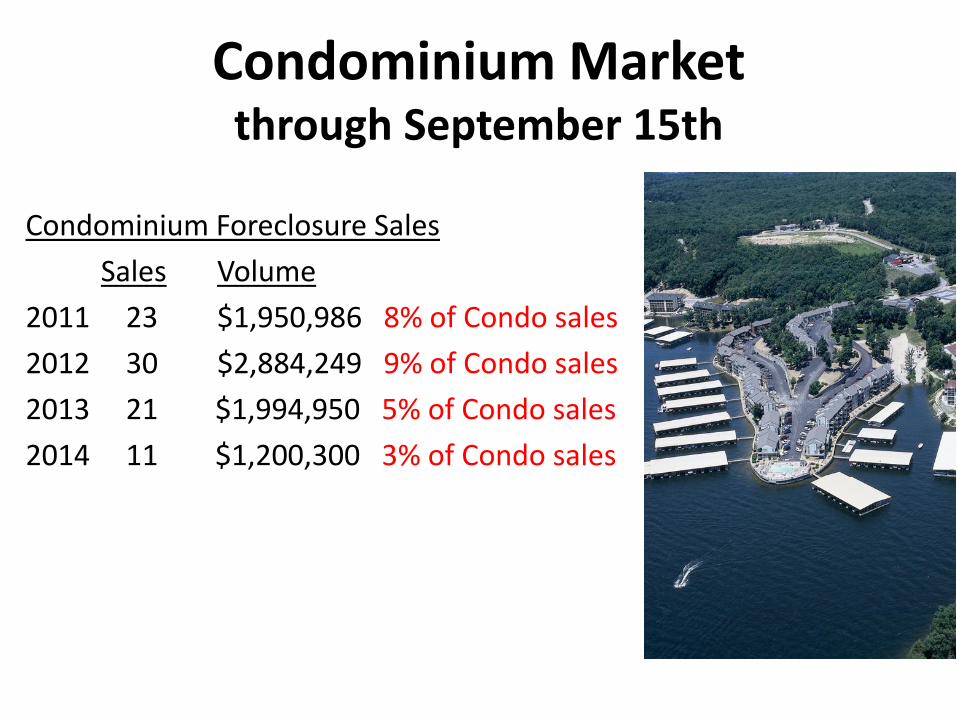
Condominium Market through September 15th
Year # Sales Volume Median Sold Price
2011 391 $64,920,420 $150,500
2012 443 $70,004,433 $145,000
2013 461 $71,972,881 $146,000
2014 415 $68,699,648 $154,000
Condominium Market through September 15th
Condominium Foreclosure Sales
Sales Volume
2011 23 $1,950,986 8% of Condo sales
2012 30 $2,884,249 9% of Condo sales
2013 21 $1,994,950 5% of Condo sales
2014 11 $1,200,300 3% of Condo sales
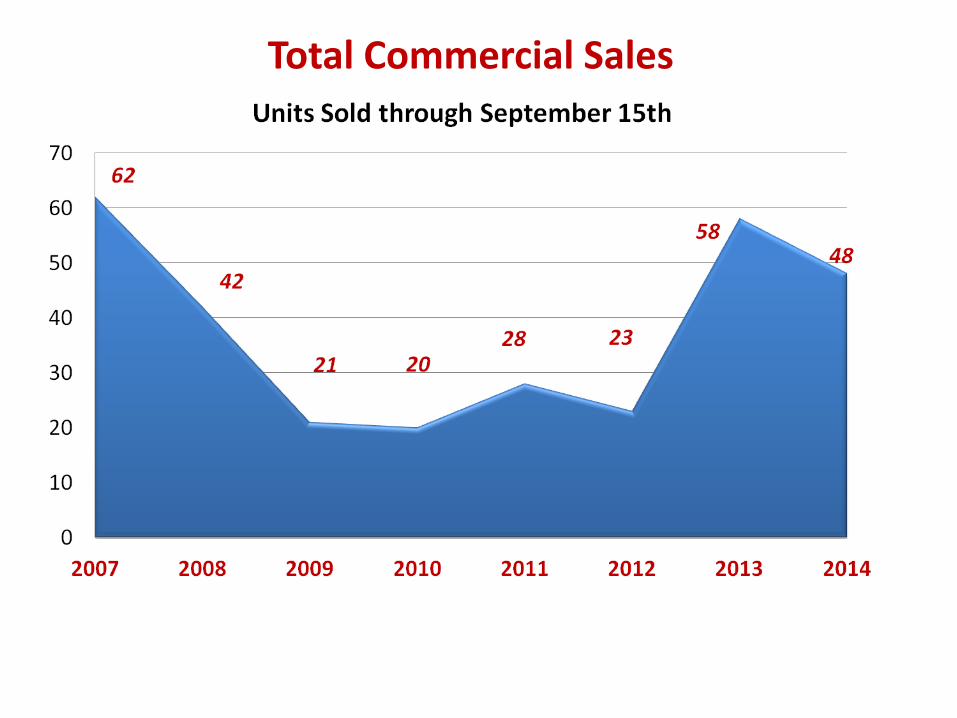
Total Commercial Sales
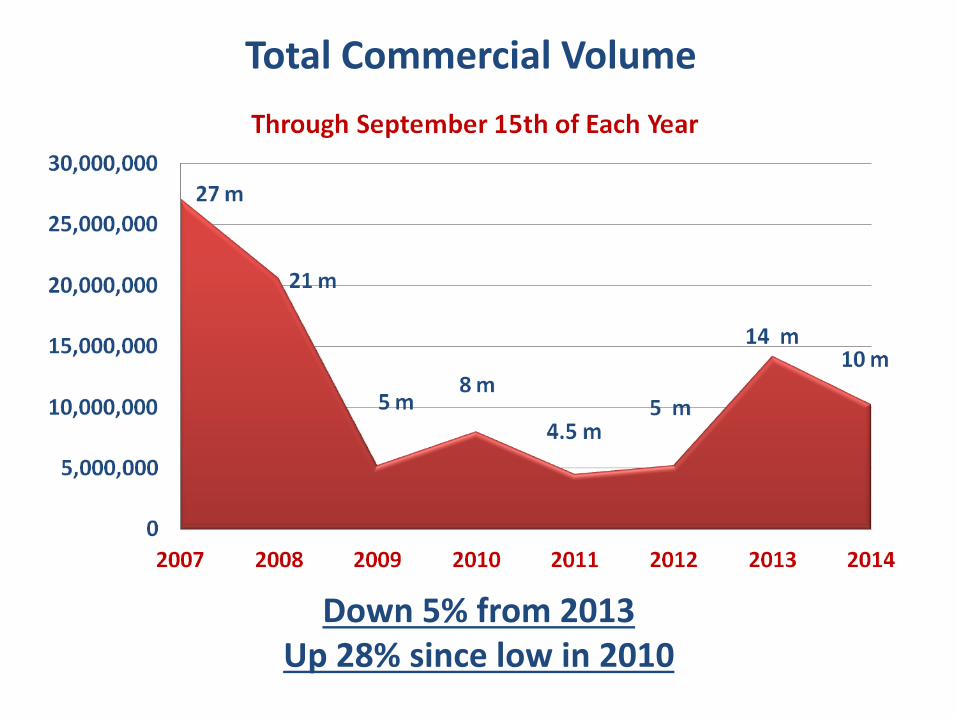
Total Commercial Volume
Down 5% from 2013 Up 28% since low in 2010
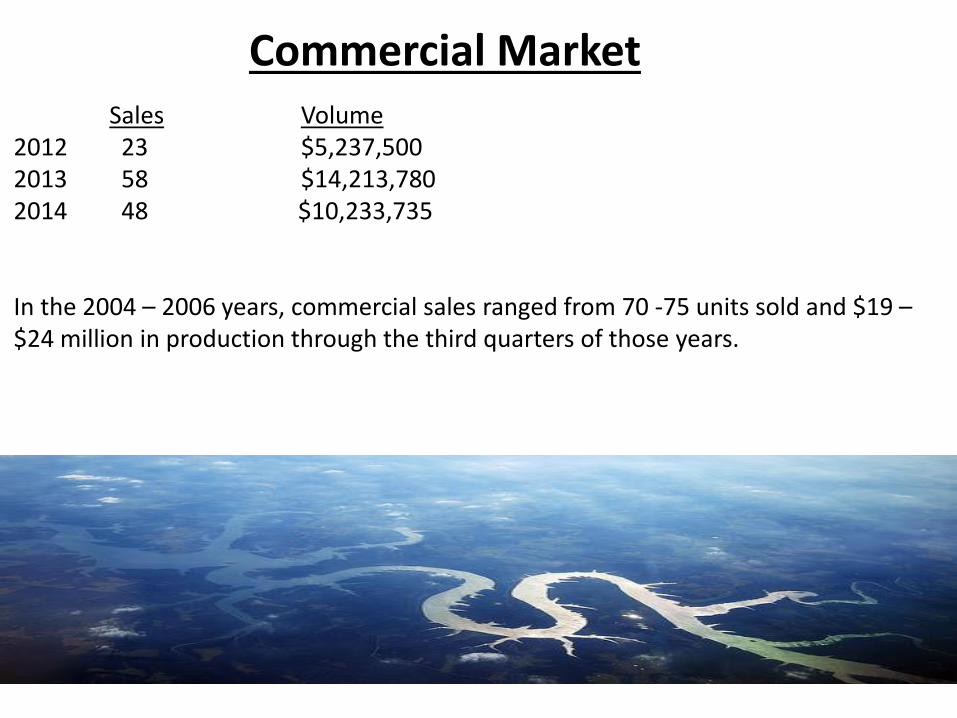
Commercial Market Sales Volume 2012 23 $5,237,500 2013 58 $14,213,780 2014 48 $10,233,735 In the 2004 – 2006 years, commercial sales ranged from 70 -75 units sold and $19 – $24 million in production through the third quarters of those years.

Questions?

Developer Panel:
Jeff Carroll Director of Business Development
Old Kinderhook
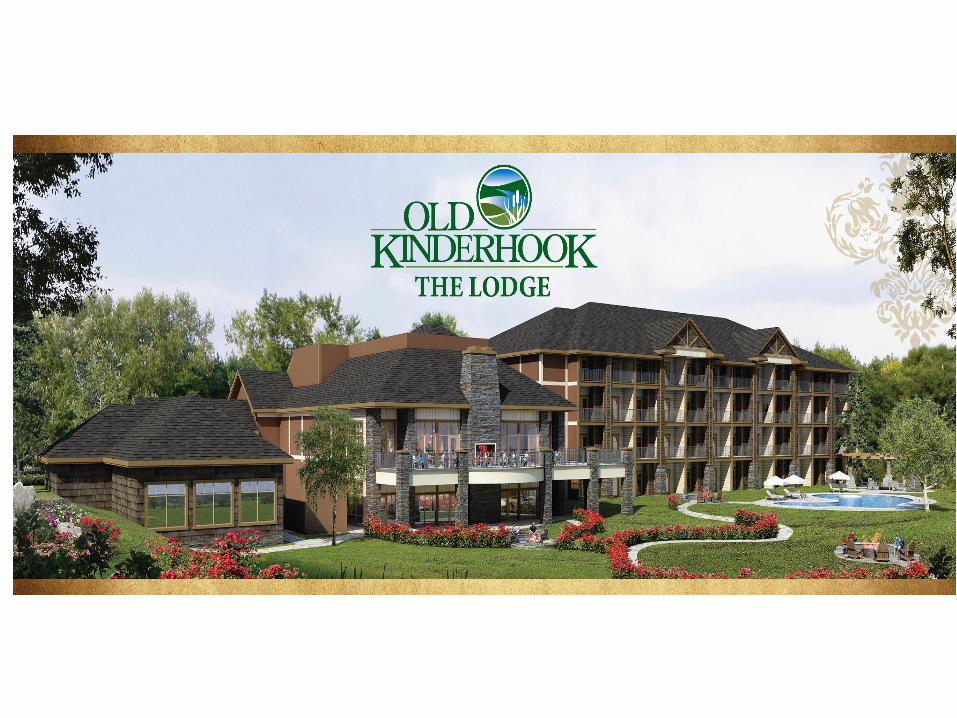


Jeff Carroll Director of Business Development
Old Kinderhook
Presented by:
Jeff Hobbs, CEO
Aided by:
Brian Mitrzyk, Sr. Project Engineer
and
Meredith McNair, C.S. Specialist
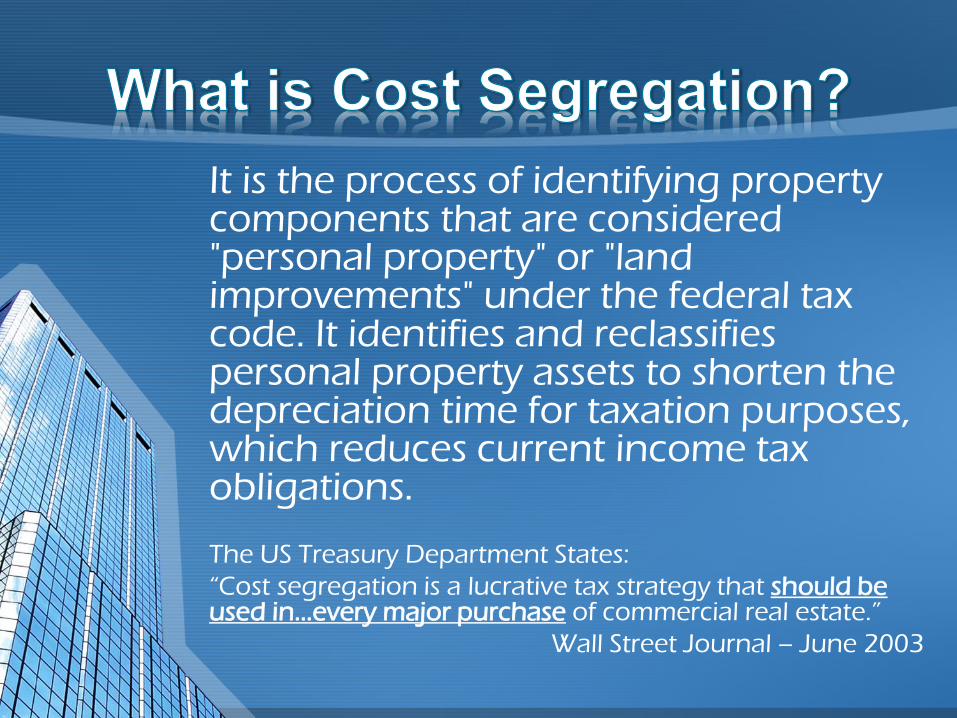
It is the process of identifying property components that are considered "personal property" or "land improvements" under the federal tax code. It identifies and reclassifies personal property assets to shorten the depreciation time for taxation purposes, which reduces current income tax obligations. The US Treasury Department States:
“Cost segregation is a lucrative tax strategy that should be used in…every major purchase of commercial real estate.”
Wall Street Journal – June 2003
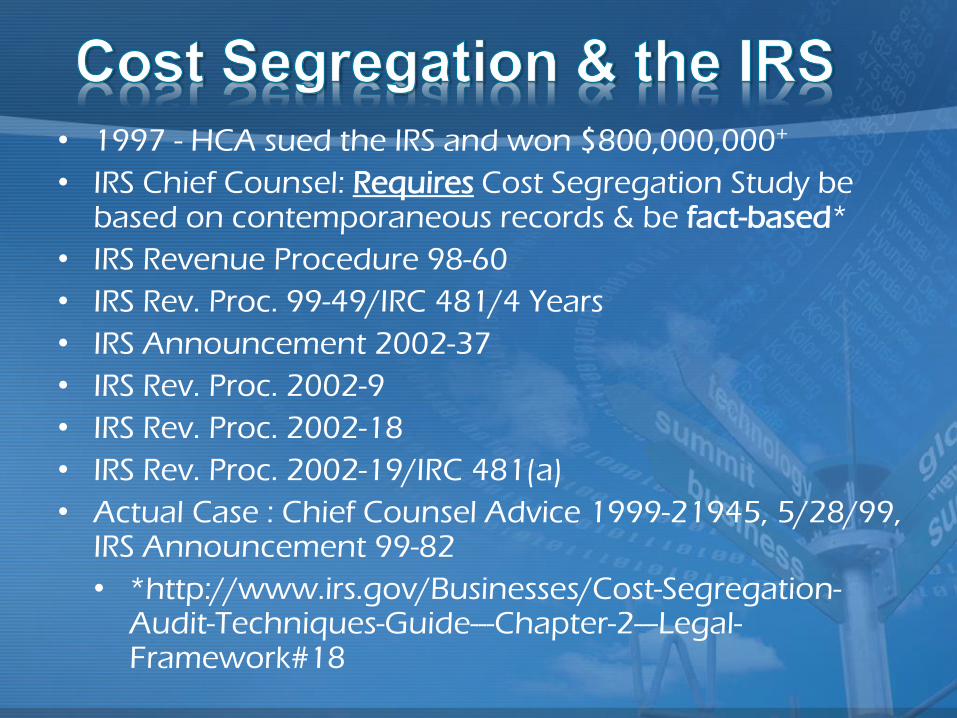
• 1997 - HCA sued the IRS and won $800,000,000+
• IRS Chief Counsel: Requires Cost Segregation Study be based on contemporaneous records & be fact-based*
• IRS Revenue Procedure 98-60
• IRS Rev. Proc. 99-49/IRC 481/4 Years
• IRS Announcement 2002-37
• IRS Rev. Proc. 2002-9
• IRS Rev. Proc. 2002-18
• IRS Rev. Proc. 2002-19/IRC 481(a)
• Actual Case : Chief Counsel Advice 1999-21945, 5/28/99, IRS Announcement 99-82
• *http://www.irs.gov/Businesses/Cost-Segregation-Audit-Techniques-Guide---Chapter-2---Legal-Framework#18
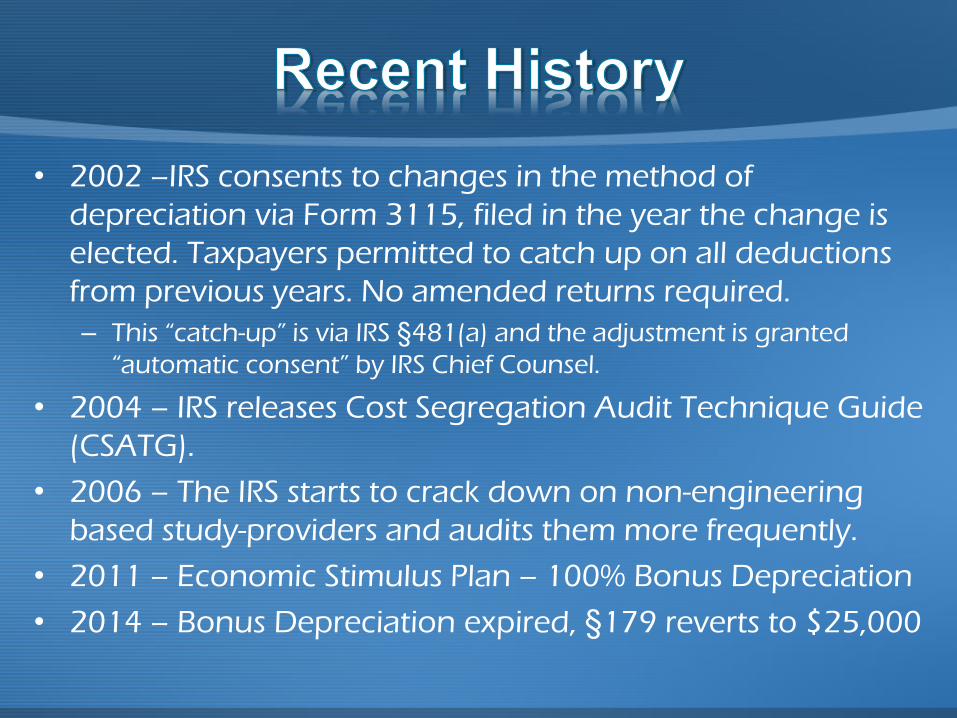
• 2002 –IRS consents to changes in the method of
depreciation via Form 3115, filed in the year the change is
elected. Taxpayers permitted to catch up on all deductions
from previous years. No amended returns required.
– This “catch-up” is via IRS §481(a) and the adjustment is granted
“automatic consent” by IRS Chief Counsel.
• 2004 – IRS releases Cost Segregation Audit Technique Guide
(CSATG).
• 2006 – The IRS starts to crack down on non-engineering
based study-providers and audits them more frequently.
• 2011 – Economic Stimulus Plan – 100% Bonus Depreciation
• 2014 – Bonus Depreciation expired, §179 reverts to $25,000
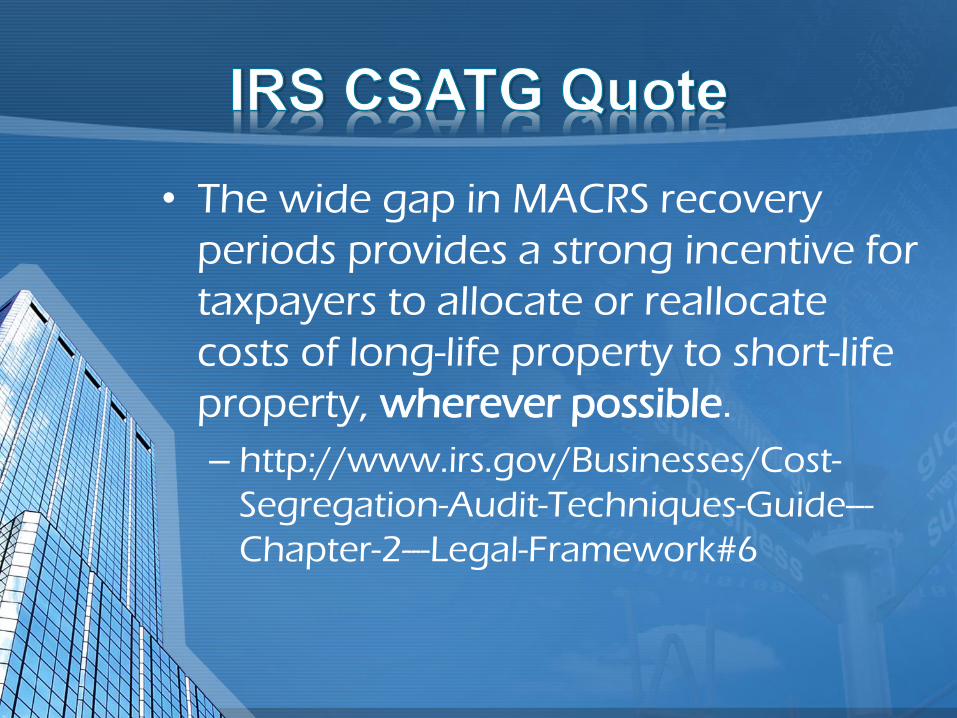
• The wide gap in MACRS recovery
periods provides a strong incentive for
taxpayers to allocate or reallocate
costs of long-life property to short-life
property, wherever possible.
– http://www.irs.gov/Businesses/Cost-
Segregation-Audit-Techniques-Guide---
Chapter-2---Legal-Framework#6
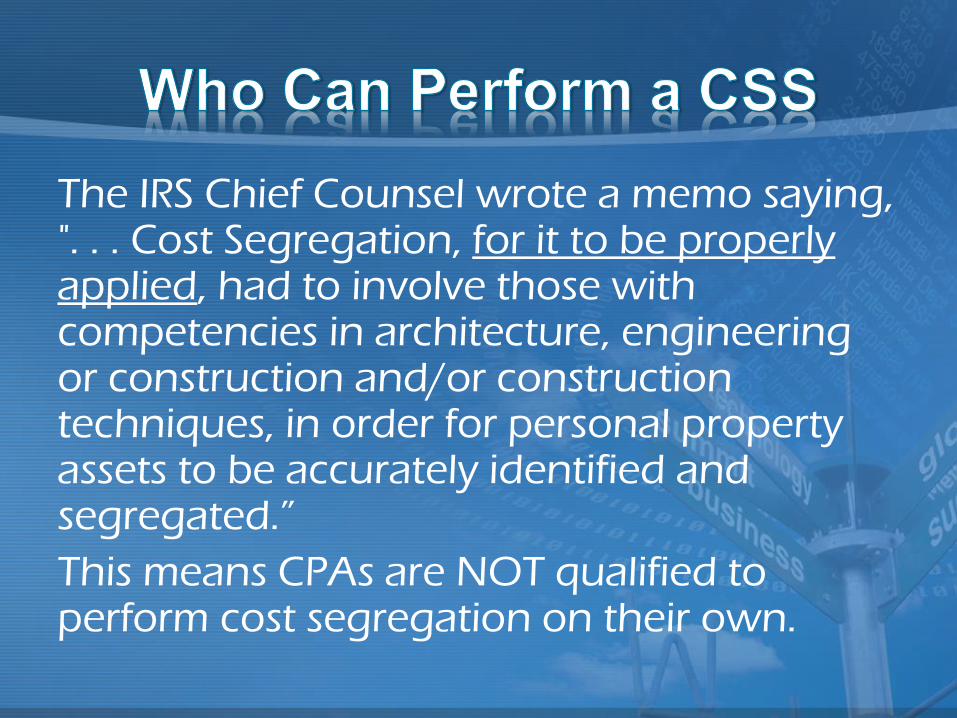
The IRS Chief Counsel wrote a memo saying, ". . . Cost Segregation, for it to be properly applied, had to involve those with competencies in architecture, engineering or construction and/or construction techniques, in order for personal property assets to be accurately identified and segregated.”
This means CPAs are NOT qualified to perform cost segregation on their own.
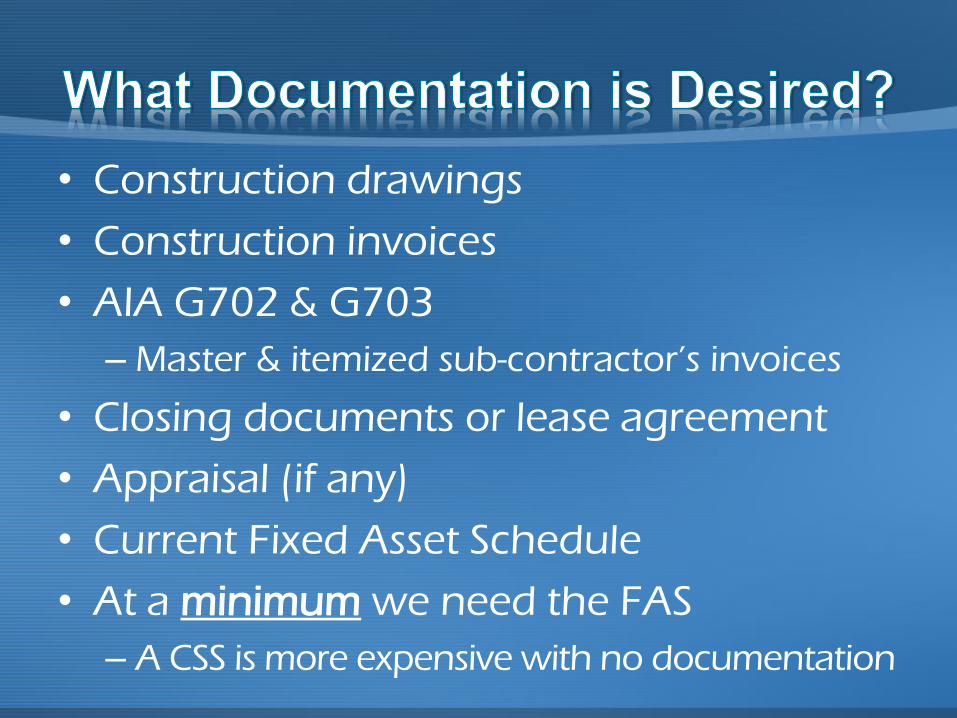
• Construction drawings
• Construction invoices
• AIA G702 & G703
– Master & itemized sub-contractor’s invoices
• Closing documents or lease agreement
• Appraisal (if any)
• Current Fixed Asset Schedule
• At a minimum we need the FAS
– A CSS is more expensive with no documentation
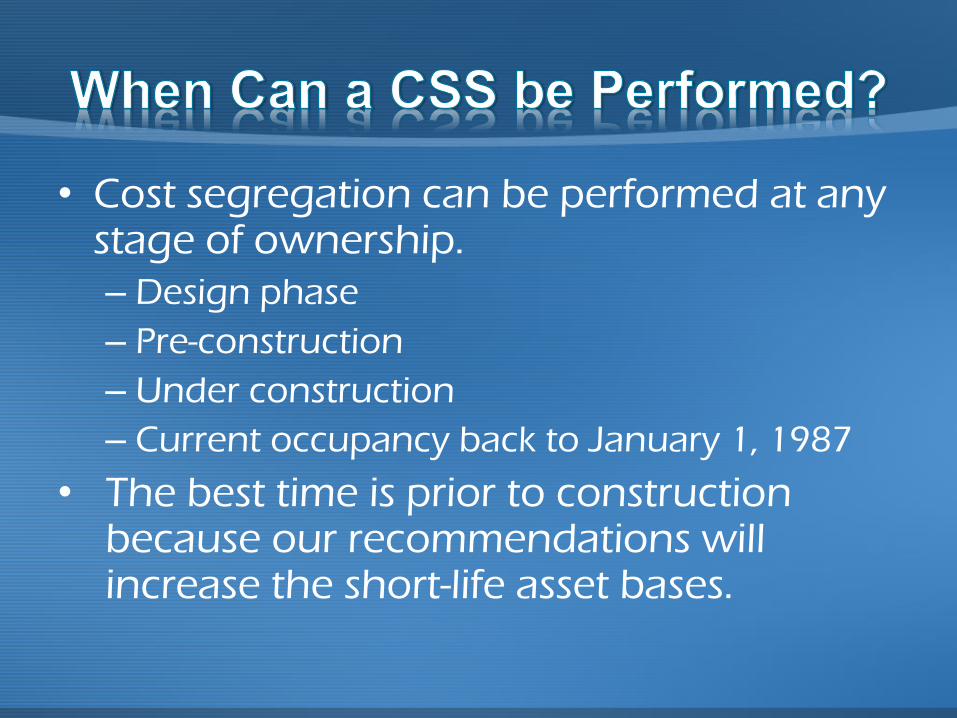
• Cost segregation can be performed at any stage of ownership.
– Design phase
– Pre-construction
– Under construction
– Current occupancy back to January 1, 1987
• The best time is prior to construction because our recommendations will increase the short-life asset bases.
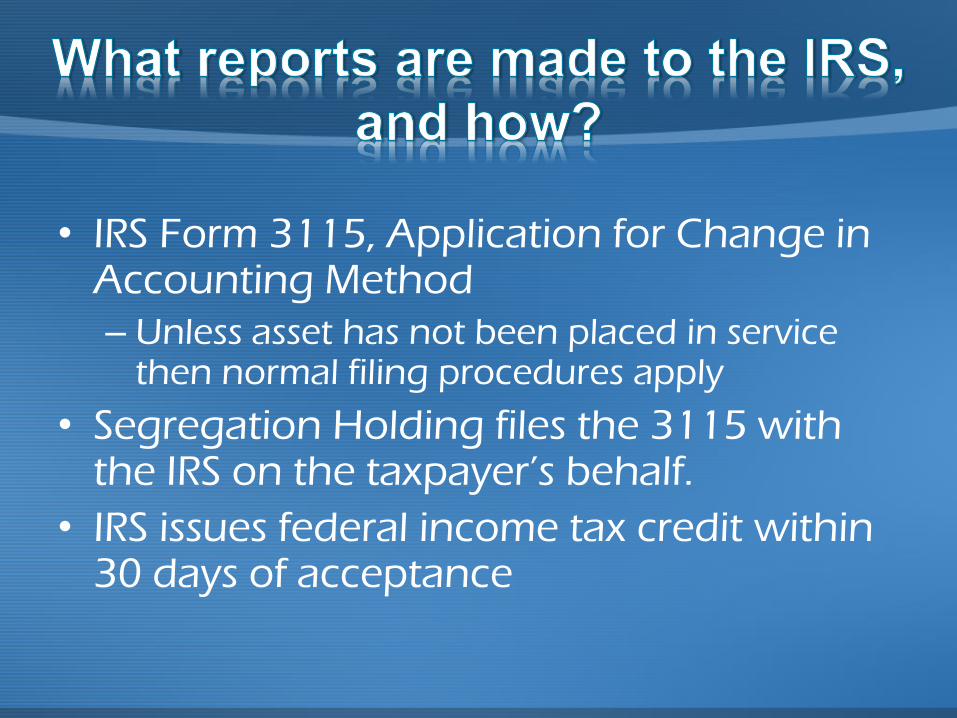
• IRS Form 3115, Application for Change in Accounting Method
– Unless asset has not been placed in service then normal filing procedures apply
• Segregation Holding files the 3115 with the IRS on the taxpayer’s behalf.
• IRS issues federal income tax credit within 30 days of acceptance
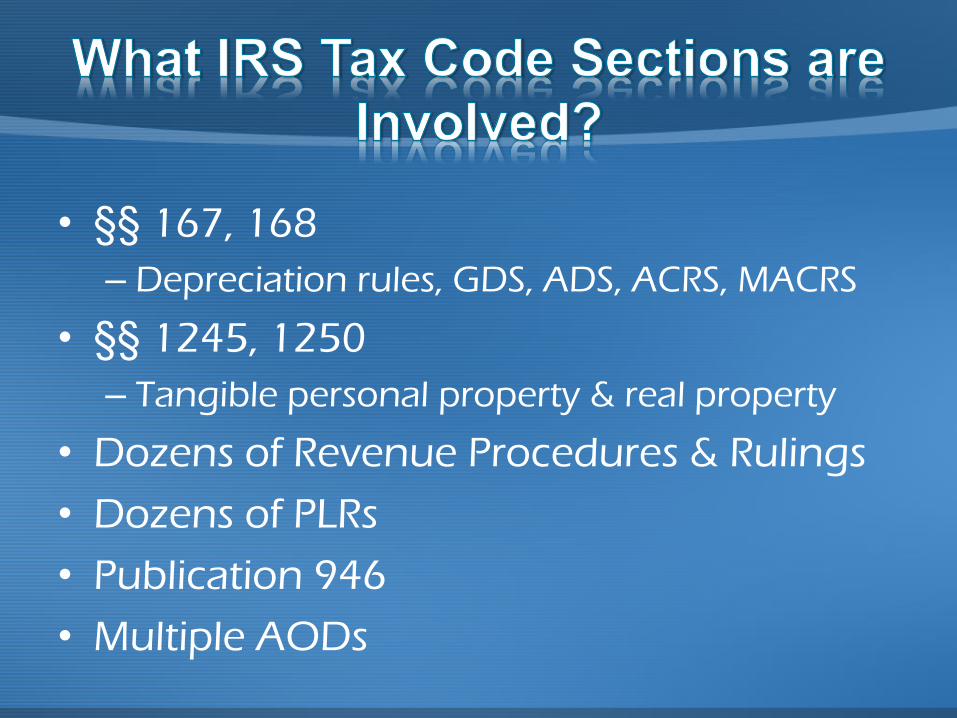
• §§ 167, 168
– Depreciation rules, GDS, ADS, ACRS, MACRS
• §§ 1245, 1250
– Tangible personal property & real property
• Dozens of Revenue Procedures & Rulings
• Dozens of PLRs
• Publication 946
• Multiple AODs
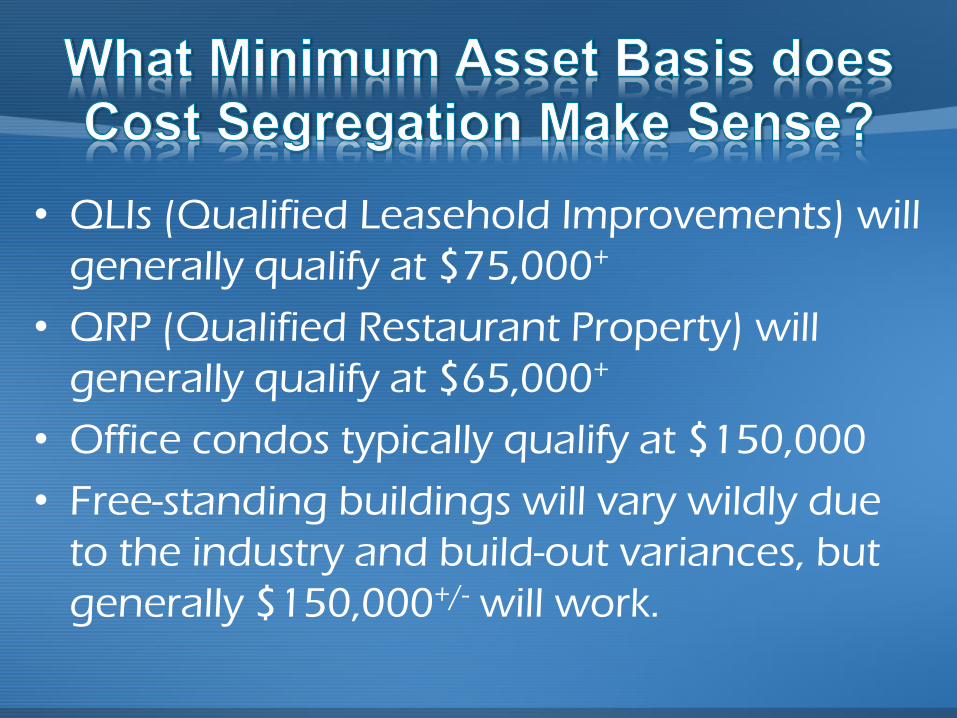
• QLIs (Qualified Leasehold Improvements) will
generally qualify at $75,000+
• QRP (Qualified Restaurant Property) will
generally qualify at $65,000+
• Office condos typically qualify at $150,000
• Free-standing buildings will vary wildly due
to the industry and build-out variances, but
generally $150,000+/- will work.
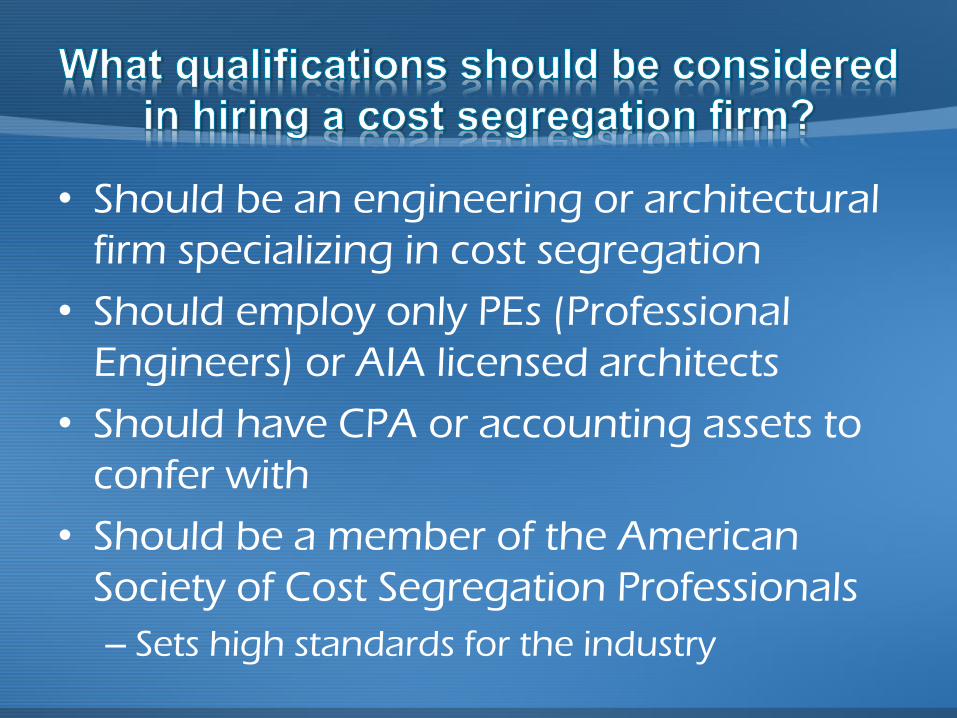
• Should be an engineering or architectural
firm specializing in cost segregation
• Should employ only PEs (Professional
Engineers) or AIA licensed architects
• Should have CPA or accounting assets to
confer with
• Should be a member of the American
Society of Cost Segregation Professionals
– Sets high standards for the industry
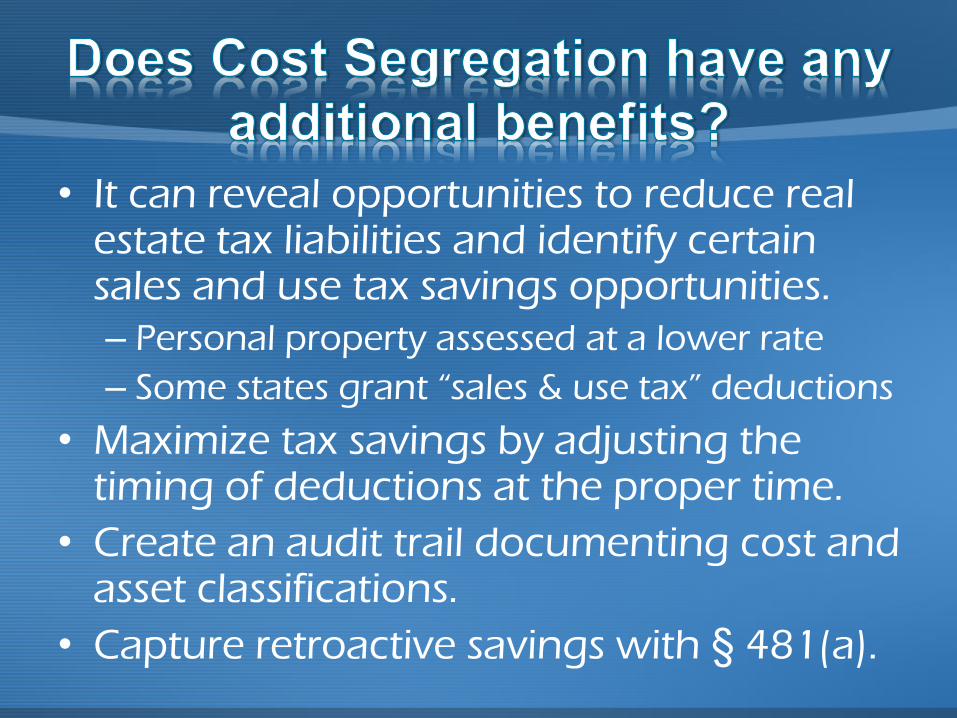
• It can reveal opportunities to reduce real estate tax liabilities and identify certain sales and use tax savings opportunities.
– Personal property assessed at a lower rate
– Some states grant “sales & use tax” deductions
• Maximize tax savings by adjusting the timing of deductions at the proper time.
• Create an audit trail documenting cost and asset classifications.
• Capture retroactive savings with § 481(a).
2150 S. Central Expy, Ste. 200, McKinney, TX 75070
www.SegregationHolding.com
www.GetYourTaxRefund.com
972-865-9050 Office / 972-865-9626 Facsimile
972-897-8019 Jeff’s Cell
269-303-0810 Brian’s Cell
817-291-7582 Meredith’s Cell
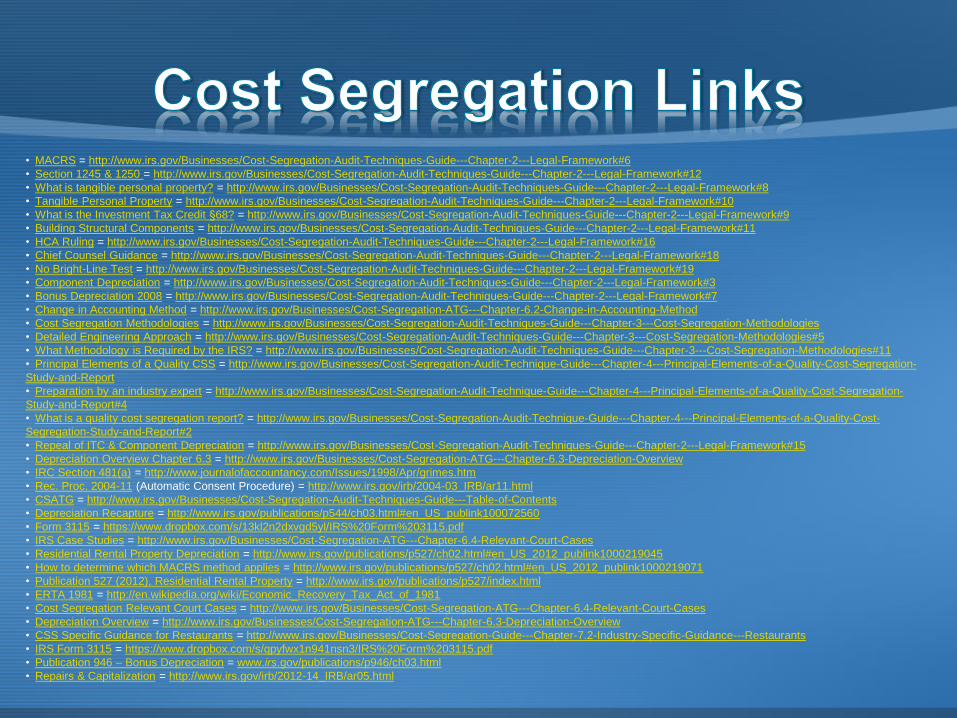
• MACRS = http://www.irs.gov/Businesses/Cost-Segregation-Audit-Techniques-Guide---Chapter-2---Legal-Framework#6
• Section 1245 & 1250 = http://www.irs.gov/Businesses/Cost-Segregation-Audit-Techniques-Guide---Chapter-2---Legal-Framework#12
• What is tangible personal property? = http://www.irs.gov/Businesses/Cost-Segregation-Audit-Techniques-Guide---Chapter-2---Legal-Framework#8
• Tangible Personal Property = http://www.irs.gov/Businesses/Cost-Segregation-Audit-Techniques-Guide---Chapter-2---Legal-Framework#10
• What is the Investment Tax Credit §68? = http://www.irs.gov/Businesses/Cost-Segregation-Audit-Techniques-Guide---Chapter-2---Legal-Framework#9
• Building Structural Components = http://www.irs.gov/Businesses/Cost-Segregation-Audit-Techniques-Guide---Chapter-2---Legal-Framework#11
• HCA Ruling = http://www.irs.gov/Businesses/Cost-Segregation-Audit-Techniques-Guide---Chapter-2---Legal-Framework#16
• Chief Counsel Guidance = http://www.irs.gov/Businesses/Cost-Segregation-Audit-Techniques-Guide---Chapter-2---Legal-Framework#18
• No Bright-Line Test = http://www.irs.gov/Businesses/Cost-Segregation-Audit-Techniques-Guide---Chapter-2---Legal-Framework#19
• Component Depreciation = http://www.irs.gov/Businesses/Cost-Segregation-Audit-Techniques-Guide---Chapter-2---Legal-Framework#3
• Bonus Depreciation 2008 = http://www.irs.gov/Businesses/Cost-Segregation-Audit-Techniques-Guide---Chapter-2---Legal-Framework#7
• Change in Accounting Method = http://www.irs.gov/Businesses/Cost-Segregation-ATG---Chapter-6.2-Change-in-Accounting-Method
• Cost Segregation Methodologies = http://www.irs.gov/Businesses/Cost-Segregation-Audit-Techniques-Guide---Chapter-3---Cost-Segregation-Methodologies
• Detailed Engineering Approach = http://www.irs.gov/Businesses/Cost-Segregation-Audit-Techniques-Guide---Chapter-3---Cost-Segregation-Methodologies#5
• What Methodology is Required by the IRS? = http://www.irs.gov/Businesses/Cost-Segregation-Audit-Techniques-Guide---Chapter-3---Cost-Segregation-Methodologies#11
• Principal Elements of a Quality CSS = http://www.irs.gov/Businesses/Cost-Segregation-Audit-Technique-Guide---Chapter-4---Principal-Elements-of-a-Quality-Cost-Segregation-
Study-and-Report
• Preparation by an industry expert = http://www.irs.gov/Businesses/Cost-Segregation-Audit-Technique-Guide---Chapter-4---Principal-Elements-of-a-Quality-Cost-Segregation-
Study-and-Report#4
• What is a quality cost segregation report? = http://www.irs.gov/Businesses/Cost-Segregation-Audit-Technique-Guide---Chapter-4---Principal-Elements-of-a-Quality-Cost-
Segregation-Study-and-Report#2
• Repeal of ITC & Component Depreciation = http://www.irs.gov/Businesses/Cost-Segregation-Audit-Techniques-Guide---Chapter-2---Legal-Framework#15
• Depreciation Overview Chapter 6.3 = http://www.irs.gov/Businesses/Cost-Segregation-ATG---Chapter-6.3-Depreciation-Overview
• IRC Section 481(a) = http://www.journalofaccountancy.com/Issues/1998/Apr/grimes.htm
• Rec. Proc. 2004-11 (Automatic Consent Procedure) = http://www.irs.gov/irb/2004-03_IRB/ar11.html
• CSATG = http://www.irs.gov/Businesses/Cost-Segregation-Audit-Techniques-Guide---Table-of-Contents
• Depreciation Recapture = http://www.irs.gov/publications/p544/ch03.html#en_US_publink100072560
• Form 3115 = https://www.dropbox.com/s/13kl2n2dxvgd5yl/IRS%20Form%203115.pdf
• IRS Case Studies = http://www.irs.gov/Businesses/Cost-Segregation-ATG---Chapter-6.4-Relevant-Court-Cases
• Residential Rental Property Depreciation = http://www.irs.gov/publications/p527/ch02.html#en_US_2012_publink1000219045
• How to determine which MACRS method applies = http://www.irs.gov/publications/p527/ch02.html#en_US_2012_publink1000219071
• Publication 527 (2012), Residential Rental Property = http://www.irs.gov/publications/p527/index.html
• ERTA 1981 = http://en.wikipedia.org/wiki/Economic_Recovery_Tax_Act_of_1981
• Cost Segregation Relevant Court Cases = http://www.irs.gov/Businesses/Cost-Segregation-ATG---Chapter-6.4-Relevant-Court-Cases
• Depreciation Overview = http://www.irs.gov/Businesses/Cost-Segregation-ATG---Chapter-6.3-Depreciation-Overview
• CSS Specific Guidance for Restaurants = http://www.irs.gov/Businesses/Cost-Segregation-Guide---Chapter-7.2-Industry-Specific-Guidance---Restaurants
• IRS Form 3115 = https://www.dropbox.com/s/qpyfwx1n941nsn3/IRS%20Form%203115.pdf
• Publication 946 – Bonus Depreciation = www.irs.gov/publications/p946/ch03.html
• Repairs & Capitalization = http://www.irs.gov/irb/2012-14_IRB/ar05.html

Real Estate Predictions For 2015

Our Speakers Today
• State Representative Rocky Miller
• Shaun White, RE/MAX International
• Jeff Krantz
• Jeff Carroll, Old Kinderhook
• Jeff Hobbs, Segregation Holdings
• George Bogema & Liz Sweesy

Thank You to our Sponsors
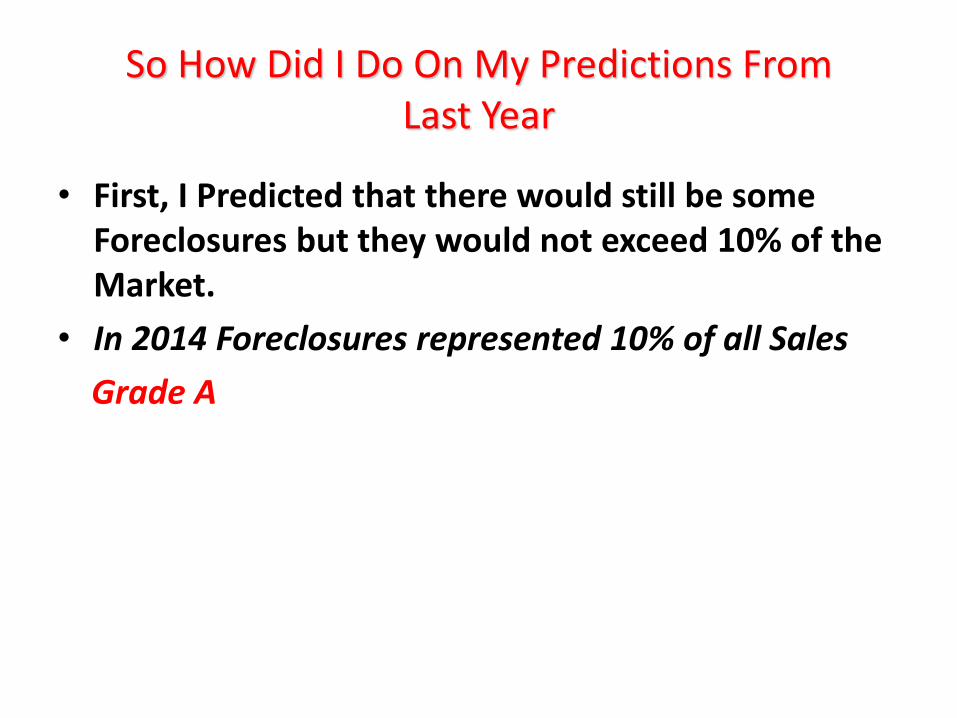
So How Did I Do On My Predictions From Last Year
• First, I Predicted that there would still be some Foreclosures but they would not exceed 10% of the Market.
• In 2014 Foreclosures represented 10% of all Sales
Grade A
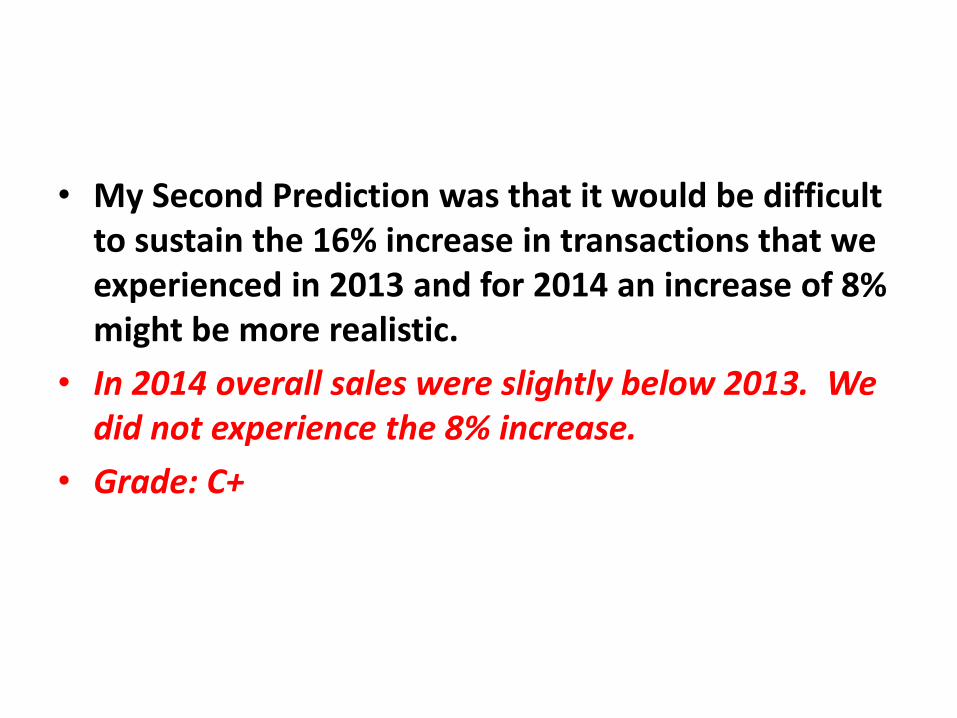
• My Second Prediction was that it would be difficult to sustain the 16% increase in transactions that we experienced in 2013 and for 2014 an increase of 8% might be more realistic.
• In 2014 overall sales were slightly below 2013. We did not experience the 8% increase.
• Grade: C+
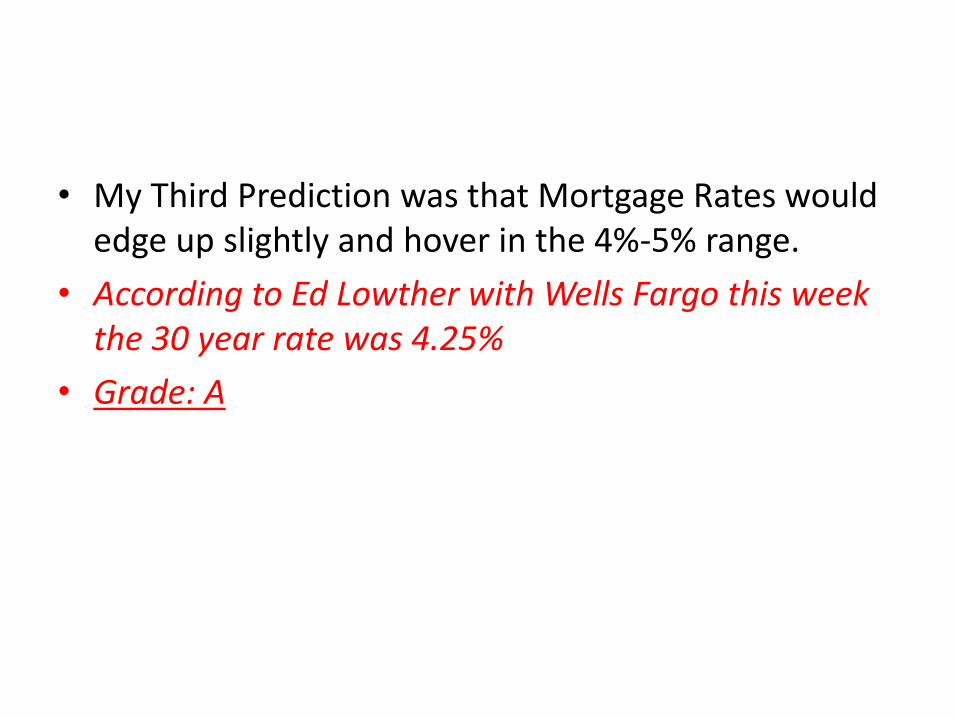
• My Third Prediction was that Mortgage Rates would edge up slightly and hover in the 4%-5% range.
• According to Ed Lowther with Wells Fargo this week the 30 year rate was 4.25%
• Grade: A
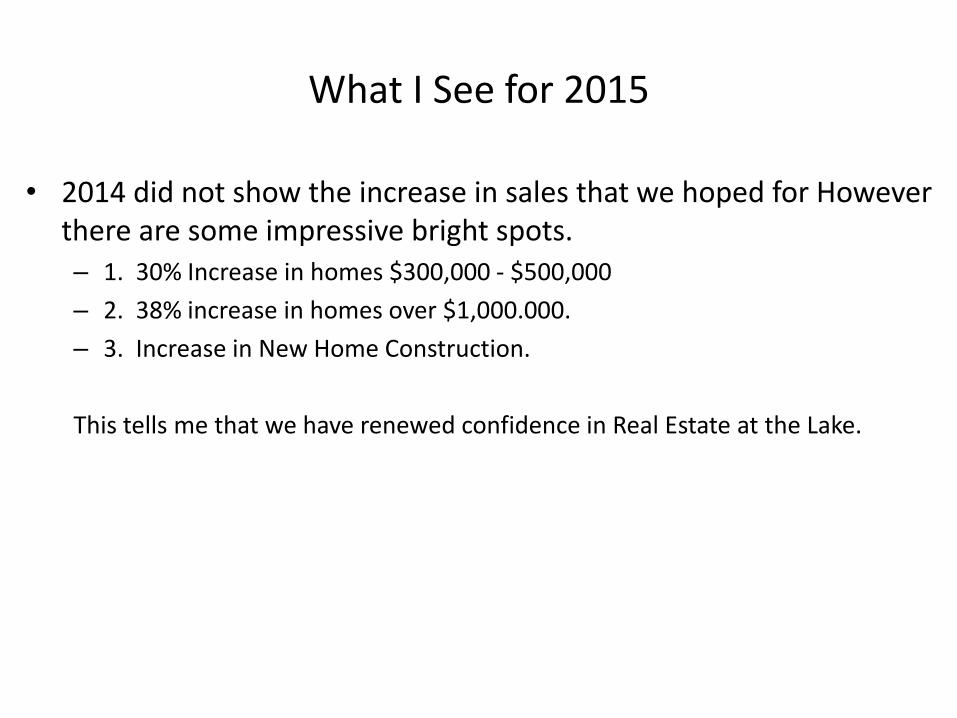
What I See for 2015
• 2014 did not show the increase in sales that we hoped for However there are some impressive bright spots. – 1. 30% Increase in homes $300,000 - $500,000
– 2. 38% increase in homes over $1,000.000.
– 3. Increase in New Home Construction.
This tells me that we have renewed confidence in Real Estate at the Lake.
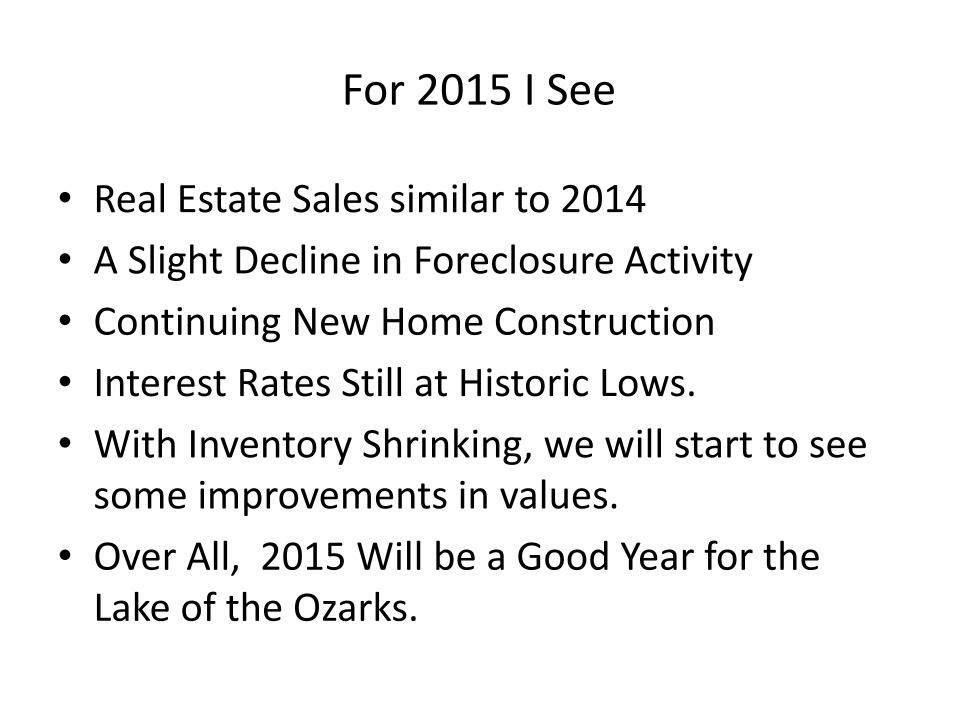
For 2015 I See
• Real Estate Sales similar to 2014
• A Slight Decline in Foreclosure Activity
• Continuing New Home Construction
• Interest Rates Still at Historic Lows.
• With Inventory Shrinking, we will start to see some improvements in values.
• Over All, 2015 Will be a Good Year for the Lake of the Ozarks.
Thank You Remember, the 2014 Symposium Information can be found on our Website:
www.lakeretrends.com


