24
FOREST OIL CORPORATION GROWING THE OIL IN FOREST Jefferies Global Energy Conference Jefferies Global Energy Conference November 28, 2012

FOREST OIL CORPORATION
GROWING THE OIL IN FOREST
Jefferies Global Energy ConferenceJefferies Global Energy Conference
November 28, 2012

FOREST OIL CORPORATION
Cautionary StatementsCautionary Statements
1
Forward Looking Statements – This presentation includes forward-looking statements within the meaning of Section 27A of the Securities Act of 1933 and Section 21E of the Securities Exchange Act of 1934. All statements, other than statements of historical facts, that address activities that Forest assumes, plans, expects, believes, projects, estimates or anticipates (and other similar expressions) will, should or may occur in the future are forward-looking statements. The forward-looking statements provided in this presentation are based on management's current belief, based on currently available information, as to the outcome and timing of future events. Forest cautions that its future natural gas and liquids production, revenues, cash flows, liquidity, plans for future operations, expenses, outlook for oil and natural gas prices, timing of capital expenditures, and other forward-looking statements are subject to all of the risks and uncertainties normally incident to the exploration for and development and production and sale of oil and gas.
These risks relating to Forest include, but are not limited to, oil and natural gas price volatility, Forest’s level of indebtedness, its ability to replace production, its ability to compete with larger producers, environmental risks, drilling and other operating risks, regulatory changes, credit risk of financial counterparties, risks of using third-party transportation and processing facilities and other risks as described in reports that Forest files with the Securities and Exchange Commission (SEC), including its Annual Report on Form 10-K, Quarterly Reports on Form 10-Q, and Current Reports on Form 8-K. Any of these factors could cause Forest's actual results and plans to differ materially from those in the forward-looking statements.
Reserves – The SEC permits oil and gas companies, in their filings with the SEC, to disclose only proved, probable and possible reserves that meet the SEC's definitions of such terms. Forest discloses only proved reserves in its filings with the SEC. Forest's proved reserves as of December 31, 2011 contained in this presentation were estimated by Forest's internal staff of engineers and comply with rules and definitions promulgated by the SEC. Forest engaged independent reserve engineers to audit a substantial portion of its proved reserves. The reserve audit procedures followed by the independent reserve engineers on behalf of Forest are described in Forest's Annual Report on Form 10-K. For the years ended December 31, 2011, 2010, and 2009, Forest engaged DeGolyer and MacNaughton, an independent petroleum engineering firm, to perform reserve audit services with respect to its proved reserves.
In this presentation, Forest also uses internal estimates of resource ”potential" or "upside" or other descriptions of volumes of resources potentially recoverable through additional exploratory drilling or recovery techniques, which volumes the SEC's guidelines strictly prohibit Forest from including in filings with the SEC. These estimates, as well as estimates of probable and possible reserves, are by their nature more speculative than estimates of proved reserves and accordingly are subject to substantially greater risk of being actually realized by Forest. Resource potential refers to Forest's internal estimates of hydrocarbon quantities that may be potentially discovered through exploratory drilling or recovered with additional drilling or recovery techniques. Resource potential does not constitute reserves within the meaning of the Society of Petroleum Engineer's Petroleum Resource Management System. Area wide unrisked resource potential has not been risked by Forest's management. Actual quantities that may be ultimately recovered from Forest's interests will differ substantially. Factors affecting ultimate recovery include the scope of Forest’s ongoing drilling program, which will be directly affected by the availability of capital, drilling and production costs, availability of drilling services and equipment, drilling results, lease expirations, transportation constraints, regulatory approvals and other factors; and actual drilling results, including geological and mechanical factors affecting recovery rates. Estimates of resource potential may change significantly as development of our resource plays provides additional data. Investors are urged to consider closely the disclosures in Forest's Annual Report on Form 10-K, Forest’s Quarterly Reports on Form 10-Q and Forest’s Current Reports on Form 8-K, copies of which are available for free from Forest by writing Forest at 707 17th Street, Suite 3600, Denver, CO 80202, Attention: Investor Relations, or by calling Investor Relations at 303-812-1400, or visiting Forest's website at www.forestoil.com.

FOREST OIL CORPORATION 2
Forest Oil SnapshotForest Oil Snapshot
12/31/11 Est. Proved Reserves of 1.9 tcfe
55% Proved Developed
R/P Ratio – 16 Years
3Q Daily Net Production of 339 MMcfe/d
225 MMcf/d of gas
8.9 Mbbl/d of oil
10.1 Mbbl/d of natural gas liquids
3Q12 Oil Volumes Organically Increased 29% over 3Q11
Liquids Account for 34% of Equivalent Volumes
Core Gas & Liquids Area
Core Oil & Liquids Areas
Panhandle
Eagle Ford Shale
East Texas/ North Louisiana
Corporate Summary

FOREST OIL CORPORATION
Second Half 2012 StrategySecond Half 2012 Strategy
3
Executing on Strategic Objectives
• Exploit our growing inventory of higher-return oil growth opportunities in the Panhandle Area
• Focus on go-it-alone plan in the Eagle Ford
• Adjust capital spending rate to align with projected cash flow
• De-lever balance sheet with sale of non-core assets to enhance financial strength and flexibility
����
����
����
����

FOREST OIL CORPORATION
Third Quarter 2012 Highlights Third Quarter 2012 Highlights
4
• Panhandle Area continues to yield impactful results targeting shallower oil horizons- Extended boundary of Hogshooter play with successful well at Camp South
that came online at an average 24-hr max rate of 1,600 boe/d (71% oil)- Seeing consistent results with Hogshooter program posting an average 24-hr
max rate of 2,600 boe/d (68% oil)
• Eagle Ford program at development stage - Second generation wells have had an average 24-hr max production rate of
667 boe/d and 30-day average of 489 boe/d- Focusing on cost savings to maximize returns- Rig-walking system introduced that allows for multi-well pad drilling
• Executing divestiture program with ~$277 million in sales closed
• Opportunistically completed $500 million senior notes offering to increase financial flexibility
Executing on Strategic Objectives
FOREST OIL CORPORATION
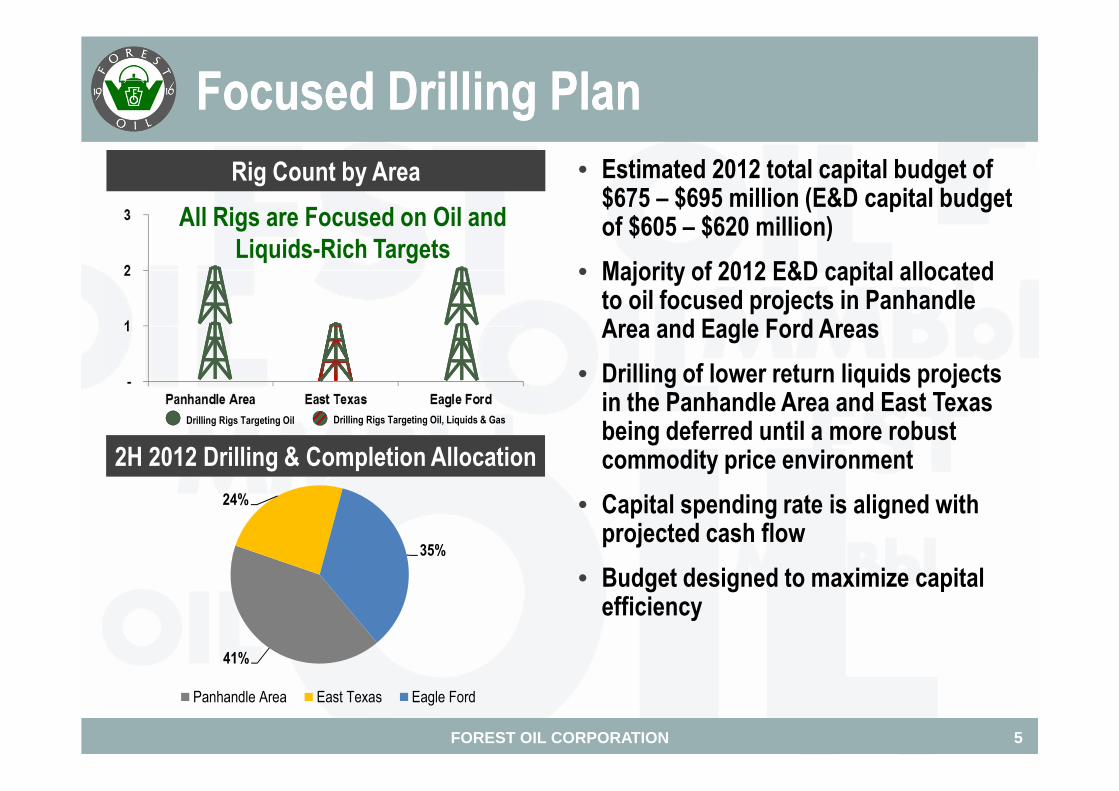
Focused Drilling PlanFocused Drilling Plan
5
Rig Count by Area • Estimated 2012 total capital budget of $675 – $695 million (E&D capital budget of $605 – $620 million)
• Majority of 2012 E&D capital allocated to oil focused projects in Panhandle Area and Eagle Ford Areas
• Drilling of lower return liquids projects in the Panhandle Area and East Texas being deferred until a more robust commodity price environment
• Capital spending rate is aligned with projected cash flow
• Budget designed to maximize capital efficiency
Drilling Rigs Targeting Oil, Liquids & GasDrilling Rigs Targeting Oil
All Rigs are Focused on Oil and Liquids-Rich Targets
2H 2012 Drilling & Completion Allocation
41%
24%
35%
Panhandle Area East Texas Eagle Ford
FOREST OIL CORPORATION
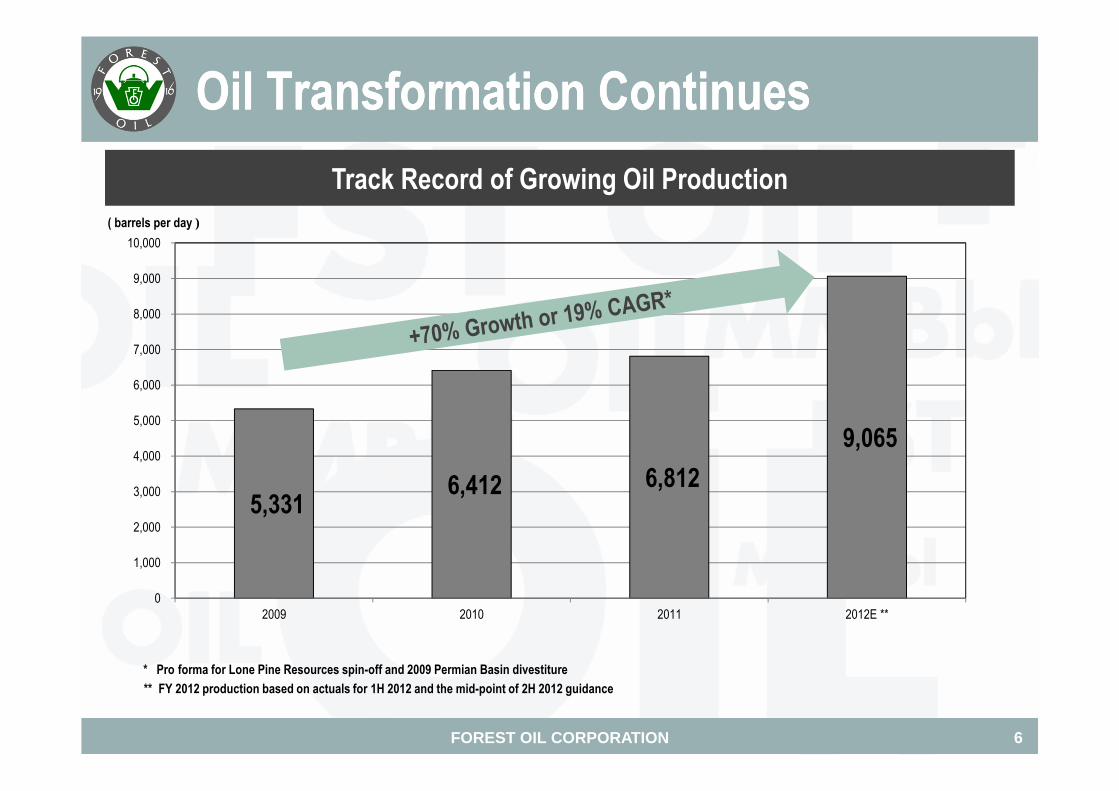
Oil Transformation ContinuesOil Transformation Continues
6
Track Record of Growing Oil Production
* Pro forma for Lone Pine Resources spin-off and 2009 Permian Basin divestiture
5,331 6,412 6,812
9,065
0
1,000
2,000
3,000
4,000
5,000
6,000
7,000
8,000
9,000
10,000
2009 2010 2011 2012E **
** FY 2012 production based on actuals for 1H 2012 and the mid-point of 2H 2012 guidance
( barrels per day )

FOREST OIL CORPORATION
Revenue & Production Revenue & Production
7
* Pro forma for Lone Pine Resources spin-off and 2009 Permian Basin divestiture
2008 – 3Q12 Revenue & Production Mix*
15%
17%
19%
21%
23%
25%
27%
29%
31%
33%
35%
0%
10%
20%
30%
40%
50%
60%
70%
80%
2008 2009 2010 2011 3Q12
% Revenues % of Production
( % Revenues ) ( % Oil & Liquids Production )
Oil and Liquids Make up 34% of Equivalent Volumes and are Growing

FOREST OIL CORPORATION
Focused Portfolio Located in the Right AreasFocused Portfolio Located in the Right Areas
8
AreaNet Acres(September 30,
2012)
PUD Locations(December 31,
2011)
PUD Reserves ***
(Net Bcfe) (December 31, 2011)
Other Identified Locations*
(December 31, 2011)
Unrisked Potential*
(Net Bcfe) (December 31, 2011)
Liquids Target
Lantern Drilling
Utilization
Land Access & Infrastructure
In Place
Panhandle Area 108,000 297 350 1,096 1,266 ���� ���� ����
East Texas / North Louisiana
123,000 289 305 2,755 4,198 ���� ���� ����
Eagle Ford Shale ** 40,000 42 57 500 675 ���� ���� ����
Total 271,000 628 712 4,351 6,139 ���� ���� ����
* Does not include estimated proved reserves or locations associated with estimated proved reserves
** Only includes the 40,000 net acres Forest plans to develop in the central fairway
*** Please see (i) the disclosure under “Risk Factors” included in Item 8.01 of our Form 8-K filed September 12, 2012 for a discussion of risks associated with our estimated proved reserves and (ii) “Item 2, Management’s Discussion and Analysis of Financial Condition and Results of Operations — Results of Operations — Ceiling Test Write-Down of Oil and Natural Gas Properties” in our Form 10-Q for the third quarter of 2012 for information regarding our decision to reclassify our reserves in Italy from proved to probable
Core Assets Hold Meaningful Growth Opportunities
FOREST OIL CORPORATION
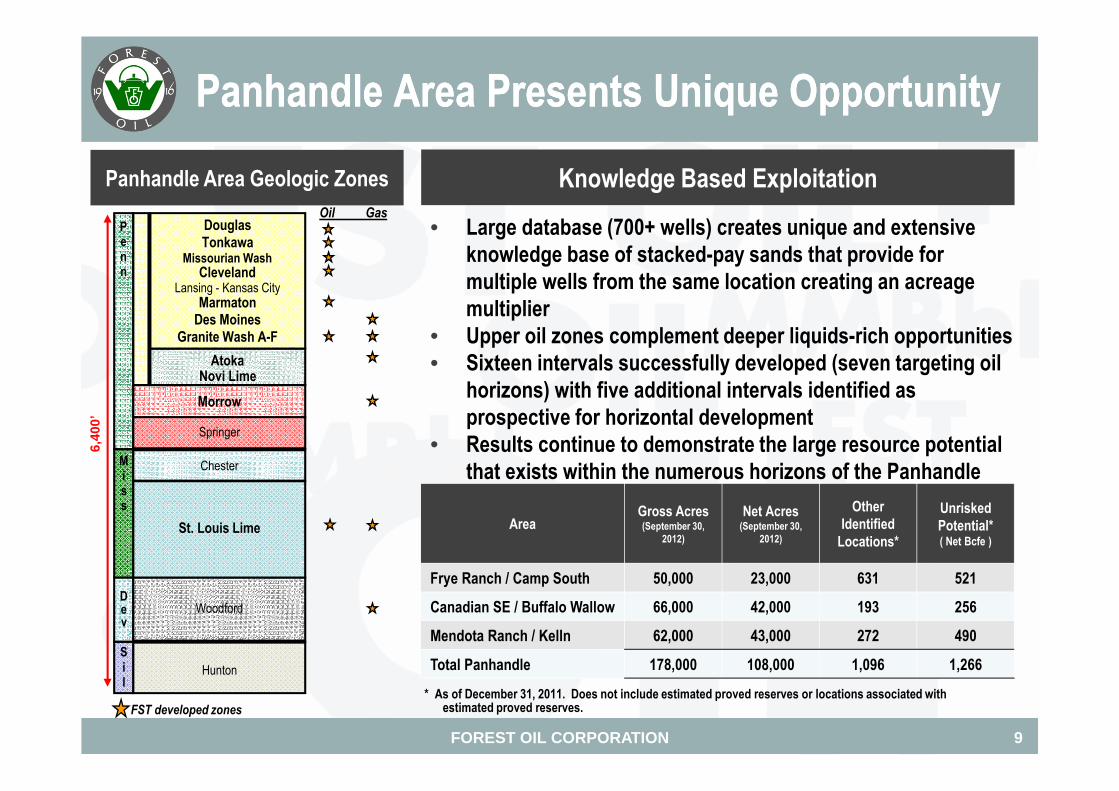
Panhandle Area Presents Unique OpportunityPanhandle Area Presents Unique Opportunity
9
Panhandle Area Geologic Zones
Hunton
Sil
WoodfordDev
St. Louis Lime
ChesterMiss
Springer
Morrow
AtokaNovi Lime
DouglasTonkawa
Missourian WashCleveland
Lansing - Kansas CityMarmatonDes Moines
Granite Wash A-F
Penn
FST developed zones
6,40
0’
Knowledge Based Exploitation
* As of December 31, 2011. Does not include estimated proved reserves or locations associated with estimated proved reserves.
AreaGross Acres (September 30,
2012)
Net Acres(September 30,
2012)
Other Identified Locations*
Unrisked Potential*( Net Bcfe )
Frye Ranch / Camp South 50,000 23,000 631 521
Canadian SE / Buffalo Wallow 66,000 42,000 193 256
Mendota Ranch / Kelln 62,000 43,000 272 490
Total Panhandle 178,000 108,000 1,096 1,266
• Large database (700+ wells) creates unique and extensive knowledge base of stacked-pay sands that provide for multiple wells from the same location creating an acreage multiplier
• Upper oil zones complement deeper liquids-rich opportunities• Sixteen intervals successfully developed (seven targeting oil
horizons) with five additional intervals identified as prospective for horizontal development
• Results continue to demonstrate the large resource potential that exists within the numerous horizons of the Panhandle
Oil Gas

FOREST OIL CORPORATION
Panhandle Area Geologic IntervalsPanhandle Area Geologic Intervals
10
Acreage Multiplier (Interval Factor)
Geologic IntervalOther Identified
Locations*
Douglas 25
Tonkawa 63
Missourian Wash (3 Zones) 45
Cleveland 90
Des Moines / Marmaton 44
Britt 114
Granite Wash Series (5 Zones) 442
Atoka (2 Zones) 145
Morrow 125
St. Louis 3
Woodford TBD
Total Other Identified Locations 1,096
* As of December 31, 2011. Does not include locations associated with estimated proved reserves.
Sixteen Intervals Have Been Successfully Developed Horizontally
Higher-margin oil zones provide
increasing development opportunities
Complementary liquids-rich and natural gas
horizons

FOREST OIL CORPORATION
Panhandle Area Oil ZonesPanhandle Area Oil Zones
11
• Missourian Wash (Hogshooter) program averaging a 24-hour max production rate of 2,600 boe/d within the Frye Ranch Area
• Hogshooter program has produced over 1 MMboe since inception
• Productive boundary of the Hogshooter play extended into the Camp South Area
• Initial well came online at a 24-hour max production rate of 1,600 boe/d (71% oil)
• Recently completed first well targeting the Douglas horizon in the Canadian SE Area
• 715 boe/d ( 62% oil) 24-hour max production rate
• Two rig Panhandle program focusing on the Hogshooter and other oil intervals
Undisclosed
MENDOTARANCH
Cleveland / Tonkawa
Douglas
KELLN
BUFFALOWALLOW
Missourian Wash/ “Hogshooter”
CAMPSOUTH
FRYERANCH
CANADIAN SE
Growing Oil Opportunities

FOREST OIL CORPORATION
Panhandle Area NGL Takeaway Improving Panhandle Area NGL Takeaway Improving
12
Source: DCP Midstream
• DCP Midstream currently constructing Southern Hills Pipeline
• Southern Hills provides increased optionality with access to better outlets
• Allows Forest to move its Panhandle NGL’s away from bottleneck at Conway and take advantage of higher priced Mont Belvieu hub
• Southern Hills will have NGL takeaway capacity of more than 150,000 b/d
• Expected to be in service by July 2013
Panhandle Area
FST Acreage
Improving Dynamics

FOREST OIL CORPORATION
Eagle Ford Shale: Oil Window PositionEagle Ford Shale: Oil Window Position
13
• Go-it-alone plan allows Forest to hold approximately 40,000 net acres
• Continue to see consistent IP and EUR results within second-generation well group
• 24-hr max IP rate of 667 boe/d
• 30-day average rate of 489 boe/d
• Focus on optimizing operations and lowering costs
• Remaining acreage position is being evaluated for monetization opportunities
* Assumes 40,000 net acres, 80-acre spacing, and EUR of 300 mboe. Does not include proved reserves or locations associated with estimated proved reserves.
Developing Central Fairway
Gross Acres
Net Acres
Other Identified Drilling Locations*
( Gross )
Unrisked
Potential*( Net MMBbls )
100,000 91,000 500 113

FOREST OIL CORPORATION
Eagle Ford Shale: Completion OptimizationEagle Ford Shale: Completion Optimization
14
Completion Evolution – Yielding Consistent Results
Landing Section
Version I Version II
Initial Completion Transitional Completion Current Completion

FOREST OIL CORPORATION
Eagle Ford Shale Well Performance Eagle Ford Shale Well Performance
15
Development Program Seeing Consistent Results
550
667
272
489
0
100
200
300
400
500
600
700
1st Generation 2nd Generation 1st Generation 2nd Generation
24-hr Max IP Rate* 30-day Average Rate*( Boe/d )
* Includes non-restricted rate program wells only
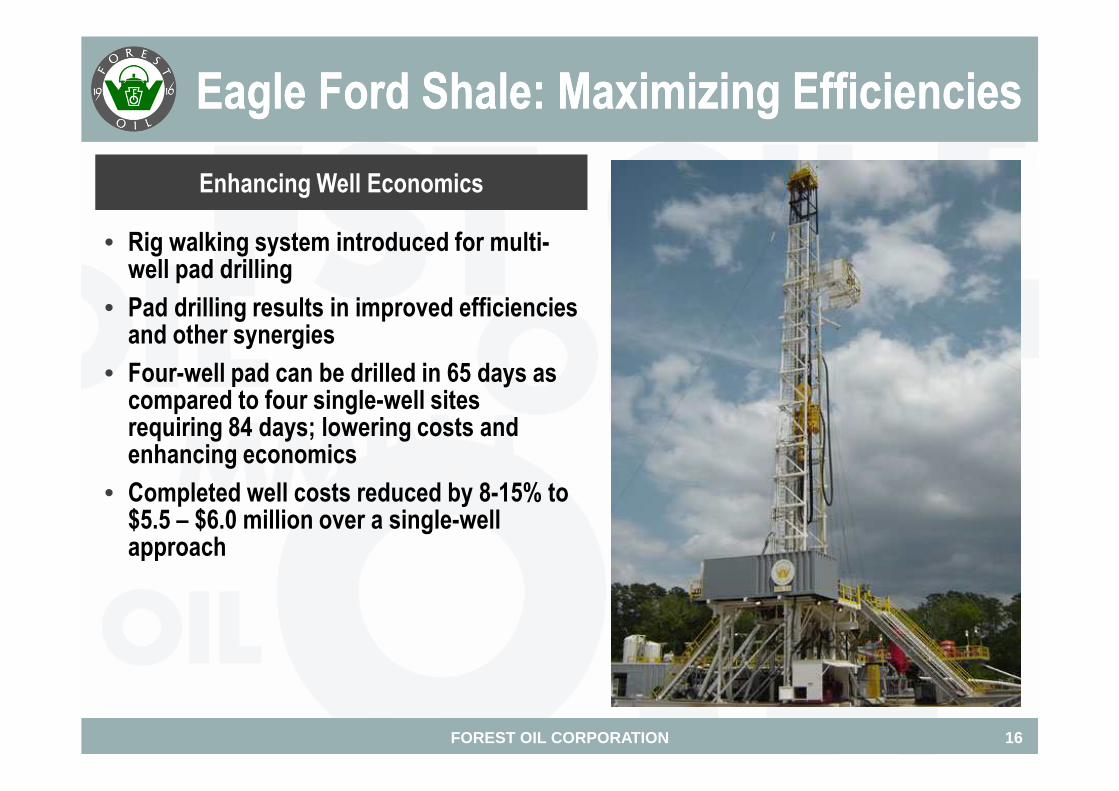
FOREST OIL CORPORATION 16
• Rig walking system introduced for multi-well pad drilling
• Pad drilling results in improved efficiencies and other synergies
• Four-well pad can be drilled in 65 days as compared to four single-well sites requiring 84 days; lowering costs and enhancing economics
• Completed well costs reduced by 8-15% to $5.5 – $6.0 million over a single-well approach
Eagle Ford Shale: Maximizing EfficienciesEagle Ford Shale: Maximizing Efficiencies
Enhancing Well Economics
FOREST OIL CORPORATION
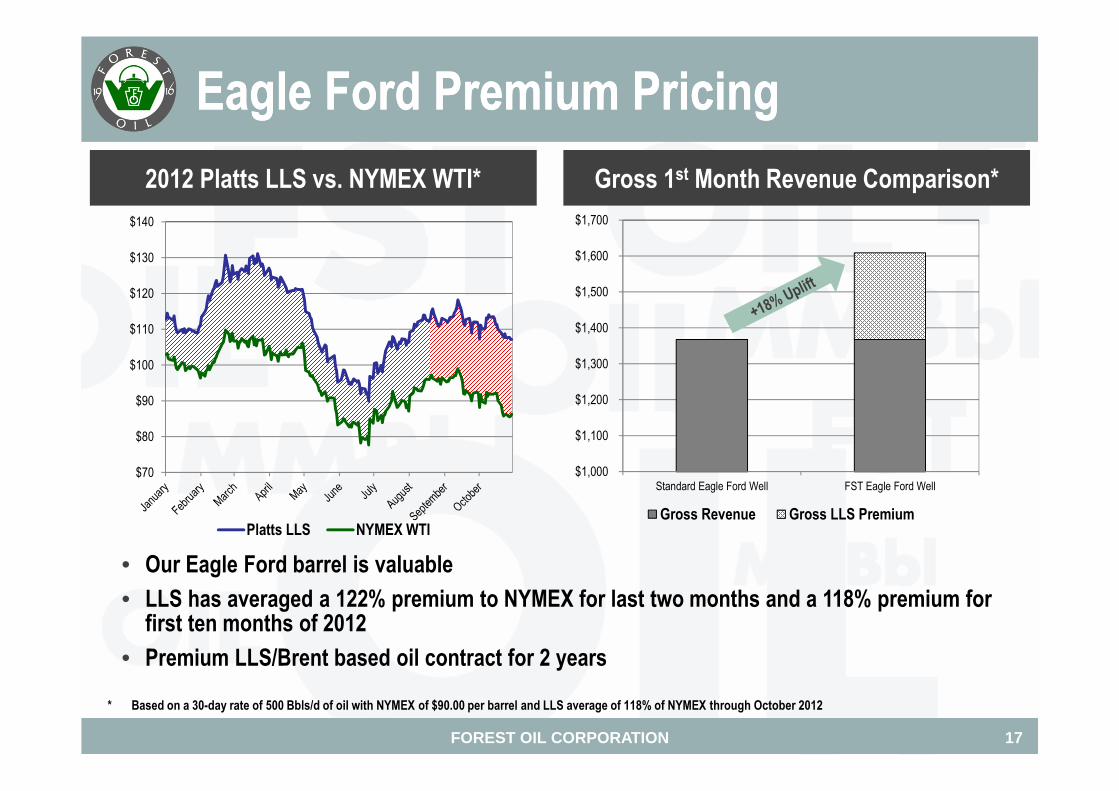
Eagle Ford Premium PricingEagle Ford Premium Pricing
17
$70
$80
$90
$100
$110
$120
$130
$140
Platts LLS NYMEX WTI
$1,000
$1,100
$1,200
$1,300
$1,400
$1,500
$1,600
$1,700
Standard Eagle Ford Well FST Eagle Ford Well
Gross Revenue Gross LLS Premium
2012 Platts LLS vs. NYMEX WTI* Gross 1st Month Revenue Comparison*
• Our Eagle Ford barrel is valuable
• LLS has averaged a 122% premium to NYMEX for last two months and a 118% premium for first ten months of 2012
• Premium LLS/Brent based oil contract for 2 years
* Based on a 30-day rate of 500 Bbls/d of oil with NYMEX of $90.00 per barrel and LLS average of 118% of NYMEX through October 2012

FOREST OIL CORPORATION
Economic Sensitivity of Eagle Ford Economic Sensitivity of Eagle Ford
18
300 Mboe EUR Type Well Economics*
* Base case: EUR of 300 Mboe and 500 Boe/d initial 30-day average rate

FOREST OIL CORPORATION
East Texas Liquids PlayEast Texas Liquids Play
19
Stacked-Pay Advantage
• Total acreage position of 147,000 gross acres (110,000 net) in East Texas prospective for oil and liquids-rich Cotton Valley objectives
• Legacy acreage position held by production with low cost of entry
• Recently completed horizontal oil and liquids-rich Cotton Valley well with an average 24-hour IP rate of 13 mmcfe/d (39% liquids or 845 boe/d from oil and natural gas liquids)
• Significant offset activity targeting oil and liquids-rich Cotton Valley objectives
• One-rig dedicated program
East Texas Horizontal Liquids Play
Gross Acres 147,000
Net Acres 110,000
Gross Drilling Cost ($MM) $7.0
Unrisked Gross EUR (Bcfe) 4.0 – 5.0
Current FST activity

FOREST OIL CORPORATION
0
200
400
600
800
1,000
1,200
2012 2013 2014 2015 2016 2017 2018 2019 2020
Fixed Debt Floating Debt
$1,000 @
7.25%
$300 @
L + 5.89%1
20
Attractive Debt Maturity ProfileAttractive Debt Maturity Profile
Debt Profile 9/30/2012
Maturity (years) 6.1
• Current long-term debt totals $1.8 billion pro forma for announced divestitures• Senior Notes offering extended the weighted average maturity of Forest debt and significantly
reduces refinancing risk related to the 2014 Senior Notes • Non-core asset divestitures expected to further increase financial flexibility and liquidity
($MM)
1 Forest has entered into a fixed-to-floating interest rate swap for $500 million
$300
$500 @
7.5%

FOREST OIL CORPORATION
Hedging Program SummaryHedging Program Summary
21
Oct. – Dec. 2012 2013 2014 2015
Natural gas swaps (Bbtu/d) 155 (1) 160 40 -
Weighted average price (per MMBtu) $4.63 $3.98 $4.50 -
Natural gas liquids swaps (MBbls/d) 2.0 - - -
Weighted average price (per Bbl) $45.22 - - -
Oil swaps (MBbls/d) 4.5 4.0 - -
Weighted average price (per Bbl) $97.26 $95.53 - -
Natural gas swaptions (Bbtu/d) - 40.0 40.0 -
Weighted average price (per MMBtu) - $4.02 $4.50 -
Oil swaptions (MBbls/d) - 2.0 5.0 3.0
Weighted average price (per Bbl) - $95.00 $105.80 $100.00
Opportunistically Adding to Hedge Position
(1) 50 Bbtu/d of 2012 gas swaps (with a weighted average hedged price per MMBtu of $5.30) are layered with a written put of $3.53 and a call spread of $4.00-to-$4.50. Together with the put and call spread, Forest willreceive the swap price of $5.30 on the 50 Bbtu/d except as follows: Forest will receive (i) NYMEX Henry Hub (HH) plus $1.77 when NYMEX HH is below $3.53; (ii) $5.30 plus the value of the call spread when NYMEX HH isbetween $4.00 and $4.50; and (iii) $5.80 when NYMEX HH is $4.50 or above.
In connection with entering into certain 2012 gas swaps with premium hedged prices, Forest granted oil puts to the counterparties, giving the counterparties the option to put 5 MBbls/d to Forest at $75.00 per Bbl on a monthlybasis during the period July 2012 through December 2012.
FOREST OIL CORPORATION
Investment HighlightsInvestment Highlights
22
• Dominant operating position in Forest’s three core areas
• Focused capital plan allows Forest to concentrate on higher return oil and liquids-rich growth opportunities
• High quality inventory of assets underpin future oil growth
• Deleveraging plan identified and being executed to enhance financial flexibility and liquidity
• Hedging program provides greater visibility for cash flows and capital spending

FOREST OIL CORPORATION 23
Forest Oil Corporation
707 Seventeenth Street, Suite 3600Denver, CO 80202
303.812.1400Website: www.forestoil.com
Investor Relations Contact: Larry Busnardo, Director – Investor RelationsPhone: 303.812.1441 | Email: [email protected]
TWITTER.COM/FORESTOIL FACEBOOK.COM/FORESTOIL LINKEDIN.COM/FORESTOIL


