+ All Categories
Home > Documents > Jennifer L. Graham, Andrew C. Ziegler, Brian L. Loving, … · Jennifer L. Graham, Andrew . C....

Jennifer L. Graham, Andrew C. Ziegler, Brian L. Loving, … · Jennifer L. Graham, Andrew . C....

Date post: 09-Apr-2018
Category:
Upload: truongliem
View: 220 times
Download: 2 times
Share this document with a friend
27
Jennifer L. Graham, Andrew C. Ziegler, Brian L. Loving, and Keith A. Loftin U.S. Geological Survey Cooperative Water Program Stakeholder Webinar Series November 14, 2012 In Cooperation with: the City of Lawrence, the City of Topeka, Johnson County WaterOne, the Kansas Water Office, and the Kansas Department of Health and Environment
Transcript

Jennifer L. Graham, Andrew C. Ziegler, Brian L. Loving,

and Keith A. Loftin

U.S. Geological Survey Cooperative Water Program Stakeholder Webinar Series

November 14, 2012

In Cooperation with: the City of Lawrence, the City of Topeka,

Johnson County WaterOne, the Kansas Water Office, and the Kansas

Department of Health and Environment

2011 Harmful Algal Blooms and Reservoir Releases in the Kansas River Watershed

Kansas River serves as a drinking water supply for 800,000 Kansans Missouri River Flooding + Late Summer Reservoir Releases + Harmful Algal Blooms =

Concerns About Transport of Cyanotoxins and Taste-and-Odor Compounds Potentially Affecting Drinking Water Supplies

Milford Lake, September 2011 Photo courtesy of E. Looper, USGS

Cyanobacterial Harmful Algal Blooms • Ecologic Concerns

– Low dissolved oxygen – Fish kills

• Economic Concerns – Loss of recreational revenue – Taste and odor

• Olfactory sensitivity to taste-and-odors at low concentrations (5-10 ng/L)

– Added drinking water treatment costs

• Health Concerns – Toxicity

• Cyanotoxins are on the EPA Contaminant Candidate List

Binder Lake, Iowa

Marion Reservoir, Kansas

Ecologic, Economic, and Public Health Concerns Surrounding Cyanobacterial Harmful Algal Blooms are a Reality

Summer 2011 Headlines

Hepatotoxins Neurotoxins Dermatoxins Taste/Odor CYL MC ANA SAX GEOS MIB

Anabaena X X X X X X ?

Aphanizomenon X ? X X X X

Microcystis X X

Oscillatoria/Planktothrix X X X X X X

Cyanobacterial Toxins and Taste-and-Odor Compounds

After Graham and others, 2008, TWRI Chapter 7.5 http://water.usgs.gov/owq/FieldManual/

Photos courtesy of A. St. Amand

Anabaena Aphanizomenon Planktothrix Microcystis

Cyanotoxin Exposure

• Ingestion and inhalation during recreational activities (most likely)

KDHE Beach Monitoring Program: http://www.kdheks.gov/algae-illness/

• Inhalation of aerosolized toxins

• Consumption in drinking water

Do not try this at home (or anywhere else)!

Grand Lake St. Marys, Ohio Source of Photos Unknown

World Health Organization (WHO) Provisional Guidelines for Microcystins in Finished Drinking Water and Recreational Areas

• Finished Drinking Water (Chronic Effects): 1 µg/L

• Recreational Areas (Acute Effects)

– Low Risk: <10 µg/L – Moderate Risk: 10-20 µg/L – High Risk: 20-2,000 µg/L – Very High Risk: >2,000 µg/L

“Algae may make for stinky water, but it poses no health risks” -Concord Monitor, Concord, NH July 7, 2006

http://www.who.int/water_sanitation_health/dwq/chemicals/microcystinsum.pdf

Kansas River Study Objectives

• Provide timely data to utilities that use the Kansas River as a source-water supply.

• Characterize the extent and duration of the transport of cyanobacteria and associated toxins and taste-and-odor compounds from upstream reservoirs to the Kansas River.

• Determine the strengths and weaknesses of the sampling plan used during this event so robust long-term plans to evaluate and provide a monitoring program for future events can be developed.

Milford Lake, September 2011 Photo courtesy of E. Looper, USGS

Kansas River Study Sites

Kansas River Study Sampling Strategy

• Samples were collected weekly during September 2-October 31, 2011; the sites sampled changed weekly based on toxin and taste-and-odor results.

• Most river samples were surface grabs from the centroid of flow.

• Samples were analyzed for microcystin, geosmin, 2-methylisoborneol, chlorophyll, and phytoplankton community composition.

Milford Lake Sampling, September 2011 Photo courtesy of E. Looper, USGS

Streamflow in the Kansas River Increased by About an Order of Magnitude at Most Sites During Peak Reservoir Releases

AUGUST-OCTOBER 2011

8/1 8/8 8/15 8/22 8/29 9/5 9/12 9/19 9/26 10/3 10/10 10/17 10/24 10/31

STR

EA

MFL

OW

(CFS

)

100

1000

10,000

100,000SMOKY HILLFT. RILEYWAMEGOBELVUETOPEKALECOMPTONDESOTO

DISCRETE SAMPLE COLLECTION

TRANSPORT CALCULATED

SEPTEMBER 8, 2011

0204060801001201401601800

1,000

2,000

3,000

4,000

GAGEDEXPECTED

OCTOBER 31, 2011

DISTANCE UPSTREAM FROM CONFLUENCE WITH MISSOURI RIVER, IN MILES

0204060801001201401601800

1,000

2,000

3,000

4,000

GAGEDEXPECTED

OCTOBER 3, 2011

DISTANCE UPSTREAM FROM CONFLUENCE WITH MISSOURI RIVER, IN MILES

020406080100120140160180

STR

EA

MFL

OW

(CFS

)

0

5,000

10,000

15,000

20,000

GAGEDEXPECTED

SEPTEMBER 26, 2011

0204060801001201401601800

5,000

10,000

15,000

20,000

GAGEDEXPECTED

The Kansas River Lost Water as Streamflow Increased and Gained Water as Streamflow Decreased

Water lost to aquifer

Water gained from aquifer

SEPTEMBER 2011-JANUARY 201209/01 09/15 09/29 10/13 10/27 11/10 11/24 12/08 12/22 01/05

TO

TA

L M

ICR

OC

YST

IN ( µ

g/L

)

0.01

0.1

1

10

100

1,000

10,000

100,000

1,000,000MILFORD LAKEREPUBLICAN RIVER

ANALYTICAL METHOD DETECTION LIMIT

KDHE GUIDELINE FOR PUBLIC HEALTH WARNING

WHO PROVISIONAL DRINKING-WATER GUIDELINE

Microcystins were Detected in the Republican River, Downstream from Milford Lake, from September 2-November 7, 2011

Where Did the Microcystin in Milford Lake Go?

Milford Lake 9/26/2011

618,030 cells/mL 50,400 cells/mL

4,095 cells/mL

1,575 cells/mL

16,065 cells/mL

• Redistribution

• “Bathtub Ring”

• Degradation

Total Microcystin Loads from Milford Lake Ranged from About 0.1 to 30 Kilograms Per Day.

September-October 20119/2 9/8 9/12 9/20 9/26 10/3 10/11 10/17 10/24 10/31

TO

TA

L M

ICR

OC

YST

IN L

OA

D (K

G/D

)

0

5

10

15

20

25

30

35

270,000 acre-feet released

Microcystins were Detected at All Kansas River Main-Stem Sites and Persisted from September 8-October 5, 2011

ANALYTICAL METHOD DETECTION LIMIT

SEPTEMBER-OCTOBER 201109/01 09/08 09/15 09/22 09/29 10/06 10/13 10/20 10/27

TO

TA

L M

ICR

OC

YST

IN (

g/L

)

0

1

2

3

4

5

6

7

8

FT. RILEYMANHATTANWAMEGOBELVUETOPEKALECOMPTONLAWRENCEDESOTOI-435

REPUBLICAN RIVER

ANALYTICAL METHOD DETECTION LIMIT

WHO PROVISIONAL DRINKING-WATER GUIDELINE

MICROCYSTINS WERE NOT DETECTED IN FINISHED DRINKING-WATER SAMPLES COLLECTED ON 9/8 AND 9/22

Longitudinal Patterns in Total Microcystin Concentration Suggest Simple Dilution Models Are Not Sufficient to

Describe Transport in the Kansas River

OCTOBER 3, 2011

DISTANCE UPSTREAM FROM CONFLUENCE WITH MISSOURI RIVER, IN MILES

020406080100120140160180

0.0

0.2

0.4

0.6

0.8

1.0

WA

KA

RU

SA

DEL

AW

AR

E

BIG

BLU

E

REP

UBL

ICA

N

SMO

KY

HIL

LANALYTICAL DETECTION THRESHOLD

SEPTEMBER 8, 2011

020406080100120140160180

TOTA

L M

ICR

OC

YST

IN ( µ

g/L)

0

1

2

3

4

5

6

TRIBUTARY CONCENTRATIONMAIN-STEM CONCENTRATONESTIMATED CONCENTRATION

WA

KA

RU

SA

DEL

AW

AR

E

BIG

BLU

E

REP

UBL

ICA

NSM

OK

Y H

ILL

ANALYTICAL DETECTION THRESHOLD

WHO PROVISIONAL DRINKING-WATER GUIDELINE

Taste and Odor Compounds Were Detected in All Reservoir Outflows and Main-Stem Kansas River Study Sites

SEPTEMBER-OCTOBER 201109

/01

09/08

09/15

09/22

09/29

10/06

10/13

10/20

10/27

0

10

20

30

40

50FT. RILEYMANHATTANWAMEGOBELVUETOPEKALECOMPTONLAWRENCEDESOTOI-435

09/01

09/08

09/15

09/22

09/29

10/06

10/13

10/20

10/27

TO

TA

L G

EO

SMIN

(NG

/L)

0

10

20

30

40

50SMOKY HILLREPUBLICAN (MILFORD)BIG BLUE (TUTTLE)DELAWARE (PERRY)WAKARUSA (CLINTON)

HUMAN DETECTION THRESHOLD

ANALYTICAL METHOD DETECTION LIMIT

SEPTEMBER-OCTOBER 201109

/01

09/08

09/15

09/22

09/29

10/06

10/13

10/20

10/27

0

10

20

30

40

50FT. RILEYMANHATTANWAMEGOBELVUETOPEKALECOMPTONLAWRENCEDE SOTOI-435

09/01

09/08

09/15

09/22

09/29

10/06

10/13

10/20

10/27

0

10

20

30

40

50SMOKY HILLREPUBLICAN (MILFORD)BIG BLUE (TUTTLE)DELAWARE (PERRY)WAKARUSA (CLINTON)

ANALYTICAL METHOD DETECTION LIMIT

HUMAN DETECTION THRESHOLD

HUMAN DETECTION THRESHOLD

ANALYTICAL METHOD DETECTION LIMIT

TO

TA

L M

IB (N

G/L

)ANALYTICAL METHOD DETECTION LIMIT

HUMAN DETECTION THRESHOLD

GEOSMIN MIB OUTFLOWS OUTFLOWS

MAIN-STEM SITES MAIN-STEM SITES

Longitudinal Patterns in Taste-and-Odor Concentrations Suggest Simple Dilution Models Are Not Sufficient to

Describe Transport in the Kansas River

DISTANCE UPSTREAM FROM CONFLUENCE WITH MISSOURI RIVER, IN MILES

020406080100120140160180

TO

TA

L M

IB (N

G/L

)0

5

10

15

20

25

30

WA

KA

RU

SA

DEL

AW

AR

E

BIG

BLU

E

REP

UBL

ICA

N

SMO

KY

HIL

L

ANALYTICAL DETECTION THRESHOLD

SEPTEMBER 8, 2011

020406080100120140160180

TO

TA

L G

EO

SMIN

(NG

/L)

0

2

4

6

8

10

12

14

TRIBUTARY CONCENTRATIONMAIN-STEM CONCENTRATIONESTIMATED CONCENTRATION

WA

KA

RU

SA

DEL

AW

AR

E

BIG

BLU

E

REP

UBL

ICA

NSM

OK

Y H

ILL

ANALYTICAL DETECTION THRESHOLD

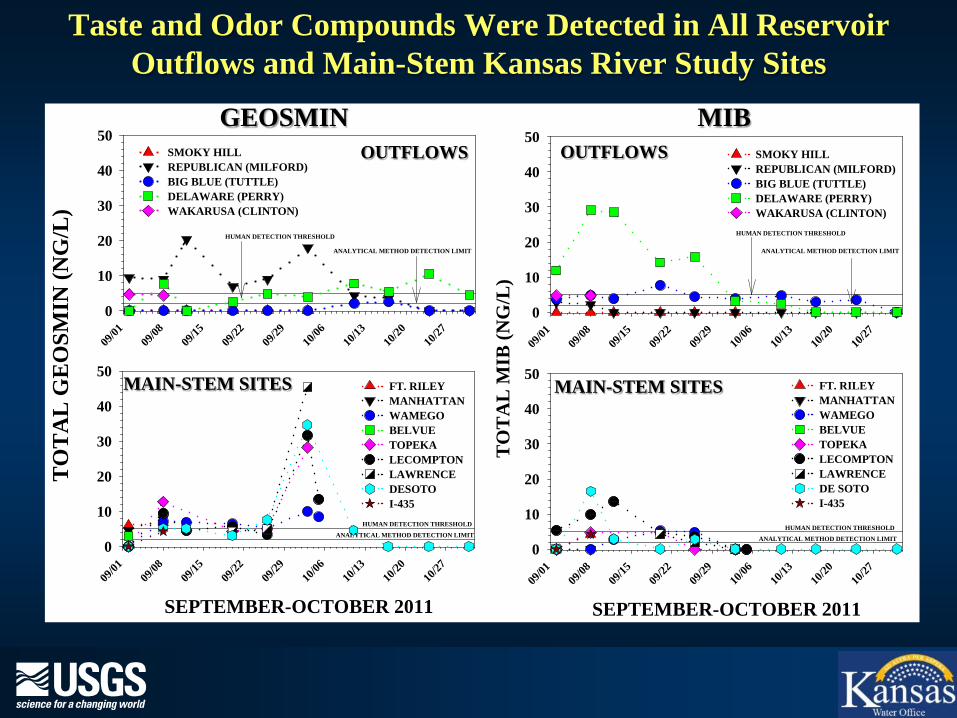
Taste-and-Odor Compounds and Microcystin Co-Occurred in 56% of the Samples Collected During September-October 2011

• 80% of samples had detectable taste-and-odor compounds (n=80). – 68% had detectable

geosmin – 46% had detectable

MIB

• 61% of samples had detectable microcystin (n=95)

Summary and Conclusions

• Microcystins persisted in the environment long enough to be transported over 170 miles within one week following the release of stored flood waters.

• Reservoir concentrations of cyanobacteria and associated compounds are not necessarily indicative of outflow conditions.

• Spatial and temporal patterns were unique for each individual compound, but co-occurrence was relatively common.

• Real-time water-quality monitoring and routine sample collection at multiple locations is critical to characterizing the spatial and temporal variability of these compounds in the Kansas River.

Kansas River at De Soto, August 2012

5 Year Study in the Kansas River - Objectives

• Characterize sources,

frequency of occurrence, and potential causes of cyanobacteria and associated compounds in the Kansas River.

• Develop models to provide real-time estimates for a number of constituents, including cyanotoxins and taste-and-odor compounds.

Kansas River at Wamego, August 2012

Kansas River at De Soto, August 2012

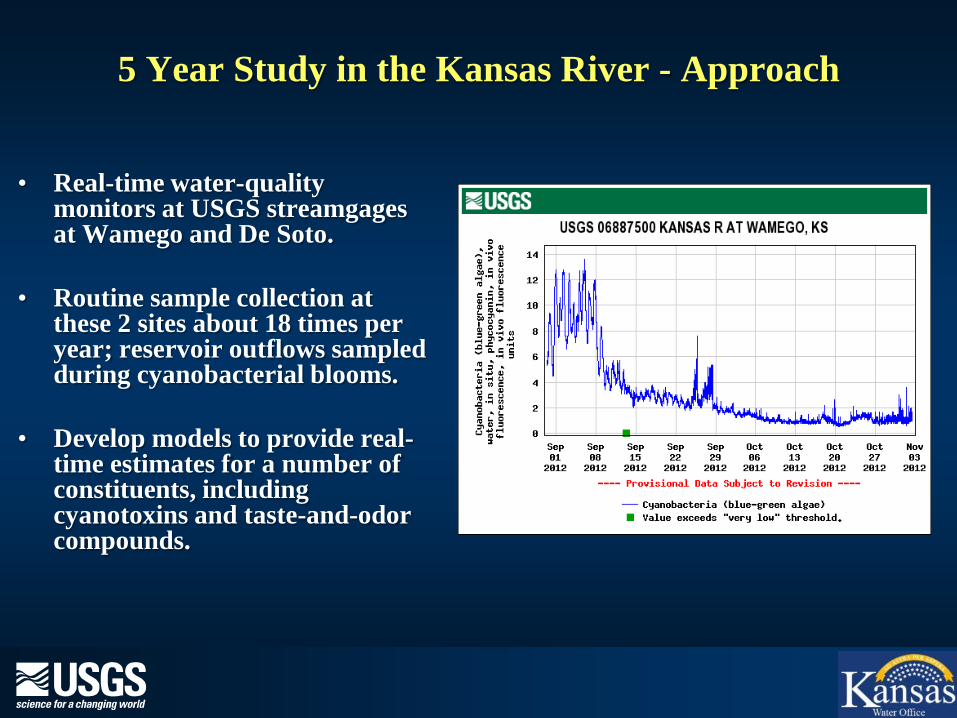
5 Year Study in the Kansas River - Approach

• Real-time water-quality

monitors at USGS streamgages at Wamego and De Soto.

• Routine sample collection at these 2 sites about 18 times per year; reservoir outflows sampled during cyanobacterial blooms.

• Develop models to provide real-time estimates for a number of constituents, including cyanotoxins and taste-and-odor compounds.

Water-Quality Monitors Were Operated at the Wamego and De Soto Sites on the Kansas River from

July 1999-December 2005

After Rasmussen and others, 2005 http://pubs.usgs.gov/sir/2005/5165/

http://nrtwq.usgs.gov/ks/

Kansas River at Wamego

Continuous Water-Quality Monitors Can Be Used to Develop Models to Compute Geosmin Concentrations in Real Time

http://nrtwq.usgs.gov/ks/

Cheney Reservoir, KS

Within Model Limits Geosmin Concentrations Are More Likely to Be Overestimated than Underestimated

After Christensen and others, 2006 http://pubs.usgs.gov/sir/2006/5095/

http://pubs.usgs.gov/sir/2012/5129/

[email protected] 785-832-3511

Kansas Water Science Center http://ks.water.usgs.gov/

Cyanobacteria http://ks.water.usgs.gov/studies/qw/cyanobacteria/

Kansas River Studies http://ks.water.usgs.gov/studies/KSR.ammonia/

Cheney Reservoir Studies http://ks.water.usgs.gov/studies/qw/cheney/

National Real-Time Water-Quality http://nrtwq.usgs.gov/

National Water Information System http://waterdata.usgs.gov/nwis


Recommended