FINAL REPORT Demonstration of Simplified Field Test Methods for the Measurement of Diesel Particulate Matter (PM) from Military Diesel Engines ESTCP Project WP-200404 TR-2340-ENV JULY 2008 Wayne Miller, Ph.D. William Welch University of California
Transcript
FINAL REPORT Demonstration of Simplified Field Test Methods for the
Measurement of Diesel Particulate Matter (PM) from Military Diesel Engines
ESTCP Project WP-200404 TR-2340-ENV
JULY 2008
Wayne Miller, Ph.D. William Welch University of California
v
REPORT DOCUMENTATION PAGE Form Approved
OMB No. 0704-0188 Public reporting burden for this collection of information is estimated to average 1 hour per response, including the time for reviewing instructions, searching existing data sources, gathering and maintaining the data needed, and completing and reviewing this collection of information. Send comments regarding this burden estimate or any other aspect of this collection of information, including suggestions for reducing this burden to Department of Defense, Washington Headquarters Services, Directorate for Information Operations and Reports (0704-0188), 1215 Jefferson Davis Highway, Suite 1204, Arlington, VA 22202-4302. Respondents should be aware that notwithstanding any other provision of law, no person shall be subject to any penalty for failing to comply with a collection of information if it does not display a currently valid OMB control number. PLEASE DO NOT RETURN YOUR FORM TO THE ABOVE ADDRESS.
1. REPORT DATE (DD-MM-YYYY) 07-01-2008
2. REPORT TYPE
Technical Report3. DATES COVERED (From - To)
2008 4. TITLE AND SUBTITLE
Demonstration of Simplified Field Test Methods for the Measurement of Diesel Particulate Matter (PM) from Military Diesel Engines
5a. CONTRACT NUMBER
5b. GRANT NUMBER
5c. PROGRAM ELEMENT NUMBER
6. AUTHOR(S)
Wayne Miller, Ph.D. Mr. William Welch
5d. PROJECT NUMBER
5e. TASK NUMBER
5f. WORK UNIT NUMBER
7. PERFORMING ORGANIZATION NAME(S) AND ADDRESS(ES)
Naval Facilities Engineering Service Center (NAVFAC ESC) 1100 23rd Avenue Port Hueneme, CA 93043
8. PERFORMING ORGANIZATION REPORT NUMBER TR–2340-ENV
9. SPONSORING / MONITORING AGENCY NAME(S) AND ADDRESS(ES)
Environmental Securities Technology Certification Program 901 North Stuart Street, Suite 303 Arlington VA 22203
10. SPONSOR/MONITOR’S ACRONYM(S)
ESTCP 11. SPONSOR/MONITOR’S REPORT
NUMBER(S) WP-0404 Technical Report
12. DISTRIBUTION / AVAILABILITY STATEMENT Approved for Public release; Distribution Unlimited
13. SUPPLEMENTARY NOTES Material contained herein is made available for the purpose of peer review and discussion and does not necessarily reflect the views of the Department of the Navy or the Department of Defense. 14. ABSTRACT This report provides a comparison of the Particulate Material (PM) mass emissions measured by the federal reference method and two proposed simplified field test methods. These new methods were designed for measurements at low PM levels and to take advantage of knowledge gained from years of testing with the California Air Resources Board’s (CARB) Method 5 and new commercial electronic technology that offered the opportunity for instantaneous, filter-less PM mass measurements. Results indicated the PM mass from both methods was biased low but by the same percentage for all sources that have been compared to date. Thus the simplified field test methods did offer significant advantages for quickly learning more about the PM mass emissions from a source without the days of setup, days waiting for off-site lab analyses and associated costs. The new methods are faster and cheaper and provide the only alternative to accurately measuring emissions from the new diesel engines with very low levels of PM mass emissions.
15. SUBJECT TERMS
16. SECURITY CLASSIFICATION OF:
17. LIMITATION OF ABSTRACT
18. NUMBER OF PAGES
19a. NAME OF RESPONSIBLE PERSON
Bruce Holden a. REPORT
UNCLASSIFIED b. ABSTRACT UNCLASSIFIED
c. THIS PAGE
UNCLASSIFIED NONE 23
19b. TELEPHONE NUMBER (include area code) 805-982-6050
Standard Form 298 (Rev. 8-98)Prescribed by ANSI Std. Z39.1
EXECUTIVE SUMMARY The goals of the project were met in that a backup generator with a diesel engine meeting Tier 3 certification levels was successfully tested and the emissions factors for gaseous emissions (CO, NOx+THC) and particulate matter (PM) emissions were below the Environmental Protection Agency (EPA) certification standards as seen in Table ES-1.
The primary goal was to compare the PM mass emissions measured by the federal reference method and two proposed simplified field test methods. These new methods were designed for measurements at low PM levels and to take advantage of knowledge gained from years of testing with the California Air Resources Board’s (CARB) Method 5 and new commercial electronic technology that offered the opportunity for instantaneous, filter-less PM mass measurements. A successful test would lead to significant cost saving in measuring PM emissions from diesel engines. Results indicated the PM mass from both methods was biased low but by the same percentage for all sources that have been compared to date. Thus, the simplified field test methods did offer significant advantages for quickly learning more about the PM mass emissions from a source without the days of setup, days waiting for off-site lab analyses and associated costs. The new methods are faster and cheaper and provide the only alternative to accurately measuring emissions from the new diesel engines with very low levels of PM mass emissions. Comparative results from this project are shown in Figure ES-1.
Figure ES-1.
Comparative PM Mass for Federal Reference Method (FRM) and Simplified Field Test Model (SFTM)
ix
TABLE OF CONTENTS
1.0 Introduction ................................................................................................................ 1 1.1 Background ................................................................................................................ 1 1.2 Measuring PM Emissions by Existing Reference Methods ....................................... 1 1.3 Measuring PM Emissions in the Field with New Methods ....................................... 2 1.3.1 Demonstration of a Simplified Filter Based Method ................................................. 2 1.3.2 Demonstration of Emerging Non-filter Based Equipment ........................................ 3 1.4 Project Objectives and Deliverables .......................................................................... 4 2.0 Test Methods .............................................................................................................. 4 2.1 Selection of Diesel Generator .................................................................................... 4 2.2 Emission Test Procedures .......................................................................................... 4 2.3 Measuring Emissions- Federal Reference Method .................................................... 5 2.4 Measurement of Particulate Mass (PM2.5) ............................................................... 7 2.5 Measuring Emissions- Demonstration of New Methods ........................................... 8 2.5.1 Proposed Simplified Field Test Method .................................................................... 8 2.5.2 Proposed Electronic Non-filter Based Method .......................................................... 9 2.6 Calculating the Emission Factors ............................................................................. 10 3.0 Results ........................................................................................................................ 10 3.1 Measuring Emissions with the Federal Reference Methods (FRM) .......................... 11 3.1.1 Modal Emission Factors ............................................................................................ 11 3.1.2 Overall Emission Factors ........................................................................................... 11 3.1.3 Comparing Results for the FRM AND THE Certification Valves ............................ 12 3.1.4 Speciation of the PM Mass into Elemental and Organic Carbon .............................. 12 3.2 Measuring PM Emission Factors with Simplified Field Test Method ...................... 14 3.2.1 Modal Emission Factors ............................................................................................ 14 3.2.2 Overall Emission Factors ........................................................................................... 15 3.3 Measuring PM Emission Factor with Electronic Non-filter Based Method .............. 16 4.0 Discussion .................................................................................................................. 16 4.1 Discussion of Results ................................................................................................. 16 4.1.1 Emissions from the Tier 3 Engine ............................................................................. 16 4.1.2 Demonstration of New Test Methods ........................................................................ 17 4.2 Implications ............................................................................................................... 17 5.0 Conclusions and Recommendations .......................................................................... 18 5.1 Conclusion ................................................................................................................. 18 5.2 Recommendations ...................................................................................................... 18 Appendix A ............................................................................................................................A-1 Appendix B ............................................................................................................................B-1 Appendix C ............................................................................................................................C-1 Appendix D ............................................................................................................................D-1
x
LIST OF TABLES Table 2-1 Information on Test Engine .......................................................................................4 Table 2-2 Test Cycle for Measuring Emissions from a Backup Generator ...............................5 Table 2-3 Summary of Gas-Phase Instrumentation in MEL ....................................................7 Table 3-1 Calculated Weighted Overall Emission Factors (g/kW-hr) ....................................12 Table 3-2 EPA Emission Factors for Certification ..................................................................12 Table 4-1 Comparative Emission Values for the Gen Set with a Tier -3 Diesel Engine as
Compared with Other Gen Sets on Military Facilities ......................................................17 Table 5-1 Emissions Values Meet EPA Certification Limits ..................................................18
LIST OF FIGURES Figure 1-1 Complex Sampling Train Required for EPA Method 5/202 or CARB Method 5 2 Figure 1-2 Comparative Data for PM Mass by Reference Method and CARB Method 5 ......3 Figure 2-1 Major Systems within UCR’s Mobile Emission Lab (MEL) ................................6 Figure 2-2 Schematic Design of the Simplified Field Test Method ........................................9 Figure 3-1 Modal Emission Factors for NOx and PM (g/kWhr) from FRM Test Methods 11 Figure 3-2 Modal Emissions Values for EC & OC ...............................................................13 Figure 3-3 Filter Mass: Teflon vs (EC+OC) ..........................................................................14 Figure 3-4 Comparative Raw FRM & SFTM PM Mass Modal Data ....................................14 Figure 3-5 Comparative FRM and Corrected SFTM PM Mass Modal Data .........................15 Figure 3-6 Plot Showing the Overall Agreement Between the FRM and the SFTM .............15 Figure 3-7 Plot of PM Mass Measured by the FRM and the Nephelometer ..........................16
xi
LIST OF ACRONYMS Al Aluminum BUG Backup generator ºC Degree centigrade C Carbon CARB California Air Resources Board CFO Critical Flow Orifice CFR Code of Federal Regulation cm Centimeter CO Carbon monoxide CO2 Carbon dioxide COV Coefficient of variation CVS Constant volume sampling DAF Dilution Air Filter DNPH 2,4Dinitrophenylhydrazine DT Dilution Tunnel EC Elemental Carbon EGA Exhaust Gas Analyzer EMFAC Emissions Factor EP Exhaust Pipe EPA Environmental Protection Agency Ft Feet FTIR Fourier Transform Infra-Red FRM Federal Reference Method F.S./day full scale per day g/kW-hr grams per kilowatt-hour HFO Heavy Fuel Oil Hz Hertz HCLD heated chemiluminesence detector HEPA High Efficiency Particulate Air H2O Water H2SO4.6.5H2O Hydrated sulfate or hydrated sulfuric acid IMO International Maritime Organization ISO International Organization for Standardization kg/m3 Kilograms per cubic-meter kW Kilowatt lit Liters lit/hr Liters per hour LLS Laser Light Scattering m Meter mm Millimeter MDO Marine Distillate Oil
xii
LIST OF ACRONYMS (continued)
MEL Mobile Emission Lab min Minutes MOUDI Micro-Orifice Uniform Deposit Impactor mm2/s Square-millimeter per second m/m Mass by mass NDIR Non-dispersive infra red (NH2)2CO Urea NH3 Ammonia NIOSH National Institute of Occupations Safety and Health NMHC Non-methane Hydrocarbons NO Nitrogen monoxide NOx Oxides of Nitrogen NO2 Nitrogen dioxide N2 Nitrogen OC Organic Carbon PM Particulate Matter PTFE Polytetrafluoroethylene or Teflon Filter ppm Parts per million ppmV Parts per million by volume psig Pound-force per square-inch gauge PUF Poly Urethane Foam/XAD QC/QA Quality Control/Quality Assurance RH Relative Humidity RPM Revolutions per minute SAO Smooth approach orifice scfm Standard cubic feet per minute SDEV Standard deviation SFTM Simplified Field Test Method SO2 Sulfur dioxide SO3 Sulfur trioxide SP Sampling Probe T Temperature TDL Tunable Diode Laser TDS Thermal Desorption System THC Total Hydrocarbons TT Transfer Tube UCR University of California, Riverside V Volts VN Venturi vol% volume % wt/wt% weight by weight %
1
1. INTRODUCTION 1.1 Background Over the years, diesel backup generators (BUGs) have proven to be the main source of emergency and mobile backup power for the military in many locations and applications due to their reliability, durability, affordability and overall efficiency. Thus, wherever reliable continuous power is essential, those sites select diesel backup generators. Surveys outside of military use indicate that 16 percent (%) of BUGs are located at medical facilities (mostly hospitals) and 29% were at government and utility sites—including city, county, and state government buildings and offices, prisons, police services, military facilities, municipal water districts, sanitation facilities, and municipal or public utility providers. The remaining BUGs are at commercial/industrial or telecommunications categories, including hotels, entertainment, manufacturing, electronics, financial, and insurance corporations, and communications entities. Data centers for banks are a prime example of a business that cannot shut down and needs to rely on reliable diesel power. In general, BUGs are used for reliable power. The main issue with diesel engines in California is that the California Air Resources Board (CARB) defined diesel exhaust as a Toxic Air Contaminant in 1998. Subsequently, CARB in 2000 began to write their Risk Reduction Plans and regulations to mitigate the emissions of diesel particulate matter (PM). In addition, the US EPA implemented in 1994, a set of phased-in regulations to control the emission of criteria pollutants from diesel off-road/non-road sources. The lowest emission level in the current regulation will reduce PM emissions by about 99% as compared to the uncontrolled levels. While very low PM emission levels are good for protecting human health, the very low levels create a problem in that traditional and existing PM measurement methods cannot measure these low PM levels. Thus, new measurement methods are needed. 1.2 Measuring PM Emissions by Existing Reference Methods In order to assure compliance with the EPA emission standards, the EPA has also specified the measurement methods. According to EPA, the most accurate and precise method of determining the mass concentration of gases and particulate matter (PM) from a diesel engine is to collect the entire volume of gas. This approach is used at the engine manufacturing sites for the certification of engines. However, this approach is not very practical when measuring emissions from field sources. Accordingly, "extractive" methods, which remove a small portion of the gas stream, were developed to sample representative portions of the gas stream to allow a measure of the gaseous and PM mass emission rates. The more common field methods for collecting and analyzing particulate emissions from stationary sources are found in Title 40 of the Code of Federal Regulations (CFR) and use a collection of equipment pieces, like shown in Figure 1-1.
2
Figure 1-1. Complex Sampling Train Required for EPA Method 5/202 or CARB Method 5
1.3 Measuring PM Emissions in the Field with New Methods The current stationary source test method, CARB Method 5, used for measuring diesel particulate matter (PM) in the field is slow, very costly to conduct, and requires considerable skill and experience to obtain accurate and precise results. CARB Method 5 samples raw exhaust at eight points while traversing across the exhaust conduit on two diameters that are perpendicular to each other. Samples at each engine point now take 20 minutes to collect and each point will take up to two hours for very low PM levels to measure. Given that each sample is repeated at least three times over the three to eight test modes, depending on the appropriate ISO test cycle, the full characterization and measurement will take days. Once the field-testing is completed, samples collected in the field are sent to an analytical laboratory where the current method requires separate weigh measurements of the filter and the condensable fraction. The additional measures can take weeks to get results. With this background, we doubt the current CARB Method 5 will be useful as the military goes to lower PM emissions in their equipment either through retrofit of control technology or purchases new equipment with factory installed control technology. 1.3.1 Demonstration of a Simplified Filter Based Method The demonstration of new technology is proposed for this project. The first demonstration relies on an observation of past work that indicated the front filter catch of the Method 5 equipment
3
yields a PM mass that is close to that of the reference methods. This conclusion was reached from a number of tests that compared the reference methods with CARB Method 5 components as seen in Figure 1-2 below. Thus, the demonstration of a concept based on this observation would be useful. To improve the ability of the filter media to measure the mass, we would replace the quartz filter with Teflon filter material in the upfront filter holder. Teflon will mitigate a problem as the quartz media is often stuck to the sealing o-ring in the filter holder when taking it apart and mass is lost.
Figure 1-2. Comparative Data for PM Mass by Reference Method and CARB Method 5
1.3.2 Demonstration of Emerging Non-filter Based Equipment The second demonstration is based on emerging technology, especially emerging non-filter based methods such as Laser Light Scattering (LLS) Technologies, which may provide simple PM screening methods to identify gross emitters, equipment failures, and in general, equipment that is out of compliance. This demonstration was designed to investigate and test promising emerging PM sampling methods and to correlate those methods with existing reference methods. The demonstration will select promising technology for field applications and propose substitutes for the current filter-based methods used to quantify PM emissions from diesel engines. For example, the LLS technology has shown excellent correlation to CFR reference methods in a recent Australian research project. The LLS is reported to be relatively less
4
expensive, shows strong correlation with filter methods, and is more robust in field-testing than the other emerging technologies they evaluated 1.4 Project Objectives and Deliverables Based on the background information that the military needs to monitor PM mass emissions and that the low PM levels in newer diesel engines are difficult to measure, then the objectives for this project are to demonstrate new test methods for measuring PM mass that are faster, cheaper, and as accurate. Upon completion of the demonstration program, the University of California, Riverside (UCR) will deliver:
1. Testing in duplicate following recognized standard test conditions of diesel engines. 2. A report with the following information:
Emissions factors for gaseous emissions (CO, CO2, NOx, THC) and particulate emissions (PM) based on federal reference methods.
PM emission factors based on UCR’s proposal to CARB for a Simplified Field Test Method (SFTM).
Results from an electronic, non-filter/mass based method.
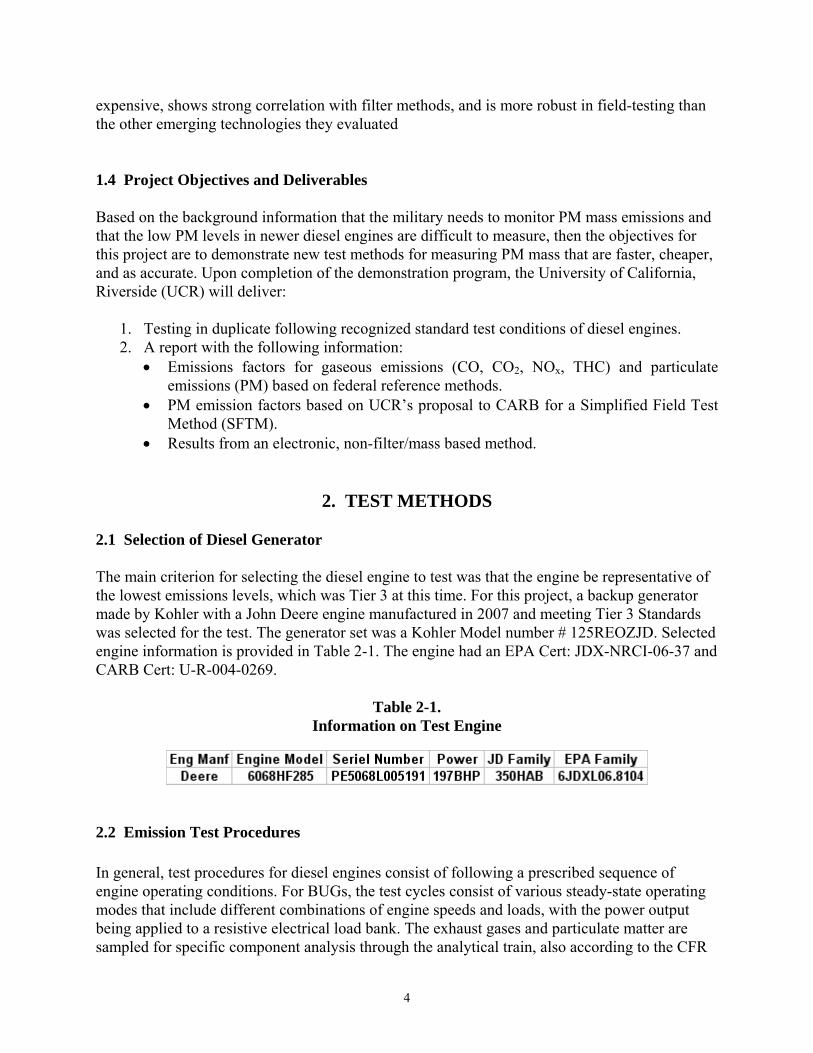
2. TEST METHODS 2.1 Selection of Diesel Generator The main criterion for selecting the diesel engine to test was that the engine be representative of the lowest emissions levels, which was Tier 3 at this time. For this project, a backup generator made by Kohler with a John Deere engine manufactured in 2007 and meeting Tier 3 Standards was selected for the test. The generator set was a Kohler Model number # 125REOZJD. Selected engine information is provided in Table 2-1. The engine had an EPA Cert: JDX-NRCI-06-37 and CARB Cert: U-R-004-0269.
Table 2-1. Information on Test Engine
2.2 Emission Test Procedures In general, test procedures for diesel engines consist of following a prescribed sequence of engine operating conditions. For BUGs, the test cycles consist of various steady-state operating modes that include different combinations of engine speeds and loads, with the power output being applied to a resistive electrical load bank. The exhaust gases and particulate matter are sampled for specific component analysis through the analytical train, also according to the CFR
5
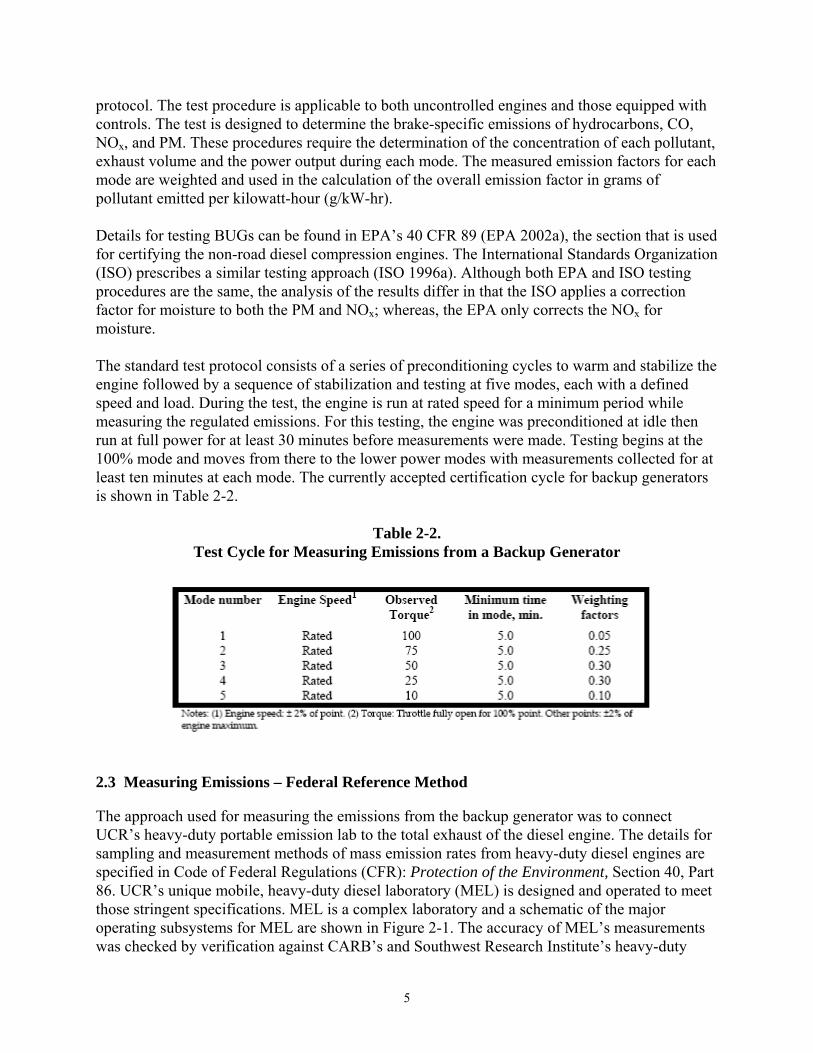
protocol. The test procedure is applicable to both uncontrolled engines and those equipped with controls. The test is designed to determine the brake-specific emissions of hydrocarbons, CO, NOx, and PM. These procedures require the determination of the concentration of each pollutant, exhaust volume and the power output during each mode. The measured emission factors for each mode are weighted and used in the calculation of the overall emission factor in grams of pollutant emitted per kilowatt-hour (g/kW-hr). Details for testing BUGs can be found in EPA’s 40 CFR 89 (EPA 2002a), the section that is used for certifying the non-road diesel compression engines. The International Standards Organization (ISO) prescribes a similar testing approach (ISO 1996a). Although both EPA and ISO testing procedures are the same, the analysis of the results differ in that the ISO applies a correction factor for moisture to both the PM and NOx; whereas, the EPA only corrects the NOx for moisture. The standard test protocol consists of a series of preconditioning cycles to warm and stabilize the engine followed by a sequence of stabilization and testing at five modes, each with a defined speed and load. During the test, the engine is run at rated speed for a minimum period while measuring the regulated emissions. For this testing, the engine was preconditioned at idle then run at full power for at least 30 minutes before measurements were made. Testing begins at the 100% mode and moves from there to the lower power modes with measurements collected for at least ten minutes at each mode. The currently accepted certification cycle for backup generators is shown in Table 2-2.
Table 2-2. Test Cycle for Measuring Emissions from a Backup Generator
2.3 Measuring Emissions – Federal Reference Method The approach used for measuring the emissions from the backup generator was to connect UCR’s heavy-duty portable emission lab to the total exhaust of the diesel engine. The details for sampling and measurement methods of mass emission rates from heavy-duty diesel engines are specified in Code of Federal Regulations (CFR): Protection of the Environment, Section 40, Part 86. UCR’s unique mobile, heavy-duty diesel laboratory (MEL) is designed and operated to meet those stringent specifications. MEL is a complex laboratory and a schematic of the major operating subsystems for MEL are shown in Figure 2-1. The accuracy of MEL’s measurements was checked by verification against CARB’s and Southwest Research Institute’s heavy-duty
6
diesel laboratories. MEL routinely measures a wide range of speciated and particulate emissions from diesel engines. Design capabilities and details of MEL are described in Cocker1 and additional information is provided in Appendix A.
Major Systems within UCR’s Mobile Emission Lab (MEL) The total exhaust gases from the diesel engine entered the primary tunnel in the mobile emission lab where it was diluted with filtered ambient air. The primary dilution system is configured as a full-flow constant volume sampling (CVS) system with a smooth approach orifice (SAO) Venturi and dynamic flow controller. The SAO Venturi has the advantage of no moving parts and repeatable accuracy at high throughput with low-pressure drop. As opposed to traditional dilution tunnels with a positive displacement pump or a critical flow orifice, the SAO system with dynamic flow control eliminates the need for a heat exchanger. Tunnel flow rate is adjustable from 1,000 to 4,000 scfm with accuracy of 0.5% of full scale. It is capable of total exhaust capture for engines up to 600kW. Colorado Engineering Experiment Station, Inc. initially calibrated the flow rate through both SAOs used in the primary tunnel. The mobile laboratory contains a suite of gas-phase analyzers on shock-mounted benches. The gas-phase analytical instruments measure NOx, methane (CH4), total hydrocarbons (THC), carbon monoxide (CO), and carbon dioxide (CO2) at a frequency of 10 Hz and were selected based on optimum response time and on road stability. The 200-L Tedlar bags are used to collect
1 Cocker III, D. R., Shah, S., Johnson, K., Miller, J. W., NOrbeck, J., Development and Application of a Mobile Laboratory for Measuring Emissions from Diesel Engines. I Regulated Gaseous Emissions, Environ. Sci. TechNOl.,2004, 38,2182-2189
7
tunnel and dilution air samples over a complete test cycle. In the lab design eight bags were suspended in the MEL allowing four test cycles to be performed between analyses. Filling of the bags is automated with Lab View 7.0 software (National Instruments, Austin, TX). A summary of the analytical instrumentation used, their ranges, and principles of operation is provided in Table 2-3. Each modal analyzer is time-corrected for tunnel, sample line, and analyzer delay time.
Table 2-3. Summary of Gas-Phase Instrumentation in MEL
Gas Component Range Monitoring MethodNOx 10/30/100/300/1000 (ppm) Chemiluminescence CO 50/200/1000/3000 (ppm) NDIR CO2 0.5/2/8/16 (%) NDIR THC 10/30/100/300/1000 & 5000 (ppmC) Heated FID CH4 30/100/300/1000 (ppmC) FID
Thus, during the testing of the rubber tire gantry crane we measured exhaust flow and concentrations of carbon monoxide (CO), carbon dioxide (CO2), oxides of nitrogen (NOx) and total hydrocarbons (THC). Gas phase samples were extracted and the diluted samples are analyzed second by second (modal data). For the pilot test we did not sample the engine exhaust into sample bags over defined phases of the test cycles and later analyze the integrated data. 2.4 Measurement of Particulate Mass (PM2.5) In addition to the gaseous emissions, the project measured the cumulative particulate matter (PM) mass emission rates while following the certification cycles. PM emissions mainly originate due to the incomplete combustion of fuel and lubricating oil and from the condensation of sulfate and hydrocarbon aerosols. Particle samples were extracted from the primary dilution tunnel, diluted further in a secondary dilution system, and collected on Teflon filters for determining the PM mass. The temperature of the air and filter in the filter collection system is controlled as specified in the CFR. Detailed information about the design and capability of MEL for sampling and measuring PM and toxics is available in Cocker2. UCR collected Teflon filters at each operating mode and analyzed them according to standard procedures. Teflon (Teflo) filters used to acquire PM mass were weighted following the procedure of the Code of Federal Regulations (CFR) (40 CFR Part 86). Briefly, total PM were collected on Pall Gelman (Ann Arbor, MI) 47 mm Teflo filters and weighed using a Cahn (Madison, WI) C-35 microbalance. Before and after collection, the filters were conditioned for
2 Cocker, D.R.; Shah, S.D.; Johnson, K.J.; Zhu, X; Miller, J.W.; Norbeck, J.M., Development and Application of a Mobile Laboratory for Measuring Emissions from Diesel Engines. 2. Sampling for Toxics and Particulate Matter, Environ. Sci. & Technol, 2004, 38, 6809-6816.
8
24 hours in an environmentally controlled room (RH=40%, T=25 C) and weighed daily until two consecutive weight measurements were within 3 µg. Pall Gelman (Ann Arbor, MI) 47 mm Tissuquartz™ fiber filters were used to collect PM for elemental carbon (EC) and organic carbon (OC) analysis. Each quartz filter was pretreated in a furnace at 600C for 5 hours and stored in a separate sealed petri dish at 10C prior to and after sampling. A Sunset Labs (Forest Grove, OR) Thermal/Optical Carbon Aerosol Analyzer analyzed a 1.5 cm2 quartz filter punch following NIOSH 5040 method. 2.5 Measuring Emissions – Demonstration of New Methods 2.5.1 Proposed Simplified Field Test Method Based on considerable prior work with the current CARB Method 5 (same as combination of EPA Method 5+ Method 202), we proposed the sampling system as shown in Figure 2-2. The apparatus consists of a probe in the exhaust and accumulating measurements at a single point to measure emissions. Such an approach would require only the weighting of a filter; there is no condensable PM fraction and associated laboratory work. The sampling time will be much shorter, even for engines with PM controls, as often as every 15 minutes is adequate to sample the diesel unit. Our aim is to develop a quick enforcement sampling system that local districts can afford. A conceptual design of the key elements is shown in Figure 2-2. Note that there is the possibility to miniaturize the components into a sample portable package. The silica gel removes moisture and protects the pump and dry gas meter.
9
Sample Insulated and/orProbe Heated Section
47 mm PTFE Filter
in SS Filter Holder
Temperature
Vacuum and VacuumTubing Gauges
Critical FlowSilica Gel (dessicant) Orifice (CFO) Vacuumor Peltier Chiller Pump
CI EngineExhaust
Figure 2-2.
Schematic Design of the Simplified Field Test Method 2.5.2 Proposed Electronic Non-Filter Based Method For this demonstration we proposed using a nephelometer as the non-filter based method to measure the PM mass. Nephelometers are fairly simple and compact instruments with excellent sensitivity and time resolution and measure light scattered by aerosol introduced into their sample chamber. However, scattering per unit mass is a strong function of particle size and refractive index. If particle size distributions and refractive indices in diesel exhaust strongly depend on the particular engine and operating condition, this may not be an effective way to measure exhaust particle mass. It has been shown that mass scattering efficiencies for both on-road diesel exhaust and ambient fine particles have values around 3m2/g. Mass scattering efficiencies for diesel exhaust sampled from a dilution tunnel may be significantly lower. For this project, a commercially available nephelometer (DT) measuring 90 degree light scattering at 780nm (near-infrared) was used. This instrument displays its measurement as mass density (i.e., units of mg/m3) through a calibration with ISO 12103-1, A1 test dust.
10
2.6 Calculating the Emission Factors Raw data from the testing were analyzed to develop emission rates and emission factors for the diesel engine that was tested. The CFR (EPA 2002c) provides details on how to treat raw data and convert it into useful emission rates and emission factors. A key factor in the final determination of the emission factor is the adjustments needed for the NOx and PM for moisture. A question arose as to whether to correct the PM for moisture, as required by the ISO requirements, or to leave the measured value unaltered, as specified in the CFR. Because UCR wanted the calculated values to be directly compared to those in the EPA’s AP 42 and manufacturer’s engine certification, researchers decided to follow the CFR method and not correct the PM for moisture. NOx was corrected for moisture as required by the CFR. The final reported overall weighted emission factor was computed by use of the following formula:
Where:
AWM = Weighted mass emission level (HC, CO, CO2, PM, or NOx) in g/kW-hr gi = Mass flow in grams per hour, Pi = Power measured during each mode, including auxiliary loads, and WFi = Effective weighing factor.
The above equation uses the output power at each mode and not the brake horsepower. However, the brake horsepower value is used to certify the engines. From UCR’s prior work, researchers could only estimate the brake horsepower that is the standard used to certify engines. Thus, the brake horsepower is probably about 3% to 5% higher than the value shown in this project’s raw data, based on power loses for the fan plus other auxiliaries, and another 3% to 5% higher, based on the losses associated with the generator where the engine output is converted into electrons. Hence overall, the emission factors from this work should probably be reduced by 6% to 10% to reflect the values measured on a brake horsepower basis when compared to the certification values. We report the power values on the basis of the power measured at the load bank.
3. RESULTS
Emissions were measured with the Federal Reference Methods (FRM), a proposed Simplified Test Method and an Electronic Non-Filter Method. Results from all three methods are present below.
11
3.1 Measuring Emissions with the Federal Reference Methods (FRM) 3.1.1 Modal Emission Factors Raw data are tabulated in Appendix B with calculations for the modal and overall weighted emission factors (EMFACs) for NOx, PM, CO, CO2 and THC. A plot of the modal emission factors for PM and NOx from the duplicate tests with the FRM is shown in Figure 3-1 below. Two features of the data were interesting. One was the shape of the PM emissions as a function of load. Normally the EMFACs for PM and NOx are rather constant over the range from 25 to 100% load. In this case, PM emission factor continued to decrease as the load was increased. Also for NOx the trend was different as the emission factor first decreased and then increased. Note the good repeatability of the test data is apparent in the calculated errors at one standard deviation on the chart.
Figure 3-1 Modal Emission Factors for NOx and PM (g/kWhr) from FRM Test Methods
3.1.2 Overall Emission Factors Overall emission factors were calculated for the data collected in the field with the FRM and with the equation provided earlier. As is evident in the data, confidence in the data is high, based on the standard deviation (SDEV) and the coefficient of variation (COV) being ~1 to 2% for all measured values. Values for NO2 are viewed as suspect since for this engine they were at the lower detection limit of the analytical equipment.
3.1.3 Comparing Results for the FRM and the Certification Values Using the federal reference methods to measure emissions and to calculate the overall emission factor allowed us to compare the values obtained from this work with the values required for certification. A comparison of the values in Figure 3-1 and Table 3-2 clearly show that the diesel engine easily met the certification values. For example, the PM level of 0.11 is well below the standard of 0.3 g/kW-hr. While the NOx + non-methane hydrocarbons (NMHC) level is close to the standard, recall the earlier discussion that the power in the EPA certification table is in brake horsepower and the values in Table 3-1 are calculated based on measured power, a value that is 5 to 10% less on a brake horsepower basis. Thus, the sum of NOx+NMHC would be 5 to 10% less than shown in Table 3-1.
3.1.4 Speciation of the PM Mass into Elemental and Organic Carbon Another dimension of interest is the speciation of the PM mass into elemental and organic carbon (EC/OC). These data allow an analysis of the mass into constituents that allow a comparison of Teflon and quartz mass and also allow one to predict the effectiveness of a Diesel
13
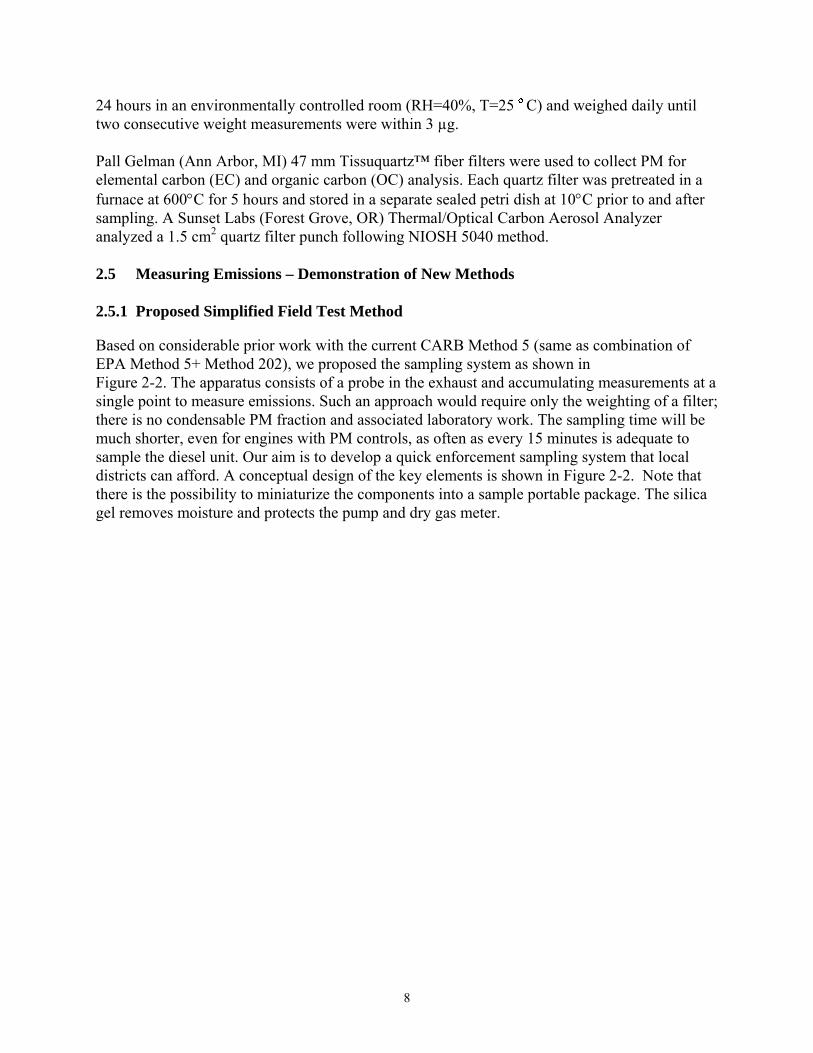
Oxidation Catalyst (DOC)3. Usually the conversion resulting from use of a DOC is about 65% of the OC and 10% of the EC. Raw data for the elemental and organic carbon are listed in Appendix C and adjusted for the mass rate in mg/cycle. Modal emissions values from Appendix A for the elemental and organic carbon are shown in Figure 3-2. As is evident the EC and OC rates decrease with power and close in value. It was surprising to see the OC value was as close to the EC value, suggesting there is additional opportunity for PM reduction with this engine if a DOC was attached.
Figure 3-2. Modal Emissions Values for EC & OC
Another indicator of the quality of the mass measurement is the comparison between the mass found on the Teflon filter and the mass measured on the quartz filter. As is evident in Figure 3-3, the mass balance between the two approaches indicates a good mass balance giving more confidence to the collection efficiency. Note that we have not accounted for the filter efficiency or the chemistry of the collected mass. For example, some organic carbon contains more oxygen and this must be accounted for in the comparison.
3 Shah SD, Cocker DR, Johnson KC, Lee JM Soriano BL Miller JW Reduction of Particulate Matter Emissions from Diesel Backup Generators Equipped With Four Different Exhaust Aftertreatment Devices Environmental Science & Technology 41 (14): 5070-5076 JUL 15 2007
0.00
0.10
0.15
0.20
0.25
10% 25% 50% 75% 100%
g/kW-
ECOC
14
Filter Mass in mg/cycle
y = 0.97x + 0.11R2 = 0.99
0.00
0.20
0.40
0.60
0.80
1.00
1.20
1.40
0.00 0.20 0.40 0.60 0.80 1.00 1.20Teflon Mass
EC+OC Mass
Figure 3-3. Filter Mass: Teflon vs. (EC+OC)
3.2 Measuring PM Emission Factors with Simplified Field Test Method 3.2.1 Modal Emission Factors The PM mass measured by the FRM and with the Simplified Field Test Method are provided in Appendix D and the modal data are illustrated in Figure 3-4. Results show the measured values with the SFTM were biased low; always lower than the FRM. The low bias is not surprising given that the Teflon filter in the SFTM is about 100°C and the filter in the FRM is about 50°C. The higher the temperature, the lower the mass collected on the Teflon filter since the semi-volatile organic compounds will go through the hot Teflon filter. However, earlier work in four other tests indicated that the low mass from the SFTM was the same fraction of the mass found on the Teflon filter collected at 50°C. This finding is illustrated in the correlation plotted in Appendix D. Applying the correction factor of Appendix D adjusted the raw data from this project and these adjusted data are plotted in Figure 3-5. Note the correction factor results in an overall improvement in the comparison.
Figure 3-4.
Comparative Raw FRM & SFTM PM Mass Modal Data
15
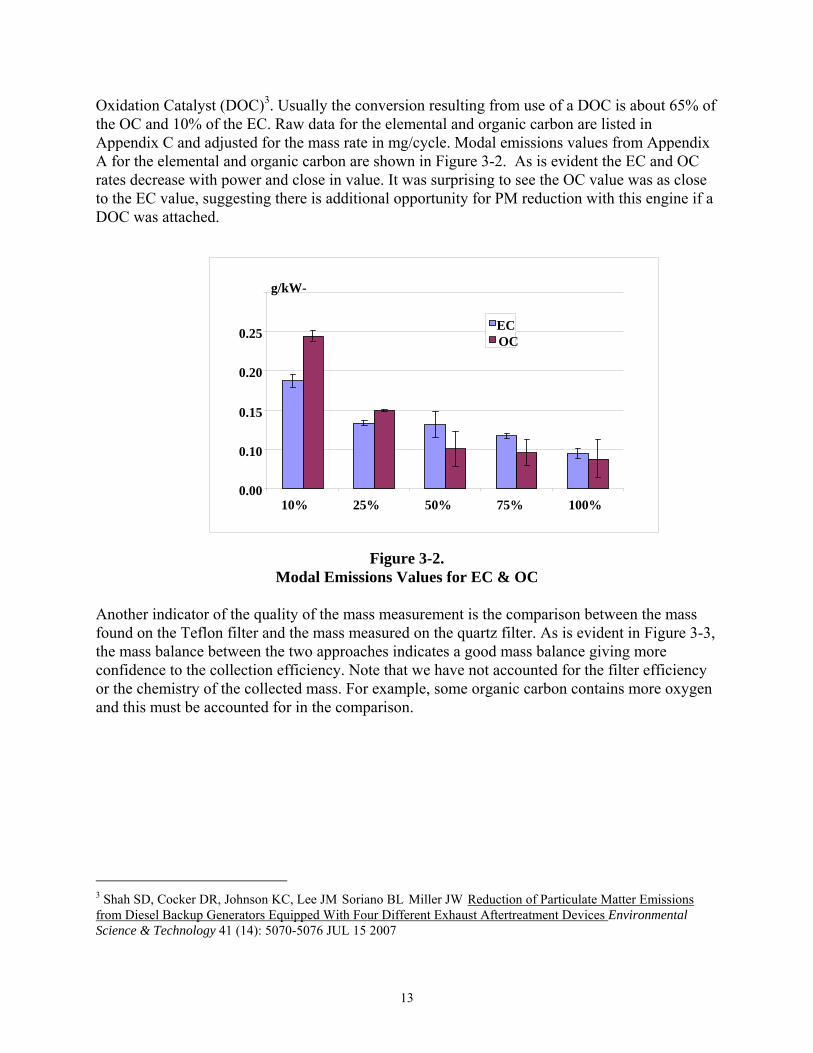
Figure 3-5. Comparative FRM and Corrected SFTM PM Mass Modal Data
3.2.2 Overall Emission Factors In addition to the modal data, another way to view the results is a parity plot of the PM mass measured by the federal reference method and the simplified field test method. Figure 3-6 shows the overall agreement between the two methods after the outlier was removed from the data. In Figure 3-6 the coefficient of determination was 97% and the bias through the origin was very small value.
Figure 3-6. Plot Showing the Overall Agreement Between the FRM and the SFTM
16
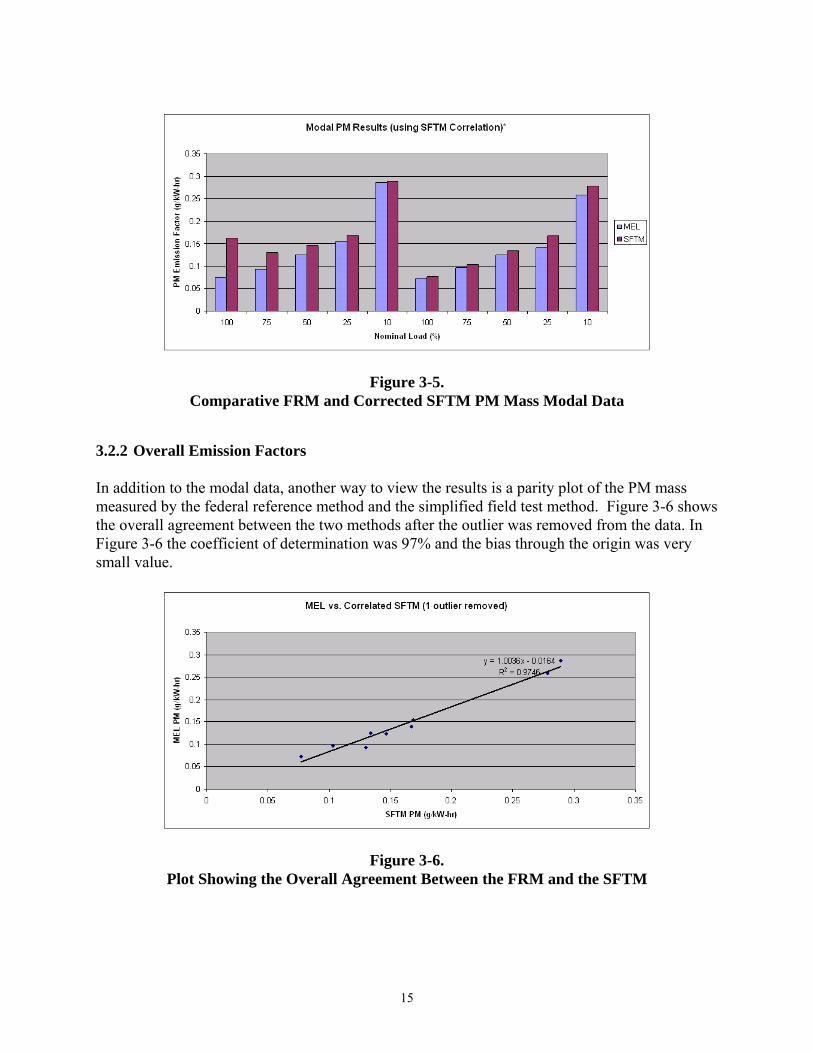
3.3 Measuring PM Emission Factor with Electronic Non-filter Based Method The final demonstration method was the use of a commercially available nephelometer. Results showing both the FRM and the nephelometer are plotted in Figure 3-7. Based on the coefficient of determination of 0.89, the fit is good for all data; however, the nephelometer is biased low, like the SFTM since the nephelometer does not count very large particles. Thus, a correction could be developed to use the nephelometer and quickly determine the PM mass in the field.
Figure 3-7.
Plot of PM Mass Measured by the FRM and the Nephelometer
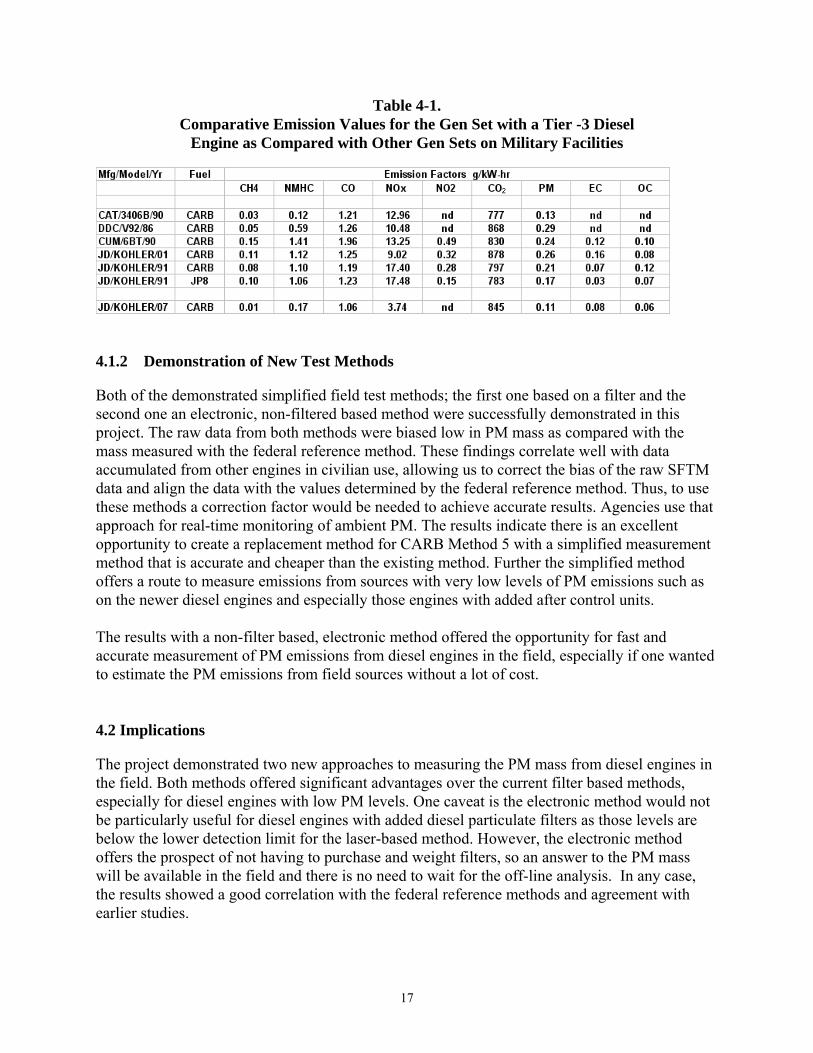
4. DISCUSSION 4.1 Discussion of Results 4.1.1 Emissions from the Tier 3 Engine One of the most useful findings is the emissions from the Tier 3 engine are well below the compliance standards required by the EPA and below the emissions from gen sets made with engines that were manufactured to a less restrictive standard. For example, as evident in Table 4-1, there are significant benefits in reduced NOx and PM emissions for the Tier 3 engine when compared with earlier data obtained from existing backup generators on military facilities. NOx is reduced up to 75% and PM is reduced up to 65% with the new Tier 3 diesel engine. The designation of CARB #2 fuel indicates the fuel meets CARB standards.
PM Mass (mg/cycle): TFE vs. Nephelometer
y = 0.67x + 0.01R2 = 0.89
0.00
0.10
0.20
0.30
0.40
0.50
0.60
0.70
0.80
0.00 0.20 0.40 0.60 0.80 1.00 1.20 Teflon Mass
Nephelometer
17
Table 4-1. Comparative Emission Values for the Gen Set with a Tier -3 Diesel
Engine as Compared with Other Gen Sets on Military Facilities
4.1.2 Demonstration of New Test Methods Both of the demonstrated simplified field test methods; the first one based on a filter and the second one an electronic, non-filtered based method were successfully demonstrated in this project. The raw data from both methods were biased low in PM mass as compared with the mass measured with the federal reference method. These findings correlate well with data accumulated from other engines in civilian use, allowing us to correct the bias of the raw SFTM data and align the data with the values determined by the federal reference method. Thus, to use these methods a correction factor would be needed to achieve accurate results. Agencies use that approach for real-time monitoring of ambient PM. The results indicate there is an excellent opportunity to create a replacement method for CARB Method 5 with a simplified measurement method that is accurate and cheaper than the existing method. Further the simplified method offers a route to measure emissions from sources with very low levels of PM emissions such as on the newer diesel engines and especially those engines with added after control units. The results with a non-filter based, electronic method offered the opportunity for fast and accurate measurement of PM emissions from diesel engines in the field, especially if one wanted to estimate the PM emissions from field sources without a lot of cost. 4.2 Implications The project demonstrated two new approaches to measuring the PM mass from diesel engines in the field. Both methods offered significant advantages over the current filter based methods, especially for diesel engines with low PM levels. One caveat is the electronic method would not be particularly useful for diesel engines with added diesel particulate filters as those levels are below the lower detection limit for the laser-based method. However, the electronic method offers the prospect of not having to purchase and weight filters, so an answer to the PM mass will be available in the field and there is no need to wait for the off-line analysis. In any case, the results showed a good correlation with the federal reference methods and agreement with earlier studies.
18
Comparative mass balances came out as expected for both Teflon methods and for the comparison between the quartz and the Teflon masses. Further examination is needed to learn if the parsing of the Teflon mass into the elemental and organic phases will allow a correlation coefficient to be developed from first principles. At present the correlation coefficient is empirical.
5. CONCLUSIONS AND RECOMMENDATIONS 5.1 Conclusion The goals of the project were met in that a backup generator with a diesel engine meeting Tier 3 certification levels was successfully tested and the emissions factors for gaseous emissions (CO, NOx+THC) and particulate emissions (PM) were below the EPA certification standards as seen in Table 5-1.
Tests were conducted to compare the PM mass emissions measured by the federal reference method and two proposed simplified field test methods. These methods were designed for measurements at low PM levels and to take advantage of knowledge gained from years of testing with CARB’s Method 5 and new commercial electronic technology that offered the opportunity for instantaneous, filter-less PM mass measurements. Results indicated the PM mass from both methods was biased low, but by the same percentage for all sources that have been compared to date. In any case, the simplified field test methods did offer significant advantages for quickly learning more about the PM mass emissions from a source without the days of setup and days waiting for off-site lab analyses. The new methods are faster and cheaper and provide the only alternative to measuring emissions from the new diesel engines with very low levels of PM mass emissions. 5.2 Recommendations The main recommendations are the continued testing of the filter-based simplified test method with other sources to learn if the correlation between the federal reference mass and the SFTM remains so that the raw data can be adjusted to provide accurate results. Furthermore, it would be helpful to analyze more results to learn if a mathematical approach can be used to develop the correlation between the two methods. In any case, the results are encouraging and, if successful, will lead to a replacement for the very expensive CARB Method 5. Presumably, each test on a
19
military site can be reduced by more than $25,000 per test based on the measurement of very low levels of PM mass.
A-1
APPENDIX A
CARB Verification of the Heavy-duty Diesel Mobile Laboratory
A-2
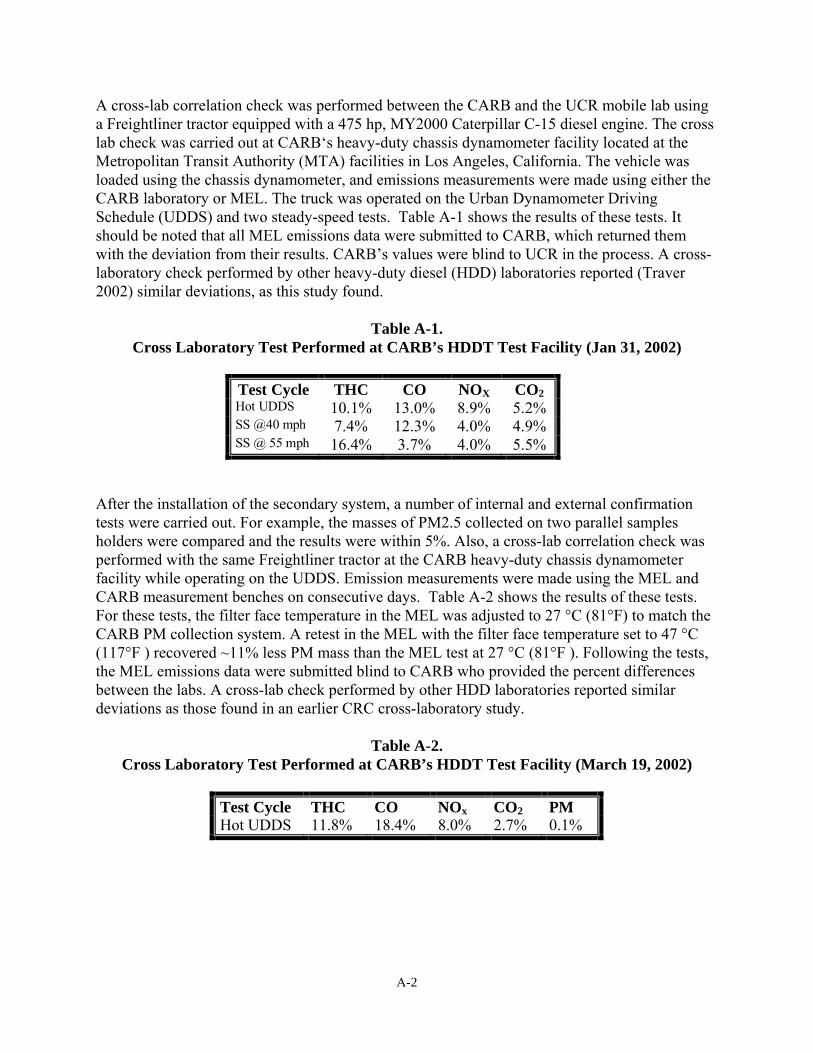
A cross-lab correlation check was performed between the CARB and the UCR mobile lab using a Freightliner tractor equipped with a 475 hp, MY2000 Caterpillar C-15 diesel engine. The cross lab check was carried out at CARB‘s heavy-duty chassis dynamometer facility located at the Metropolitan Transit Authority (MTA) facilities in Los Angeles, California. The vehicle was loaded using the chassis dynamometer, and emissions measurements were made using either the CARB laboratory or MEL. The truck was operated on the Urban Dynamometer Driving Schedule (UDDS) and two steady-speed tests. Table A-1 shows the results of these tests. It should be noted that all MEL emissions data were submitted to CARB, which returned them with the deviation from their results. CARB’s values were blind to UCR in the process. A cross-laboratory check performed by other heavy-duty diesel (HDD) laboratories reported (Traver 2002) similar deviations, as this study found.
Table A-1. Cross Laboratory Test Performed at CARB’s HDDT Test Facility (Jan 31, 2002)
Test Cycle THC CO NOX CO2 Hot UDDS 10.1% 13.0% 8.9% 5.2% SS @40 mph 7.4% 12.3% 4.0% 4.9% SS @ 55 mph 16.4% 3.7% 4.0% 5.5%
After the installation of the secondary system, a number of internal and external confirmation tests were carried out. For example, the masses of PM2.5 collected on two parallel samples holders were compared and the results were within 5%. Also, a cross-lab correlation check was performed with the same Freightliner tractor at the CARB heavy-duty chassis dynamometer facility while operating on the UDDS. Emission measurements were made using the MEL and CARB measurement benches on consecutive days. Table A-2 shows the results of these tests. For these tests, the filter face temperature in the MEL was adjusted to 27 °C (81°F) to match the CARB PM collection system. A retest in the MEL with the filter face temperature set to 47 °C (117°F ) recovered ~11% less PM mass than the MEL test at 27 °C (81°F ). Following the tests, the MEL emissions data were submitted blind to CARB who provided the percent differences between the labs. A cross-lab check performed by other HDD laboratories reported similar deviations as those found in an earlier CRC cross-laboratory study.
Table A-2. Cross Laboratory Test Performed at CARB’s HDDT Test Facility (March 19, 2002)
Test Cycle THC CO NOx CO2 PM Hot UDDS 11.8% 18.4% 8.0% 2.7% 0.1%
B-1
APPENDIX B
Raw Data from the Federal Reference Method
B-2
Emissions g/cycle Emissions mg/cycle File Name Trace Filter THC Ch4 NMHC CO NOx NO2 CO2 PM Nephe-