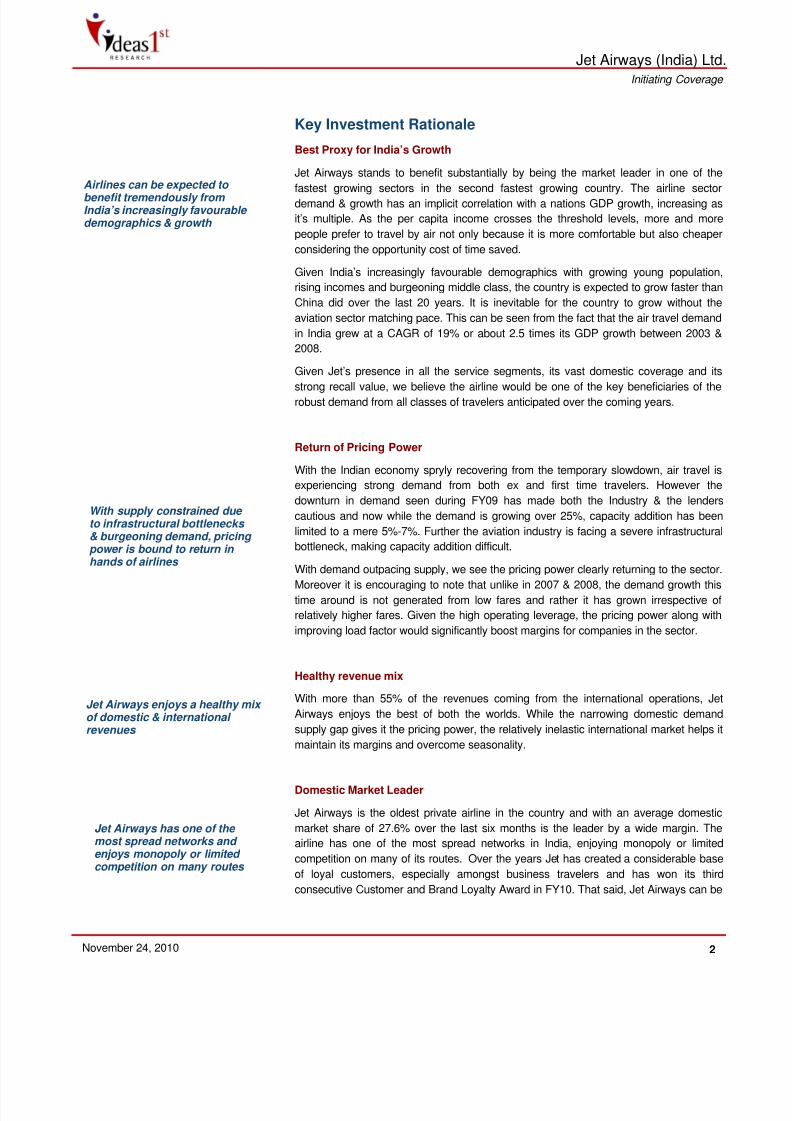
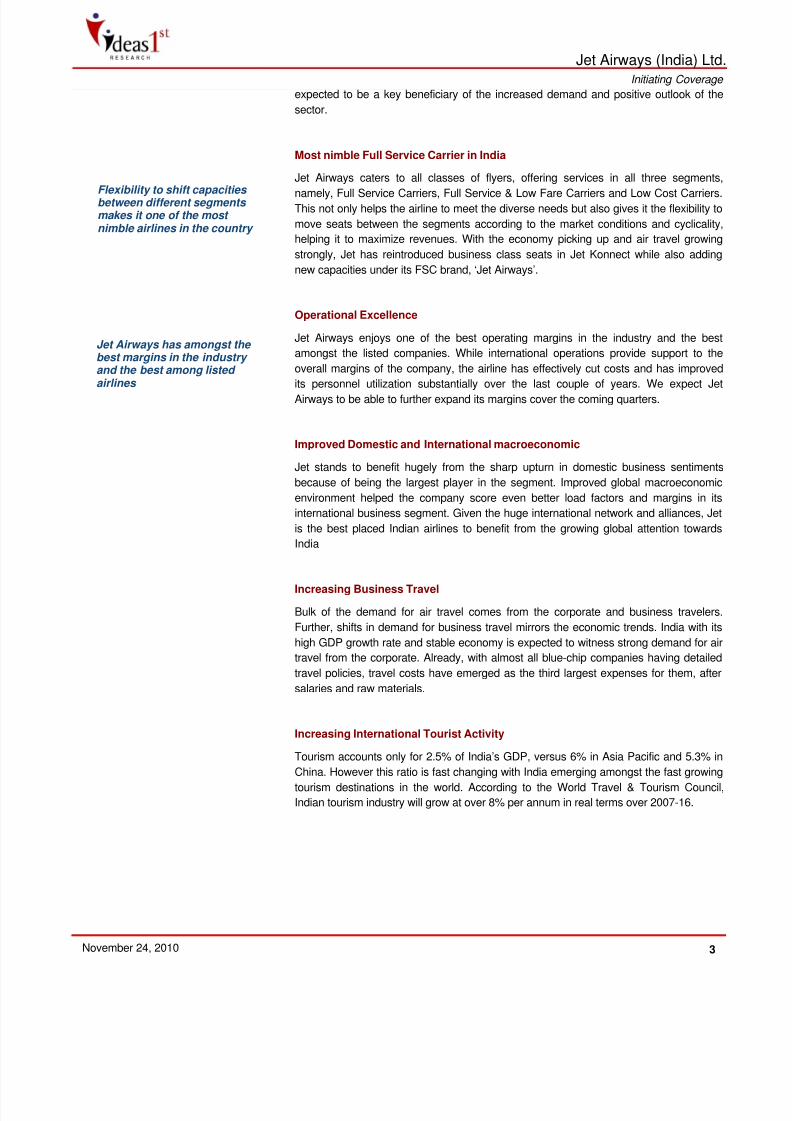
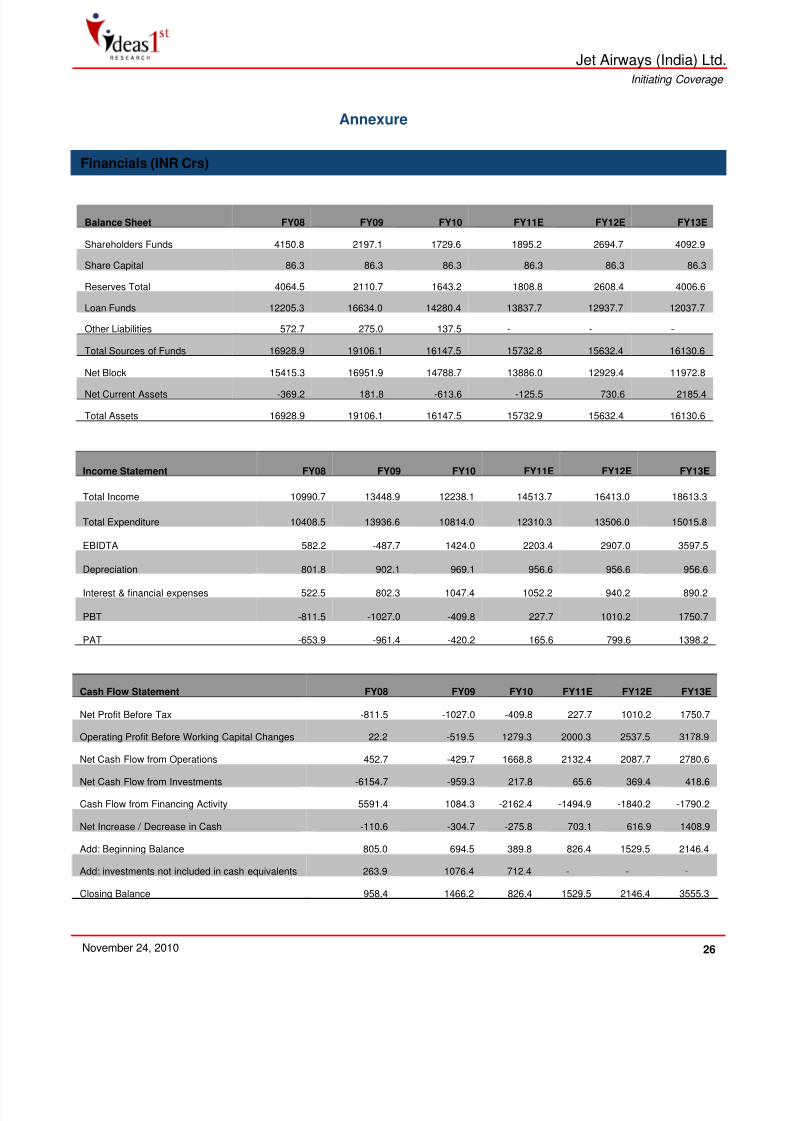
A Qualitative Equity Research Company 1 Analyst: Lovelesh Manocha [email protected]Anirudh Attal [email protected]Jet Airways (India) Ltd is India’s oldest private airline and the largest private Indian airline operating on both domestic and international routes. In the domestic segment, the company has an aggregate market share of 26.2% and offers services under three banners viz. Jet Airways, Jet Konnect and JetLite, erstwhile Air Sahara. The airline currently operates over 100 aircrafts, flying over 500 flights daily to about 67 destinations including 24 international destinations across US, Europe and Asia. Jet also extends its offerings through its vast code sharing relationships with international carriers. Given Jet’s market leadership and its strong fundamentals, we believe it to be a prime beneficiary of the strong growth expected in the sector over the coming years and recommend a Strong Buy on the stock. Investment Rationale: Jet Airways has one of the best operating margins in the industry and the best amongst the listed players. Further, being the leader in the domestic market and given its spread network, Jet Airways can be expected to be one of the key beneficiaries for the rapid air travel demand growth and could see its margins improve further with the return of pricing power in hands of the airlines. Jet, under its three different brands, caters to all segments of flyers and has the flexibility to switch capacities between segments to suit market conditions and maximize margins. Other positives include healthy mix of international & domestic revenues, strengthening of balance sheet and very low free float. Given the company’s strong fundamentals and the positive outlook for the sector, we feel that Jet Airways is a sure multi bagger and one of the best companies to invest in. Valuation: We have valued Jet Airways using weighted average EV/EBITDAR multiple of 8.3x at Rs.1,800, assigning equal weights to international and domestic industry multiples. We believe we have been conservative by not adding a premium to the multiple for being the market leader. Further our discounted cash flow analysis gives us a much higher fair value of Rs.2,335. Again we have been very conservative while using DCFs, considering a much higher cost of debt at 10% instead of the current average of less than 7%. Also while we expect the airline industry to record higher teens growth rates for the next two decades, we have considered only 12% growth for Jet for the first five years, followed by 8% for the next 10 years and only 3% thereafter. The company scores a 4 (out of 5) on our star matrix and has been assigned the low risk-high return rating. Jet Airways (India) Ltd.Initiating CoverageNovember 24, 2010Promoter 80 % FII 7% D II 10 % Others 3% Shareholding Pattern (%) Risk Return Matrix BSE NSE BLOOMBERG REUTERS 532617 JETAIRWAYS JETIN IN JET.BO CMP (INR) TARGET (INR) RATING 889 1,800 Return R i s k Return R i s k Face Value (INR) : 10 Book Value (INR) : 95.8 52 -week range (INR) : 926/401 M cap (INR Cr) : 7,649.7 3-mnth Avg. Daily Vol. : 2,93,531 Shares Outstanding Equity (Mn) : 86.3 Free Float (%) : 20 Market Data 0 50 100 150 200 250 300 Nov-09 Jan-10 Apr-10 Jun-10 Sep-10 Nov-10 Je t Airway s Ki ngf isher SpiceJet Se ns ex Relative Performance FY11E FY12E FY13E Revenue 14,513.69 16,413.01 18,613.35 EBITDA 2,203.36 2,906.97 3,597.50 PAT 165.59 799.55 1,398.20 EPS 19.18 92.61 161.95 P/E (x) 45.38 9.40 5.37 P/Sales (x) 0.52 0.46 0.40 EV/EBITDAR (x) 6.38 5.18 4.34 EV/Sales (x) 1.47 1.30 1.15 ROE (%) 9 35 41 ROCE (%) 8 12 17 Earnin Estimates INR Crs & Financial Ratios
Jet Airways (India) Ltd is India’s oldest private airline and the largest private
Indian airline operating on both domestic and international routes. In the
domestic segment, the company has an aggregate market share of 26.2%
and offers services under three banners viz. Jet Airways, Jet Konnect andJetLite, erstwhile Air Sahara. The airline currently operates over 100
aircrafts, flying over 500 flights daily to about 67 destinations including 24
international destinations across US, Europe and Asia. Jet also extends its
offerings through its vast code sharing relationships with international
carriers. Given Jet’s market leadership and its strong fundamentals, we
believe it to be a prime beneficiary of the strong growth expected in the
sector over the coming years and recommend a Strong Buy on the stock.
Investment Rationale:
Jet Airways has one of the best operating margins in the industry and the
best amongst the listed players. Further, being the leader in the domestic
market and given its spread network, Jet Airways can be expected to be one
of the key beneficiaries for the rapid air travel demand growth and could seeits margins improve further with the return of pricing power in hands of the
airlines. Jet, under its three different brands, caters to all segments of flyers
and has the flexibility to switch capacities between segments to suit market
conditions and maximize margins. Other positives include healthy mix of
international & domestic revenues, strengthening of balance sheet and very
low free float. Given the company’s strong fundamentals and the positive
outlook for the sector, we feel that Jet Airways is a sure multi bagger and
one of the best companies to invest in.
Valuation:
We have valued Jet Airways using weighted average EV/EBITDAR multiple
of 8.3x at Rs.1,800, assigning equal weights to international and domestic
industry multiples. We believe we have been conservative by not adding a
premium to the multiple for being the market leader. Further our discounted
cash flow analysis gives us a much higher fair value of Rs.2,335. Again we
have been very conservative while using DCFs, considering a much higher
cost of debt at 10% instead of the current average of less than 7%. Also
while we expect the airline industry to record higher teens growth rates for
the next two decades, we have considered only 12% growth for Jet for the
first five years, followed by 8% for the next 10 years and only 3% thereafter.
The company scores a 4 (out of 5) on our star matrix and has been
Jet Airways stands to benefit substantially by being the market leader in one of the
fastest growing sectors in the second fastest growing country. The airline sectordemand & growth has an implicit correlation with a nations GDP growth, increasing as
it’s multiple. As the per capita income crosses the threshold levels, more and more
people prefer to travel by air not only because it is more comfortable but also cheaper
considering the opportunity cost of time saved.
Given India’s increasingly favourable demographics with growing young population,
rising incomes and burgeoning middle class, the country is expected to grow faster than
China did over the last 20 years. It is inevitable for the country to grow without the
aviation sector matching pace. This can be seen from the fact that the air travel demand
in India grew at a CAGR of 19% or about 2.5 times its GDP growth between 2003 &
2008.
Given Jet’s presence in all the service segments, its vast domestic coverage and itsstrong recall value, we believe the airline would be one of the key beneficiaries of the
robust demand from all classes of travelers anticipated over the coming years.
Return of Pricing Power
With the Indian economy spryly recovering from the temporary slowdown, air travel is
experiencing strong demand from both ex and first time travelers. However the
downturn in demand seen during FY09 has made both the Industry & the lenders
cautious and now while the demand is growing over 25%, capacity addition has been
limited to a mere 5%-7%. Further the aviation industry is facing a severe infrastructural
bottleneck, making capacity addition difficult.
With demand outpacing supply, we see the pricing power clearly returning to the sector.
Moreover it is encouraging to note that unlike in 2007 & 2008, the demand growth this
time around is not generated from low fares and rather it has grown irrespective of
relatively higher fares. Given the high operating leverage, the pricing power along with
improving load factor would significantly boost margins for companies in the sector.
Healthy revenue mix
With more than 55% of the revenues coming from the international operations, Jet
Airways enjoys the best of both the worlds. While the narrowing domestic demand
supply gap gives it the pricing power, the relatively inelastic international market helps it
maintain its margins and overcome seasonality.
Domestic Market Leader
Jet Airways is the oldest private airline in the country and with an average domestic
market share of 27.6% over the last six months is the leader by a wide margin. The
airline has one of the most spread networks in India, enjoying monopoly or limited
competition on many of its routes. Over the years Jet has created a considerable base
of loyal customers, especially amongst business travelers and has won its third
consecutive Customer and Brand Loyalty Award in FY10. That said, Jet Airways can be
Airlines can be expected to benefit tremendously from India’s increasingly favourable demographics & growth
With supply constrained due to infrastructural bottlenecks & burgeoning demand, pricing power is bound to return in
hands of airlines
Jet Airways enjoys a healthy mix of domestic & international revenues
Jet Airways has one of the most spread networks and enjoys monopoly or limited competition on many routes
expected to be a key beneficiary of the increased demand and positive outlook of the
sector.
Most nimble Full Service Carrier in India
Jet Airways caters to all classes of flyers, offering services in all three segments,
namely, Full Service Carriers, Full Service & Low Fare Carriers and Low Cost Carriers.
This not only helps the airline to meet the diverse needs but also gives it the flexibility to
move seats between the segments according to the market conditions and cyclicality,
helping it to maximize revenues. With the economy picking up and air travel growing
strongly, Jet has reintroduced business class seats in Jet Konnect while also adding
new capacities under its FSC brand, ‘Jet Airways’.
Operational Excellence
Jet Airways enjoys one of the best operating margins in the industry and the best
amongst the listed companies. While international operations provide support to the
overall margins of the company, the airline has effectively cut costs and has improved
its personnel utilization substantially over the last couple of years. We expect Jet
Airways to be able to further expand its margins cover the coming quarters.
Improved Domestic and International macroeconomic
Jet stands to benefit hugely from the sharp upturn in domestic business sentiments
because of being the largest player in the segment. Improved global macroeconomic
environment helped the company score even better load factors and margins in its
international business segment. Given the huge international network and alliances, Jet
is the best placed Indian airlines to benefit from the growing global attention towards
India
Increasing Business Travel
Bulk of the demand for air travel comes from the corporate and business travelers.
Further, shifts in demand for business travel mirrors the economic trends. India with its
high GDP growth rate and stable economy is expected to witness strong demand for air
travel from the corporate. Already, with almost all blue-chip companies having detailed
travel policies, travel costs have emerged as the third largest expenses for them, after
salaries and raw materials.
Increasing International Tourist Activity
Tourism accounts only for 2.5% of India’s GDP, versus 6% in Asia Pacific and 5.3% inChina. However this ratio is fast changing with India emerging amongst the fast growing
tourism destinations in the world. According to the World Travel & Tourism Council,
Indian tourism industry will grow at over 8% per annum in real terms over 2007-16.
Flexibility to shift capacities between different segments makes it one of the most nimble airlines in the country
Jet Airways has amongst the best margins in the industry and the best among listed airlines
Airline is one of the few sectors perennially considered to be a bad investment by many
globally. In addition, given the limited players in this segment in India, it is one of the
least researched sectors. That’s why we believe that only a few have been able to
identify the potential that the sector offers. After a period of successive losses faced bythe industry, things seem to have turned around for good. With demand outpacing
supply, the pricing power has returned to the sector. Given the high operating leverage,
the pricing power along with improving load factor would significantly boost margins for
companies in the sector.
India’s huge market size, its booming economy, rising disposable income, huge & fast
growing middle class – almost the size of US and increasing business opportunities in
small towns, all make us confident about the demand for air travel.
However we believe the strong entry barriers like lack of easy access to capital and
infrastructure bottleneck would keep supply under check. The downturn in demand seen
during FY09 has made the industry wiser and now while the demand is growing over
25%, cautious outlook, both from the Industry & the lenders has limited capacityaddition to mere 5%-7%, a trend expected to continue for a few more years. The
industry is also facing a severe infrastructural bottleneck, especially for a few critical
airports, a concern voiced by the Civil Aviation Minister Praful Patel himself clearly
stating that we have almost come to a stage where no more flights in and out of Mumba
can be allowed. This would further aggravate demand supply growth mismatch resulting
in even higher load factors and air fares.
Because of the aforesaid reasons, we believe the Airline Industry has big surprises in
store for the hoary industry sceptics & would offer exceptional returns over medium
term.
Amongst the listed space, we find Jet Airways to be grossly undervalued. Given the
airlines strong domestic and international presence, considerable brand value and
customer loyalty, its vast network and operating efficiency, presence across all
customer segments and strong fundamentals makes us believe that the stock offers
The last decade has seen the Indian economy grow rapidly, with its GDP expanding at
a CAGR of 8.4% over 2003-2008. And it was during this rapid growth phase when the
Indian aviation sector has seen a new beginning.
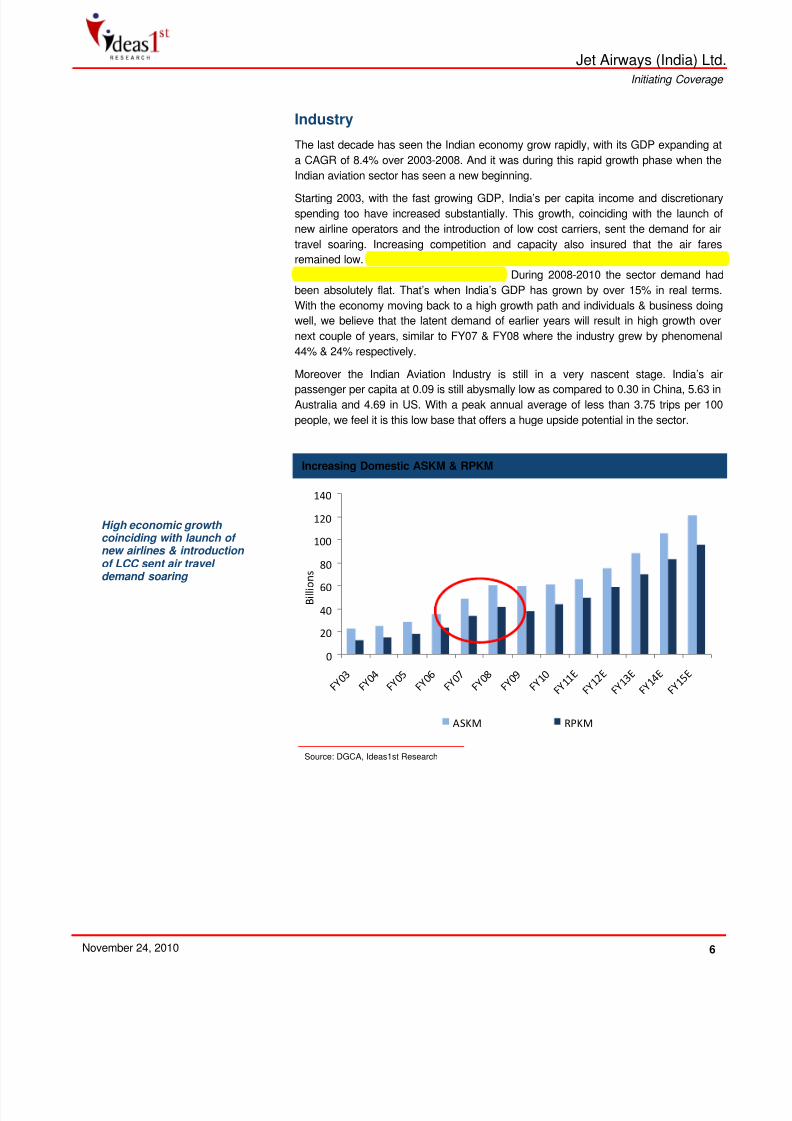
Starting 2003, with the fast growing GDP, India’s per capita income and discretionary
spending too have increased substantially. This growth, coinciding with the launch of
new airline operators and the introduction of low cost carriers, sent the demand for air
travel soaring. Increasing competition and capacity also insured that the air fares
remained low. The sector has grown at a CAGR of 19.14% between 2003 & 2008, at a
multiple of approximately 2.5 to the GDP. During 2008-2010 the sector demand had
been absolutely flat. That’s when India’s GDP has grown by over 15% in real terms.
With the economy moving back to a high growth path and individuals & business doing
well, we believe that the latent demand of earlier years will result in high growth over
next couple of years, similar to FY07 & FY08 where the industry grew by phenomenal
44% & 24% respectively.
Moreover the Indian Aviation Industry is still in a very nascent stage. India’s airpassenger per capita at 0.09 is still abysmally low as compared to 0.30 in China, 5.63 in
Australia and 4.69 in US. With a peak annual average of less than 3.75 trips per 100
people, we feel it is this low base that offers a huge upside potential in the sector.
0
20
40
60
80
100
120
140
FY03
FY04
FY05
FY06
FY07
FY08
FY09
FY10
FY11E
FY12
E
FY13E
FY14
E
FY15E
Billions
ASKM RPKM
Increasing Domestic ASKM & RPKM
Source: DGCA, Ideas1st Research
High economic growth coinciding with launch of new airlines & introduction
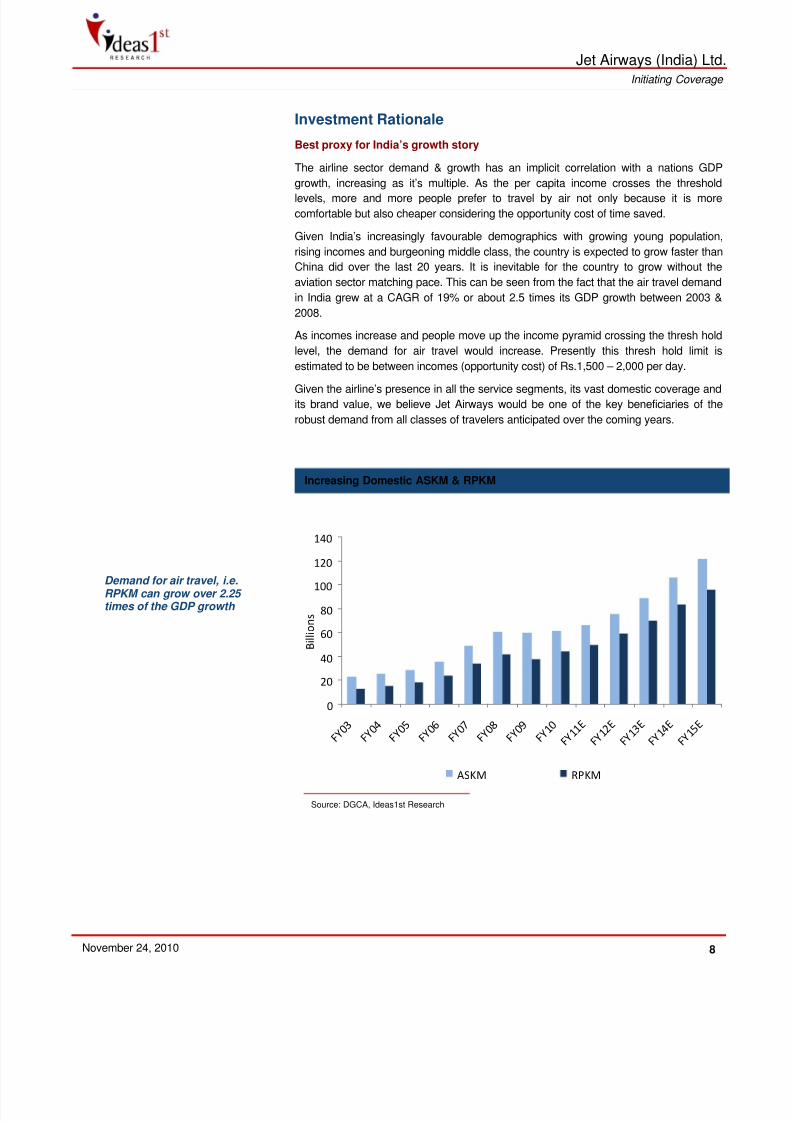
The airline sector demand & growth has an implicit correlation with a nations GDP
growth, increasing as it’s multiple. As the per capita income crosses the thresholdlevels, more and more people prefer to travel by air not only because it is more
comfortable but also cheaper considering the opportunity cost of time saved.
Given India’s increasingly favourable demographics with growing young population,
rising incomes and burgeoning middle class, the country is expected to grow faster than
China did over the last 20 years. It is inevitable for the country to grow without the
aviation sector matching pace. This can be seen from the fact that the air travel demand
in India grew at a CAGR of 19% or about 2.5 times its GDP growth between 2003 &
2008.
As incomes increase and people move up the income pyramid crossing the thresh hold
level, the demand for air travel would increase. Presently this thresh hold limit is
estimated to be between incomes (opportunity cost) of Rs.1,500 – 2,000 per day.
Given the airline’s presence in all the service segments, its vast domestic coverage and
its brand value, we believe Jet Airways would be one of the key beneficiaries of the
robust demand from all classes of travelers anticipated over the coming years.
0
20
40
60
80
100
120
140
FY03
FY04
FY05
FY06
FY07
FY08
FY09
FY10
FY11E
FY12E
FY13E
FY14E
FY15E
Billions
ASKM RPKM
Increasing Domestic ASKM & RPKM
Source: DGCA, Ideas1st Research
Demand for air travel, i.e.RPKM can grow over 2.25 times of the GDP growth
Pricing power to return to airlines due to huge implicit entry barriers
Even though the airline sector will continue to see double digit growth over next few
decades in India, we anticipate the supply addition to be constrained at about 5 – 7%
over the next few years with limited number of new players. The saturating aviation
infrastructure, lack of easy access to capital and stringent regulations make it extremelydifficult for new players to enter the segment. While other issues can be addressed in
short to medium term, it would take at least a few years before adequate infrastructure
can be created.
These entry barriers along with the cautious capacity addition by incumbent players in
face of the recent crisis would ensue in limited supply growth while demand is growing
rapidly. With the narrowing demand-supply gap, we clearly see the pricing power
returning in the hands of the companies and anticipate higher revenues & margins per
ticket going forward.
Infrastructure bottleneck
The lack of adequate airport infrastructure is one of the major barriers to the airline
industry and has remained relatively unnoticed until recently. Execution can be a major
hurdle for a new entrant, due to a host of these infrastructure issues. Further as
commonly believed, airlines do not have “Mobile Capacity”. Airlines are understood to
be able to move their capacity, airplanes, literally over night. However, owed to the lack
of infrastructure and limited free slots such capacity shifts from low demand markets to
higher demand destinations is easier said than done in India.
The aviation infrastructure growth in the country hasn’t kept pace with the growth in air
traffic. While fleet size has increased manifolds, from just 184 aircrafts in 2005 to
around 450 aircrafts currently with scheduled operators, not much infrastructure has
been added. This has resulted in big takeoff and landing queues at the major airports.
Limited airport facilities and lack of parking bays is not only leading to congestion ordelays but also forcing airlines to park their aircrafts in far flung places.
At most major airports, slots i.e. the landing and takeoff rights, are saturated at peak
hours, with the possibility of new flights coming in only during off peak or odd hours. In
Mumbai, which has the busiest airport of the country, even odd hour slots are not
available easily. These slots are an important consideration for an entrant as peak timed
slots register higher passenger load factors as compared to other slots. We anticipate
these capacity constraints and inefficiencies to act as a strong entry barrier for new
The airlines sector is a highly capital intensive industry with high fixed & constant costs
and variable revenues. Fixed costs include costs like aircraft acquisition cost, rental cost
of leased planes, maintenance cost, crew & administrative staff salaries; that have to be
incurred even if the flight is cancelled. Constant costs, which cease if the flight iscancelled but are invariant to the volume of traffic carried, are also high. Examples of
constant costs are ATF, landing fees, which do not depend on the number of
passengers, but will not be incurred if the flight is cancelled. While majority of the costs
are fixed, the industries revenues are variable, resulting in high operating leverage.
That said, we believe that even at higher capital costs, existing and new players would
find it very challenging to raise any funds.
Regulatory & other barriers
Regulatory barriers are another stumbling block that may discourage new participants in
the industry. There are some inherent policies that may discourage competition in the
sector and may ensue in a loose form of oligopoly type of market structure.
Some regulations that may prove as barriers to domestic operations include regulations
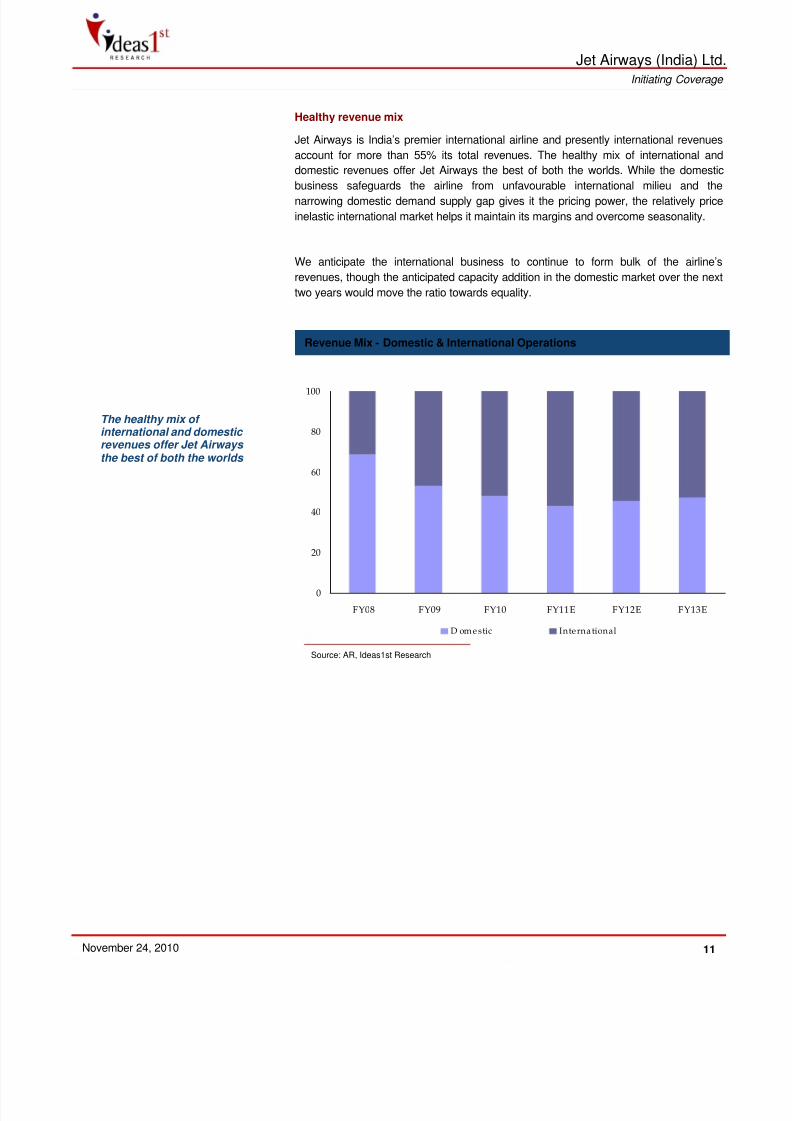
Jet Airways is India’s premier international airline and presently international revenues
account for more than 55% its total revenues. The healthy mix of international and
domestic revenues offer Jet Airways the best of both the worlds. While the domestic
business safeguards the airline from unfavourable international milieu and thenarrowing domestic demand supply gap gives it the pricing power, the relatively price
inelastic international market helps it maintain its margins and overcome seasonality.
We anticipate the international business to continue to form bulk of the airline’s
revenues, though the anticipated capacity addition in the domestic market over the next
two years would move the ratio towards equality.
Revenue Mix - Domestic & International Operations
0
20
40
60
80
100
FY08 FY09 FY10 FY11E FY12E FY13E
D om e stic International
Source: AR, Ideas1st Research
The healthy mix of international and domestic revenues offer Jet Airways the best of both the worlds
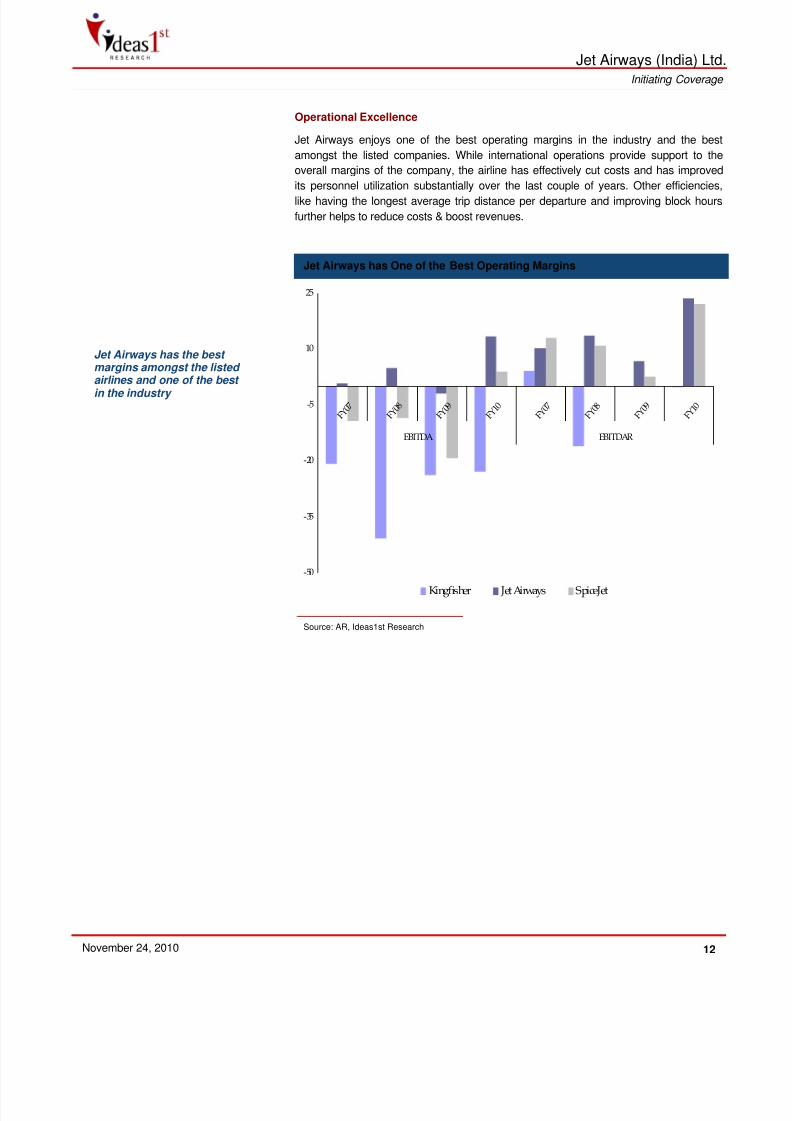
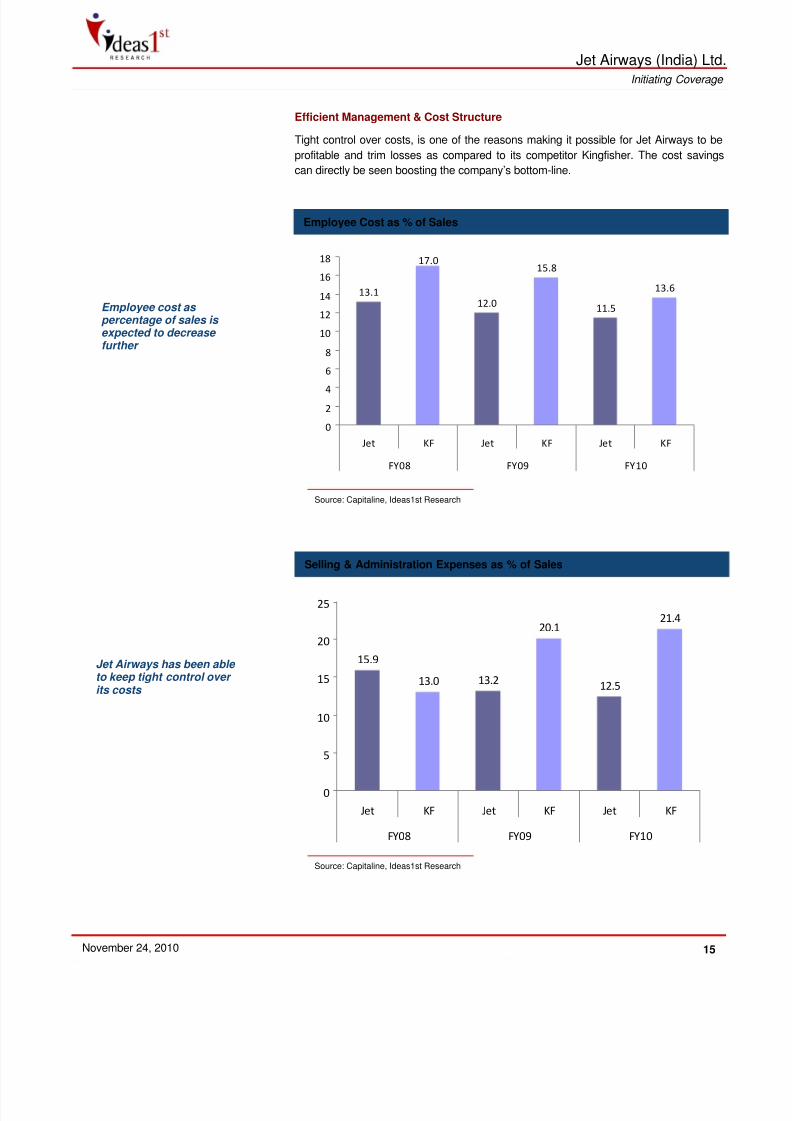
Jet Airways enjoys one of the best operating margins in the industry and the best
amongst the listed companies. While international operations provide support to the
overall margins of the company, the airline has effectively cut costs and has improved
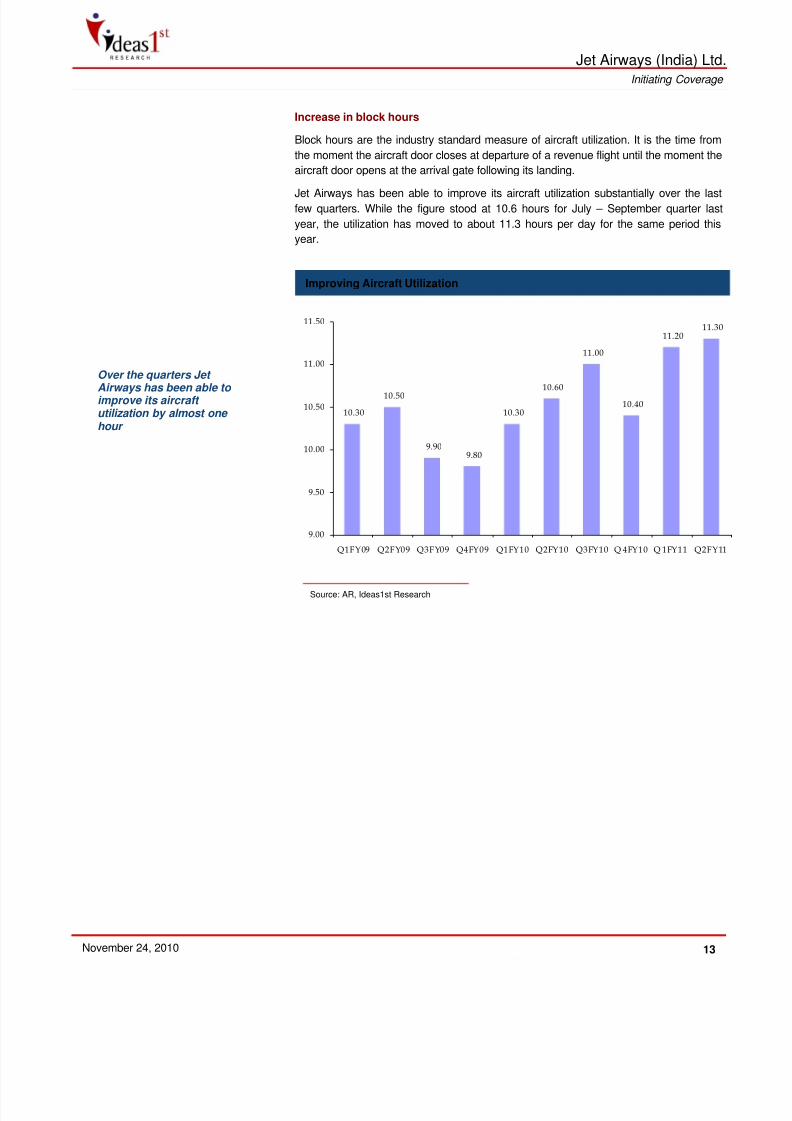
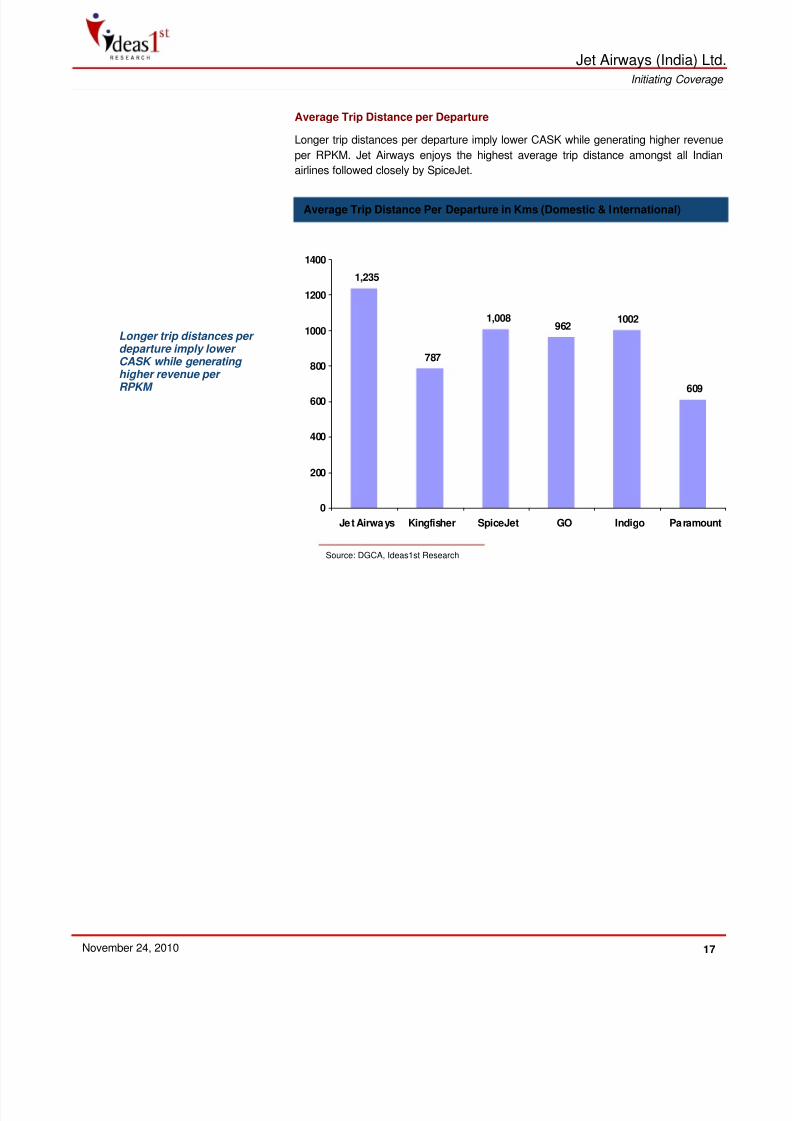
its personnel utilization substantially over the last couple of years. Other efficiencies,like having the longest average trip distance per departure and improving block hours
further helps to reduce costs & boost revenues.
Source: AR, Ideas1st Research
Jet Airways has the best margins amongst the listed
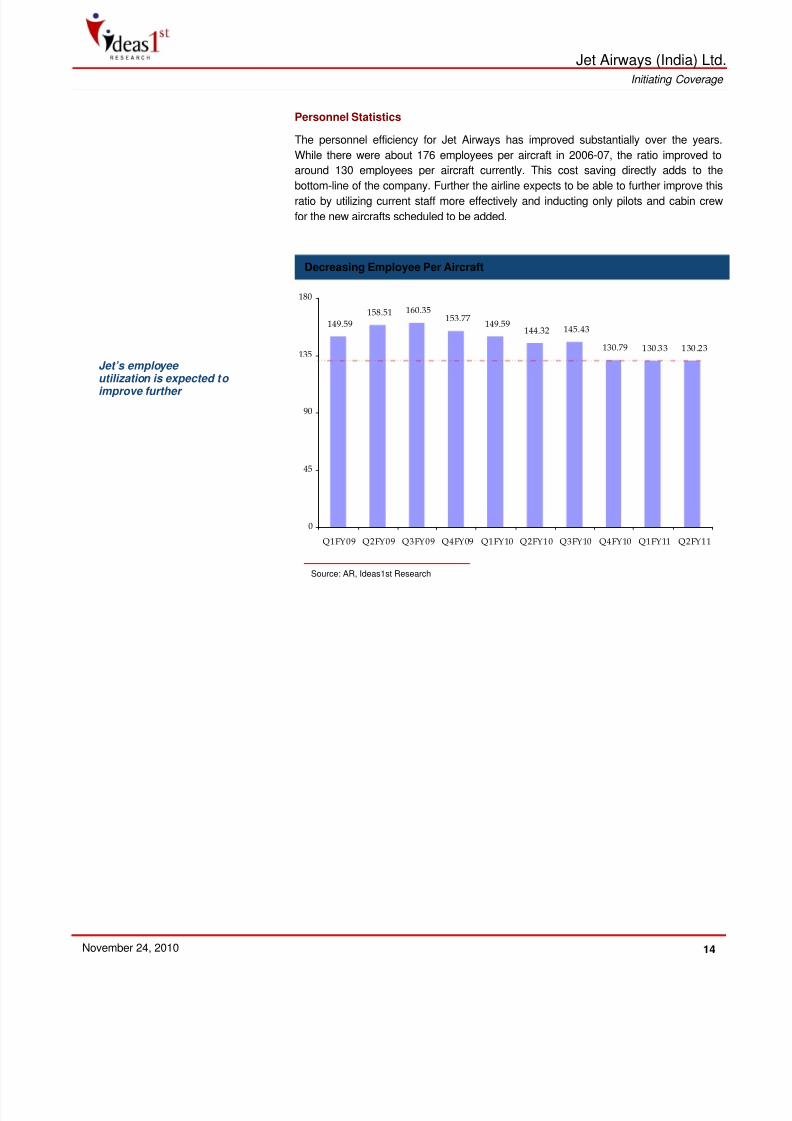
The personnel efficiency for Jet Airways has improved substantially over the years.
While there were about 176 employees per aircraft in 2006-07, the ratio improved to
around 130 employees per aircraft currently. This cost saving directly adds to the
bottom-line of the company. Further the airline expects to be able to further improve thisratio by utilizing current staff more effectively and inducting only pilots and cabin crew
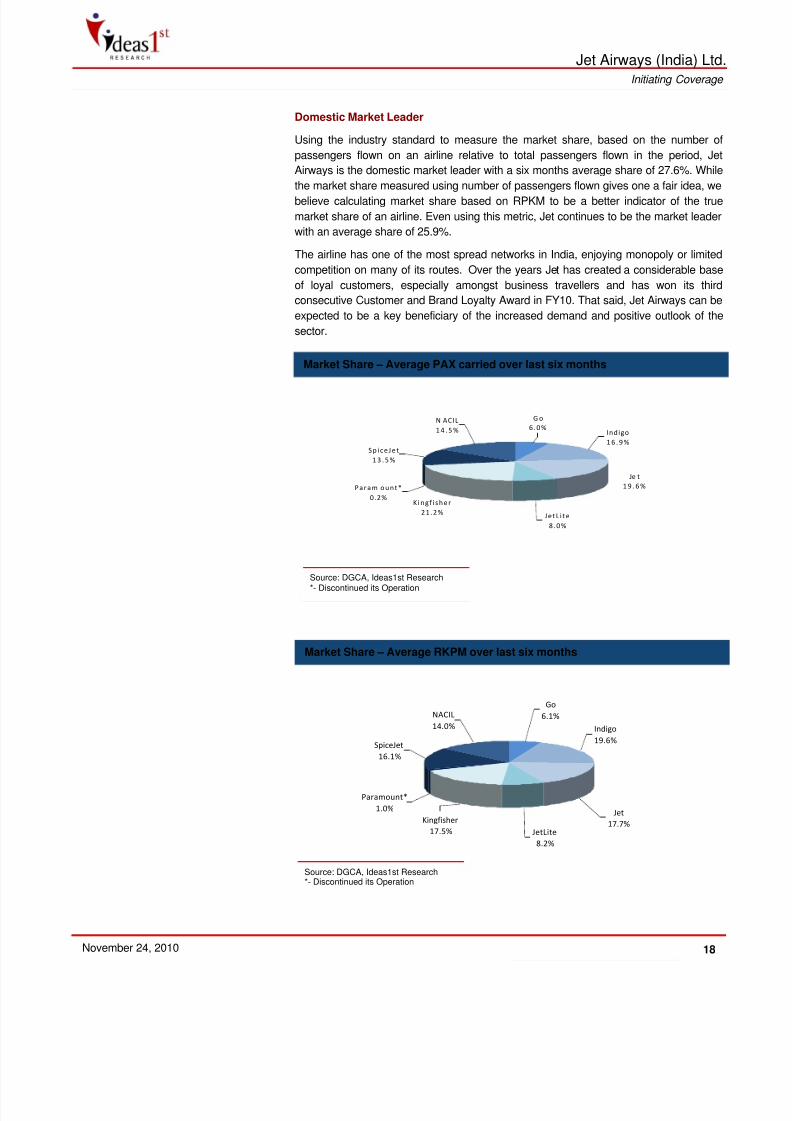
Using the industry standard to measure the market share, based on the number of
passengers flown on an airline relative to total passengers flown in the period, Jet
Airways is the domestic market leader with a six months average share of 27.6%. While
the market share measured using number of passengers flown gives one a fair idea, webelieve calculating market share based on RPKM to be a better indicator of the true
market share of an airline. Even using this metric, Jet continues to be the market leader
with an average share of 25.9%.
The airline has one of the most spread networks in India, enjoying monopoly or limited
competition on many of its routes. Over the years Jet has created a considerable base
of loyal customers, especially amongst business travellers and has won its third
consecutive Customer and Brand Loyalty Award in FY10. That said, Jet Airways can be
expected to be a key beneficiary of the increased demand and positive outlook of the
sector.
Go
6.1%
Indigo
19.6%
Jet
17.7%JetLite
8.2%
Kingfisher
17.5%
Paramount*
1.0%
SpiceJet
16.1%
NACIL
14.0%
Market Share – Average RKPM over last six months
Source: DGCA, Ideas1st Research*- Discontinued its Operation
G o
6 .0 %Indigo
1 6 . 9 %
Je t
1 9 . 6 %
JetL i te
8 .0 %
Kin gf i s h er
2 1 .2 %
Par am o u n t*
0.2%
S p ic eJet
1 3 . 5 %
N ACIL
1 4 . 5 %
Source: DGCA, Ideas1st Research*- Discontinued its Operation
Market Share – Average PAX carried over last six months
Jet Airways is one of the most nimble airlines in the country and its ability to quickly
change the mix of its offerings according to market forces makes it attractive. This
flexibility of offering services in all three segments, namely, Full Service Carriers, Low
Fare Carriers and Low Cost Carriers not only helps the airline to meet the diverse needsbut also gives its the flexibility to move seats between the segments according to the
market conditions and cyclicality, helping it to maximize revenues.
Jet’s agility can be seen from the introduction of Jet Konnect service in 2009 which
helped it to regain its market share by offering low fares in a depressed market. Now
with the demand for air travel picking up, the airline has started reintroducing business
class in its Jet Konnect aircrafts and adding more capacities under its FSC hood - ‘Jet
Airways’. This in line with the current demand trend and as the purses of the customers
loosen, we anticipate FSCs to benefit more than LFCs or LCCs.
Hedged Revenue & Cost Structure
The cost structure of airlines has strong positive correlation to USD. Aircraft lease,
maintenance and crude form over two thirds of the total expenditure and are directly
linked to USD. Companies like Jet Airways, which have around 55% of revenue coming
from international appreciation is naturally hedged far better than most other airlines
against volatile currency movements.
Improved Domestic and International macroeconomic
Jet stands to benefit hugely from the sharp upturn in domestic business sentiments
because of being the largest player in the segment. Improved global macroeconomic
environment helped the company score even better load factors and margins in its
international business segment. Given the huge international network and alliances, Jetis the best placed Indian airlines to benefit from the growing global attention towards
India
Increasing Business Travel
Bulk of the demand for air travel comes from the corporate and business travellers.
Further shifts in business travel demand mirrors the economic trends. India with its high
GDP growth rate and stable economy is expected to witness strong demand for air
travel from the corporate. Already, with almost all blue-chip companies having detailed
travel policies, travel costs have emerged as the third largest expenses for them, after
salaries and raw materials.
Increasing International Tourist Activity
Tourism accounts only for 2.5% of India’s GDP, versus 6% in Asia Pacific and 5.3% in
China. However this ratio is fast changing with India emerging amongst the fast growing
tourism destinations in the world. According to the World Travel & Tourism Council,
Indian tourism industry will grow at over 8% per annum in real terms over 2007-16.
Flexibility to shift capacities between different segments
makes it one of the most nimble airlines in the country
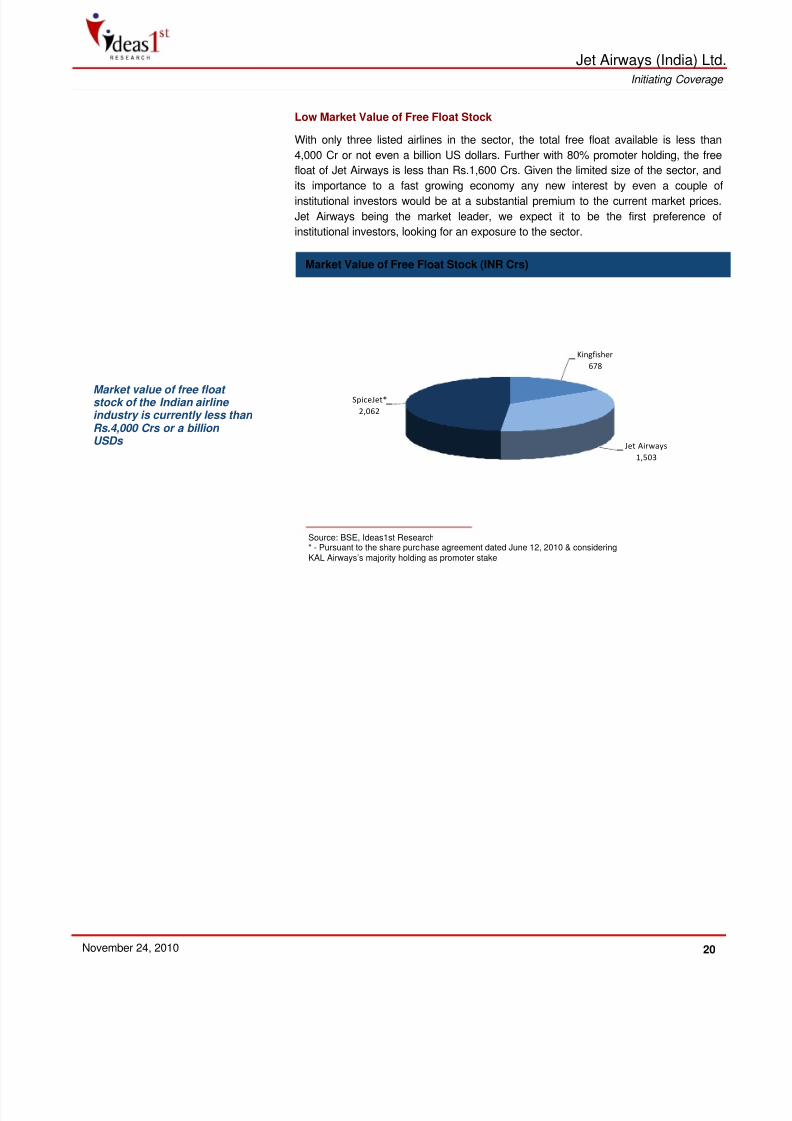
With only three listed airlines in the sector, the total free float available is less than
4,000 Cr or not even a billion US dollars. Further with 80% promoter holding, the free
float of Jet Airways is less than Rs.1,600 Crs. Given the limited size of the sector, and
its importance to a fast growing economy any new interest by even a couple ofinstitutional investors would be at a substantial premium to the current market prices.
Jet Airways being the market leader, we expect it to be the first preference of
institutional investors, looking for an exposure to the sector.
Market Value of Free Float Stock (INR Crs)
Kingfisher
678
Jet Airways
1,503
SpiceJet*
2,062
Source: BSE, Ideas1st Research* - Pursuant to the share purchase agreement dated June 12, 2010 & consideringKAL Airways’s majority holding as promoter stake
Market value of free float stock of the Indian airline industry is currently less than Rs.4,000 Crs or a billion USDs
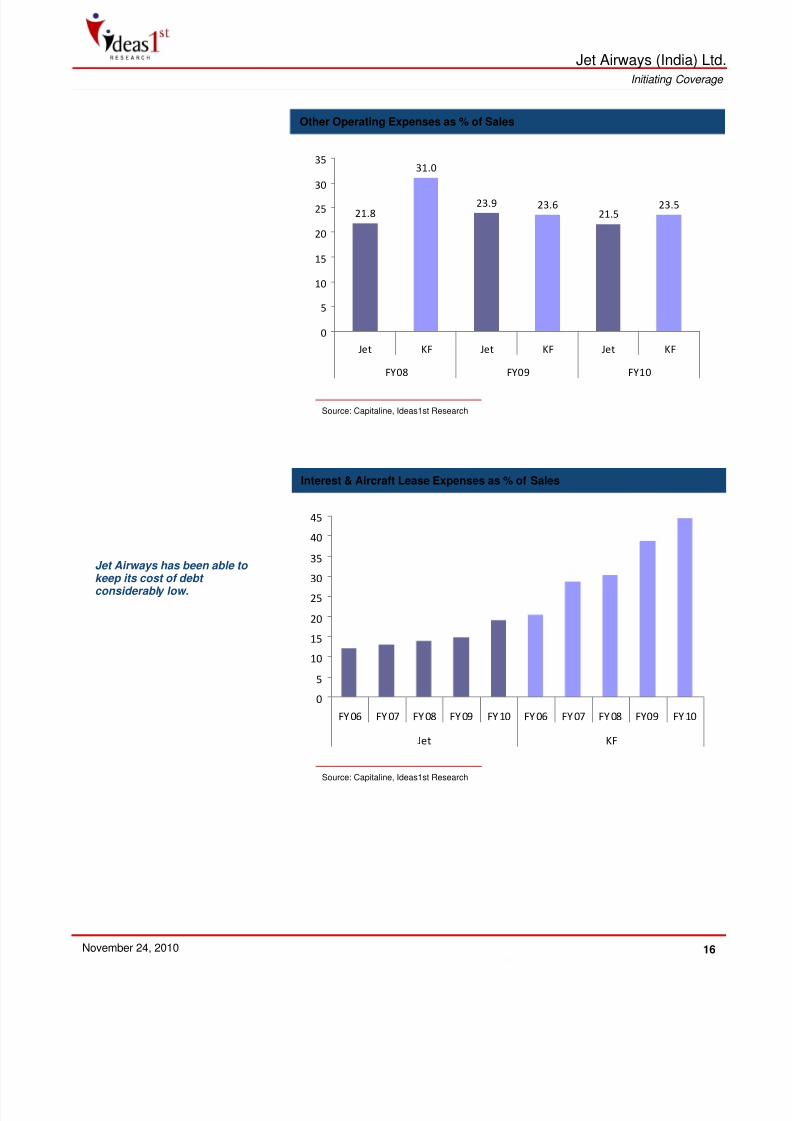
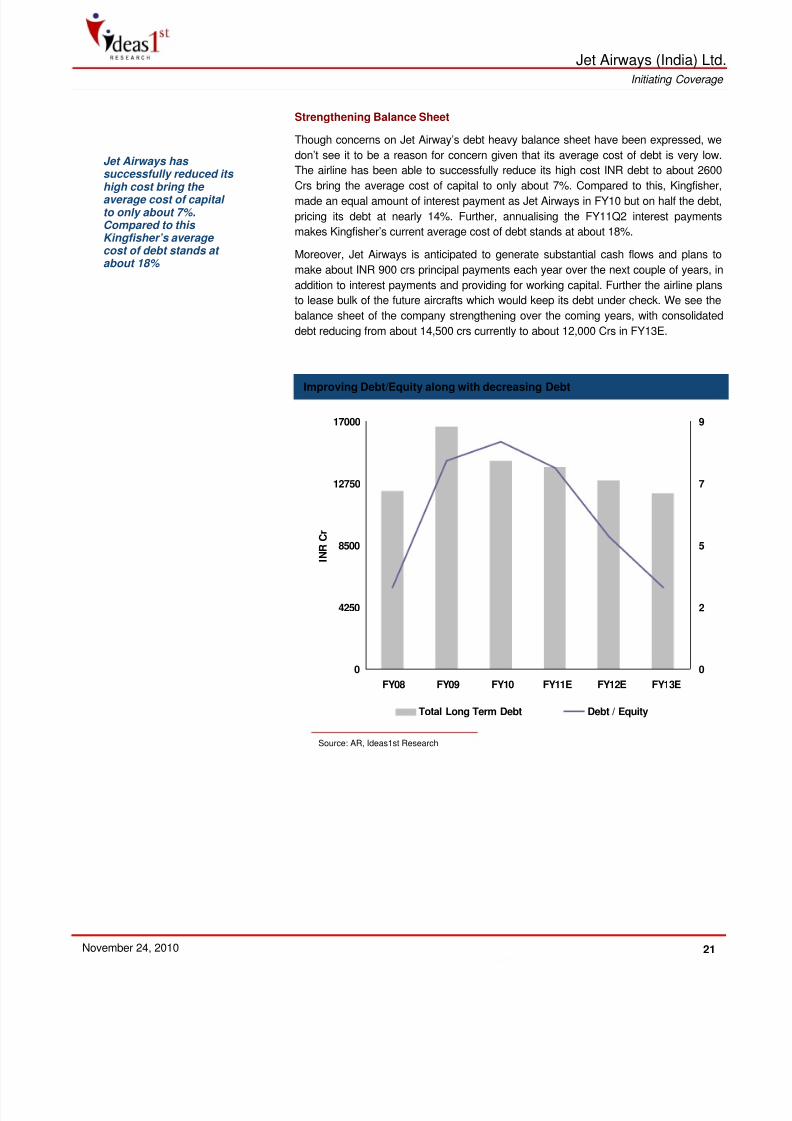
Though concerns on Jet Airway’s debt heavy balance sheet have been expressed, we
don’t see it to be a reason for concern given that its average cost of debt is very low.
The airline has been able to successfully reduce its high cost INR debt to about 2600
Crs bring the average cost of capital to only about 7%. Compared to this, Kingfisher,made an equal amount of interest payment as Jet Airways in FY10 but on half the debt,
pricing its debt at nearly 14%. Further, annualising the FY11Q2 interest payments
makes Kingfisher’s current average cost of debt stands at about 18%.
Moreover, Jet Airways is anticipated to generate substantial cash flows and plans to
make about INR 900 crs principal payments each year over the next couple of years, in
addition to interest payments and providing for working capital. Further the airline plans
to lease bulk of the future aircrafts which would keep its debt under check. We see the
balance sheet of the company strengthening over the coming years, with consolidated
debt reducing from about 14,500 crs currently to about 12,000 Crs in FY13E.
Jet Airways has successfully reduced its
high cost bring the average cost of capital to only about 7%.Compared to this Kingfisher’s average cost of debt stands at about 18%
Improving Debt/Equity along with decreasing Debt
0
4250
8500
12750
17000
FY08 FY09 FY10 FY11E FY12E FY13E
INR Cr
0
2
5
7
9
Total Long Term Debt Debt / Equity Source: AR, Ideas1st Research
With most of the developed economies still struggling to get back on their feet, fears of
a double dip or at least a long period of slow growth have been lingering around.
Though we see more positive foretokens than negatives, we believe such a dip would
be only temporary with little or no effect on India and the domestic air travel demand.
Crude Prices
As compared to international players, Indian airlines have a higher proportion of fuel
costs in total operating costs due to the higher ATF tax structure in the country. Any
increase in crude without proportionate increase in revenue would impact the bottom-
line of the company. Though we maintain a stable outlook for crude prices, an increasein crude prices above USD 90 per barrel may start having an impact over the margins of
domestic airlines.
Industry Specific
Inordinate Capacity Addition by the Industry
Rise in competition within the industry can lead to a tariff wars resulting in reduction in
the yield from the current level. Also inordinate capacity addition by the airlines may
lead to lower load factors. Both these mis-happenings can adversely impact company’s
top & bottom-line.
Load Factor
Given high operating leverage, decrease in load factor due excessive capacity addition
or reduction in demand has higher impact on bottomline.
Reduction in Yields
As cost structure of the company is fixed, any reduction in yield because of
aforementioned reasons would directly hit the bottomline.
Regulatory
Adverse regulatory and policy amendments like higher airport, ATF or other taxes, more
stringent norms for carrying on operations et al can impact the sector’s growth
India has been witnessing strong growth over the last few years with per capita income
growing by over 15% annually and is expected to continue to grow at rates higher than
China did over the last 20 years. According to the McKinsey Global Institute, the Indian
middle class is expected to grow humongously to about 583 million by 2025 from thecurrent 50 million. As the middle class expands, so will the demand for air travel. The
Indian airline industry is expected to record double digit growth for over two decades.
We believe despite the robust growth shown by the Indian airlines over the last five
years and the double digit growth expected over the next couple of decades, the Indian
airline sector is grossly undervalued as compared to international standards.
Within the sector, given strong revival in demand, high market share of the company,
strong track record, sound company fundamentals and inexpensive valuations, Jet
Airways is amongst the best stocks to invest in. We have used multiple approaches to
value Jet Airways. While using the EV/EBITDAR multiple we arrived at a fair value of
Rs.1,800 per share, using discounted cash flows the fair value stand at Rs. 2,335 per
share.
Comparative Multiples
We have used the weighted average EV/EBITDAR multiple for valuing Jet Airways.
Given that more than 55% of the airline’s revenues come from the internationa
segment, we believe assigning equal weights would reflect truer value. Further due to
negative earnings for the only comparable airlines listed in the country and the limited
financial & listing history for Indian carriers it is difficult to arrive at a valuation for Jet
Airways purely based on Indian carriers.
Compared to EV/Sales or EV/EBITDA, we believe EV/EBITDAR to give the best picture.
While using EBITDAR overcomes the fare & cost differentials that is not reflected in
EV/Sales multiple, using EBITDAR also accounts for the fleet acquisition strategy i.e.owned aircrafts v/s leased aircrafts. EV/EBITDAR multiple offsets the interest burden on
owned fleet against the aircraft rentals.
Using the weighted average EV/EBITDAR multiple of 8.3x, we value Jet airways at
Rs.1,800. We believe we have been conservative in assigning the multiple by not
adding a premium for being the market leader. Also given the robust growth potential of
double digit annual growth rate for the industry over the next two decades, we believe
we have been very conservative in assigning a weight of .50 to international average
while arriving at the multiple. Based on the growth potential we see the Indian airline
sector to be grossly undervalued to global standards & expect the valuations to at least
We have also discounted the projected cash flows for Jet Airways to arrive at a fair
price. Unlike comparative valuation, DCF will capture the yield increase and reflects the
intrinsic worth of the share. Based on our DCF approach, we have fundamentally valued
the company at Rs.2,335 per share.
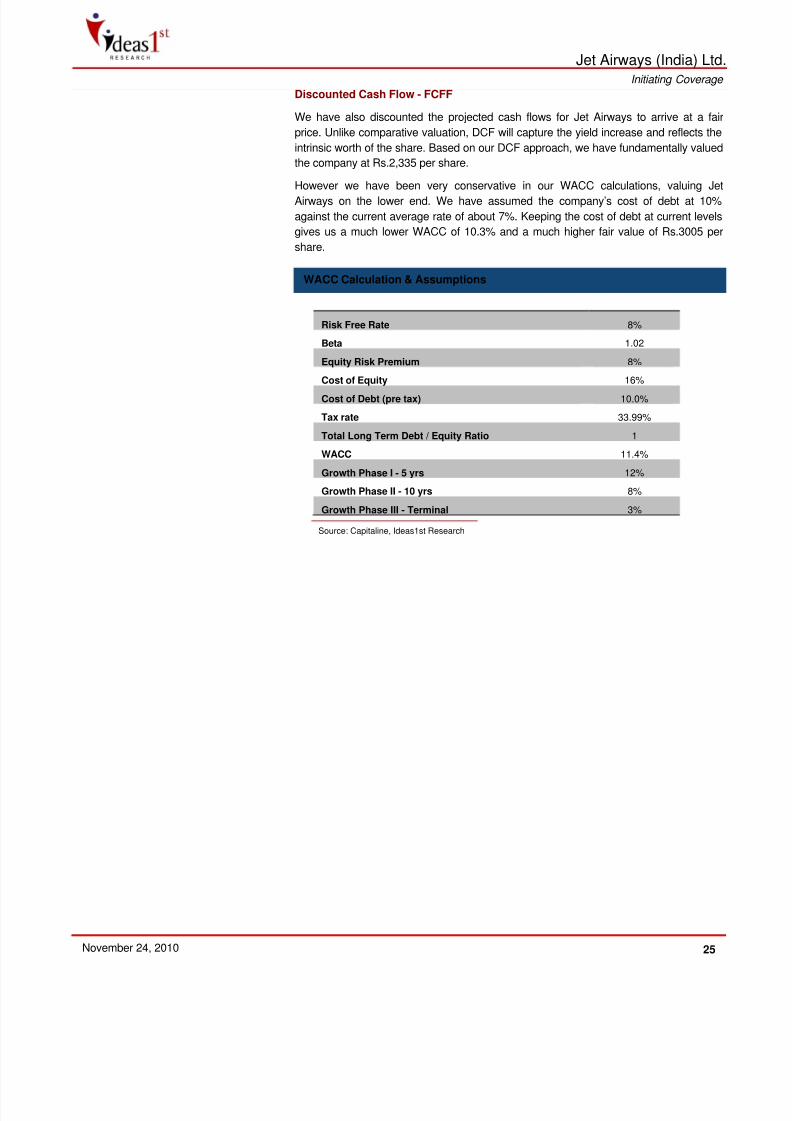
However we have been very conservative in our WACC calculations, valuing JetAirways on the lower end. We have assumed the company’s cost of debt at 10%
against the current average rate of about 7%. Keeping the cost of debt at current levels
gives us a much lower WACC of 10.3% and a much higher fair value of Rs.3005 per
By Kevin Brow n in Singapore | September 20 2010 18:12 | www.ft.com
Asia’s V-shaped recovery from the global financial crisis has triggered a boom among budget airlines in the region as carriers
position to meet forecasts for rising traffic.
With growth in gross domestic product in emerging Asia now forecast by the Asian Development Bank to reach 7.9 per cent this
year, airlines are rushing to add enough capacity to meet predicted demand.
Activity is most intense in south-east Asia, where Cebu Pacific of the Philippines last week announced an initial public offering to
raise up to $730m to buy new aircraft.
Tiger Airways, the low-cost carrier part-owned by Singapore Airlines, last week said it planned to buy nine new Airbus A320
aircraft, increasing its fleet to 26. The airline has already announced plans to launch a subsidiary in Thailand in a joint venture
with Thai Airways International. Tiger also runs a subsidiary in Australia.
Meanwhile, Malaysia-based AirAsia, the region’s largest low-cost carrier, recently unveiled plans for a joint venture in Vietnam,
alongside its existing operations in Thailand and Indonesia.
Cebu Pacific would not comment on its planned IPO, for which Citigroup, Deutsche Bank and JPMorgan are joint global lead
managers.
However, a person with knowledge of the transaction said the airline was expected to raise at least $500m to expand its domestic
network, the largest in the Philippines, and add to its south-east Asian international destinations.
Boeing, the US aircraft manufacturer, is forecasting growth of 8.3 per cent a year for the next 20 years in route passengerkilometres – a key measure of airline traffic – flown within south-east Asia.
That compares with 7.1 per cent for the Asia Pacific region, 4.1 per cent for Europe and just 2.8 per cent for North America.
In addition to rapid economic growth, south-east Asia is also benefiting from the run-up to the implementation in 2015 of an “open
skies” deal among the 10 countries of the Association of South East Asian Nations.
The countries have a combined population of 600m and an economy the size of India’s.
“All the airlines are positioning themselves for this because instead of bilateral deals limiting them to flying between city pairs, the
agreement will open a huge market into second and third-tier cities that hasn’t been tapped,” said the person with knowledge of
the Cebu Pacific IPO.
Elsewhere in Asia, IndiGo, India’s biggest low-cost carrier, has announced plans to acquire 150 new aircraft, and is said by
bankers to be preparing for an initial public offering in Mumbai aiming to raise about $400m. The company said recently, however,
Parking facility: A revenue generation potential, for Nagpur airport
The Economic Times, September 17, 2010
Among the various revenue generation streams at MIHAN, one that is proving to hold substantial potential is the night parking slotsfor low cost carriers. Mihan India Private Ltd (MIPL) project manager, Abid Ruhi, explains that domestic airlines (including Jet
Airways and Indigo) have evinced interest to avail of the night parking facility being offered by MIPL, at Nagpur airport.
With Mumbai and New Delhi airports becoming congested, there is not a single night parking slot available for airlines at these
locations. Hence, airlines are opting for Nagpur airport. Consequently, MIPL is promoting this option, as one with minimum charges
and maximum facilities, adds Ruhi. The MIPL authorities started working on such proposals, after taking over operations at Nagpur
airport. In case JetLite and Indigo plan to shift their aircraft base here, as proposed, Nagpur airport could generate additional
revenue during off-peak hours too, adds Ruhi.
The airport has so far been earning revenue only during peak hours (from 7am to 11pm), from the few domestic flights and an
international flight. Now, it plans to provide eight parking slots during the day and four new slots to private airlines during off-peak
hours (12 midnight to 6am).
Last year, international airlines, like Belgium based Sabena Airlines and US-based Goodrich Air, which are planning to start India
operations, had sought night parking slots for their aircrafts at Nagpur airport. Another US based airline had asked for stop-over
parking at Nagpur, as well. “A few other international airlines have also conducted a survey of Nagpur airport, to use the night
DNA / Sindhu Bhattacharya / Saturday, July 3, 2010 1:07 IST
It may soon become difficult to allow new flights into and out of Mumbai, given congestion at the international airport and delays inbuilding a new one at Navi Mumbai.
Slamming the environment ministry for delaying clearance to the Navi Mumbai project, Union civil aviation minister Praful Patel said
on Friday, “We are reaching a point where we have to think whether new flights can be permitted or not.
After the current upgradation, Mumbai international airport’s peak capacity will reach 40 million passengers annually, but more is
needed. In 24 hours, we are using peak airport capacity for 15 hours every day.”
Patel said objections from the ministry of environment and forests over the Navi Mumbai project were beyond comprehension. “We
can’t be overly obsessive about environmental issues. We can’t give priority to 50-100 acres of degradation over a large
infrastructure project.”
The new airport has been planned near Panvel, but Union environment minister Jairam Ramesh has raised concerns over the
project destroying about 400 acres of forest.
A Mumbai International Airport Ltd spokesperson pointed out that there were currently 32 aircraft movements per hour.
But when the traffic reaches 40 million passengers, there will be 40 an hour.
“The airport will soon reach saturation point. We handled 26 million passengers in 2009-10 on a land area of 1,849 acres as
against Delhi, which handled almost the same number of passengers at more than double the land area available at 5,200 acres.
Even Hyderabad, which handles about seven million passengers a year, has 5,400 acres at its disposal.”
He said Mumbai airport was constrained in terms of land, and therefore in critical areas such as runways, aircraft parking bays andterminal expansion.
It’ll hurt. We are reaching capacity in Mumbai & new airport is stuck: Patel
July 5, 2010, www.economictimes.indiatimes.com
Civil Aviation Minister Praful Patel is in favour of allowing foreign carriers to own stakes in domestic ones. That’s one way theaviation industry, which he describes as India’s ``new sunrise sector,’ can get a part of the capital it badly needs to keep pace with
the growth in demand that’s bound to be unleashed, he says. `If only 10% of us flew, the Indian civil aviation industry would still
need to become six times its present size,’’ he says. In a walkabout interview with ET NOW’s Andy Mukherjee at New Delhi’s
gleaming, new, state-of-the-art Terminal 3, Patel spoke about a host of issues, including making India an aviation hub for Asia, the
turnaround of Air India and his concerns over the dithering in building a new airport at Navi Mumbai because of environmental
concerns. Excerpts from the interview, which plays on ET NOW on Tuesday at 6:30 pm and 11 pm.
Is it time to revisit the issue of allowing foreign carriers to invest in domestic airlines?
The entire government has to take a call on this. But yes, there is a case. Since the aviation sector is now turning around, and thegrowth and the volumes are coming, there will be a requirement of huge capital expenditure and a lot of investments. So I think
there is a possibility.
At an IATA conference you perhaps jokingly said that by 2050, of the 12 surviving global airline brands, three will be from
India.
I mean it. When I said in 2004 that India’s aviation will grow and will arrive on the world scene, I am sure not many people would
have believed it and I do not think four years back anybody in India would have ever thought that we could have an airport terminal
as big and grand as this. Let’s not underestimate India. With its huge population, geography and growing economic strength, India
will be able to demonstrate all that I have said in Berlin. By 2050, if there are 12 carriers flying, three will come from India and three
from China.
What about the losses at Air India?
I am happy that a lot has changed in Air India since last year. The losses have started coming down and the outlook is good.
But we are still talking about some 22,000 crore rupees of expensive longterm debt that Air India has taken because of the new
aircraft orders that it has placed?
Well that is unfortunately a thing which happened because we did not have a capital expenditure programme for 20 years. So when
you have a large induction of aircraft, these kinds of issues will certainly be a factor which they will have to contend with, but as Isaid, things are looking better.
With T 3 operational, will India at least be a contender for the position of an aviation hub in this part of the world? In fact, that is what it’s precisely meant to be. It’s a game changer for India’s aviation. This airport will establish Delhi as a major
hub for most of Asia. So this, I think, is a defining moment. The vision document which we have internally in the ministry is to make,to begin with, Delhi, Mumbai, Kolkata, Chennai, Bangalore and Hyderabad as the six major hubs of India. And if we are on course,
I can assure you that aviation in India will also be on course. The strength of the airlines will be to be able to, say, bring a
passenger from Paris into Delhi and to be taking the passenger from Delhi to, say, Hanoi or Shanghai or to any other city. All the
carriers right from Air India to Jet Airways to Kingfisher and in future all the other airlines which will start flying internationally
will take advantage of these kinds of airports. So an airport is not just a facility that looks big, grand and comfortable.
Will the Mumbai Airport also look as nice as the new airport in Delhi?
The Mumbai Airport, when completed, will be absolutely on the same scale and size and grandeur. But what worries me about
Mumbai is not whether the existing Chhatrapati Shivaji International Airport will be as grand or great like this; it will be. What
worries me is that it’s a constrained airport, it has one major runway, one cross runway which is like a half runway, and if the
second airport at Navi Mumbai which I am very concerned about is not coming up in the next five years, it will affect the
economy of Mumbai because I have almost come to a stage where no more flights in and out of Mumbai can be allowed. It is
coming to a stage where passenger capacity may exist in the terminals, but the number of aircraft movement in and out of Mumbai
cannot happen, and that is why Navi Mumbai must be cleared at the earliest. Unfortunately it has been held up due to some
environment concerns. I am not against addressing concerns. After all, we all have to ensure a good and a clean world. But in a
country like ours where development and the aspirations and the needs of the Indian economy and the population have to be
addressed, I think we will have to strike the right balance. So if 100 acres or hectares of some mangroves are an issue, well I think
that’s a larger call (for the government). But one thing is certain.
Mumbai used to be the No.1 airport in India until just two years ago, and Delhi has overtaken it. It means that over the years Delhi
will be the premier airport of India and that should be a concern. It isn’t that I come from Mumbai and it worries me because of I
look at it from a parochial perspective, but Mumbai is the commercial capital of the country.
And what affects commerce in Mumbai will hurt India …
It’s so unfortunate that Mumbai has a constrained airport. Pune, which could have had a satellite airport, has still not been able to
find consensus on where to build the second airport. Navi Mumbai is stuck. I do not know what is going to happen. If tomorrow we
have to put a ban on new flights in and out of Mumbai, what chaos it will create, that’s for everybody to see.
Research is a reg is te red t rademark o f Ideas1s t
In fo rmat ion Serv ices Pr iva te L im i ted .
Ideas1s t
In fo rmat ion Serv ices Pr iva te L im i ted is ne i the r au tho r ized no r regu la ted by the F inanc ia l Serv ices Au tho r i ty .
Th is document i s no t fo r pub l i c d is t r ibu t ion and has been fu rn ished to you so le ly fo r your in fo rmat ion and must no t be
reproduced o r red is t r ibu ted to any o the r pe rson . Persons in to whose possess ion th is document may come a rerequ i red to observe these res t r i c t ions .
Th is mate r ia l i s fo r the pe rsona l in fo rmat ion o f the au tho r ized rec ip ien t , and we a re no t so l i c i t ing any ac t ion basedupon i t . Th is repor t i s no t to be const rued as an o f fe r to se l l o r the so l i c i ta t ion o f an o f fe r to buy any secur i ty in anyju r isd ic t ion where such an o f fe r o r so l i c i ta t ion wou ld be i l l ega l . I t i s fo r the genera l in fo rmat ion o f c l ien ts o f Ideas 1
s t
In fo rmat ion Serv ices Pvt . L td . I t does no t const i tu te a pe rsona l recommenda t ion o r take in to accoun t the pa r t i cu la rinvestmen t ob jec t i ves , f inanc ia l s i tua t ions, o r needs o f ind iv idua l c l ien ts .
We have rev iewed the repor t , and in so fa r as i t inc ludes cu rren t o r h is to r ica l in fo rmat ion , i t i s be l ieved to be re l iab lethough i ts accuracy o r comp le teness canno t be guaran teed . Ne i the r Ideas 1
s tIn fo rmat ion Serv ices Pvt . L td . , no r any
person connected wi th i t , accep ts any l iab i l i t y a r is ing f rom the use o f th is document . The rec ip ien ts o f th is ma te r ia lshou ld re ly on the i r own invest iga t ions and take the i r own p ro fess iona l adv ice . Pr ice and va lue o f the investmen tsre fe r red to in th is ma te r ia l may go up o r down. Past pe r fo rmance is no t a gu ide fo r fu tu re pe r fo rmance . Cer ta int ransact ions - inc lud ing those invo lv ing fu tu res , op t ions and o the r de r iva t i ves as we l l as non- investmen t g radesecur i t ies - invo lve substan t ia l r i sk and a re no t su i tab le fo r a l l investo rs . Repor ts based on techn ica l ana lys iscen te rs on s tudy ing char ts o f a s tock 's p r ice movement and t rad ing vo lume, as opposed to focus ing on a company 's
fundamenta ls and as such , may no t ma tch wi th a repor t on a company 's fundamenta ls .
Op in ions expressed a re ou r cu rren t op in ions as o f the da te appear ing on th is ma te r ia l on ly . Wh i le we endeavor toupda te on a reasonab le bas is the in fo rmat ion d iscussed in th is ma te r ia l , the re may be regu la to ry , comp l iance , o ro the r reasons tha t p reven t us f rom do ing so . Prospect ive investo rs and o the rs a re cau t ioned tha t any fo rward - look ingsta tements a re no t p red ic t ions and may be sub jec t to change wi thou t no t ice . Our p rop r ie ta ry t rad ing and investmen tbus inesses may make investmen t dec is ions tha t a re incons is ten t w i th the recommenda t ions expressed he re in .
We and ou r a f f i l i a tes , o f f i ce rs , d i rec to rs , and emp loyees wor ld w ide may: (a ) f rom t ime to t ime , have long o r shor tpos i t ions in , and buy o r se l l the secur i t ies the reo f , o f company ( ies) men t ioned he re in o r (b ) be engaged in any o the rt ransact ion invo lv ing such secur i t ies and ea rn b rokerage o r o the r compensa t ion o r ac t as a marke t maker in thef inanc ia l ins t ruments o f the company ( ies) d iscussed he re in o r ac t as adv iso r o r lender / bo rrower to such company( ies) o r have o the r po ten t ia l con f l i c t o f in te res t w i th respect to any recommenda t ion and re la ted in fo rmat ion andop in ions.
The ana lys t fo r th is repor t ce r t i f ies tha t a l l o f the v iews expressed in th is repor t accu ra te ly re f lec t h is o r he r pe rsona l
v iews abou t the sub jec t company o r compan ies and i ts o r the i r secur i t ies , and no pa r t o f h is o r he r compensa t ionwas, i s o r w i l l be , d i rec t l y o r ind i rec t l y re la ted to spec i f i c recommenda t ions o r v iews expressed in th is repor t . No pa r to f th is ma te r ia l may be dup l i ca ted in any fo rm and /o r red is t r ibu ted wi thou t Ideas 1
s tIn fo rmat ion Serv ices ’ p r io r
wr i t ten consen t . Th is document i s no t fo r pub l i c d is t r ibu t ion and has been fu rn ished to you s o le ly f o r your in fo rmat i onand must no t be rep roduced o r red is t r ibu ted to any o the r pe rson . Persons in to whose possess ion th is document maycome a re requ i red to observe these res t r i c t ions .