170
NATIONAL WETLAND ATLAS: JHARKHAND Space Applications centre Indian Space Research Organisation Ahmedabad – 380 015 Sponsored by Ministry of Environment and Forests Government of India
NATIONAL WETLAND ATLAS:
JHARKHAND
Space Applications centre Indian Space Research Organisation
Ahmedabad – 380 015
Sponsored by Ministry of Environment and Forests
Government of India

This publication deals with the updated database andstatus of wetlands, compiled in Atlas format. Increasingconcern about how our wetlands are being influenced hasled to formulation of a project entitled “National WetlandInventory and Assessment (NWIA)” to create an updateddatabase of the wetlands of India. The wetlands arecategorised under 19 classes and mapped using satelliteremote sensing data from Indian Remote SensingSatellite: IRS P6- LISS III sensor. The results areorganised at 1: 50, 000 scales at district, state andtopographic map sheet (Survey of India reference) levelusing Geographic Information System (GIS). Thispublication is a part of this national work and deals withthe wetland status of a particular State/Union Territory ofIndia, through text, statistical tables, satellite images,maps and ground photographs.
The atlas comprises wetland information arranged intonine sections. How the NWIA project work has beenexecuted highlighted in the first six sections viz:Introduction, NWIA project, Study area, Data used,Methodology, and Accuracy. This is the first time that highresolution digital remote sensing data has been used tomap and decipher the status of the wetlands at nationalscale. The methodology highlights how the four spectralbands of LISS III data (green, red, near infra red and shortwave infra red) have been used to derive various indicesand decipher information regarding water spread,turbidity and aquatic vegetation. Since, the aim was togenerate a GIS compatible database, details of thestandards of database are also highlighted in themethodology.
The results and finding are organised in three sections;viz: Maps and Statistics, Major wetland types, andImportant Wetlands of the area. The Maps and Statisticsare shown for state and district level. It gives details ofwhat type of wetlands exists in the area, how manynumbers in each type, their area estimates in hectare.Since, the hydrology of wetlands are influenced bymonsoon performance, extent of water spread and theirturbidity (qualitative) in wet and dry season (post-monsoon and pre-monsoon period) are also given.Similarly the status of aquatic vegetation (mainly floatingand emergent types) in two seasons is also accounted for.Status of small wetlands are also accounted as numbersand depicted in maps as points. Wetland map also showimportant ancillary information like roads/rail, relevanthabitations. False Colour Composite (FCC) of the satelliteimage used (any one season) is shown along with thederived wetland map to give a feeling of manifestation ofwetlands in remote sensing data and synoptic view of thearea. The status of some of the important wetlands likeRamsar sites, National Parks are shown with recent fieldphotographs.
For further details contact:
Director,Space Applications Centre, ISRO,Ambawadi Vistar (P.O.)Ahmedabad – 380 015

Atlas SAC/RESA/AFEG/NWIA/ATLAS/11/2010
NATIONAL WETLAND ATLAS: JHARKHAND
Sponsored by Ministry of Environment and Forests, Government of India
As a part of the project on National Wetland Inventory and Assessment (NWIA)
Space Applications Centre (ISRO), Ahmedabad and
Jharkhand Space Applications Centre, Ranchi
February 2010

First Publication: February 2010, Space Applications Centre (ISRO), Ahmedabad
Copyright: 2010, SAC, ISRO
This publication may be produced in whole or in part and in any form for education or non-profit uses, without special permission from the copyright holder, provided acknowledgement of source is made. SAC will appreciate a copy of any publication which uses this publication as a source.
Citation: National Wetland Atlas: Jharkhand, SAC/RESA/AFEG/NWIA/ATLAS/11/2010, Space Applications Centre,
ISRO, Ahmedabad, India, 154p Available from: Space Applications Centre, ISRO, Ahmedabad – 380 015, India Production: SAC carried out the work in collaboration with Jharkhand Space Application Centre, Ranchi, Sponsored by
Ministry of Environment and Forests, Govt. of India.

It gives me great pleasure to introduce this Atlas, the latest in a series, prepared by Space Applications Centre, Ahmedabad in connection with the National Wetland Inventory and Assessment Project. This Atlas maps and catalogues information on Wetlands across India using the latest in satellite imaging, one of the first of its kind. Wetlands are areas of land critical ecological significance that support a large variety of plant and animal species adapted to fluctuating water levels. Their identification and protection becomes very important. Utility-wise, wetlands directly and indirectly support millions of people in providing services such as food, fiber and raw materials. They play important roles in storm and flood control, in supply of clean water, along with other educational and recreational benefits. Despite these benefits, wetlands are the first target of human interference and are among the most threatened of all natural resources. Around 50% of the earth’s wetlands are estimated to already have disappeared worldwide over the last hundred years through conversion to industrial, agricultural and residential purposes. Even in current scenario, when the ecosystem services provided by wetlands are better understood - degradation and conversion of wetlands continues. Aware of their importance, the Government of India has formulated several policies and plans for the conservation and preservation of these crucial ecosystems. Realising the need of an updated geospatial data base of these natural resources as the pre-requisite for management and conservation planning, National Wetland Inventory and Assessment (NWIA) project was formulated as a joint vision of Ministry of Environment & Forestry, Govt. India, and Space Applications Centre (ISRO). I am told that the latest remote sensing data from Indian Remote Sensing satellite (IRS P6) have been used to map the wetlands. The present atlas is part of this project and highlights the results of the study state in terms of statistics of various types of wetlands, extent of water, aquatic vegetation and turbidity in pre and post monsoon period. I also note that special efforts are made to provide detailed information of important wetlands like Ramsar sites, National Parks etc. I am certain that this Atlas will raise the bar in developing such database and will be of great use for researchers, planners, policy makers, and also members of the general public.
MESSAGE


Wetlands defined as areas of land that are either temporarily or permanently covered by water exhibit enormous diversity according to their genesis, geographical location, water regime and chemistry. Wetlands are one of the most productive ecosystems and play crucial role in hydrological cycle. Utility wise, wetlands directly and indirectly support millions of people in providing services such as storm and flood control, clean water supply, food, fiber and raw materials, scenic beauty, educational and recreational benefits. The Millennium Ecosystem Assessment estimates conservatively that wetlands cover seven percent of the earth’s surface and deliver 45% of the world’s natural productivity and ecosystem services. However, the very existence of these unique resources is under threat due to developmental activities, and population pressure. This calls for a long term planning for preservation and conservation of these resources. An updated and accurate database that will support research and decision is the first step towards this. Use of advanced techniques like Satellite remote sensing, Geographic Information System (GIS) is now essential for accurate and timely spatial database of large areas. Space Applications Centre (ISRO) took up this challenging task under the project “NWIA” (National Wetland Inventory and Assessment) sponsored by Ministry of Environment & Forests. To account for numerous small yet important wetlands found in the country, mapping at 1:50,000 scales has been taken up. Two date IRS LISS III data acquired during pre and post monsoon season are used for inventory to account for wet and dry season hydrology of wetlands. The map outputs include the status of water spread, aquatic vegetation and turbidity. Ancillary layers like road/rail, habitations are also created. Very small wetlands below the mappable unit are also identified and shown points. The results are complied as Atlases of wetlands for states/Union Territories of India. This Atlas highlights results for a particular state/UT and hopes to improve our understanding of the dynamics and distribution of wetlands and their status in the area. I congratulate the team for bringing out this informative atlas and sincerely hope that this will serve as a useful source of information to researchers, planners and general public.
January 25, 2010
FOREWORD


ACKNOWLEDGEMENTS
The project “National Wetland Inventory & Assessment (NWIA)”, is sponsored by Ministry of Environment & Forestry (MoEF), Govt. of India and executed by Space Applications Centre, ISRO, Ahmedabad. We are grateful to Dr. Ranganath R. Navalgund, Director, Space Applications Centre, for his encouragement to take up this challenging task and formulation of the project team for timely implementation. Earnest thanks are also due to Dr. Jai Singh Parihar, Dy. Director, Remote Sensing Applications Area, Space Applications Centre, for providing overall guidance and support to the project. The present Atlas for the state of Jharkhand is a part of the “National Wetland Atlas. This project has benefited from the wisdom of many people. It is a pleasure to acknowledge the contributions made by the wetland experts especially to Prof. C.K. Varshney, Former Dean, School of Environmental Sciences, Jawaharlal Nehru University, New Delhi, Prof. A.R. Yousuf, The University of Kashmir, Srinagar, Prof. Pradeeep Shrivastava, Head, Wetland Research Centre, Barakatullah University, Bhopal, Dr. Prikshit Gautam, Director, WWF-India, Dr. S. Narendra Prasad, Salim Ali Centre for Ornithology and Nature, Coimbtore and Dr. R.K. Suri, Additional Director, Ministry of Environment and Forests, Govt. of India, New Delhi, and the database experts from ISRO who participated in the peer Review meeting to finalise the “Wetland Classification System” followed in this project We acknowledge the positive role played by 16th SC-B (Standing Committee on Bioresources and Environment) of NNRMS (National Natural Resources Management System) meeting in formulating this project. We are extremely thankful to the members of the“Steering Committee” of the project, under the chairmanship of Dr E J James, Director – Water Institute, Karunya University, for their periodical review, critical comments and appreciation of the efforts by the project team. We are thankful to SC-B under the chairmanship of Secretary, MoEF, for periodic review of the progress of the project and guidance towards timely completion of the work. We acknowledge the valuable contributions made by Dr J K Garg, the then scientist of SAC for his active role in formulation of this project, co-authoring the procedure manual document. We are grateful to Dr G V Subramanyam, Adviser, MoEF, for his very active and positive role for implementation of the project. We are thankful to Dr Jag Ram, Director, MoEF and Dr Harendra Kharwal, MoEF for their support in budget and project management related issues. We acknowledge the support received from Dr P S Roy, Dy Director, NRSC and Dr S Sudhakar, Head, LRD, NRSC in terms of valuable suggestions and providing the geo-referenced image of NRC-LU&LC project for use as master image in this project. We are thankful to the “Technical Review” team of SAC for critical comments and suggestion to finalise the Atlas. We thank Dr R D Shah, Mr Pragnesh Kumar Vaishnav and Ms Yatisha P Vaishnav, Geology Department, M G Science Institute, Ahmedabad for their support in finalization of GIS database.


PROJECT TEAM
Project Director: Dr. (Mrs) Sushma Panigrahy
Space Applications Centre, Ahmedabad
Shri T. V. R. Murthy
Shri J. G. Patel
Shri N. M. Suthar
Jharkahnd Space Application Center, Ranchi Dr. A.T. Jayaseelan
Dr. Neeraj Kumar Sharma
Ms Nishi Jaya Kullu
Mr. Pradeep Kumar Swain
Ms Shashi Poonam Indwar


CONTENTS
1.0 INTRODUCTION 1.1 Wetlands 1.2 Mapping and geospatial techniques 1.3 Wetland Inventory of India 2.0 NATIONAL WETLAND INVENTORY AND ASSESSMENT 2.1 Wetland Classification System 2.2 GIS database contents 3.0 STUDY AREA 4.0 DATA USED 5.0 METHODOLOGY 5.1 Creation of spatial framework 5.2 Geo-referencing of satellite data 5.3 Mapping of wetlands 5.4 Conversion of the conformation into a vector layer 5.5 Generation of reference layers 5.6 Coding and attribute scheme 5.7 Map composition and output 6.0 ACCURACY ASSESSMENT 7.0 WETLANDS OF JHARKHAND: MAPS AND STATISTICS 7.1 District-wise Wetland Maps and Statistics 7.1.1 Garhwa 7.1.2 Palamu 7.1.3 Chatra 7.1.4 Hazaribagh 7.1.5 Kodarma 7.1.6 Giridih 7.1.7 Deoghar 7.1.8 Godda 7.1.9 Sahibganj 7.1.10 Pakur 7.1.11 Dumka 7.1.12 Dhanbad 7.1.13 Bokaro 7.1.14 Ranchi 7.1.15 Lohardaga 7.1.16 Gumla 7.1.17 Pashchimi Singhbhum 7.1.18 Purbi Singhbhum 8.0 MAJOR WETLAND TYPES OF JHARKHAND 9.0 IMPORTANT WETLANDS OF JHARKHAND SOI MAPSHEET-WISE WETLAND MAPS References Annexure–I: Definitions of wetland categories used in the project. Annexure–II: Details of district information followed in the atlas
List of Figures
Figure 1: Spectral Signature of various targets Figure 2: Various land features as they appear in four spectral bands and in a typical three band FCC. Figure 3: Location map Figure 4: Spatial framework of Jharkhand Figure 5: IRS P6 LISS-III coverage (path-row) of Jharkhand Figure 6: Mosaic of IRS LISS-III FCC (Post-monsoon-2006 and Pre-monsoon-2007) of Jharkhand Figure 7: Flow chart of the methodology used Figure 8: Steps in the extraction of wetland components Figure 9: Various combinations of the indices/spectral bands used to identify wetland components Figure 10: Type-wise wetland distribution in Jharkhand Figure 11: District-wise graphical distribution of wetlands Jharkhand List of Tables
Table 1: Wetland Classification System and coding Table 2: Satellite data used Table 3: Qualitative turbidity ratings Table 4: Area estimates of wetlands in Jharkhand Table 5: District-wise wetland area Table 6: Area estimates of wetlands in Garhwa Table 7: Area estimates of wetlands in Palamu Table 8: Area estimates of wetlands in Chatra Table 9: Area estimates of wetlands in Hazaribagh Table 10: Area estimates of wetlands in Kodarma Table 11: Area estimates of wetlands in Giridih Table 12: Area estimates of wetlands in Deoghar Table 13: Area estimates of wetlands in Godda Table 14: Area estimates of wetlands in Sahibganj Table 15: Area estimates of wetlands in Pakur Table 16: Area estimates of wetlands in Dumka Table 17: Area estimates of wetlands in Dhanbad Table 18: Area estimates of wetlands in Bokaro Table 19: Area estimates of wetlands in Ranchi Table 20: Area estimates of wetlands in Lohardaga Table 21: Area estimates of wetlands in Gumla Table 22: Area estimates of wetlands in Pashchimi Singhbhum Table 23: Area estimates of wetlands in Purbi Singhbhum
List of Plates
Plate-1: Major wetland types of Jharkhand Plate-2a, 2b, 2c and 2d: Field photographs and ground truth data of different wetland types in Jharkhand Plate 3: Udhwa Lake (Bird Sanctuary) Plate 4: Wetland map - 5 km buffer area of Udhwa Lake (Bird Sanctuary) Plate 5: IRS LISS-III FCC – 5 km buffer area of Udhwa Lake (Bird Sanctuary) Plate 6: Getalsud Reservoir Plate 7: Wetland map - 5 km buffer area of Getalsud Reservoir Plate 8: IRS LISS-III FCC – 5 km buffer area of Getalsud Reservoir Plate 9: Tilaiya Reservoir Plate 10: Wetland map - 5 km buffer area of Tilaiya Reservoir Plate 11: IRS LISS-III FCC – 5 km buffer area of Tilaiya Reservoir Plate 12: Konar Reservoir Plate 13: Wetland map - 5 km buffer area of Konar Reservoir Plate 14: IRS LISS-III FCC – 5 km buffer area of Konar Reservoir Plate 15: Tenughat Reservoir Plate 16: Wetland map - 5 km buffer area of Tenughat Reservoir Plate 17: IRS LISS-III FCC – 5 km buffer area of Tenughat Reservoir Plate 18: Massanjor Reservoir Plate 19: Wetland map - 5 km buffer area of Massanjor Reservoir Plate 20: IRS LISS-III FCC – 5 km buffer area of Massanjor Reservoir
1
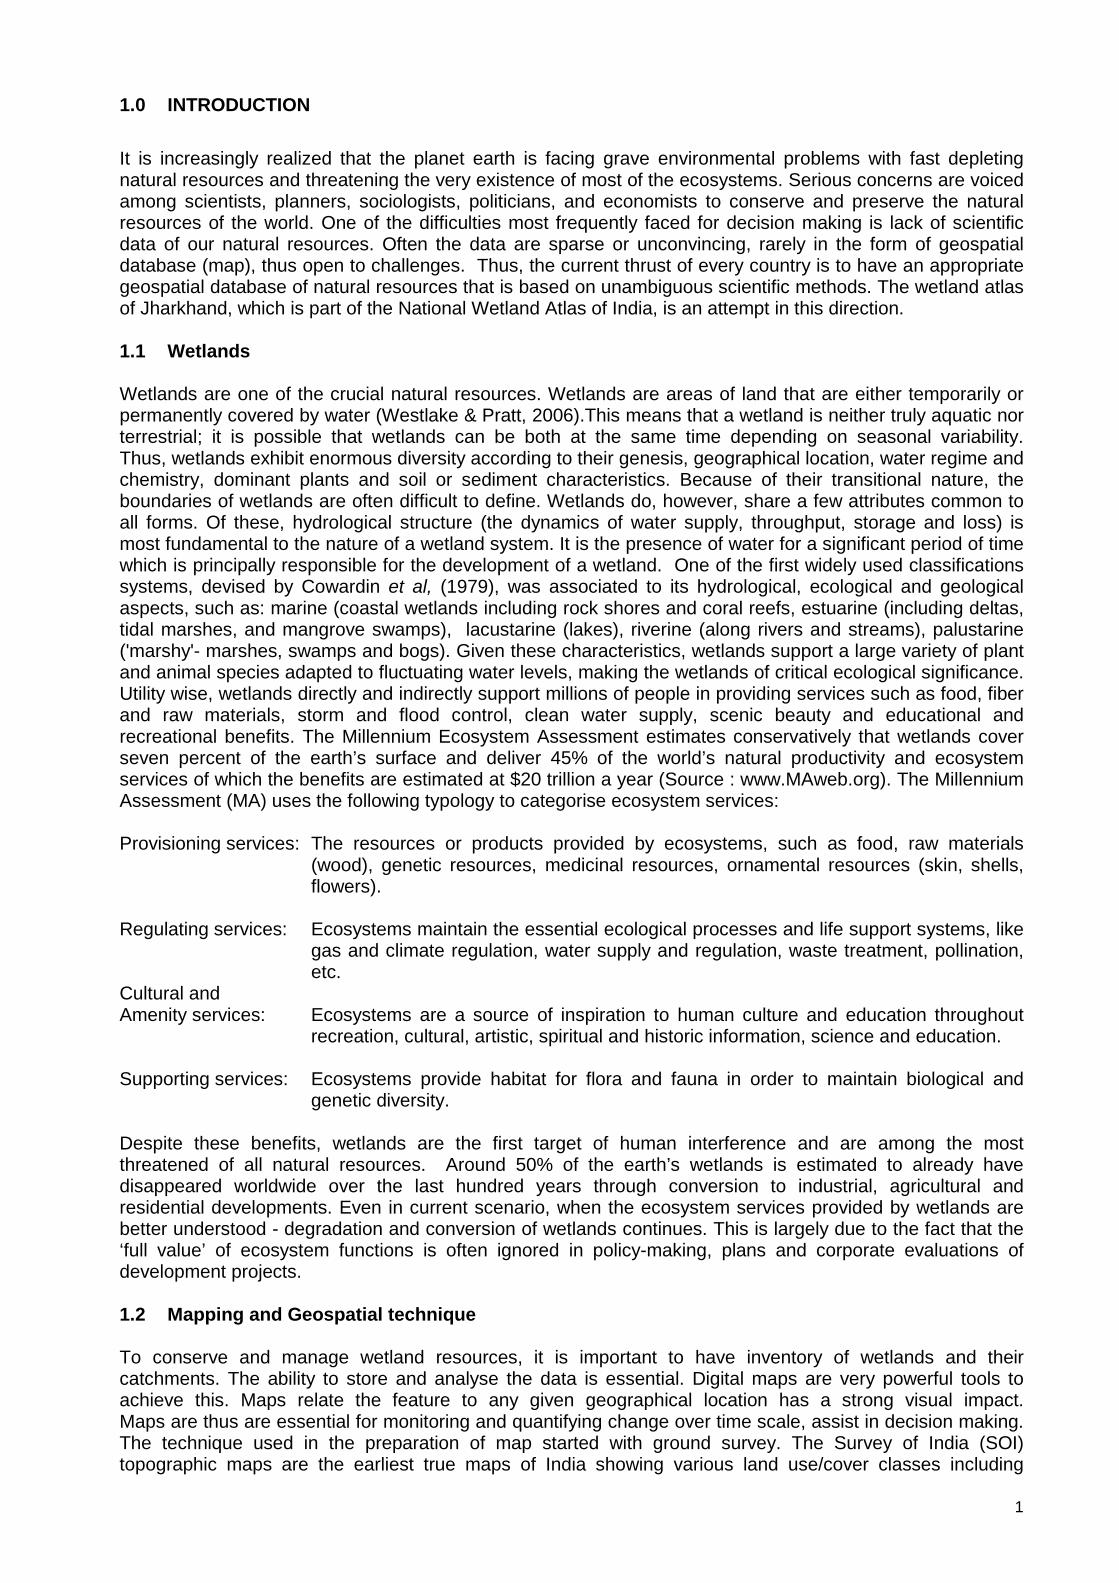
1.0 INTRODUCTION It is increasingly realized that the planet earth is facing grave environmental problems with fast depleting natural resources and threatening the very existence of most of the ecosystems. Serious concerns are voiced among scientists, planners, sociologists, politicians, and economists to conserve and preserve the natural resources of the world. One of the difficulties most frequently faced for decision making is lack of scientific data of our natural resources. Often the data are sparse or unconvincing, rarely in the form of geospatial database (map), thus open to challenges. Thus, the current thrust of every country is to have an appropriate geospatial database of natural resources that is based on unambiguous scientific methods. The wetland atlas of Jharkhand, which is part of the National Wetland Atlas of India, is an attempt in this direction. 1.1 Wetlands Wetlands are one of the crucial natural resources. Wetlands are areas of land that are either temporarily or permanently covered by water (Westlake & Pratt, 2006).This means that a wetland is neither truly aquatic nor terrestrial; it is possible that wetlands can be both at the same time depending on seasonal variability. Thus, wetlands exhibit enormous diversity according to their genesis, geographical location, water regime and chemistry, dominant plants and soil or sediment characteristics. Because of their transitional nature, the boundaries of wetlands are often difficult to define. Wetlands do, however, share a few attributes common to all forms. Of these, hydrological structure (the dynamics of water supply, throughput, storage and loss) is most fundamental to the nature of a wetland system. It is the presence of water for a significant period of time which is principally responsible for the development of a wetland. One of the first widely used classifications systems, devised by Cowardin et al, (1979), was associated to its hydrological, ecological and geological aspects, such as: marine (coastal wetlands including rock shores and coral reefs, estuarine (including deltas, tidal marshes, and mangrove swamps), lacustarine (lakes), riverine (along rivers and streams), palustarine ('marshy'- marshes, swamps and bogs). Given these characteristics, wetlands support a large variety of plant and animal species adapted to fluctuating water levels, making the wetlands of critical ecological significance. Utility wise, wetlands directly and indirectly support millions of people in providing services such as food, fiber and raw materials, storm and flood control, clean water supply, scenic beauty and educational and recreational benefits. The Millennium Ecosystem Assessment estimates conservatively that wetlands cover seven percent of the earth’s surface and deliver 45% of the world’s natural productivity and ecosystem services of which the benefits are estimated at $20 trillion a year (Source : www.MAweb.org). The Millennium Assessment (MA) uses the following typology to categorise ecosystem services: Provisioning services: The resources or products provided by ecosystems, such as food, raw materials
(wood), genetic resources, medicinal resources, ornamental resources (skin, shells, flowers).
Regulating services: Ecosystems maintain the essential ecological processes and life support systems, like
gas and climate regulation, water supply and regulation, waste treatment, pollination, etc.
Cultural and Amenity services: Ecosystems are a source of inspiration to human culture and education throughout
recreation, cultural, artistic, spiritual and historic information, science and education. Supporting services: Ecosystems provide habitat for flora and fauna in order to maintain biological and
genetic diversity. Despite these benefits, wetlands are the first target of human interference and are among the most threatened of all natural resources. Around 50% of the earth’s wetlands is estimated to already have disappeared worldwide over the last hundred years through conversion to industrial, agricultural and residential developments. Even in current scenario, when the ecosystem services provided by wetlands are better understood - degradation and conversion of wetlands continues. This is largely due to the fact that the ‘full value’ of ecosystem functions is often ignored in policy-making, plans and corporate evaluations of development projects. 1.2 Mapping and Geospatial technique To conserve and manage wetland resources, it is important to have inventory of wetlands and their catchments. The ability to store and analyse the data is essential. Digital maps are very powerful tools to achieve this. Maps relate the feature to any given geographical location has a strong visual impact. Maps are thus are essential for monitoring and quantifying change over time scale, assist in decision making. The technique used in the preparation of map started with ground survey. The Survey of India (SOI) topographic maps are the earliest true maps of India showing various land use/cover classes including

2
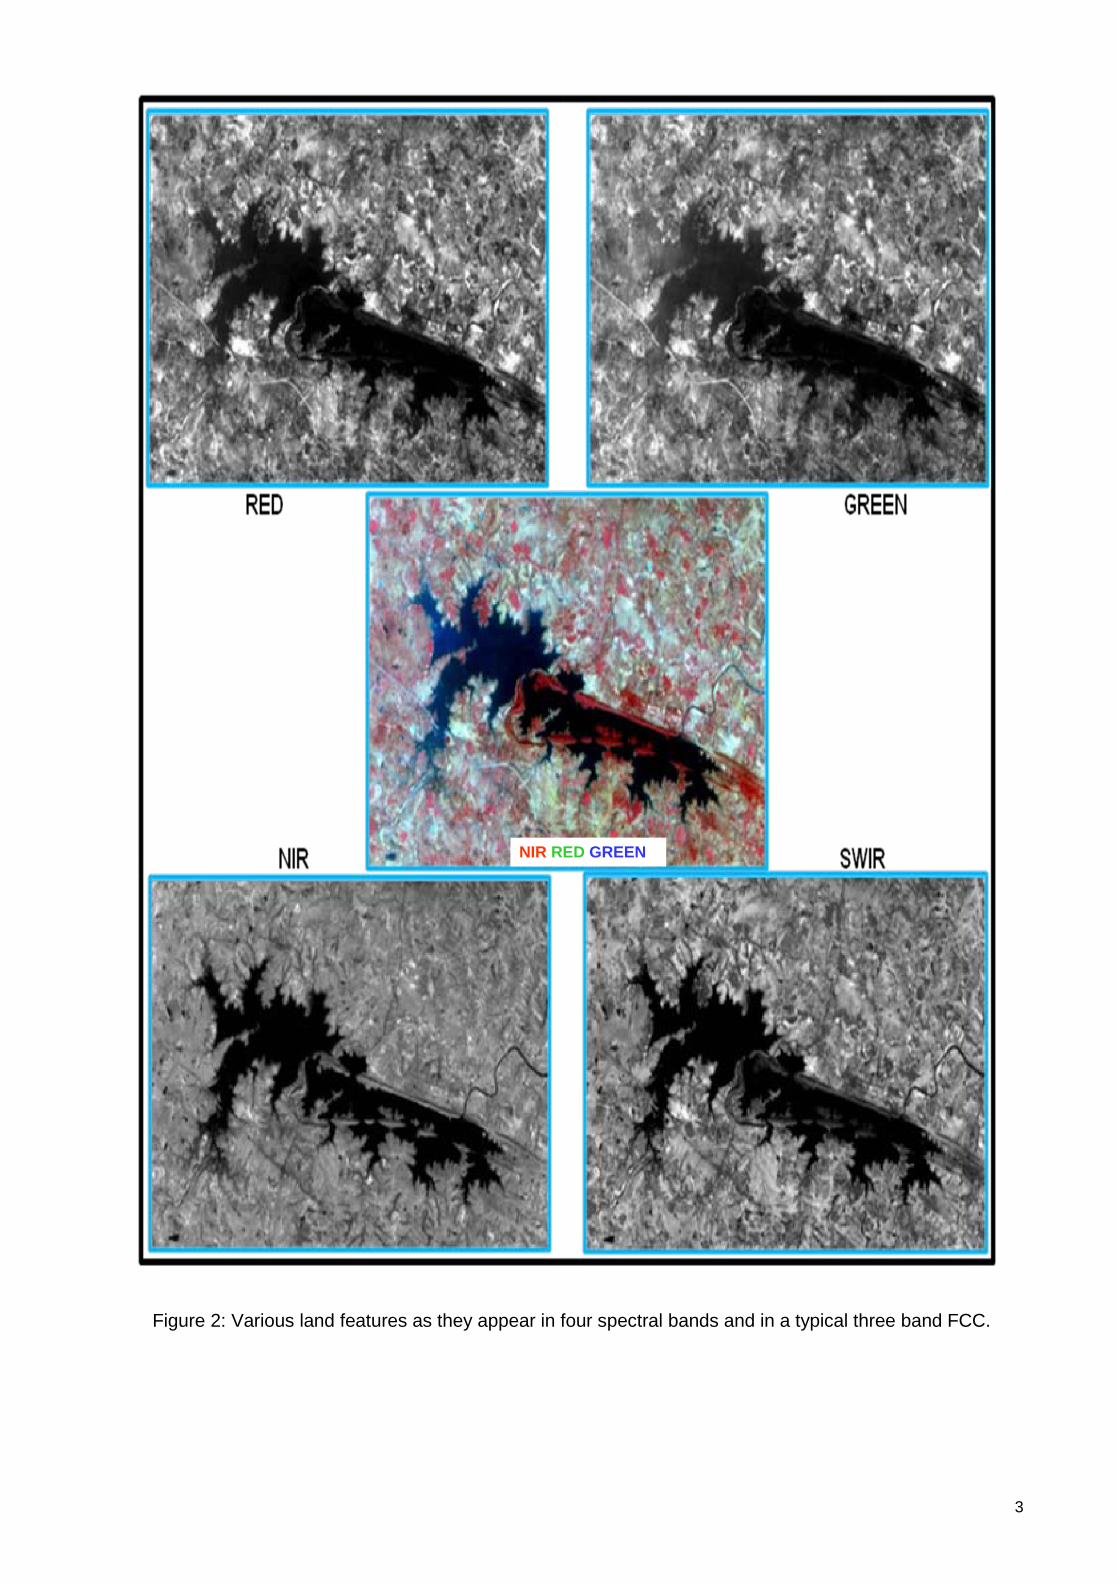
wetlands. Recent years have seen advances in mapping technique to prepare maps with much more information. Of particular importance is the remote sensing and geographic information system (GIS) technique. Remote sensing is now recognized as an essential tool for viewing, analyzing, characterizing, and making decisions about land, water and atmospheric components. From a general perspective, remote sensing is the science of acquiring and analyzing information about objects or phenomena from a distance (Jensen, 2000; Lillesand and Keifer, 1987). Today, we define satellite remote sensing as the use of satellite borne sensors to observe, measure, and record the electromagnetic radiation (EMR) reflected or emitted by the earth and its environment for subsequent analysis and extraction of information. EMR sensors includes visible light, near-, mid- and far-infrared (thermal), microwave, and long-wave radio energy. The capability of multiple sources of information is unique to remote sensing. Of specific advantage is the spectral, temporal, and spatial resolution. Spectral resolution refers to the width or range of each spectral band being recorded. Since each target affects different wavelengths of incident energy differently, they are absorbed, reflected or transmitted in different proportions. Currently, there are many land resource remote sensing satellites that have sensors operating in the green, red, near infrared and short wave Infra red regions of the electromagnetic spectrum giving a definite spectral signature of various targets due to difference in radiation absorption and reflectance of targets. These sensors are of common use for land cover studies, including wetlands. Figure 1 shows typical spectral signature of few targets from green to SWIR region. Converted to image, in a typical false colour composite (FCC) created using NIR, red and green bands assigned as red, green and blue colour, the features become very distinct as shown in Figure 2. In FCC, the vegetation thus appears invariably red (due to high reflection in NIR from green leaves). Since the early 1960s, numerous satellite sensors have been launched into orbit to observe and monitor the earth and its environment. Most early satellite sensors acquired data for meteorological purposes. The advent of earth resources satellite sensors (those with a primary objective of mapping and monitoring land cover) occurred, when the first Landsat satellite was launched in July 1972. Currently, more than a dozen orbiting satellites of various types provide data crucial to improving our knowledge of the earth’s atmosphere, oceans, ice and snow, and land. Of particular interest to India is the indigenous series of satellites called Indian Remote Sensing satellites (IRS-Series). Since the launch of the first satellite IRS 1A in 1987, India has now a number of satellites providing data in multi-spectral bands with different spatial resolution. IRS P6/RESOURCESAT 1 is the current generation satellite that provides multi-spectral images in spatial resolution of 5.8 m (LISS IV), 23.5 m (LISS III) and 56m (AWiFS). Over the past few decades, Indian remote sensing data has been successfully used in various fields of natural resources (Navalgund et al.2002). Development of technologies like Geographic Information System (GIS) has enhanced the use of RS data to obtain accurate geospatial database. GIS specialises in handling related, spatially referenced data, combining mapped information with other data and acts as analytical tool for research and decision making. During the past few decades, technological advances in the field of satellite remote sensing (RS) sensors, computerized mapping techniques, global positioning system (GPS) and geographic information system (GIS) has enhanced the ability to capture more detailed and timely information about the natural resources at various scales catering to local, regional, national and global level study.
Figure 1: Spectral Signature of various targets
3
Figure 2: Various land features as they appear in four spectral bands and in a typical three band FCC.
NIR RED GREEN

4
1.3 Wetland Inventory of India India with its large geographical spread supports large and diverse wetland classes, some of which are unique. Wetlands, variously estimated to be occupying 1-5 per cent of geographical area of the country, support about a fifth of the known biodiversity. Like any other places in the world, there is a looming threat to the aquatic biodiversity of the Indian wetlands as they are often under a regime of unsustainable human pressures. Sustainable management of these assets therefore is highly relevant. Realising this, Govt. of India has initiated many appropriate steps in terms of policies, programmes and plans for the preservation and conservation of these ecosystems. India is a signatory to the Ramsar Convention for management of wetland, for conserving their biodiversity and wise use extending its scope to a wide variety of habitats, including rivers and lakes, coastal lagoons, mangroves, peatlands, coral reefs, and numerous human-made wetland, such as fish and shrimp ponds, farm ponds, irrigated agricultural land, salt pans reservoirs, gravel pits, sewage farms, and canals. The Ministry of Environment and Forests has identified a number of wetlands for conservation and management under the National Wetland Conservation Programme and some financial assistance is being provided to State Governments for various conservation activities through approval of the Management Action Plans. The need to have an updated map database of wetlands that will support such actions has long been realized. Mapping requires a standard classification system. Though there are many classification systems for wetlands in the world, the Ramsar classification system is the most preferred one. The 1971 Ramsar Convention on Wetlands of International Importance especially as Waterfowl Habitat is the oldest conservation convention. It owes its name to its place of adoption in Iran. It came into being due to serious decline in populations of waterfowl (mainly ducks) and conservation of habitats of migratory waterfowl. Convention provides framework for the conservation and ‘wise use’ of wetland biomes. Ramsar convention is the first modern global intergovernmental treaty on conservation and wise use of natural resources (www.ramsar.org). Ramsar convention entered into force in 1975. Under the text of the Convention (Article 1.1) wetlands are defined as: “areas of marsh, fen, peatland or water, whether natural or artificial, permanent or temporary, with water that is static or flowing, fresh, brackish or salt, including areas of marine water the depth of which at low tide does not exceed six meters”. In addition, the Convention (Article 2.1) provides that wetlands: “may incorporate riparian and coastal zones adjacent to the wetlands, and islands or bodies of marine water deeper than six meters at low tide lying within the wetlands”. The first scientific mapping of wetlands of India was carried out during1992-93 by Space Applications Centre (ISRO), Ahmedabad, at the behest of the Ministry of Environment and Forests (MoEF), Govt. of India using remote sensing data from Indian Remote Sensing satellites (IRS-Series). The mapping was done at 1:250,000 scale using IRS 1A LISS-I/II data of 1992-93 timeframe under the Nation-wide Wetland Mapping Project. Since, no suitable wetland classification existed for comprehensive inventory of wetlands in the country at that time, the project used a classification system based on Ramsar Convention definition of wetlands. The classification considers all parts of a water mass including its ecotonal area as wetland. In addition, fish and shrimp ponds, saltpans, reservoirs, gravel pits were also included as wetlands. This inventory put the wetland extent (inland as well as coastal) at about 8.26 million ha. (Garg et al, 1998). These estimates (24 categories) do not include rice/paddy fields, rivers, canals and irrigation channels. Further updating of wetland maps of India was carried out by SAC using IRS P6/Resourcesat AWiFS data of 2004-05 at 1:250000 scale. In recent years, a conservation atlas has been brought out by Salim Ali Centre for Ornithology and Natural History (SACON, 2004), which provide basic information required by stakeholders in both wetland habitat and species conservation. Space Applications Centre has carried out many pilot projects for development of GIS based wetland information system (Patel et al, 2003) and Lake Information system (Singh et al, 2003).

5
2.0 NATIONAL WETLAND INVENTORY AND ASSESSMENT (NWIA) PROJECT Realising the importance of many small wetlands that dot the Indian landscape, it has been unanimously felt that inventory of the wetlands at 1:50,000 scales is essential. The task seemed challenging in view of the vast geographic area of our country enriched with diverse wetland classes. Space Applications Centre with its experience in use of RS and GIS in the field of wetland studies, took up this challenging task. This is further strengthened by the fact that guidelines to create geospatial framework, codification scheme, data base structure etc. for natural resources survey has already been well established by the initiative of ISRO under various national level mapping projects. With this strength, the National Wetland Inventory and Assessment (NWIA) project was formulated by SAC, which was approved and funded by MoEF. The main objectives of the project are:
• To map the wetlands on 1:50000 scale using two date (pre and post monsoon) IRS LISS III digital data
following a standard wetland classification system.
• Integration of ancillary theme layers ( road, rail, settlements, drainage, administrative boundaries)
• Creation of a seamless database of the states and country in GIS environment.
• Preparation of State-wise wetland atlases
The project was initiated during 2007. The first task was to have a classification system that can be used by different types of users while amenable to database. An expert/peer group was formed and the peer review was held at SAC in June 2007 where wetland experts and database experts participated and finalized the classification system. It was agreed to follow the classification system that has been used for the earlier project of 1:250,000 scale, with slight modification. Modified National Wetland Classification system for wetland delineation and mapping comprise 19 wetland classes which are organized under a Level III hierarchical system. The definition of each wetland class and its interpretation method was finalized. The technical/procedure manual was prepared as the standard guideline for the project execution across the country (Garg and Patel, 2007). The present atlas is part of the national level data base and deals with the state of Jharkhand. 2.1 Wetland Classification System In the present project, Modified National Wetland Classification system is used for wetland delineation and mapping comprising 19 wetland classes which are organized under a Level III hierarchical system (Table 1). Level one has two classes: Inland and coastal, these are further bifurcated into two categories as: natural and man-made under which the 19 wetland classes are suitably placed. Two date data pertaining to pre-monsoon and post monsoon was used to confirm the classes. Wetlands put to agriculture use in any of the two dates are not included as wetland class. Definitions of wetland categories used in the project is given in Annexure-I. 2.2.1 Spatial Framework and GIS Database
The National Spatial Framework) (NSF) has been used as the spatial framework to create the database (Anon. 2005a). The database design and creation standard suggested by NRDB/NNRMS guidelines is followed. Feature codification scheme for every input element has been worked out keeping in view the nationwide administrative as well as natural hierarchy (State-district- within the feature class for each of the theme. All data elements are given a unique name, which are self explanatory with short forms. Following wetland layers are generated for each inland wetland: Wetland extent: As wetlands encompass open water, aquatic vegetation (submerged, floating and
emergent), the wetland boundary should ideally include all these. Satellite image gives a clear signature of the wetland extent from the imprint of water spread over the years.
Water spread: There are two layers representing post-monsoon and pre-monsoon water spread during
the year of data acquisition. Aquatic vegetation spread: The presence of vegetation in wetlands provides information about its
trophic condition. As is known, aquatic vegetation is of four types, viz. benthic, submerged, floating, and emergent. It is possible to delineate last two types of vegetation using optical remote sensing data.
6
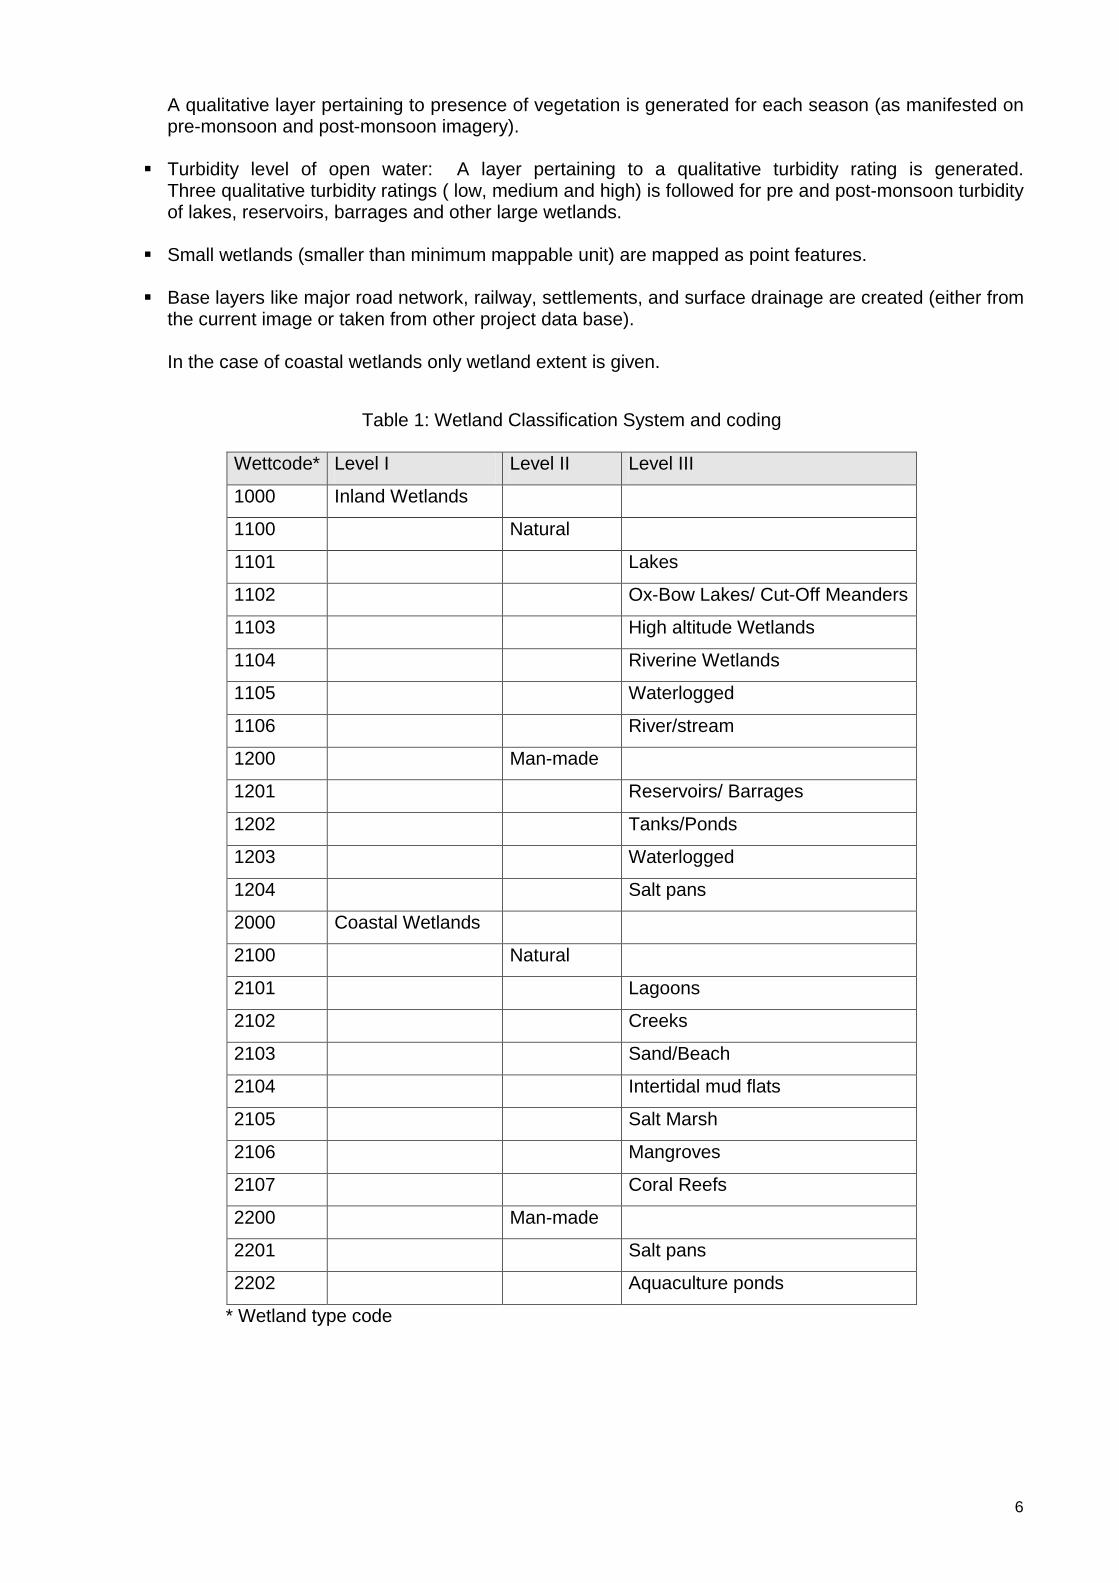
A qualitative layer pertaining to presence of vegetation is generated for each season (as manifested on pre-monsoon and post-monsoon imagery).
Turbidity level of open water: A layer pertaining to a qualitative turbidity rating is generated.
Three qualitative turbidity ratings ( low, medium and high) is followed for pre and post-monsoon turbidity of lakes, reservoirs, barrages and other large wetlands.
Small wetlands (smaller than minimum mappable unit) are mapped as point features.
Base layers like major road network, railway, settlements, and surface drainage are created (either from
the current image or taken from other project data base).
In the case of coastal wetlands only wetland extent is given.
Table 1: Wetland Classification System and coding
Wettcode* Level I Level II Level III
1000 Inland Wetlands
1100 Natural
1101 Lakes
1102 Ox-Bow Lakes/ Cut-Off Meanders
1103 High altitude Wetlands
1104 Riverine Wetlands
1105 Waterlogged
1106 River/stream
1200 Man-made
1201 Reservoirs/ Barrages
1202 Tanks/Ponds
1203 Waterlogged
1204 Salt pans
2000 Coastal Wetlands
2100 Natural
2101 Lagoons
2102 Creeks
2103 Sand/Beach
2104 Intertidal mud flats
2105 Salt Marsh
2106 Mangroves
2107 Coral Reefs
2200 Man-made
2201 Salt pans
2202 Aquaculture ponds
* Wetland type code

7
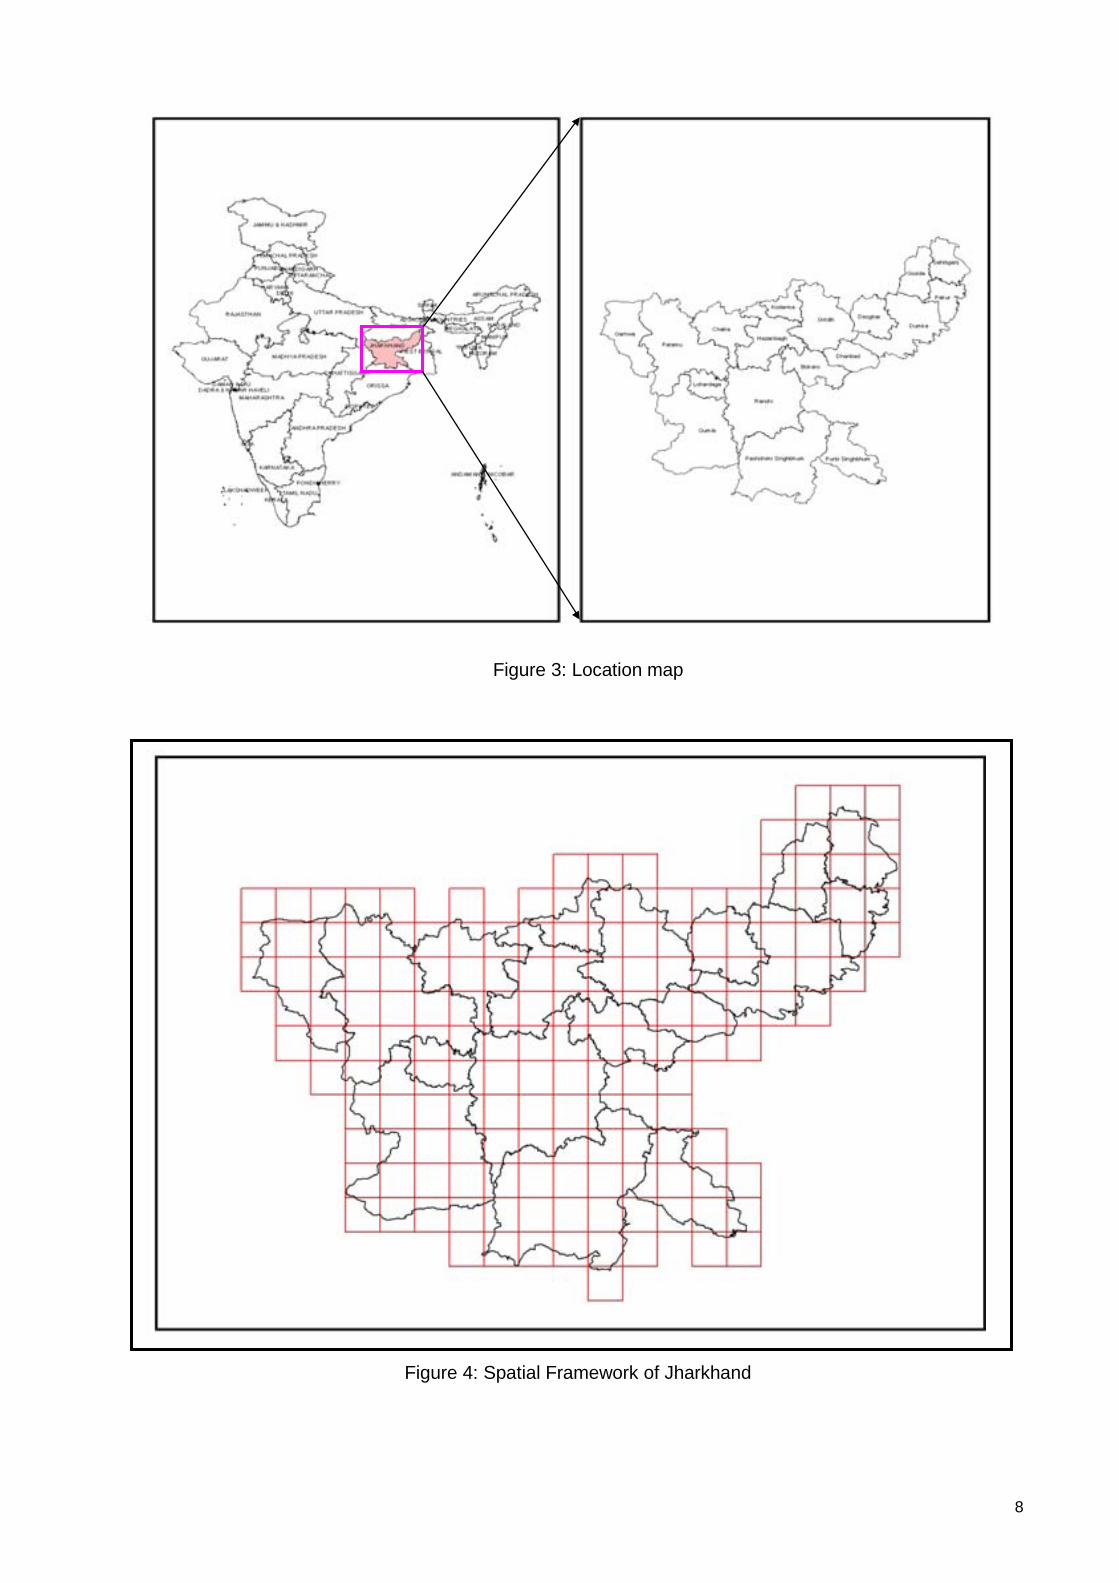
3.0 STUDY AREA The Jharkhand State is one of the newly established States of Indian Union carved out of the state of Bihar in
November 2000 separating 18 districts. The state has at present 24 districts. It comprises of the Chotanagpur
Plateau, which forms a part of Deccan bio-geographic province. It is a hilly undulating plateau characterized
by predominantly tropical forests and tribal settlements. The state is one of the largest producers of the
mineral resources of the country spreading over majority of the districts with a paradox to be among the
bottom lying states in terms of development. This State is endowed with natural resources that need to be
conserved and utilized in a sustainable manner for all-round development of the state in general and the
marginalized tribal population in particular. The total geographical area is 79,714 Sq km lies between 21o 58’
00” to 25o20' 00” N latitude and 83o 20' 00” to 87o 57' 00” E longitude (Figure 3). Jharkhand shares its border
with the states of Bihar in the north, Uttar Pradesh and Chhattisgarh in the west, Orissa to the south, and
West Bengal in the east.
Climate of the state in general is tropical with hot summers and cold winters. There are regional variations
and some parts of the state like Ranchi, Netarhat, and Parasnath have a pleasant climate even during the
summers. Maximum rainfall takes place during the months from July to September that accounts for more
than 90% of total rainfall in the state.
The major west-flowing rivers that crease the territory are: Ganga, Subernarekha, Damodar, Barakar, Son,
Sankh, Mayurakshi, North Koel , South Koel , Ajay, Gumani, Kharkai etc. The rivers of Jharkhand play an
integral role in the socio-economic aspect of the society. Damodar, Barakar, Koel and Subarnarekha are the
principal rivers of Jharkhand that largely contribute towards the agriculture in the territory. In fact, many dams
such as Konar, Maithon, Panchet and Tilaiya have been created, to manage the water of the rivers. Thermal
power stations at Bokaro and Patratu also contribute towards the economy of the state.
The important wetlands of Jharkhand are Udhwa lake bird sanctuary, Getalsud dam, Kansjor dam, Konar
dam, Tilaiya dam, Massanjore dam, Maithon dam and Tenughat dam.
According to the census 2001 the state has 18 districts covered in 163 on 1:50,000 scale of SOI
topographical maps that form the spatial frame work for mapping (Figure 4).
A detail of district information followed in the atlas is given in Annexure-II.
8
Figure 4: Spatial Framework of Jharkhand
Figure 3: Location map

9
4.0 DATA USED Remote sensing data IRS P6 LISS III data was used to map the wetlands. IRS P6 LISS III provides data in 4 spectral bands; green, red, Near Infra Red (NIR) and Short wave Infra Red (SWIR), with 23.5 m spatial resolution and 24 day repeat cycle. The spatial resolution is suitable for 1:50,000 scale mapping. The state of Jharkhand is covered in 15 IRS LISS III scenes (Figure 5). Two date data, one acquired during March-May and another during September-December were used to capture the pre-monsoon and post-monsoon hydrological variability of the wetlands respectively (Table-2). Figure 6 shows the overview of the part of study area as seen in the LISS III FCC of pre- monsoon and post-monsoon data respectively.
Figure 5: IRS P6 LISS-III coverage (path-row) of Jharkhand
Table-2: Satellite data used
S.N. Sensor Path-Row Pre- monsoon Date Post- monsoon 1 IRS-P6 LISS III 103-54 25May 2007 14November2006
2 IRS-P6 LISS III 103-55 25May 2007 14November2006
3 IRS-P6 LISS III 104-54 30May2007 19November2006
4 IRS-P6 LISS III 104-55 30May2007 19November2006
5 IRS-P6 LISS III 104-56 30May2007 19November2006
6 IRS-P6 LISS III 105-54 4June 2007 18December2006
7 IRS-P6 LISS III 105-55 17April2007 18December2006
8 IRS-P6 LISS III 105-56 17April2007 18December2006
9 IRS-P6 LISS III 105-57 22April2006 18December2006
10 IRS-P6 LISS III 106-54 29March2007 29November2006
11 IRS-P6 LISS III 106-55 29March2007 29November2006
12 IRS-P6 LISS III 106-56 29March2007 12September2006
13 IRS-P6 LISS III 106-57 22April2007 12September2006
14 IRS-P6 LISS III 107-54 03April2007 04December2006
15 IRS-P6 LISS III 107-55 03April2007 04December2006
Ground truth data Remote sensing techniques require certain amount of field observations called “ground truth” in order to convert into meaningful information. Such work involves visiting a number of test sites, usually taking the satellite dates. The location of the features is recorded using the GPS. The standard proforma as per the NWIA manual was used to record the field data.

10
Field photographs are also taken to record the water quality (subjective), status of aquatic vegetation and water spread. All field verification work has been done during May and December 2008. Other data Survey of India topographical maps (SOI) were used for reference purpose. Lineage data of National Wetland Maps at 1:250,000 scale was used for reference. 5.0 METHODOLOGY The methodology to create the state level atlas of wetlands is adhered to NWIA technical guidelines and procedure manual (Garg and Patel, 2007). The overview of the steps used is shown in Figure 7. Salient features of methodology adopted are
• Generation of spatial framework in GIS environment for database creation and organisation. • Geo-referencing of satellite data • Identification of wetland classes as per the classification system given in NWIA Manual and mapping of
the classes using a knowledge based digital classification and onscreen interpretation • Generation of base layers (rail, road network, settlements, drainage, administrative boundaries) from
satellite image and ancillary data. • Mosaicing/edge matching to create district and state level database. • Coding of the wetlands following the standard classification system and codification as per NWIA
manual. • Preparation of map compositions and generation of statistics • Outputs on A3 size prints and charts for atlas.
Work was carried out using ERDAS Imagine, Arc/Info and Arcgis software.
Figure 7: Flow chart of the methodology used
Legacy data Spatial frame work
On-screen interpretation/ Digital analysis
Geo-referenced images
GIS DATABASE (Wetland layers, Base layers)
Biological (Wetland vegetation)
Physical (Wetland type)
Ground truth
Morphometric (Wetland extent)
IRS P6 LISS III pre and post-monsoon data
NWIA Database Organisation (District, State, Country)
Analysis Atlases/Report
Base layers (Road, Settlement, drainage)
SOI topographic maps Admin. Boundaries (State, District)
Quality Check
Accuracy Assessment/ Quality Check

11
Figure 6: IRS LISS-III FCC (Post-monsoon-2006 and Pre-monsoon-2007) of part of Jharkhand
Post monsoon - 2006
Pre monsoon - 2007

12
5.1 Creation of spatial framework This is the most important task as the state forms a part of the national frame work and is covered in multiple map sheets. To create NWIA database, NNRMS/NRDB standards is followed and four corners of the 1:50,000 (15’ x 15’) grid is taken as the tics or registration points to create each map taking master grid as the reference. Spatial framework details are given in NWIA manual (Garg and Patel, 2007). The spatial framework for Jharkhand state is shown in Figure 4. 5.2 Geo-referencing of satellite data In this step the raw satellite images were converted to specific map projection using geometric correction. This is done using archived geometrically corrected LISS III data (ISRO-NRC-land use / land cover project). Standard image processing software was used for geo-referencing. First one date data was registered with the archived image. The second date data was then registered with the first date data. 5.3 Mapping of wetlands The delineation of wetlands through image analysis forms the foundation for deriving all wetland classes and results. Consequently, a great deal of emphasis has been placed on the quality of the image Interpretation. In the present study, the mapping of wetlands was done following digital classification and onscreen visual interpretation. Wetlands were identified based on vegetation, visible hydrology and geography. There are various methods for extraction of water information from remote sensing imagery, which according to the number of bands used, are generally divided into two categories, i.e. Single-band and multi-band methods. Single-band method usually involves choosing a band from multi-spectral image to distinguish water from land by subjective threshold values. It may lead to over- or under-estimation of open water area. Multi-band method takes advantage of reflective differences of each band. In this project, five indices known in literature that enhances various wetland characteristics were used (McFeeters, 1996; Xu Hanqiu, 2006; Townshend and Justice, 1996; Tucker and Sellers, 1986; Lacaux et al, 2007) as given below: i) Normalised Difference Water Index (NDWI) = (Green-NIR) / (Green + NIR)
ii) Modified Normalised Difference Water Index (MNDWI) = (Green-MIR) / (Green + MIR)
iii) Normalised Difference Vegetation Index (NDVI) = (NIR - Red) / (NIR + Red)
iv) Normalised Difference Pond Index (NDPI) = (MIR – Green / MIR + Green)
v) Normalised Difference Turbidity Index (NDTI) = (Red – Green) / (Red + Green) The indices were generated using standard image processing software, stacked as layers. (Figure 8). Various combinations of the indices/spectral bands were used to identify the wetland features as shown in Figure 9. The following indices were used for various layer extractions:
• Extraction of wetland extent : MNDWI, NDPI and NDVI image was used to extract the wetland boundary through suitable hierarchical thresholds.
• Extraction of open water :
MNDWI was used within the wetland mask to delineate the water and no-water areas.
• Extraction of wetland vegetation : NDPI and NDVI image was used to generate the vegetation and no-vegetation areas within a wetland using a suitable threshold.
• Turbidity information extraction :
MNDWI image was used to generate qualitative turbidity level (high, moderate and low) based on signature statistics and standard deviations (Table-3). In the False Colour Composite (FCC) these generally appear in different hues.
Table 3: Qualitative turbidity based on Mean and Standard deviation observed in the MNDWI image
Sr. No. Conditional criteria Qualitative Turbidity
1. <= µ - 1σ High/Bottom reflectance
2. > -1σ to <= +1σ Moderate
3. > +1σ Low

13
5.4 Conversion of the raster (indices) into a vector layer The information on wetland extent, open water extent, vegetation extent and turbidity information was converted into vector layers using region growing properties or on-screen digitisation.
Figure 8: Steps in the extraction of wetland components 5.5 Generation of reference layers Base layers like major rail, road network, settlements, drainage are interpreted from the current image or taken from other project database. The administrative boundaries (district, state) are taken from the known reference data. 5.6 Coding and attribute scheme Feature codification scheme for every input element has been worked out keeping in view the nationwide administrative as well as natural hierarchy (State-district-taluka) within the feature class for each of the theme. All data elements are given a unique name/code, which are self explanatory with short forms. 5.7 Map composition and output Map composition for atlas has been done at district and state level. A standard color scheme has been used for the wetland classes and other layers. The digital files are made at 1:50,000 scale. The hard copy outputs are taken on A3 size.

14
6.0 ACCURACY ASSESSMENT A comprehensive accuracy assessment protocol has been followed for determining the quality of information
derived from remotely sensed data. Accuracy assessment involves determination of thematic (classification)
as well as locational accuracy. In addition, GIS database(s) contents have been also evaluated for accuracy.
To ensure the reliability of wetland status data, the project adhered to established quality assurance and
quality control measures for data collection, analysis, verification and reporting.
This study used well established, time-tested, fully documented data collection conventions. It employed
skilled and trained personnel for image interpretation, processing and digital database creation. All interpreted
imagery were reviewed by technical expert team for accuracy and code. The reviewing analyst adhered to all
standards, quality requirements and technical specifications and reviewed 100 percent of the work. The
various stages of quality check include:
1. Image-to-Image Geo-referencing/Data generation 2. Reference layer preparation using NWIA post monsoon and pre-monsoon LISS-III data. 3. Wetland mapping using visual/digital interpretation techniques. 4. Geo-data base creation and organization 5. Output products.
6.1 Data verification and quality assurance of output digital data files All digital data files were subjected to rigorous quality control inspections. Digital data verification included
quality control checks that addressed the geospatial correctness, digital integrity and some cartographic
aspects of the data. Implementation of quality checks ensured that the data conformed to the specified
criteria, thus achieving the project objectives. There were tremendous advantages in using newer
technologies to store and analyze the geographic data. The geospatial analysis capability built into this study
provided a complete digital database to better assist analysis of wetland change information. All digital data
files were subjected to rigorous quality control inspections. Automated checking modules incorporated in the
geographic information system (Arc/GIS) were used to correct digital artifacts including polygon topology.
Additional customized data inspections were made to ensure that the changes indicated at the image
interpretation stage were properly executed.

15
Figure 9: Various combinations of the indices/spectral bands used to identify wetland components
MNDWI NDPI NDVI
G R SWIR
G R NIR
NDWI NDPI NDVI
Useful for wetland vegetation & open water features
MNDWI is useful for qualitative turbidity delineation
TURBIDITY: LOW, MODERATE, HIGH
Tenughat Reservoir IRS LISS III data, 18 December
2006
Useful for wetland boundary extraction/delineation
Open water
Open water
Aquatic Vegetation

16

17
MAPS AND STATISTICS

18

19
7.0 WETLANDS OF JHARKHAND: MAPS AND STATISTICS Area estimates of various wetland categories for Jharkhand have been carried out using GIS layers of wetland boundary, water-spread, aquatic vegetation and turbidity. In the state of Jharkhand 2463 wetlands have been delineated. In addition 13227 wetlands smaller than 2.25 ha have also been discerned. Total wetland area estimated is 170051 ha (Table 4), which accounts for about 2.1 % of geographical area of Jharkhand. The major wetland types are River/Stream (97743 ha), Reservoirs (48177 ha), Tanks/Ponds (5688 ha), Lakes (3204 ha), Riverine wetlands (1629 ha), Waterlogged-Natural (231 ha), Ox-bow Lakes (83 ha), Waterlogged-Man-Made (61 ha) and Aquaculture Ponds (8 ha). There is a significant reduction (about 32 %) in the open water from 152879 in post-monsoon to 103225 ha in pre-monsoon. Wetlands in Jharkhand mostly indicate moderate turbidity (88410 ha) in post-monsoon and 64127 ha in pre-monsoon season. Extent of wetlands showing low turbidity is 21014 ha and 12147 ha in post monsoon and pre-monsoon season respectively. Turbidity in pre-monsoon season also followed a similar pattern with decreased area owing to the reduction in open water extent. Area under aquatic vegetation in pre-monsoon season is 7244 ha which is more than double that of post-monsoon season indicating submergence or reduction in growth of aquatic vegetation during post-monsoon season.
Table 4: Area estimates of wetlands in Jarkhand Area in ha
Sr. No. Wettcode Wetland Category
Number of
Wetlands
Total Wetland
Area
% of wetland
area
Open Water Post-
monsoon Area
Pre-monsoon
Area 1100 Inland Wetlands - Natural
1 1101 Lakes/Ponds 16 3204 1.88 1343 385 2 1102 Ox-bow lakes/ Cut-off meanders 18 83 0.05 71 70 3 1103 High altitude wetlands - - - - - 4 1104 Riverine wetlands 42 1629 0.96 781 552 5 1105 Waterlogged 58 231 0.14 231 16 6 1106 River/Stream 344 97743 57.48 97743 63442 1200 Inland Wetlands -Man-made 7 1201 Reservoirs/Barrages 1062 48177 28.33 47386 34476 8 1202 Tanks/Ponds 910 5688 3.34 5266 4241 9 1203 Waterlogged 11 61 0.04 50 35 10 1204 Salt pans 2 8 0.00 8 8 Sub-Total 2463 156824 92.22 152879 103225 Wetlands (<2.25 ha) 13227 13227 7.78 - - Total 15690 170051 100.00 152879 103225
Area under Aquatic Vegetation 3437 7244
Area under turbidity levels Low 21014 12774 Moderate 88410 64127 High 43455 26324
20
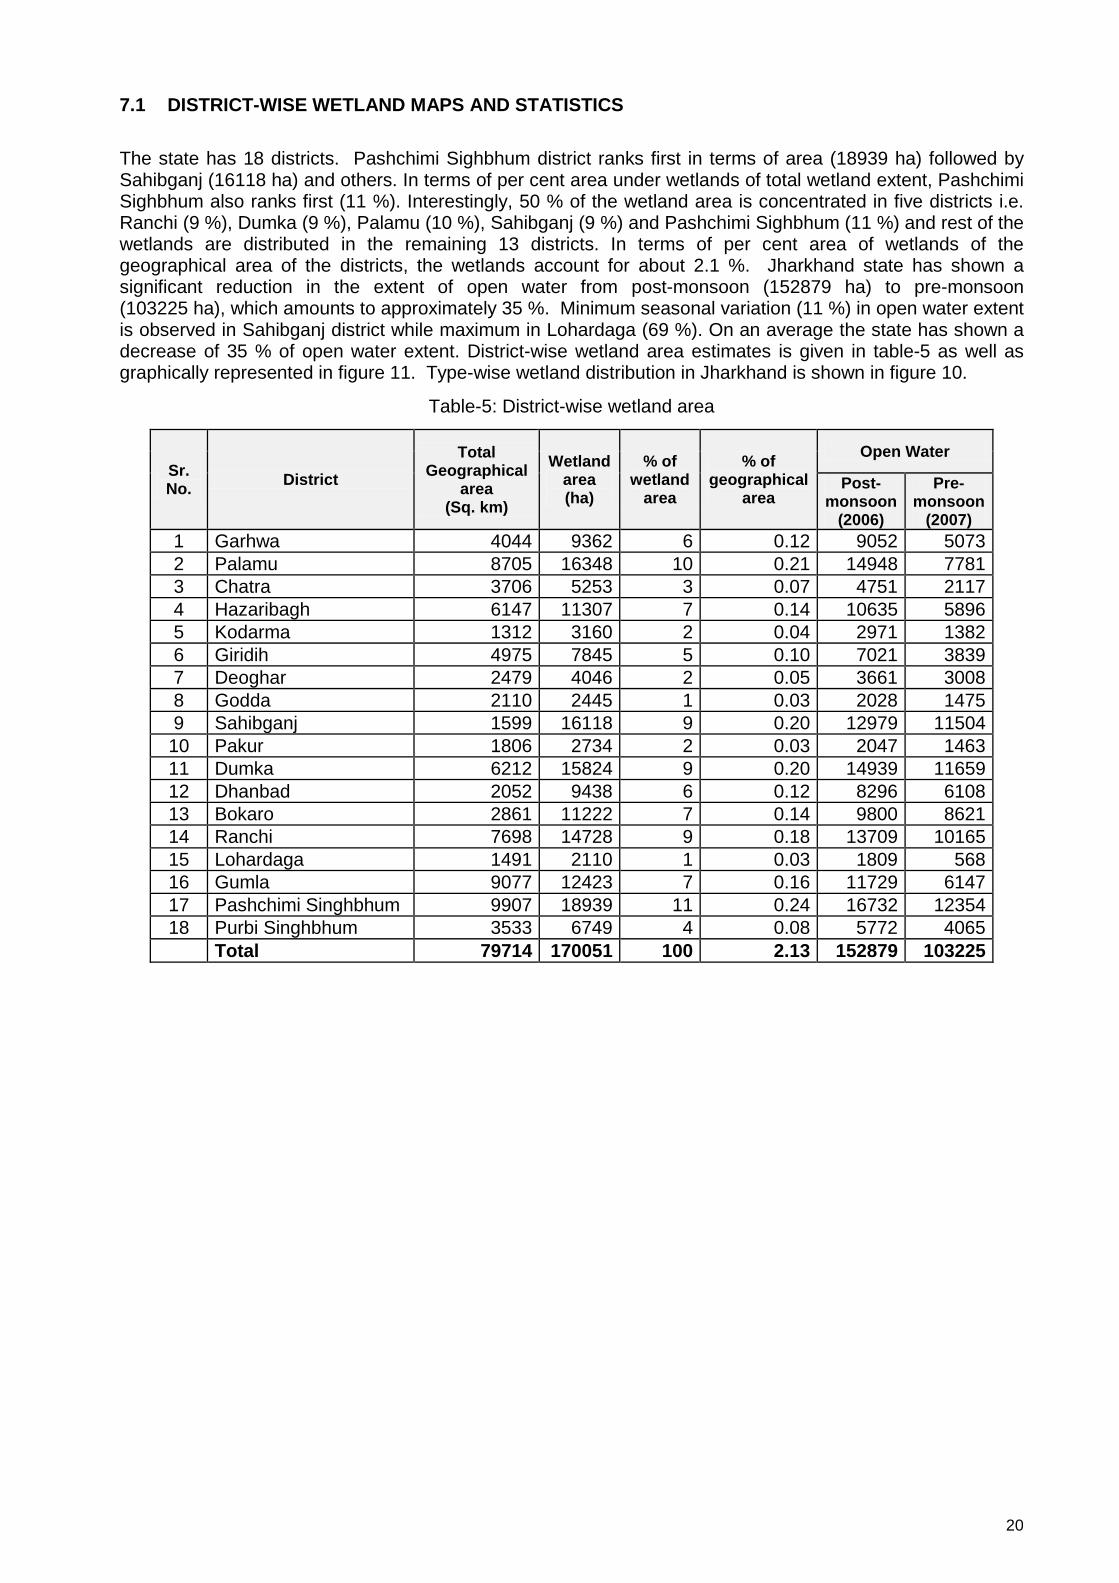
7.1 DISTRICT-WISE WETLAND MAPS AND STATISTICS The state has 18 districts. Pashchimi Sighbhum district ranks first in terms of area (18939 ha) followed by Sahibganj (16118 ha) and others. In terms of per cent area under wetlands of total wetland extent, Pashchimi Sighbhum also ranks first (11 %). Interestingly, 50 % of the wetland area is concentrated in five districts i.e. Ranchi (9 %), Dumka (9 %), Palamu (10 %), Sahibganj (9 %) and Pashchimi Sighbhum (11 %) and rest of the wetlands are distributed in the remaining 13 districts. In terms of per cent area of wetlands of the geographical area of the districts, the wetlands account for about 2.1 %. Jharkhand state has shown a significant reduction in the extent of open water from post-monsoon (152879 ha) to pre-monsoon (103225 ha), which amounts to approximately 35 %. Minimum seasonal variation (11 %) in open water extent is observed in Sahibganj district while maximum in Lohardaga (69 %). On an average the state has shown a decrease of 35 % of open water extent. District-wise wetland area estimates is given in table-5 as well as graphically represented in figure 11. Type-wise wetland distribution in Jharkhand is shown in figure 10.
Table-5: District-wise wetland area
Sr. No. District
Total Geographical
area (Sq. km)
Wetland area (ha)
% of wetland
area
% of geographical
area
Open Water
Post- monsoon
(2006)
Pre- monsoon
(2007) 1 Garhwa 4044 9362 6 0.12 9052 5073 2 Palamu 8705 16348 10 0.21 14948 7781 3 Chatra 3706 5253 3 0.07 4751 2117 4 Hazaribagh 6147 11307 7 0.14 10635 5896 5 Kodarma 1312 3160 2 0.04 2971 1382 6 Giridih 4975 7845 5 0.10 7021 3839 7 Deoghar 2479 4046 2 0.05 3661 3008 8 Godda 2110 2445 1 0.03 2028 1475 9 Sahibganj 1599 16118 9 0.20 12979 11504 10 Pakur 1806 2734 2 0.03 2047 1463 11 Dumka 6212 15824 9 0.20 14939 11659 12 Dhanbad 2052 9438 6 0.12 8296 6108 13 Bokaro 2861 11222 7 0.14 9800 8621 14 Ranchi 7698 14728 9 0.18 13709 10165 15 Lohardaga 1491 2110 1 0.03 1809 568 16 Gumla 9077 12423 7 0.16 11729 6147 17 Pashchimi Singhbhum 9907 18939 11 0.24 16732 12354 18 Purbi Singhbhum 3533 6749 4 0.08 5772 4065
Total 79714 170051 100 2.13 152879 103225

21
Figure 10: Type-wise wetland distribution in Jharkhand
Figure 11: District-wise graphical distribution of wetlands Jharkhand

22

23

24

25
26
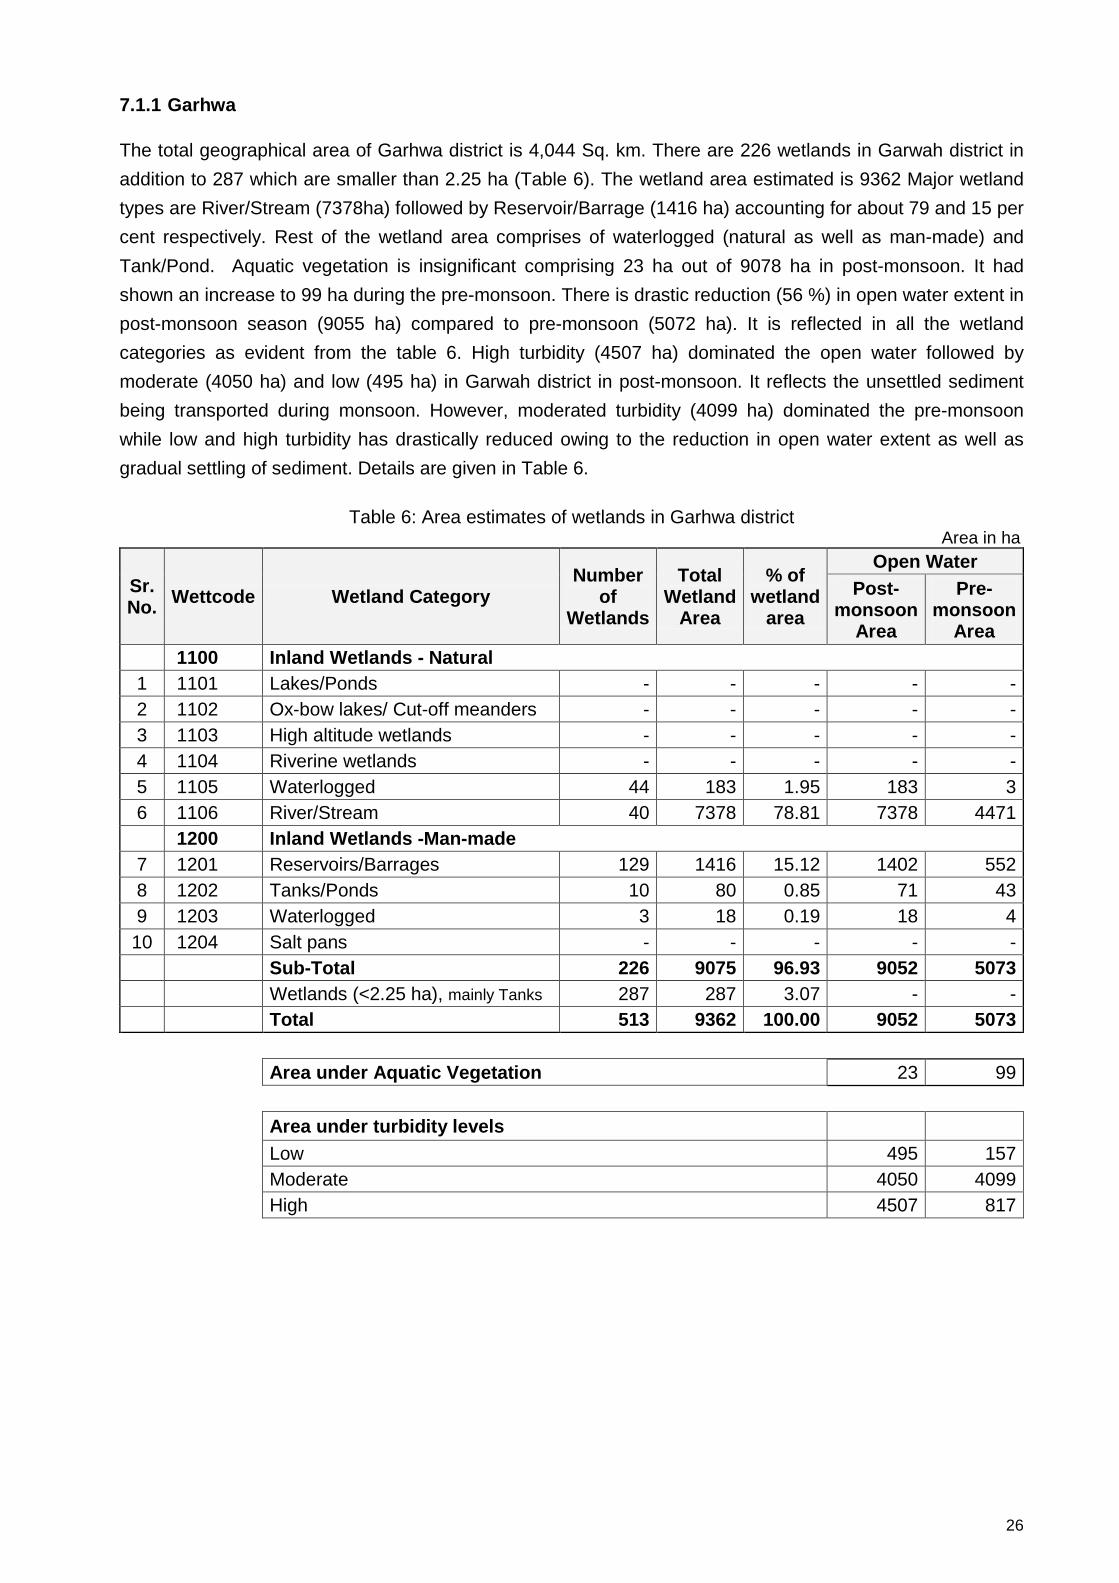
7.1.1 Garhwa The total geographical area of Garhwa district is 4,044 Sq. km. There are 226 wetlands in Garwah district in addition to 287 which are smaller than 2.25 ha (Table 6). The wetland area estimated is 9362 Major wetland types are River/Stream (7378ha) followed by Reservoir/Barrage (1416 ha) accounting for about 79 and 15 per cent respectively. Rest of the wetland area comprises of waterlogged (natural as well as man-made) and Tank/Pond. Aquatic vegetation is insignificant comprising 23 ha out of 9078 ha in post-monsoon. It had shown an increase to 99 ha during the pre-monsoon. There is drastic reduction (56 %) in open water extent in post-monsoon season (9055 ha) compared to pre-monsoon (5072 ha). It is reflected in all the wetland categories as evident from the table 6. High turbidity (4507 ha) dominated the open water followed by moderate (4050 ha) and low (495 ha) in Garwah district in post-monsoon. It reflects the unsettled sediment being transported during monsoon. However, moderated turbidity (4099 ha) dominated the pre-monsoon while low and high turbidity has drastically reduced owing to the reduction in open water extent as well as gradual settling of sediment. Details are given in Table 6.
Table 6: Area estimates of wetlands in Garhwa district
Area in ha
Sr. No. Wettcode Wetland Category
Number of
Wetlands
Total Wetland
Area
% of wetland
area
Open Water Post-
monsoon Area
Pre-monsoon
Area 1100 Inland Wetlands - Natural
1 1101 Lakes/Ponds - - - - - 2 1102 Ox-bow lakes/ Cut-off meanders - - - - - 3 1103 High altitude wetlands - - - - - 4 1104 Riverine wetlands - - - - - 5 1105 Waterlogged 44 183 1.95 183 3 6 1106 River/Stream 40 7378 78.81 7378 4471 1200 Inland Wetlands -Man-made 7 1201 Reservoirs/Barrages 129 1416 15.12 1402 552 8 1202 Tanks/Ponds 10 80 0.85 71 43 9 1203 Waterlogged 3 18 0.19 18 4 10 1204 Salt pans - - - - - Sub-Total 226 9075 96.93 9052 5073 Wetlands (<2.25 ha), mainly Tanks 287 287 3.07 - - Total 513 9362 100.00 9052 5073
Area under Aquatic Vegetation 23 99
Area under turbidity levels Low 495 157 Moderate 4050 4099 High 4507 817

27

28

29

30
7.1.2 Palamu The total geographical area of Palamu district is 8705 Sq. km. The wetland area estimated is 16348 ha which accounts for about 0.2 % of the geographical area of the district. River/Stream is the most dominant wetland type (12655 ha) comprising about 77 % of wetland area (table 7). Reservoir/Barrage (2095 ha) stands next comprising about 13 % of wetland area. Other categories like tank/Pond, Waterlogged areas and are insignificant in extent. It is important to mention that wetlands < 2.25 are significant in number (1359) and contribute about 8 % to wetland area (assumed to be each wetland as one ha). The open water extent has shown about 52 % reduction from post-monsoon (14948 ha) to pre-monsoon (7781 ha). Aquatic vegetation has an increase from 45 ha in post-monsoon to 76 ha in pre-monsoon. Qualitative turbidity remained dominantly moderate (8016 ha) followed by high (6551 ha) and low (381 ha) in post-monsoon season while similar trend is observed in pre-monsoon season also with decreased area in all the three turbidity levels viz. low, moderate and high as 268 ha, 5556 ha and 1957 ha respectively. Details are given in Table 7.
Table 7: Area estimates of wetlands in Palamu District
Area in ha
Sr. No. Wettcode Wetland Category
Number of
Wetlands
Total Wetland
Area
% of wetland
area
Open Water Post-
monsoon Area
Pre-monsoon
Area 1100 Inland Wetlands - Natural
1 1101 Lakes/Ponds - - - - - 2 1102 Ox-bow lakes/ Cut-off meanders - - - - - 3 1103 High altitude wetlands - - - - - 4 1104 Riverine wetlands 1 4 0.02 0 0 5 1105 Waterlogged 6 18 0.11 18 2 6 1106 River/Stream 47 12655 77.41 12655 6727 1200 Inland Wetlands -Man-made 7 1201 Reservoirs/Barrages 218 2095 12.82 2062 884 8 1202 Tanks/Ponds 38 209 1.28 209 165 9 1203 Waterlogged 2 8 0.05 4 3 10 1204 Salt pans - - - - - Sub-Total 312 14989 91.69 14948 7781 Wetlands (<2.25 ha), mainly Tanks 1359 1359 8.31 - - Total 1671 16348 100.00 14948 7781
Area under Aquatic Vegetation 45 76
Area under turbidity levels Low 381 268 Moderate 8016 5556 High 6551 1957

31

32

33

34
7.1.3 Chatra The total geographical area of Chatra district is 3,706 Sq. km. The wetland area estimated is 5253 ha comprising 179 wetlands > 2.25 ha and an additional 464 smaller wetlands (<2.25 ha). Like Plamu, this district is also wetland types are dominated by the River/Stream (3535 ha) and Reservoir/Barrage (854 ha) accounting for about 67 and 16 per cent area under wetlands. The next significant wetland type is Tank/Pond with 376 ha comprised of 70 numbers. There is drastic more than fifty per cent reduction in open water extent of 4751 ha in post-monsoon to 2117 ha in pre-monsoon. Aquatic vegetation has shown a marginal increase of 8 ha from 46 ha in post-monsoon to 54 ha in pre-monsoon. Qualitative turbidity is significantly remained moderate (3001) out of 4751 ha of open water extent in post-monsoon followed by high (1608 ha) and low (142 ha). Low turbidity has not been in observed in pre-monsoon season and moderate and high turbidity comprised 1366 ha and 751 ha out of 2117 ha of open water extent. Details are given in Table 8.
Table 8: Area estimates of wetlands in Chatra
Area in ha
Sr. No. Wettcode Wetland Category
Number of
Wetlands
Total Wetland
Area
% of wetland
area
Open Water Post-
monsoon Area
Pre-monsoon
Area 1100 Inland Wetlands - Natural
1 1101 Lakes/Ponds - - - - - 2 1102 Ox-bow lakes/ Cut-off meanders - - - - - 3 1103 High altitude wetlands - - - - - 4 1104 Riverine wetlands - - - - - 5 1105 Waterlogged 6 20 0.38 20 - 6 1106 River/Stream 21 3535 67.29 3535 1657 1200 Inland Wetlands -Man-made 7 1201 Reservoirs/Barrages 81 854 16.26 820 291 8 1202 Tanks/Ponds 70 376 7.16 376 157 9 1203 Waterlogged 1 4 0.08 - 12 10 1204 Salt pans - - - - - Sub-Total 179 4789 91.17 4751 2117 Wetlands (<2.25 ha), mainly Tanks 464 464 8.83 - - Total 643 5253 100.00 4751 2117
Area under Aquatic Vegetation 46 54
Area under turbidity levels Low 142 - Moderate 3001 1366 High 1608 751

35

36

37

38
7.1.4 Hazaribagh The total geographical area of Hazaribagh district is 6,147 Sq. km. The district comprises a sum of 770 wetlands out of which 181 are mapped as > 2.25 ha while 589 are < 2.25. These wetlands occupy an area of 11307 ha. Reservoir/Barrage (6571 ha) is observed to be a dominant type comprising about 58 per cent of wetland extent. The other dominant wetland type is represented by River/Stream (3780 ha), which accounts for about 33 per cent of area (Table 9). Even though the number of Tank/Pond (62) is significant, the contribution towards aerial extent is only about 3 per cent. The smaller wetlands (<2.25 ha) seems to be important, which contribute about 5 per cent of total wetland area in the district. The seasonal fluctuation is about 55 per cent and is reflected in all the wetland categories. Unlike Garwah and Palamu, the aquatic vegetation has shown a marginal decrease from post-monsoon (76 ha) to pre-monsoon (68 ha). Turbidity is dominated by moderate (4241 ha) and low (4171 ha) followed by high (2223 ha) in post-monsoon. However, in pre-monsoon the moderate turbidity (4287 ha) has dominated compared to low (466 ha) and high (1143 ha). Details are given in Table 9.
Table 9: Area estimates of wetlands in Hazaribagh
Area in ha
Sr. No. Wettcode Wetland Category
Number of
Wetlands
Total Wetland
Area
% of wetland
area
Open Water Post-
monsoon Area
Pre-monsoon
Area 1100 Inland Wetlands - Natural
1 1101 Lakes/Ponds - - - - - 2 1102 Ox-bow lakes/ Cut-off meanders - - - - - 3 1103 High altitude wetlands - - - - - 4 1104 Riverine wetlands 1 3 0.03 3 3 5 1105 Waterlogged 1 4 0.04 4 11 6 1106 River/Stream 19 3780 33.43 3780 1831 1200 Inland Wetlands -Man-made 7 1201 Reservoirs/Barrages 98 6571 58.11 6502 3792 8 1202 Tanks/Ponds 62 360 3.18 346 259 9 1203 Waterlogged - - - - - 10 1204 Salt pans - - - - - Sub-Total 181 10718 94.79 10635 5896 Wetlands (<2.25 ha), mainly Tanks 589 589 5.21 - - Total 770 11307 100.00 10635 5896
Area under Aquatic Vegetation 76 68
Area under turbidity levels Low 4171 466 Moderate 4241 4287 High 2223 1143

39

40
41

42
7.1.5 Kodarma The total geographical area of Kodarma district is 1,312 Sq. km. The wetland area is estimated to be 3160 ha comprising comparatively fewer wetlands (50) of > 2.25 ha and 189 wetlands of < 2.25 ha size. About 63 per cent under wetland extent is accounted by River/Stream (1995 ha) followed by 28 Reservoir/Barrage with 902 ha of aerial extent. Tank/Pond forms a meager 2.18 per cent of wetland area and waterlogged area constitutes a fraction of one per cent. Details are given in Table 10. The seasonal fluctuation is drastic (63 %) in open water extent from 2971 ha in post-monsoon to 1382 ha in pre-monsoon season. Aquatic vegetation is observed only in pre-monsoon season. Open water is dominated by moderate turbidity (1576 ha) followed by low (759 ha) and high (636 ha) in post-monsoon while in pre-monsoon the open water remained moderately turbid completely.
Table 10: Area estimates of wetlands in Kodarma
Area in ha
Sr. No. Wettcode Wetland Category
Number of
Wetlands
Total Wetland
Area
% of wetland
area
Open Water Post-
monsoon Area
Pre-monsoon
Area 1100 Inland Wetlands - Natural
1 1101 Lakes/Ponds - - - - - 2 1102 Ox-bow lakes/ Cut-off meanders - - - - - 3 1103 High altitude wetlands - - - - - 4 1104 Riverine wetlands - - - - - 5 1105 Waterlogged - - - - - 6 1106 River/Stream 8 1995 63.13 1995 647 1200 Inland Wetlands -Man-made 7 1201 Reservoirs/Barrages 28 902 28.54 902 666 8 1202 Tanks/Ponds 13 69 2.18 69 64 9 1203 Waterlogged 1 5 0.16 5 5 10 1204 Salt pans - - - - - Sub-Total 50 2971 94.02 2971 1382 Wetlands (<2.25 ha), mainly Tanks 189 189 5.98 - - Total 239 3160 100.00 2971 1382
Area under Aquatic Vegetation - 19
Area under turbidity levels Low 759 - Moderate 1576 1382 High 636 -

43

44

45

46
7.1.6 Giridih The total geographical area of Giridih district is 4,975 Sq. km. This district comprises of 7845 ha area under wetlands. The extent of these wetlands constitute 151 wetlands of > 2.25 ha and a significant 764 < smaller wetlands. River ranks first in extent (6217 ha) that accounts for about 80 per cent of wetland extent (Table 11). The reservoir/barrage and Tank/Pond constitute about 10 per cent and rest of 10 % is contributed by smaller wetlands. Open water has shown a reduction of 55 per cent from post-monsoon (7021 ha) to 3839 ha in pre-monsoon. It is mainly due to rain-fed seasonal river/stream which has shown a massive reduction while the other wetlands have not shown such drastic reduction. Aquatic vegetation has shown an increase in extent from post-monsoon (55 ha) to 75 ha in pre-monsoon. Open water remained predominantly moderate in turbidity in both post-monsoon as well as pre-monsoon seasons (5071 ha and 3186 ha respectively). Out of 7021 ha of open water extent in post-monsoon, 1950 ha is observed to be under highly turbid while in pre-monsoon it was 653 ha out 3839 ha of open water extent. Low turbidity has not been exhibited in any of the wetlands.
Table 11: Area estimates of wetlands in Giridih
Area in ha
Sr. No. Wettcode Wetland Category
Number of
Wetlands
Total Wetland
Area
% of wetland
area
Open Water Post-
monsoon Area
Pre-monsoon
Area 1100 Inland Wetlands - Natural
1 1101 Lakes/Ponds - - - - - 2 1102 Ox-bow lakes/ Cut-off meanders - - - - - 3 1103 High altitude wetlands - - - - - 4 1104 Riverine wetlands 2 21 0.27 15 8 5 1105 Waterlogged - - - - - 6 1106 River/Stream 24 6217 79.25 6217 3179 1200 Inland Wetlands -Man-made 7 1201 Reservoirs/Barrages 80 657 8.37 617 537 8 1202 Tanks/Ponds 45 186 2.37 172 115 9 1203 Waterlogged - - - - - 10 1204 Salt pans - - - - - Sub-Total 151 7081 90.26 7021 3839 Wetlands (<2.25 ha), mainly Tanks 764 764 9.74 - - Total 915 7845 100.00 7021 3839
Area under Aquatic Vegetation 55 75
Area under turbidity levels Low - - Moderate 5071 3186 High 1950 653
47

48

49

50
7.1.7 Deoghar The total geographical area of Deoghar district is 2,479 Sq. km. The wetland area estimated is 4046 ha constituting 491 wetlands, which includes 359 wetlands of < 2.25 ha (Table 12). Wetland area dominated by River/stream occupied 3166 ha of area. It accounted for about 78 % area and made the other two wetland types insignificant, which together comprised the rest of 12 % of area. Significantly the seasonal fluctuation in open water is much small compared to previous districts, which is only about 18 %. The Open water was estimated to be 3661 ha in post-monsoon, which was reduced to 3008 ha in pre-monsoon season. The area under aquatic vegetation is also small, which was observed to be 26 ha in post-monsoon and increased to 29 ha in pre-monsoon period. Open water is observed to be dominated by high turbidity in both the seasons (3014 ha and 2733 ha in post-monsoon and pre-monsoon seasons respectively). Low turbidity has not been encountered in this district while the moderate turbidity, which accounted for 674 ha in post-monsoon, has shown a reduction to 275 ha in pre-monsoon season. Details are given in Table 12.
Table 12: Area estimates of wetlands in Deoghar
Area in ha
Sr. No. Wettcode Wetland Category
Number of
Wetlands
Total Wetland
Area
% of wetland
area
Open Water Post-
monsoon Area
Pre-monsoon
Area 1100 Inland Wetlands - Natural
1 1101 Lakes/Ponds - - - - - 2 1102 Ox-bow lakes/ Cut-off meanders - - - - - 3 1103 High altitude wetlands - - - - - 4 1104 Riverine wetlands - - - - - 5 1105 Waterlogged - - - - - 6 1106 River/Stream 13 3166 78.25 3166 2733 1200 Inland Wetlands -Man-made 7 1201 Reservoirs/Barrages 66 293 7.24 277 140 8 1202 Tanks/Ponds 53 228 5.64 218 135 9 1203 Waterlogged - - - - - 10 1204 Salt pans - - - - - Sub-Total 132 3687 91.13 3661 3008
Wetlands (<2.25 ha), mainly Tanks 359 359 8.87 - -
Total 491 4046 100.00 3661 3008
Area under Aquatic Vegetation 26 29
Area under turbidity levels Low - - Moderate 647 275 High 3014 2733

51

52
53
54
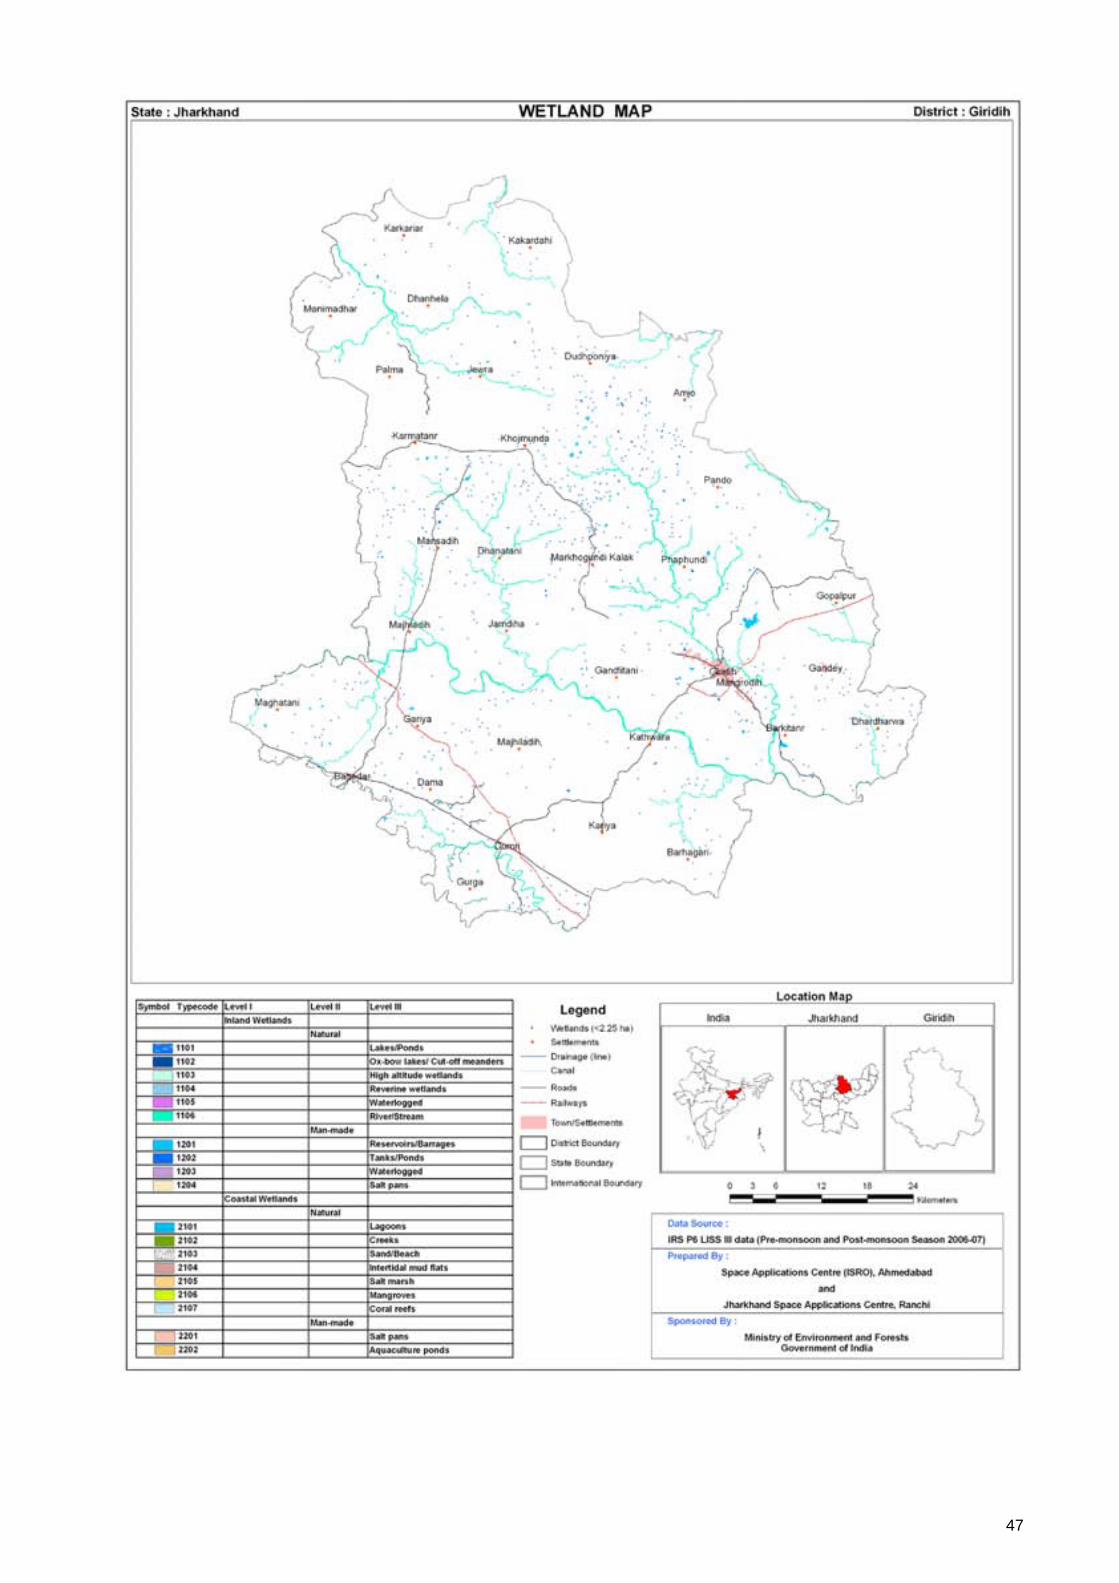
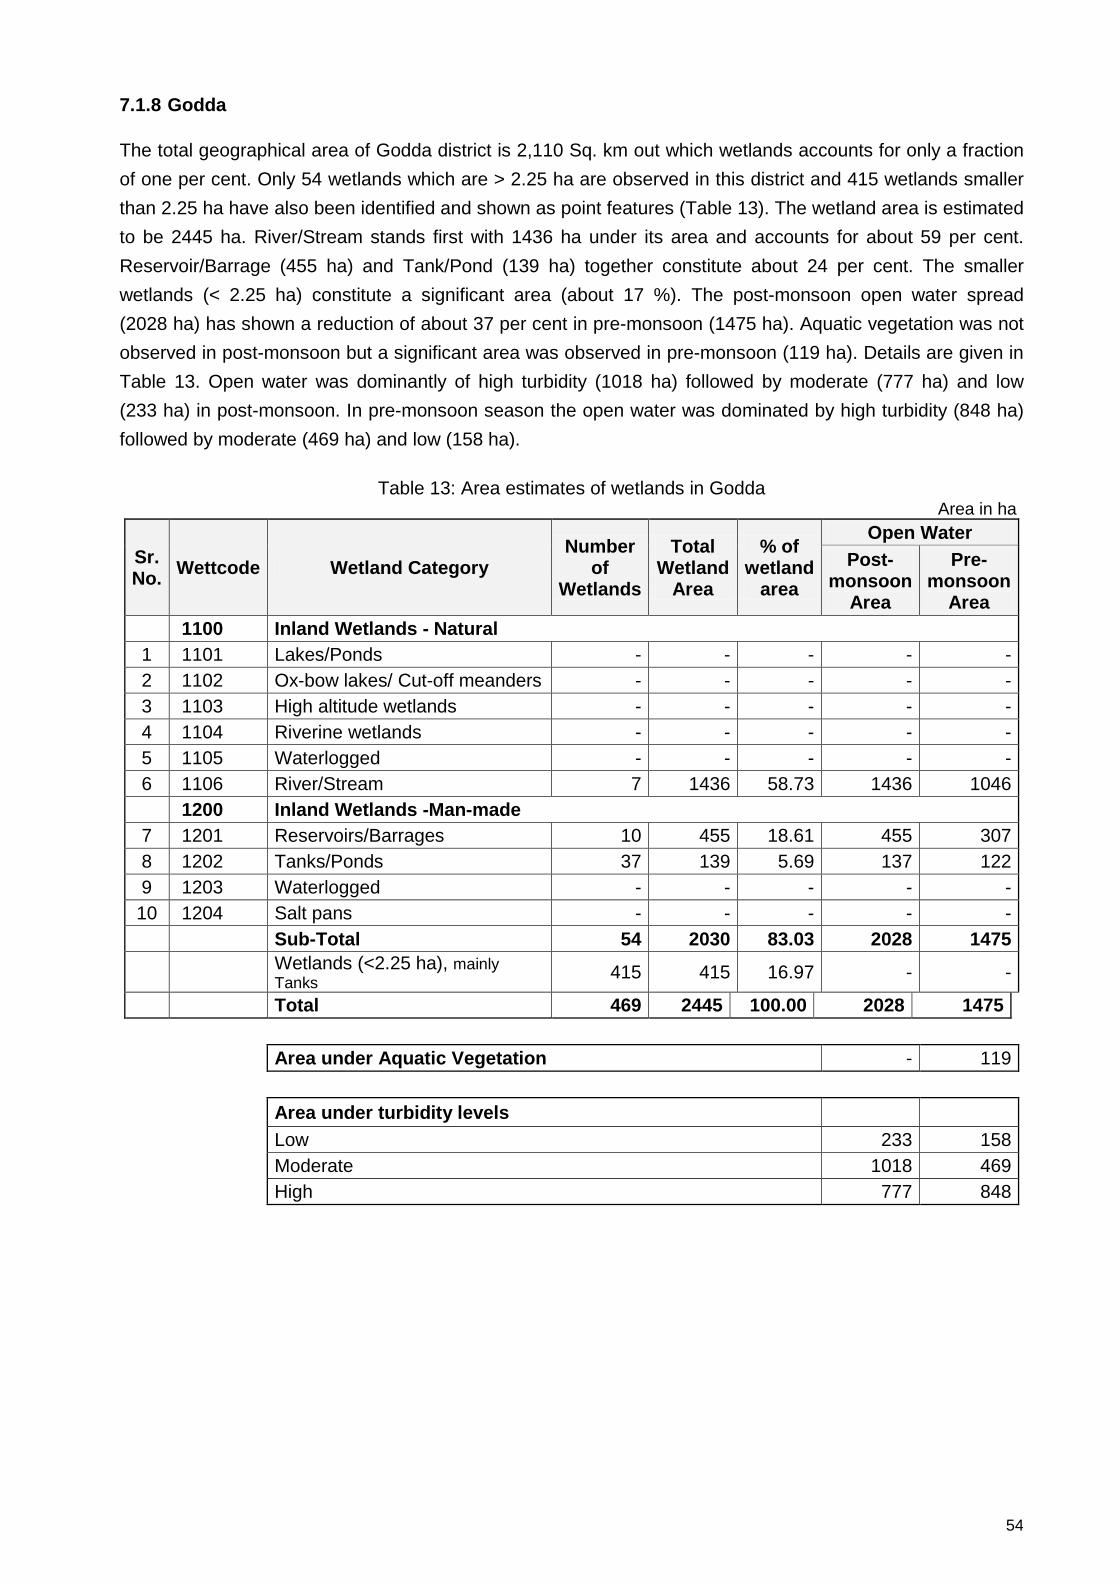
7.1.8 Godda The total geographical area of Godda district is 2,110 Sq. km out which wetlands accounts for only a fraction of one per cent. Only 54 wetlands which are > 2.25 ha are observed in this district and 415 wetlands smaller than 2.25 ha have also been identified and shown as point features (Table 13). The wetland area is estimated to be 2445 ha. River/Stream stands first with 1436 ha under its area and accounts for about 59 per cent. Reservoir/Barrage (455 ha) and Tank/Pond (139 ha) together constitute about 24 per cent. The smaller wetlands (< 2.25 ha) constitute a significant area (about 17 %). The post-monsoon open water spread (2028 ha) has shown a reduction of about 37 per cent in pre-monsoon (1475 ha). Aquatic vegetation was not observed in post-monsoon but a significant area was observed in pre-monsoon (119 ha). Details are given in Table 13. Open water was dominantly of high turbidity (1018 ha) followed by moderate (777 ha) and low (233 ha) in post-monsoon. In pre-monsoon season the open water was dominated by high turbidity (848 ha) followed by moderate (469 ha) and low (158 ha).
Table 13: Area estimates of wetlands in Godda
Area in ha
Sr. No. Wettcode Wetland Category
Number of
Wetlands
Total Wetland
Area
% of wetland
area
Open Water Post-
monsoon Area
Pre-monsoon
Area 1100 Inland Wetlands - Natural
1 1101 Lakes/Ponds - - - - - 2 1102 Ox-bow lakes/ Cut-off meanders - - - - - 3 1103 High altitude wetlands - - - - - 4 1104 Riverine wetlands - - - - - 5 1105 Waterlogged - - - - - 6 1106 River/Stream 7 1436 58.73 1436 1046 1200 Inland Wetlands -Man-made 7 1201 Reservoirs/Barrages 10 455 18.61 455 307 8 1202 Tanks/Ponds 37 139 5.69 137 122 9 1203 Waterlogged - - - - - 10 1204 Salt pans - - - - - Sub-Total 54 2030 83.03 2028 1475
Wetlands (<2.25 ha), mainly Tanks 415 415 16.97 - -
Total 469 2445 100.00 2028 1475
Area under Aquatic Vegetation - 119
Area under turbidity levels Low 233 158 Moderate 1018 469 High 777 848

55

56

57

58
7.1.9 Sahibganj The total geographical area of Sahibganj district is 1,599 Sq. km out which the wetlands constitute 0.2 per cent. The wetland area is estimated to be 16118 ha comprising 73 wetlands of > 2.25 ha and 482 wetlands of < 2.25 ha. Together there are 555 wetlands in this district. The seasonal fluctuation in open water is about 11 per cent. River/Stream ranked first in terms of area (11378 ha) accounting for about 71 per cent wetland area. However, presence of Lakes (2861 ha) had accounted for 18 per cent of area. Ox-bow lake/Cut-off meanders, Reservoir/ Barrage and Tank/Pond together comprised an area of about one per cent. There is reduction of about 11 per cent in open water extent from post-monsoon (12979 ha) to pre-monsoon (11504 ha). Open water dominantly remained moderately turbid followed by high and low in both the seasons. Details are given in Table 14. The presence of aquatic vegetation is observed to be significant constituent of wetlands in this district. It was estimated to be 2193 ha in post-monsoon accounting for about 14 per cent of wetland area and had shown an increase to 3392 ha in post-monsoon i.e. about 22 per cent.
Table 14: Area estimates of wetlands in Sahibganj Area in ha
Sr. No. Wettcode Wetland Category
Number of
Wetlands
Total Wetland
Area
% of wetland
area
Open Water Post-
monsoon Area
Pre-monsoon
Area 1100 Inland Wetlands - Natural
1 1101 Lakes/Ponds 10 2861 17.75 1018 345 2 1102 Ox-bow lakes/ Cut-off meanders 15 73 0.45 61 60 3 1103 High altitude wetlands - - - - - 4 1104 Riverine wetlands 14 1204 7.47 478 352 5 1105 Waterlogged - - - - - 6 1106 River/Stream 13 11378 70.59 11378 10703 1200 Inland Wetlands -Man-made 7 1201 Reservoirs/Barrages 3 16 0.10 10 7 8 1202 Tanks/Ponds 18 104 0.65 34 37 9 1203 Waterlogged - - - - - 10 1204 Salt pans - - - - - Sub-Total 73 15636 97.01 12979 11504 Wetlands (<2.25 ha), mainly Tanks 482 482 2.99 - - Total 555 16118 100.00 12979 11504
Area under Aquatic Vegetation 2193 3392
Area under turbidity levels Low 67 5 Moderate 12457 11235 High 455 264

59

60

61

62
7.1.10 Pakur There are 708 wetlands in Pakur district including 667 smaller than 2.25 ha. The area under wetlands constitute 2734 ha which accounts for a fraction of one per cent of the geographical area of Pakur district (1,806 Sq. km). These district show wider wetland types that include lake, ox-bow lakes/Cut-off meanders. River/Stream is the largest wetland category, which accounts for about 54 per cent of the area under wetlands (table 15). Lakes form a sizable fraction of wetlands that comprise about 12 % of area. Together, the rest of the categories account for 8 per cent of wetland area. The smaller wetlands (< 2.25 ha) comprise 667 in number and account for about 24 per cent of the wetland area (assuming that each one has an average area of one ha). Details are given in Table 15. Seasonal fluctuation in open water has shown a decrease of 29 per cent from post-monsoon (2047 ha) to pre-monsoon (1463 ha). This change is not large in case of River/Stream compared to other categories. Aquatic vegetation was a meager 20 ha in post-monsoon had shown a significant increase to 281 ha in pre-monsoon. Open water remained moderately turbid followed by high and low in both the seasons. However, in pre-monsoon low turbidity has not been exhibited by open water in this district.
Table 15: Area estimates of wetlands in Pakur Area in ha
Sr. No. Wettcode Wetland Category
Number of
Wetlands
Total Wetland
Area
% of wetland
area
Open Water Post-
monsoon Area
Pre-monsoon
Area 1100 Inland Wetlands - Natural
1 1101 Lakes/Ponds 5 322 11.78 304 19 2 1102 Ox-bow lakes/ Cut-off meanders 3 10 0.37 10 10 3 1103 High altitude wetlands - - - - - 4 1104 Riverine wetlands - - - - - 5 1105 Waterlogged - - - - - 6 1106 River/Stream 7 1466 53.62 1466 1292 1200 Inland Wetlands -Man-made 7 1201 Reservoirs/Barrages 5 73 2.67 73 43 8 1202 Tanks/Ponds 20 181 6.62 179 99 9 1203 Waterlogged 1 15 0.55 15 - 10 1204 Salt pans - - - - - Sub-Total 41 2067 75.60 2047 1463 Wetlands (<2.25 ha), mainly Tanks 667 667 24.40 - - Total 708 2734 100.00 2047 1463
Area under Aquatic Vegetation 20 281
Area under turbidity levels Low 79 - Moderate 1520 799 High 448 664

63

64
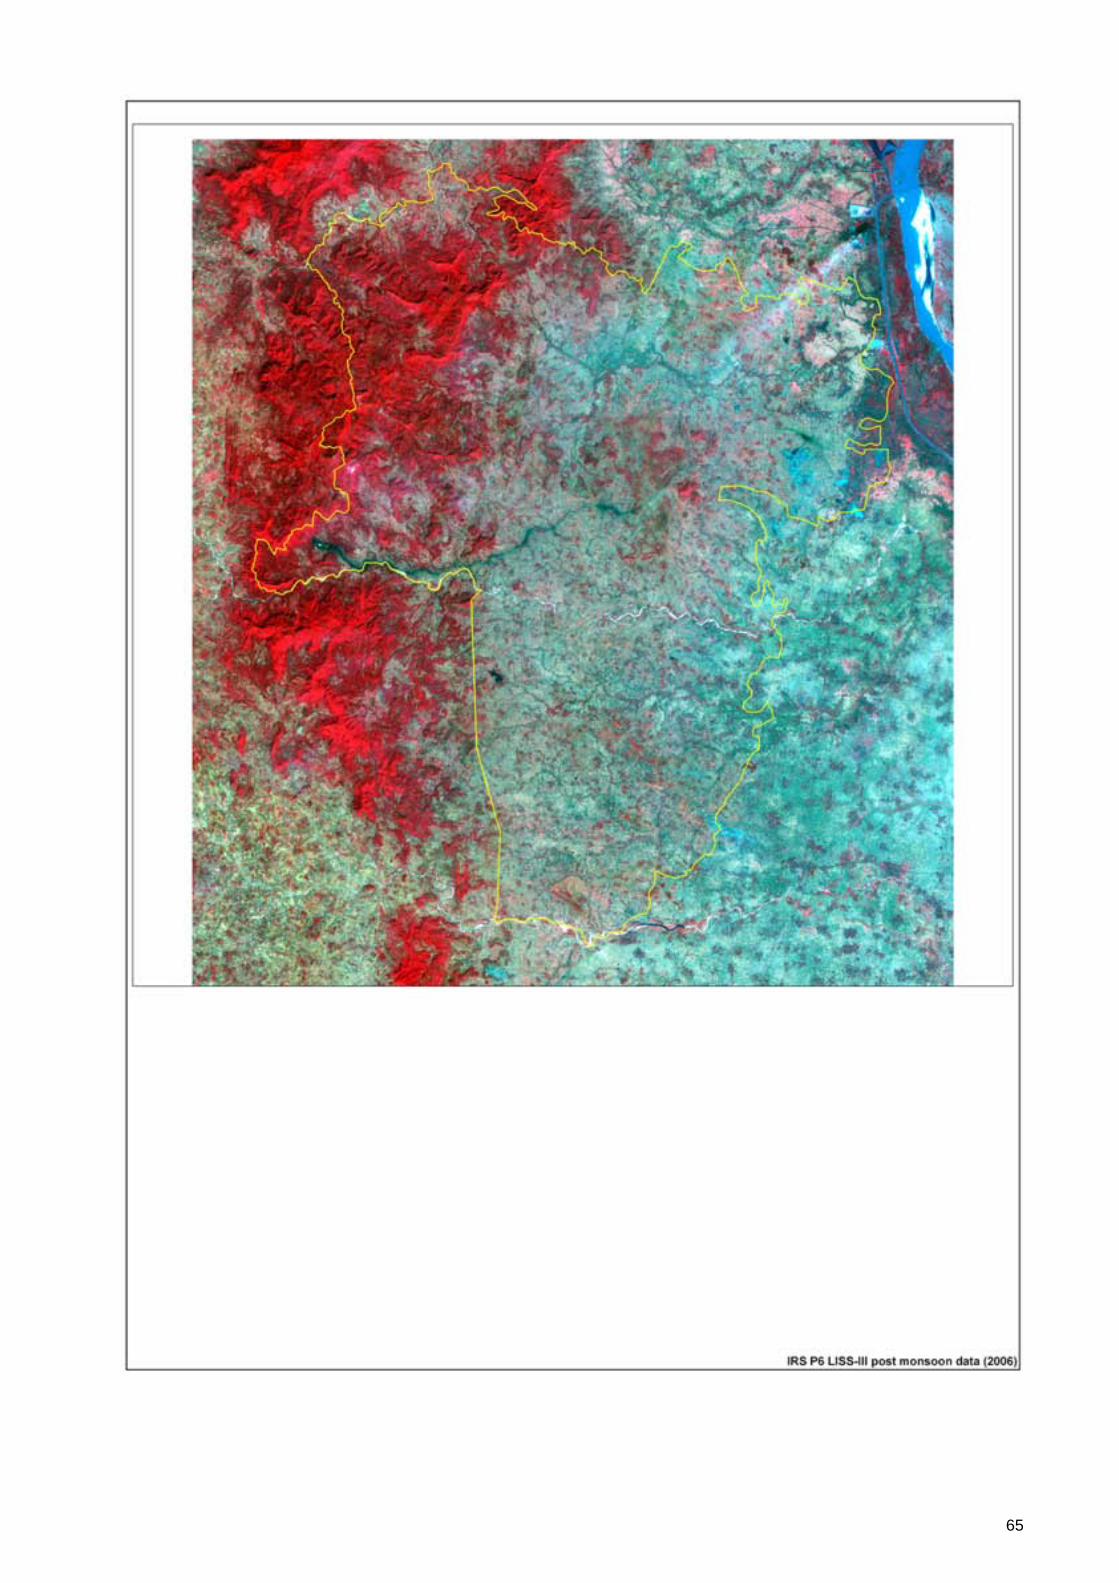
65

66
7.1.11 Dumka The total geographical area of Dumka district is 6,212 Sq. km. The wetland area is estimated to be 15824 ha which include 857 smaller wetlands of < 2.25 ha. Reservoir/Barrage ranked first with 9000 ha of area accounting for about 57 per cent of wetland area. River/Stream stands next constituting 5487 ha of area (table 16) in this district. The other two types are Riverine wetlands and tank/Pond together forms about 3 per cent area under wetlands. Details are given in Table 16. Aquatic vegetation covers 16 ha of wetland area and remained unchanged in both the seasons. Open water in post-monsoon dominated by moderate turbidity (8456 ha) followed by low (3688 ha) and high (2795 ha). In case of pre-monsoon, the open water was dominated by low turbidity (6821 ha) followed by high (3465 ha) and moderate (1371 ha). Probably the suspended sediments brought through rainfall run-off into Reservoir/Barrage, which is the largest category would have settled resulting in low turbidity.
Table16: Area estimates of wetlands in Dumka Area in ha
Sr. No. Wettcode Wetland Category
Number of
Wetlands
Total Wetland
Area
% of wetland
area
Open Water Post-
monsoon Area
Pre-monsoon
Area 1100 Inland Wetlands - Natural
1 1101 Lakes/Ponds - - - - - 2 1102 Ox-bow lakes/ Cut-off meanders - - - - - 3 1103 High altitude wetlands - - - - - 4 1104 Riverine wetlands 16 263 1.66 235 155 5 1105 Waterlogged - - - - - 6 1106 River/Stream 25 5487 34.68 5487 4445 1200 Inland Wetlands -Man-made 7 1201 Reservoirs/Barrages 36 9000 56.88 9000 6920 8 1202 Tanks/Ponds 63 217 1.37 217 139 9 1203 Waterlogged - - - - - 10 1204 Salt pans - - - - - Sub-Total 140 14967 94.58 14939 11659 Wetlands (<2.25 ha), mainly Tanks 857 857 5.42 - - Total 997 15824 100.00 14939 11659
Area under Aquatic Vegetation 16 16
Area under turbidity levels Low 3688 6821 Moderate 8456 1371 High 2795 3465

67

68

69
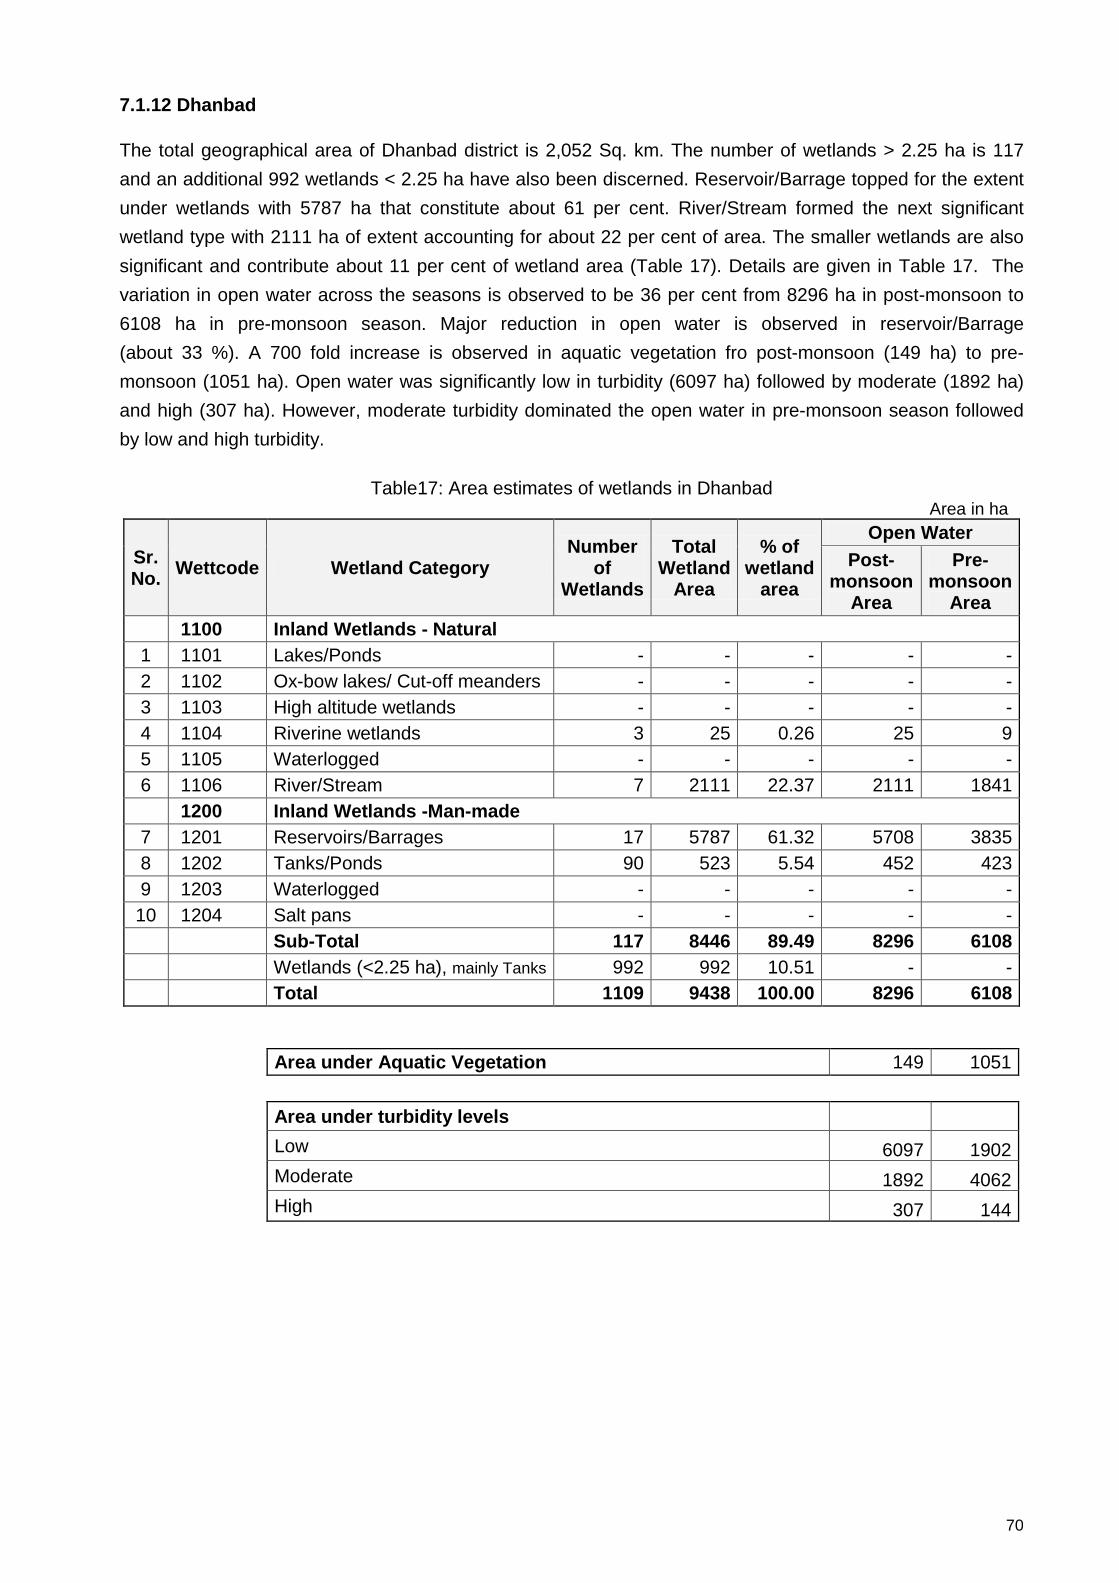
70
7.1.12 Dhanbad The total geographical area of Dhanbad district is 2,052 Sq. km. The number of wetlands > 2.25 ha is 117 and an additional 992 wetlands < 2.25 ha have also been discerned. Reservoir/Barrage topped for the extent under wetlands with 5787 ha that constitute about 61 per cent. River/Stream formed the next significant wetland type with 2111 ha of extent accounting for about 22 per cent of area. The smaller wetlands are also significant and contribute about 11 per cent of wetland area (Table 17). Details are given in Table 17. The variation in open water across the seasons is observed to be 36 per cent from 8296 ha in post-monsoon to 6108 ha in pre-monsoon season. Major reduction in open water is observed in reservoir/Barrage (about 33 %). A 700 fold increase is observed in aquatic vegetation fro post-monsoon (149 ha) to pre-monsoon (1051 ha). Open water was significantly low in turbidity (6097 ha) followed by moderate (1892 ha) and high (307 ha). However, moderate turbidity dominated the open water in pre-monsoon season followed by low and high turbidity.
Table17: Area estimates of wetlands in Dhanbad
Area in ha
Sr. No. Wettcode Wetland Category
Number of
Wetlands
Total Wetland
Area
% of wetland
area
Open Water Post-
monsoon Area
Pre-monsoon
Area 1100 Inland Wetlands - Natural
1 1101 Lakes/Ponds - - - - - 2 1102 Ox-bow lakes/ Cut-off meanders - - - - - 3 1103 High altitude wetlands - - - - - 4 1104 Riverine wetlands 3 25 0.26 25 9 5 1105 Waterlogged - - - - - 6 1106 River/Stream 7 2111 22.37 2111 1841 1200 Inland Wetlands -Man-made 7 1201 Reservoirs/Barrages 17 5787 61.32 5708 3835 8 1202 Tanks/Ponds 90 523 5.54 452 423 9 1203 Waterlogged - - - - - 10 1204 Salt pans - - - - - Sub-Total 117 8446 89.49 8296 6108 Wetlands (<2.25 ha), mainly Tanks 992 992 10.51 - - Total 1109 9438 100.00 8296 6108
Area under Aquatic Vegetation 149 1051
Area under turbidity levels Low 6097 1902 Moderate 1892 4062 High 307 144

71

72

73

74
7.1.13 Bokaro The total geographical area of Bokaro district is 2,861 Sq. km. The wetland area is estimated to be 11222 ha. Reservoir/barrage ranks first in terms of aerial extent (5121 ha) that accounts for about 46 per cent of wetlands in Bokaro district. River/Stream is the next wetland category that is significant in terms of extent (3899 ha). There are 106 Tank/Ponds in this district which comprise about 12 per cent of wetland area. Riverine wetland (3) does exist but are insignificant in terms of extent accounting for only a fraction of one per cent. The number of smaller wetlands (< 2.25 ha) is significant (838). Details are given in Table 18. There is a marginal increase of 31 ha in the extent of aquatic vegetation from post-monsoon (606 ha) to pre-monsoon (637 ha). The seasonal fluctuation in open water is not significant and found to be about 12 per cent from post-monsoon (9800 ha) to pre-monsoon (8621 ha) which is reflected uniformly in all the wetland categories. Open water is found to be dominated by moderate turbidity followed by low and high in both the seasons.
Table 18: Area estimates of wetlands in Bokaro Area in ha
Sr. No. Wettcode Wetland Category
Number of
Wetlands
Total Wetland
Area
% of wetland
area
Open Water Post-
monsoon Area
Pre-monsoon
Area 1100 Inland Wetlands - Natural
1 1101 Lakes/Ponds - - - - - 2 1102 Ox-bow lakes/ Cut-off meanders - - - - - 3 1103 High altitude wetlands - - - - - 4 1104 Riverine wetlands 3 51 0.45 25 25 5 1105 Waterlogged - - - - - 6 1106 River/Stream 12 3899 34.74 3899 3130 1200 Inland Wetlands -Man-made 7 1201 Reservoirs/Barrages 19 5121 45.63 4734 4369 8 1202 Tanks/Ponds 106 1313 11.70 1142 1097 9 1203 Waterlogged - - - - - 10 1204 Salt pans - - - - - Sub-Total 140 10384 92.53 9800 8621 Wetlands (<2.25 ha), mainly Tanks 838 838 7.47 - - Total 978 11222 100.00 9800 8621
Area under Aquatic Vegetation 606 637
Area under turbidity levels Low 3258 2028 Moderate 5162 5974 High 1380 619

75

76

77

78
7.1.14 Ranchi The total geographical area of Ranchi district is 7,698 Sq. km. There are 1077 wetlands in the district that comprise 164 wetlands of > 2.25 ha and the rest 913 are smaller than 2.25 ha. The aerial extent of wetlands is estimated to be 14728 ha, which is a meager 0.17 per cent of the geographical area of the district. River/Stream occupies the top rank in terms of extent with 8261 ha followed by Reservoir/barrage (4945 ha). The smaller wetlands occupy reasonably significant extent i.e. 6.2 per cent of wetland extent. Aquatic vegetation has shown a significant increase from 94 ha to 276 ha from post-monsoon to pre-monsoon season. Aquaculture ponds have been mapped accounting for 8 ha. Details are given in Table 19. Considerable decrease of 36 per cent in open water is observed from post-monsoon (13709 ha) to 10165 ha in pre-monsoon season. The open water remained moderately turbid followed by high and low with similar pattern in both the seasons. The decrease in area from post-monsoon to pre-monsoon season under various turbidity classes is mainly due to reduction in the extent of open water itself.
Table 19: Area estimates of wetlands in Ranchi district
Area in ha
Sr. No. Wettcode Wetland Category
Number of
Wetlands
Total Wetland
Area
% of wetland
area
Open Water Post-
monsoon Area
Pre-monsoon
Area 1100 Inland Wetlands - Natural
1 1101 Lakes/Ponds 1 21 0.14 21 21 2 1102 Ox-bow lakes/ Cut-off meanders - - - - - 3 1103 High altitude wetlands - - - - - 4 1104 Riverine wetlands 2 58 0.39 - - 5 1105 Waterlogged - - - - - 6 1106 River/Stream 28 8261 56.09 8261 5394 1200 Inland Wetlands -Man-made 7 1201 Reservoirs/Barrages 58 4945 33.58 4903 4260 8 1202 Tanks/Ponds 72 519 3.52 513 479 9 1203 Waterlogged 1 3 0.02 3 3 10 1204 Salt pans/Aquaculture Pond 2 8 0.05 8 8 Sub-Total 164 13815 93.80 13709 10165 Wetlands (<2.25 ha), mainly Tanks 913 913 6.20 - - Total 1077 14728 100.00 13709 10165
Area under Aquatic Vegetation 94 276
Area under turbidity levels Low 244 136 Moderate 8033 5752 High 5432 4277

79

80

81

82
7.1.15 Lohardaga The total geographical area of Lohardaga district is 1,491 Sq. km. The aerial extent of wetlands in this district is estimated 2110 ha that include the contribution from 294 wetlands, which are < 2.25 ha. River/Stream is singularly the largest category in terms of extent comprising 66 per cent of the area under wetlands followed by Reservoir/Barrage accounting for about 18 per cent. The smaller wetlands also significantly add to the extent of wetlands by way of constituting about 14 per cent area under them. Open water has shown about 70 per cent reduction from post-monsoon to pre-monsoon elucidating the seasonal fluctuation. This is reflected in both the major categories. Details are given in Table 20. Aquatic vegetation is insignificant in terms of extent, which was a mere 6 ha in post-monsoon and has shown an increase to 12 ha in pre-monsoon. Open water in post-monsoon season dominantly moderately turbid (1062 ha) followed by high (506 ha) and low (241 ha). The extent of open water in pre-monsoon is severely reduced and reflected in the extents of various classes of turbidity. However, high turbidity dominated the pre-monsoon extent of open water.
Table 20: Area estimates of wetlands in Lohardaga Area in ha
Sr. No. Wettcode Wetland Category
Number of
Wetlands
Total Wetland
Area
% of wetland
area
Open Water Post-
monsoon Area
Pre-monsoon
Area 1100 Inland Wetlands - Natural
1 1101 Lakes/Ponds - - - - - 2 1102 Ox-bow lakes/ Cut-off meanders - - - - - 3 1103 High altitude wetlands - - - - - 4 1104 Riverine wetlands - - - - - 5 1105 Waterlogged - - - - - 6 1106 River/Stream 9 1393 66.02 1393 389 1200 Inland Wetlands -Man-made 7 1201 Reservoirs/Barrages 22 390 18.48 390 161 8 1202 Tanks/Ponds 9 33 1.56 26 18 9 1203 Waterlogged - - - - - 10 1204 Salt pans - - - - - Sub-Total 40 1816 86.07 1809 568 Wetlands (<2.25 ha), mainly Tanks 294 294 13.93 - - Total 334 2110 100.00 1809 568
Area under Aquatic Vegetation 6 12
Area under turbidity levels Low 241 54 Moderate 1062 124 High 506 390

83

84

85

86
7.1.16 Gumla The total geographical area of Gumla district is 9, 077 Sq. km out of which wetlands account for 12423 ha. River/Stream is the single largest wetland category that constitutes about 79 per cent of wetland extent. Reservoir/Barrage forms the next major category that accounts for about 15 per cent (Table 21). Besides 116 wetlands that are larger than 2.25 ha in size, there are 679 wetlands which are < 2.25 ha (shown as point features on map). These constitute about 5 per cent of wetland extent in this district. The open water extent has shown a reduction 58 per cent from post-monsoon (11729 ha) to 6147 ha in pre-monsoon. It is largely because of seasonal nature of River/Streams that are based on rainfall run-off. The impact is seen on the Reservoir/Barrage also from where the water is being drawn for irrigation etc. Details are given in Table 21. Aquatic vegetation formed a small fraction (14 ha) of wetland extent, which remained unchanged in both the seasons. Open water is dominated by high turbidity (7240 ha) followed by moderate (4227 ha) and low (262 ha) in post-monsoon season. The trend remained same in pre-monsoon season except for the reduced the extents of the open water.
Table 21: Area estimates of wetlands in Gumla
Area in ha
Sr. No. Wettcode Wetland Category
Number of
Wetlands
Total Wetland
Area
% of wetland
area
Open Water Post-
monsoon Area
Pre-monsoon
Area 1100 Inland Wetlands - Natural
1 1101 Lakes/Ponds - - - - - 2 1102 Ox-bow lakes/ Cut-off meanders - - - - - 3 1103 High altitude wetlands - - - - - 4 1104 Riverine wetlands - - - - - 5 1105 Waterlogged 1 6 0.05 6 - 6 1106 River/Stream 8 9769 78.64 9769 4859 1200 Inland Wetlands -Man-made 7 1201 Reservoirs/Barrages 81 1822 14.67 1822 1190 8 1202 Tanks/Ponds 26 147 1.18 132 98 9 1203 Waterlogged - - - - - 10 1204 Salt pans - - - - - Sub-Total 116 11744 94.53 11729 6147 Wetlands (<2.25 ha), mainly Tanks 679 679 5.47 - - Total 795 12423 100.00 11729 6147
Area under Aquatic Vegetation 14 14
Area under turbidity levels Low 262 155 Moderate 4227 1619 High 7240 4373

87

88

89

90
7.1.17 Pashchmi Singhbhum The total geographical area of Pashchmi Singhbhum district is 9,907 Sq. km out of which wetlands account for 18939 ha (Table 22). River/Stream ranks first in terms of aerial extent (9140 ha), which constitutes about 48 per cent. Reservoir/Barrage occupy the second position (6914 ha) contributing about 37 per cent to the extent of wetlands in this district. A large number (2131) of smaller wetlands (< 2.25 ha) contribute significantly the extent under wetlands in this district that turns out to be about 11 per cent. The wetland area estimated is 18939 ha. Details are given in Table 22. Aquatic vegetation has shown a tremendous increase from 38 ha in post-monsoon to 856 ha in pre-monsoon season. Open water has a 36 per cent reduction in extent from post-monsoon (16732 ha) to pre-monsoon (12354 ha). High turbidity (12766 ha) dominated the open water extent in post-monsoon followed by high (3069 ha) and low (897 ha). Extent under high turbidity has shown a marginal increase in pre-monsoon from 3069 ha to 3226 ha but the pattern remained similar in both the seasons.
Table22: Area estimates of wetlands in Pashchmi Singhbhum
Area in ha
Sr. No. Wettcode Wetland Category
Number of
Wetlands
Total Wetland
Area
% of wetland
area
Open Water Post-
monsoon Area
Pre-monsoon
Area 1100 Inland Wetlands - Natural
1 1101 Lakes/Ponds - - - - - 2 1102 Ox-bow lakes/ Cut-off meanders - - - - - 3 1103 High altitude wetlands - - - - - 4 1104 Riverine wetlands - - - - - 5 1105 Waterlogged - - - - - 6 1106 River/Stream 22 9140 48.26 9140 5971 1200 Inland Wetlands -Man-made 7 1201 Reservoirs/Barrages 96 6914 36.51 6872 5822 8 1202 Tanks/Ponds 144 746 3.94 715 553 9 1203 Waterlogged 2 8 0.04 5 8 10 1204 Salt pans - - - - - Sub-Total 264 16808 88.75 16732 12354 Wetlands (<2.25 ha), mainly Tanks 2131 2131 11.25 - - Total 2395 18939 100.00 16732 12354
Area under Aquatic Vegetation 38 856
Area under turbidity levels Low 897 623 Moderate 12766 8505 High 3069 3226
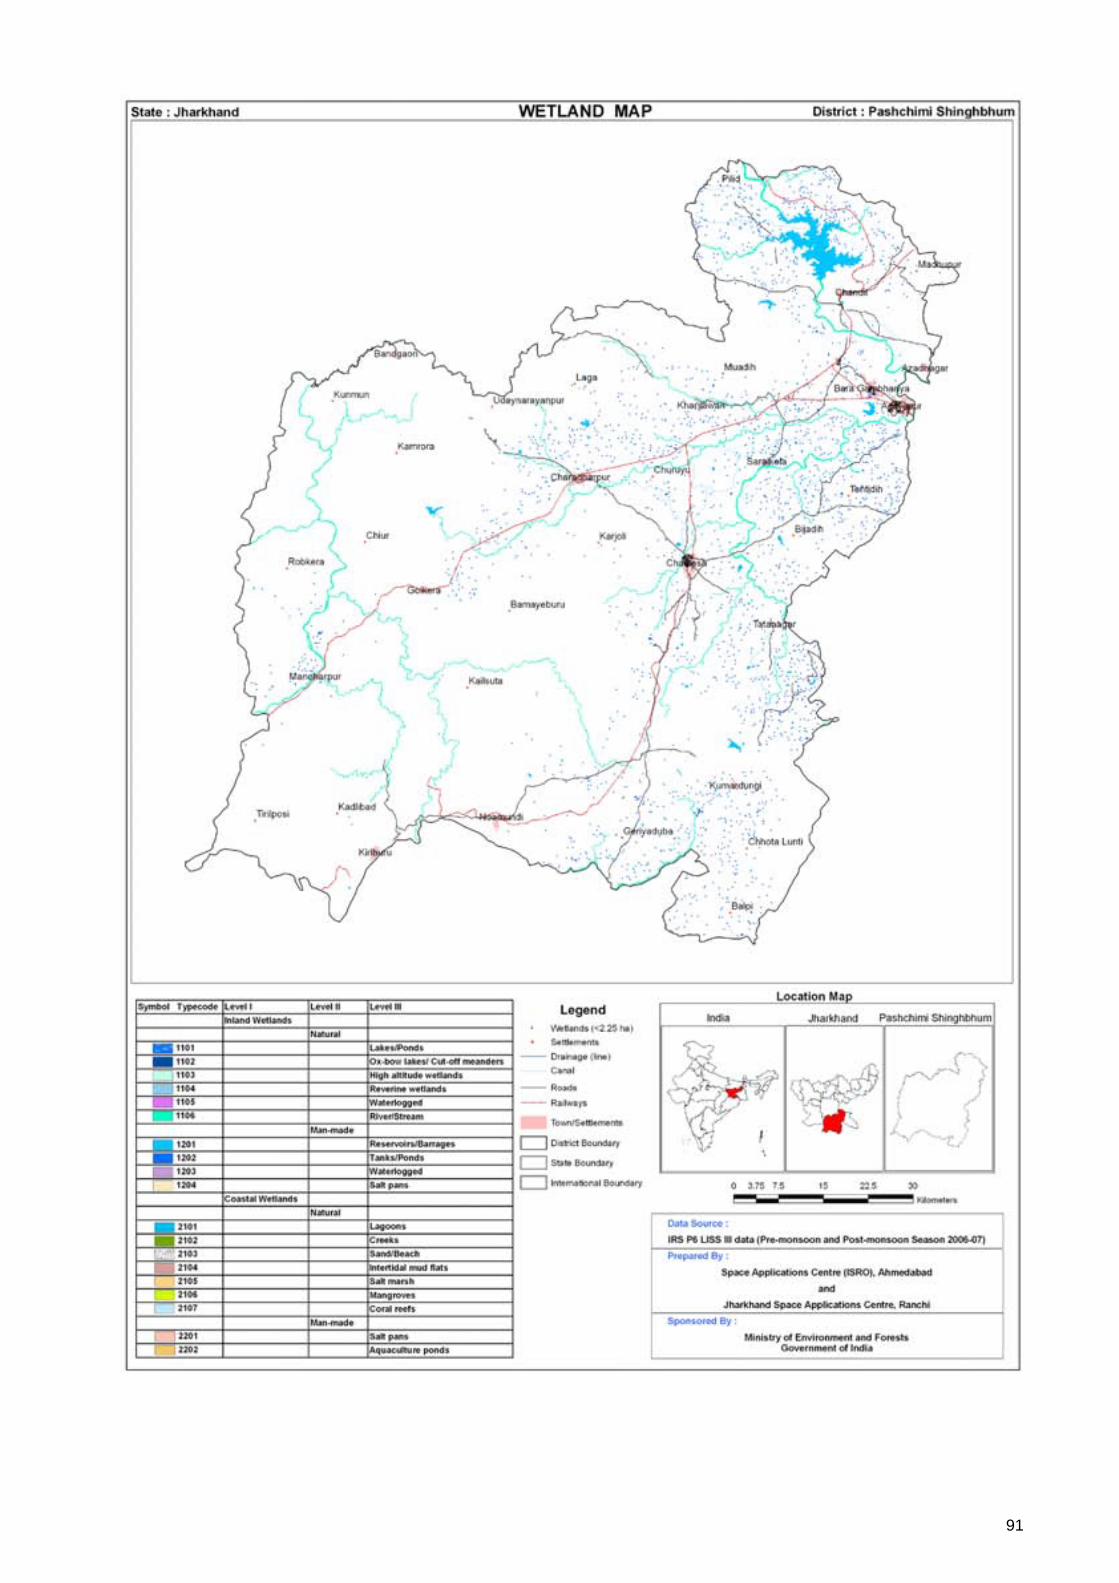
91

92

93

94
7.1.18 Purbi Singhbhum The total geographical area of Purbi Singhbhum district is 3,533 Sq. km out of which wetlands account for 6749 ha of area (Table 22). This include 5801 ha by wetlands > 2.25 ha and the rest by the wetlands smaller than 2.25 ha. Singularly, River/Stream (4677 ha) accounts for about 69 per cent of area under wetlands in this district. Reservoir/Barrage contributes about 13 per cent to the wetland extent followed by Tank/Pond (about 4 %). Details are given in Table 23. In addition, 948 wetlands smaller than 2.25 ha have also been discerned. The major wetland types are River/Stream, Reservoirs and Tanks/Ponds. The smaller wetlands (< 2.25 ha) form an important fraction that contribute about 14 per cent to the wetland extent in this district. Open water has shown a 30 per cent reduction in extent from post-monsoon to pre-monsoon season. Aquatic vegetation has registered a steep increase from 30 ha in post-monsoon to 170 ha in pre-monsoon. Open water is dominated by moderate turbidity (5215 ha) followed by high (557 ha) and low turbidity was not exhibited open water in this district. The pre-monsoon open water is moderately turbid (4065 ha) with the presence of low and high.
Table 23: Area estimates of wetlands in Purbi Singhbhum
Area in ha
Sr. No. Wettcode Wetland Category
Number of
Wetlands
Total Wetland
Area
% of wetland
area
Open Water Post-
monsoon Area
Pre-monsoon
Area 1100 Inland Wetlands - Natural
1 1101 Lakes/Ponds - - - - - 2 1102 Ox-bow lakes/ Cut-off meanders - - - - - 3 1103 High altitude wetlands - - - - - 4 1104 Riverine wetlands - - - - - 5 1105 Waterlogged - - - - - 6 1106 River/Stream 7 4677 69.30 4677 3127 1200 Inland Wetlands -Man-made 7 1201 Reservoirs/Barrages 34 866 12.83 837 700 8 1202 Tanks/Ponds 37 258 3.82 258 238 9 1203 Waterlogged - - - - - 10 1204 Salt pans - - - - - Sub-Total 78 5801 85.95 5772 4065 Wetlands (<2.25 ha), mainly Tanks 948 948 14.05 - - Total 1026 6749 100.00 5772 4065
Area under Aquatic Vegetation 30 170
Area under turbidity levels Low - - Moderate 5215 4065 High 557 -
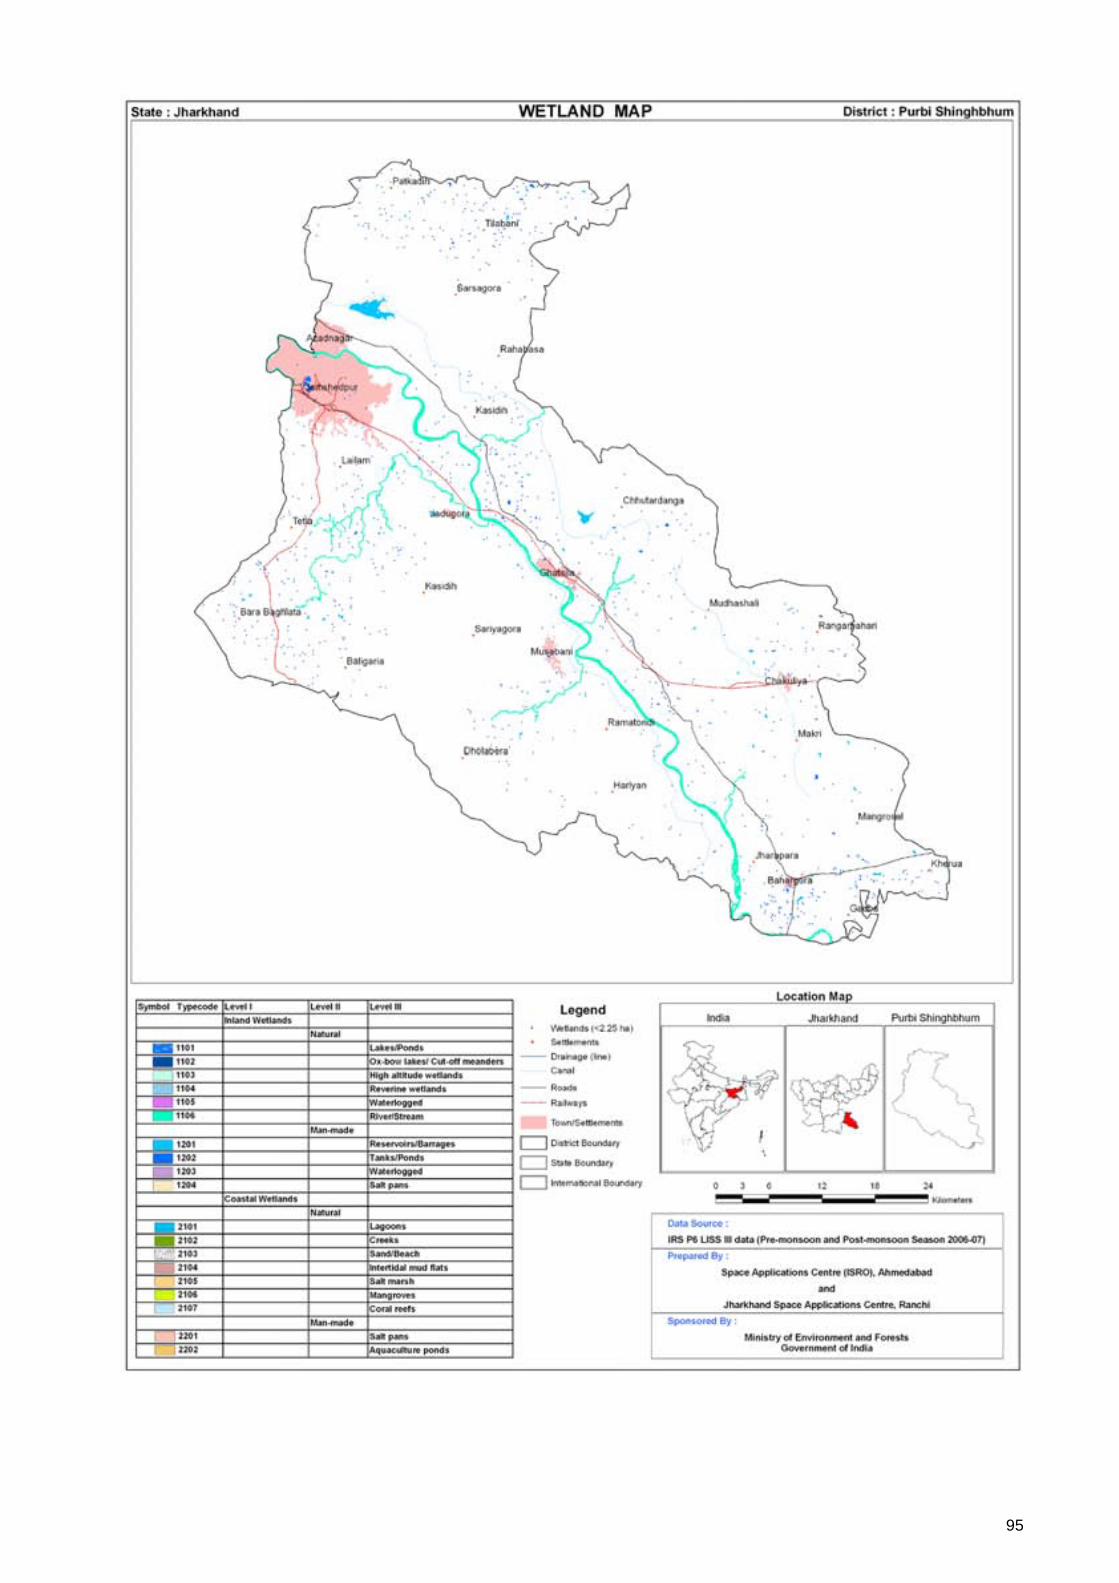
95

96

97

98

99
MAJOR WETLAND TYPES

100

101
8.0 MAJOR WETLAND TYPES OF JHARKHAND Major wetland types observed in the state are River/Stream, Reservoirs, Tanks/Ponds, Lakes, Riverine wetlands, Waterlogged-Natural, Ox-bow Lakes, Waterlogged-Man-Made and Aquaculture Ponds . few of these are depicted in Plate-1. Ground truth data was collected for selected wetland sites. The standard proforma was used to record the field data. Field photographs are also taken to record the water quality (subjective), status of aquatic vegetation and water spread. The location of the features was recorded using GPS. Field photographs and ground truth data of different wetland types are shown in Plates 2a, 2b and 2c, 2d.
Plate - 1: Major wetland types of Jharkhand

102
Sr. No. Description Field photograph
1. Wetland Type : Reservoir Name : Getulsud Location : longitude: 85°31'17.874"E latitude : 23°26'38.601"N Turbidity : Moderate
2. Wetland Type : Reservoir
Name : Chinda Location : longitude: 84°31'17.873"E latitude : 22°35'33.945"N Turbidity : Low
3 Wetland Type : Reservoir
Name : Kansjor Location : longitude: 84°26'47.64"E latitude : 22°43'22.68"N Turbidity : Moderate
4 Wetland Type : Reservoir
Name : Massanjore Location : longitude: 87°18'39.3"E latitude : 24°6'29.9"N Turbidity : Moderate
Plate 2a: Field photographs and ground truth data of different wetland types in Jharkhand

103
Sr. No. Description Field photograph
5. Wetland Type : Reservoir Name : Tilaiya Location : longitude: 85°25'56.201"E latitude : 24°20'38.8"N Turbidity : Moderate
6. Wetland Type : Reservoir Name : Maithon Location : longitude: 86°47'58.499"E latitude : 23°46'44.501"N Turbidity : Moderate
7. Wetland Type : Reservoir
Name : Tenughat Location : longitude: 85°50'1.091"E latitude : 23°43'51.677"N Turbidity : Moderate
8. Wetland Type: Reservoir
Name: Hesla Location : longitude: 85°17'27.6"E latitude : 23°36'53.302"N Turbidity : Moderate
Plate 2b: Field photographs and ground truth data of different wetland types in Jharkhand

104
Sr. No.
Description
Field photograph
9. Wetland Type : Lake Name : Udhwa Location : longitude: 87° 48' 55.500" E latitude : 24° 58' 6.400" N Turbidity : Moderate Aquatic Weeds : Eichhornia crassipes, Salvinia cuculata, Marsilea minuta etc Fauna : Hemiptera, Coleptera, Diptera etc
10. Wetland Type : Lake Name : Berail Jhil Location : longitude: 87° 49' 18.100" E latitude: 24° 59' 16.300" N
11. Wetland Type : Lake
Name : Ranchi lake Location : longitude: 85°19'11.848"E latitude : 23°22'7.925"N Turbidity : High
12. Wetland Type : Aquaculture
Pond Location : longitude: 85°19'18.566"E latitude : 23°20'35.046"N Turbidity : High Fish Type : Rohu, Catla
Plate 2c: Field photographs and ground truth data of different wetland types in Jharkhand

105
Sr. No.
Description
Field photograph
13. Wetland Type : Tank/Ponds Location : longitude: 84°38'41.27"E latitude : 22°53'2.411"N Aquatic Vegetation : Water Hyacinth and Lotus Turbidity : High
14. Wetland Type : Tank/Pond Location : longitude: 85°32'45.564"E latitude : 23°37'1.966"N Turbidity : High
15. Wetland Type : River
Name : Ganga Location : longitude: 87°46'2.293"E latitude : 25°6'12.582"N Turbidity : Moderate
16. Wetland Type : River
Name: Sankh Location : longitude: 84°30'25.308"E latitude : 22°39'47.639"N Turbidity : Moderate
Plate 2d: Field photographs and ground truth data of different wetland types in Jharkhand

106

107
IMPORTANT WETLANDS OF JHARKHAND

108
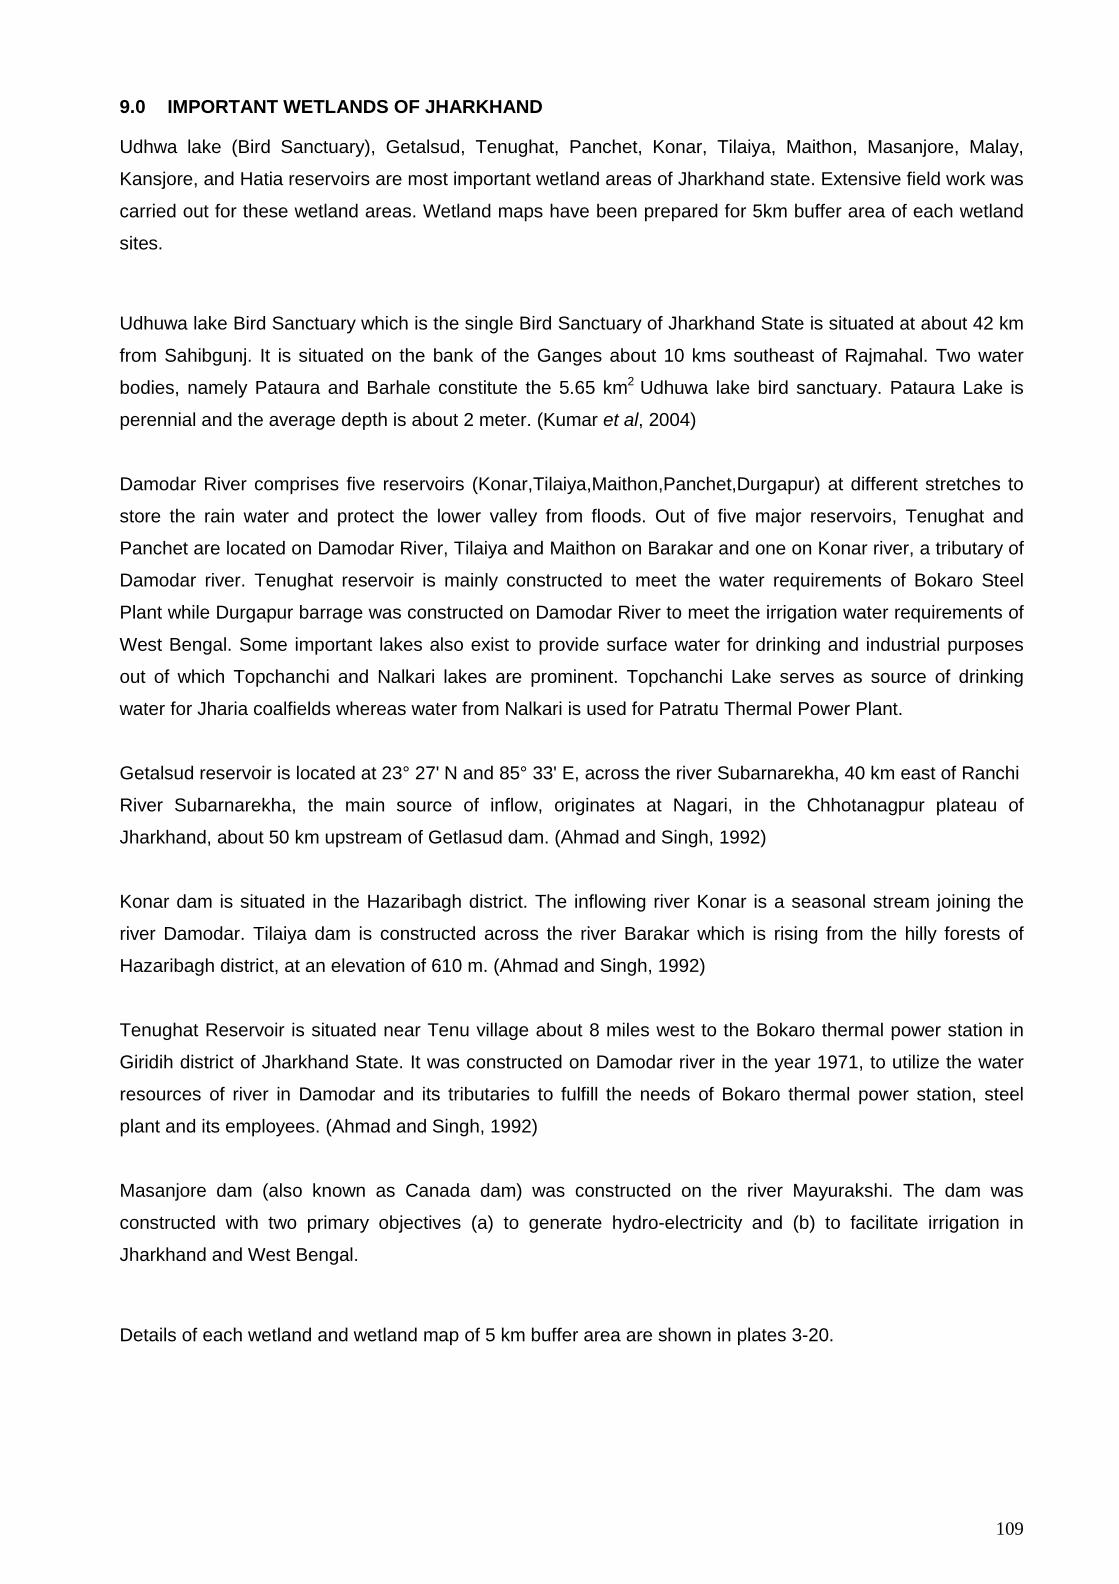
109
9.0 IMPORTANT WETLANDS OF JHARKHAND
Udhwa lake (Bird Sanctuary), Getalsud, Tenughat, Panchet, Konar, Tilaiya, Maithon, Masanjore, Malay,
Kansjore, and Hatia reservoirs are most important wetland areas of Jharkhand state. Extensive field work was
carried out for these wetland areas. Wetland maps have been prepared for 5km buffer area of each wetland
sites.
Udhuwa lake Bird Sanctuary which is the single Bird Sanctuary of Jharkhand State is situated at about 42 km
from Sahibgunj. It is situated on the bank of the Ganges about 10 kms southeast of Rajmahal. Two water
bodies, namely Pataura and Barhale constitute the 5.65 km2 Udhuwa lake bird sanctuary. Pataura Lake is
perennial and the average depth is about 2 meter. (Kumar et al, 2004)
Damodar River comprises five reservoirs (Konar,Tilaiya,Maithon,Panchet,Durgapur) at different stretches to
store the rain water and protect the lower valley from floods. Out of five major reservoirs, Tenughat and
Panchet are located on Damodar River, Tilaiya and Maithon on Barakar and one on Konar river, a tributary of
Damodar river. Tenughat reservoir is mainly constructed to meet the water requirements of Bokaro Steel
Plant while Durgapur barrage was constructed on Damodar River to meet the irrigation water requirements of
West Bengal. Some important lakes also exist to provide surface water for drinking and industrial purposes
out of which Topchanchi and Nalkari lakes are prominent. Topchanchi Lake serves as source of drinking
water for Jharia coalfields whereas water from Nalkari is used for Patratu Thermal Power Plant.
Getalsud reservoir is located at 23° 27' N and 85° 33' E, across the river Subarnarekha, 40 km east of Ranchi
River Subarnarekha, the main source of inflow, originates at Nagari, in the Chhotanagpur plateau of
Jharkhand, about 50 km upstream of Getlasud dam. (Ahmad and Singh, 1992)
Konar dam is situated in the Hazaribagh district. The inflowing river Konar is a seasonal stream joining the
river Damodar. Tilaiya dam is constructed across the river Barakar which is rising from the hilly forests of
Hazaribagh district, at an elevation of 610 m. (Ahmad and Singh, 1992)
Tenughat Reservoir is situated near Tenu village about 8 miles west to the Bokaro thermal power station in
Giridih district of Jharkhand State. It was constructed on Damodar river in the year 1971, to utilize the water
resources of river in Damodar and its tributaries to fulfill the needs of Bokaro thermal power station, steel
plant and its employees. (Ahmad and Singh, 1992)
Masanjore dam (also known as Canada dam) was constructed on the river Mayurakshi. The dam was
constructed with two primary objectives (a) to generate hydro-electricity and (b) to facilitate irrigation in
Jharkhand and West Bengal.
Details of each wetland and wetland map of 5 km buffer area are shown in plates 3-20.

110
9.1 Udhwa Lake ( Bird Sanctuary)
Name : Udhwa Lake ( Bird Sanctuary)
1 Location : 87° 48' 55.500" E, 24° 58' 6.400" N
Sahibganj known as “Udhwa lake bird sanctuary” in the year 1991. The Sanctuary is situated at about 42 km from sahibganj . It is situated on the bank of the Ganga about 10 kms southeast of Rajmahal. Two water bodies, namely Pataura and Barhale constitute the 5.65 km2 Udhwa lake bird Sanctuary.
2 Area: 1605 ha
3 Wetland type : Lake (Bird Sanctuary)
4 Flora: The lake is infested with aquatic macrophytes comprising emergent, free floating and submerged forms. Water hyacinth was found to be the dominant form. Over all 50% of the lake surface was covered with aquatic weeds.
5 Fauna: It is a home to a variety of birds including different mynas, brahminy kites, Cattel Egret, Pond Heron, Purple Heron, Egret , Open Billed stock, White Ibis, Dab chick or little Grebe, fishing eagles, hose swifts and palm swifts flying at dizzying speeds. A speciality of the sanctuary is Siberian birds flocking from different parts of the world.
6 Major fish species: Udhwa lake seems to be rich in fish and fish spawn.Some common fishes of the lake are Rohu(Labeo rohita), Catla (Catla catla) , Tengra,(Mystus cavasius) Bata(L. bata), reba(C. retra) , Mirka (Cirrihinus mrigala) etc.
Plate 3: Udhwa Lake (Bird Sanctuary)
IRS P6 LISS III, April 2007
IRS P6 LISS III, December 2006

111
Plate 4: Wetland map - 5 km buffer area of Udhwa Lake (Bird Sanctuary)

112

113
Plate 5: IRS LISS-III FCC – 5 km buffer area of Udhwa Lake (Bird Sanctuary)

114
9.2 Getalsud Reservoir
Name : Getalsud
1 Location : 85°31'17.874"E, 23°26'38.601"N Getalsud reservoir is situated in 40 km east of Ranchi city.
2 Name of the River: Subernarekha 3 Area: 2302 ha 4 Wetland type : Reservoir 5 Average Annual Rainfall : 100 to 1198 cm 6 Plankton: Diatoms have the maximum
species diversity, followed by Chlorophyceae and blue- greens. Desmids and Dinophyceae (Ceratium sp.) are also present. Zooplankton is represented by 12 genera of rotifers, 6 of protozoa, 5 cladocerans and 2 of copepods.
7 Fauna: Fish, insects and algae are a rich source of food for migratory birds, notable among which are Little Grebe, Bank Myna, Pied Myna, Common Crane, Cattle Egret, Tufted Pochard , Cotton Teal, Shoveller, Little Grebe, Palm Swift etc.( www. Zoosprint.org ,)
8 Major fish Species: Rohu( L. Rohita), Catla (Catla catla), Mirka (Cirrhinus mrigala),Reba (Cirrhinus reba) etc.
9 Soil Type: The bottom soil is acidic and poor in organic carbon (0.46 to 0.60 %). Available phosphorus and nitrogen are present in modest quantities (2.45 to 6.08 mg 100 g-1 and 24.38 to 35.06 mg 100 g-1). The morphometric and edaphic indicators of productivity and the estimates on the standing crop send conflicting signals on the status of the water body.
10 Benthic fauna: Bottom substrate in the lotic sector is soft and rich in organic matter, comprising decaying vegetation, but during monsoons, silt deposition is reported to blanket the organic matter. Density of benthic organisms is high in the lotic sector, their number attenuating towards the lentic sector.
Plate 6: Getalsud Reservoir

115
Plate 7: Wetland map - 5 km buffer area of Getalsud Reservoir

116

117
Plate 8: IRS LISS-III FCC – 5 km buffer area of Getalsud Reservoir
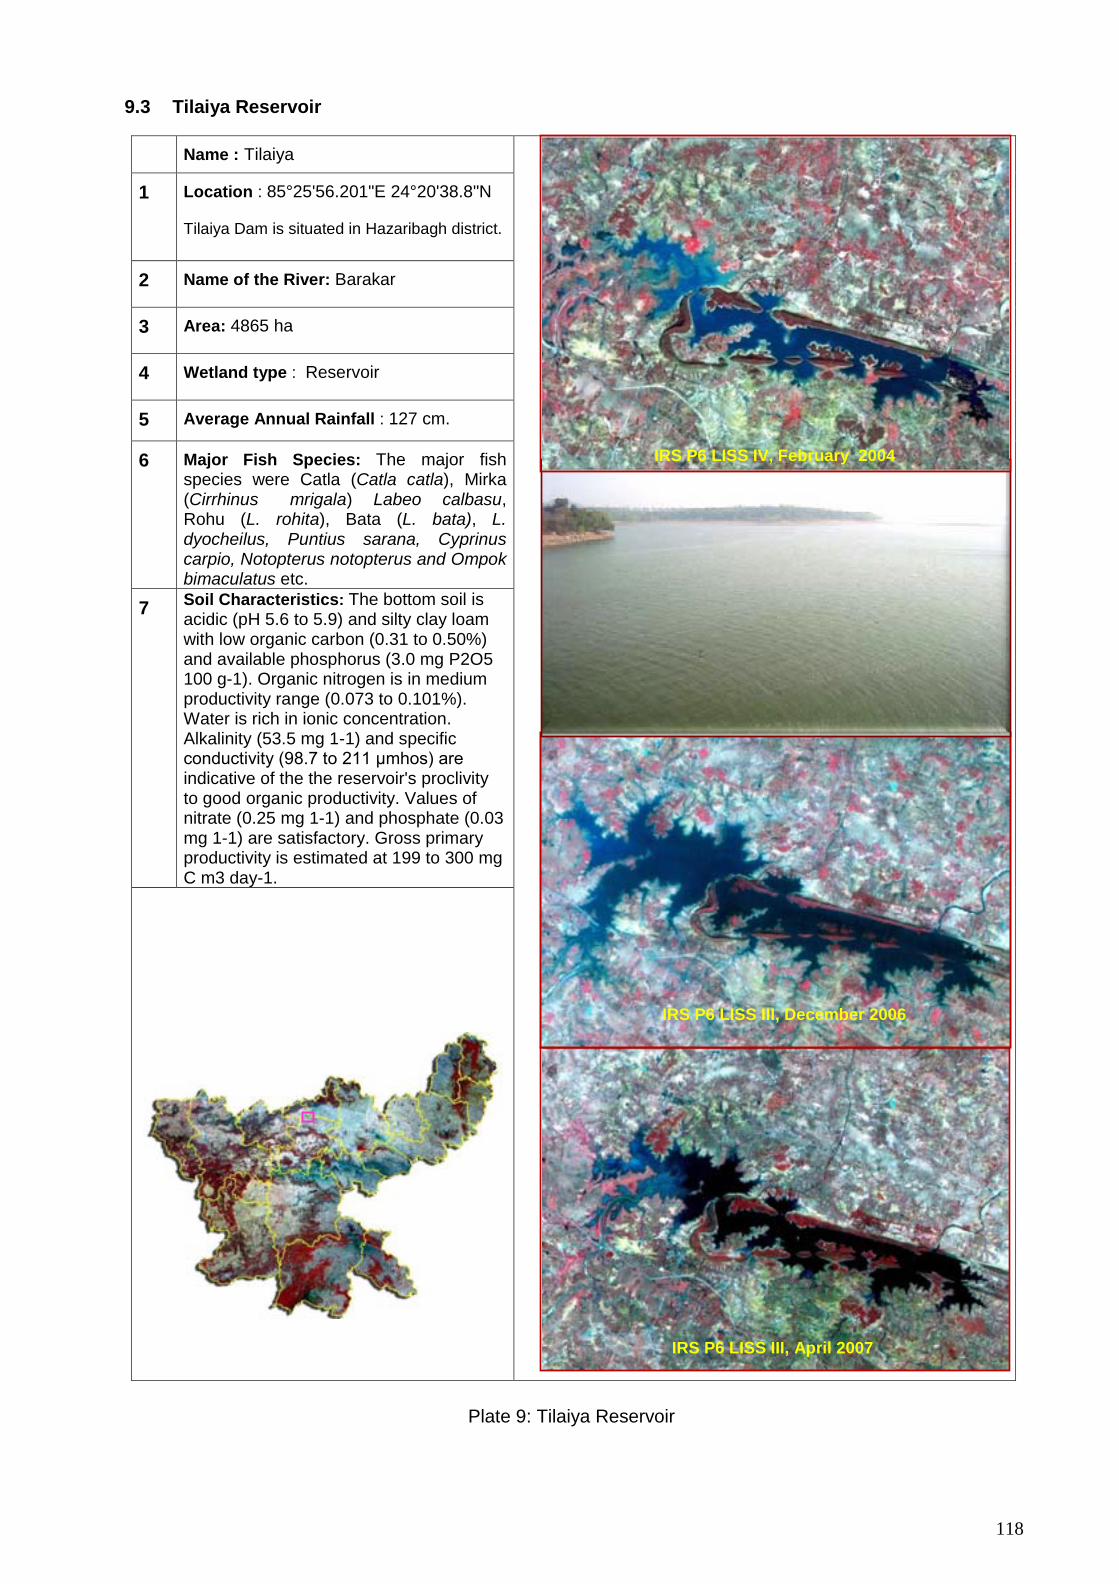
118
9.3 Tilaiya Reservoir
Name : Tilaiya
1 Location : 85°25'56.201"E 24°20'38.8"N
Tilaiya Dam is situated in Hazaribagh district.
2 Name of the River: Barakar
3 Area: 4865 ha
4 Wetland type : Reservoir
5 Average Annual Rainfall : 127 cm.
6 Major Fish Species: The major fish species were Catla (Catla catla), Mirka (Cirrhinus mrigala) Labeo calbasu, Rohu (L. rohita), Bata (L. bata), L. dyocheilus, Puntius sarana, Cyprinus carpio, Notopterus notopterus and Ompok bimaculatus etc.
7 Soil Characteristics: The bottom soil is acidic (pH 5.6 to 5.9) and silty clay loam with low organic carbon (0.31 to 0.50%) and available phosphorus (3.0 mg P2O5 100 g-1). Organic nitrogen is in medium productivity range (0.073 to 0.101%). Water is rich in ionic concentration. Alkalinity (53.5 mg 1-1) and specific conductivity (98.7 to 211 μmhos) are indicative of the the reservoir's proclivity to good organic productivity. Values of nitrate (0.25 mg 1-1) and phosphate (0.03 mg 1-1) are satisfactory. Gross primary productivity is estimated at 199 to 300 mg C m3 day-1.
Plate 9: Tilaiya Reservoir
IRS P6 LISS III, December 2006
IRS P6 LISS III, April 2007
IRS P6 LISS IV, February 2004

119
Plate 10: Wetland map - 5 km buffer area of Tilaiya Reservoir

120
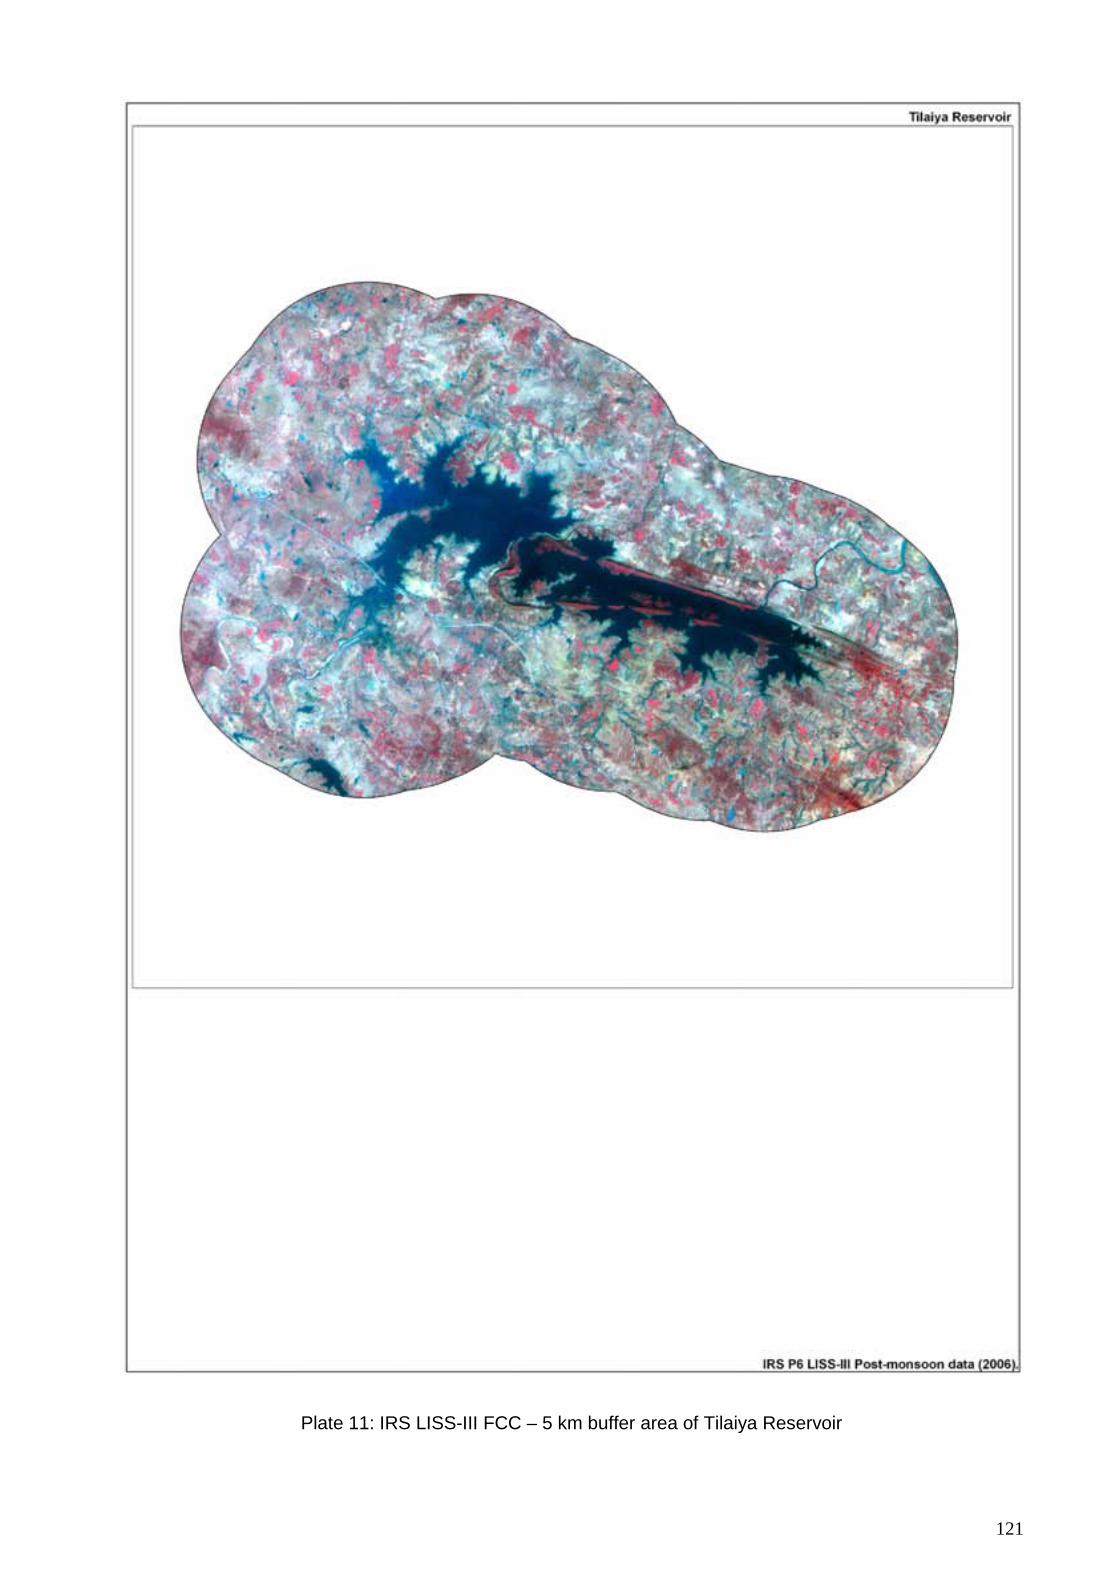
121
Plate 11: IRS LISS-III FCC – 5 km buffer area of Tilaiya Reservoir

122
9.4 Konar Reservoir
Plate 12: Konar Reservoir
IRS P6 LISS IV, March 2004
IRS P6 LISS III, December 2006
IRS P6 LISS III, April 2007
Name : Konar
1 Location : 85°45'50.731"E 23°55'50.85"N
Konar Dam is situated in Hazaribagh district.
2 Name of the River: Konar
3 Area: 2149ha
4 Wetland type : Reservoir
5 Plankton: The plankton in Konar is characterised by a poor species diversity and an overwhelming dominance of Microcystis aeruginosa and Diaptomus sp. among the phyto- and zooplankton respectively.
6 Major fish: The constituent species were Catla (Catla catla), Mirka (Cirrhinus mrigala), Labeo calbasu, Rohu (L. rohita), Bata (L. bata), L. dyocheilus, Puntius sarana, Cyprinus carpio, Notopterus notopterus and Ompok bimaculatus etc.
7 Ionic Concentration: Konar is the richest in ionic concentration. The total alkalinity varies in the range of 43.5 to 83.0 mg 1-1 and specific conductivity within 81.20 to 147.6μmos during different seasons of the year.
8 Soil Type: Basin soil of Konar reservoir is sandy loam to clay with 0.3 to 0.9% of organic carbon. The concentration of available phosphorus is a low 1.2 to 8.0 mg P2O4 100 g-1. Organic nitrogen of 0.069 to 0.101% is medium to high and pH of soil is acidic (5.4 to 6.0).

123
Plate 13: Wetland map - 5 km buffer area of Konar Reservoir

124

125
Plate 14: IRS LISS-III FCC – 5 km buffer area of Konar Reservoir

126
9.5 Tenughat Reservoir
Name : Tenughat
1 Location : 85°50'1.091" E
23°43'51.677" N
Tenughat Dam is situated in Bokaro
district.
2 Name of the river: Damodar
3 Area: 3814 ha
4 Wetland type : Reservoir
5 Average Annual Rainfall: 1320mm
6 Plankton: In the Reservoir free floating phytoplanktons and zooplanktons were having a good growth. The phytoplanktons found in the reservoir were Spirogyra, Chlamydomonas lemna, Ajola, Hydrilla, Vacillinaria, Chara, and potamojiton. This vegetation was good food for major craps.
7 Major Fish Species: Catla (C. catla), Mirka (C. mrigala), Rohu (L. rohita), L. calbasu, Bata(L. bata), C. carpio ,P. sarana, M. aor, W. attu, B. bagarius etc.
8 Irrigation: Considering the necessity of irrigation in the region, cultivable land between Tenu-Bokaro canal and river Damodar is being irrigated. Only an area of 800 hectares is being irrigated now.
Plate 15: Tenughat Reservoir
IRS P6 LISS II, April 2007
127
Plate 16: Wetland map - 5 km buffer area of Tenughat Reservoir

128

129
Plate 17: IRS LISS-III FCC – 5 km buffer area of Tenughat Reservoir

130
9.6 Massanjor Reservoir
Name : Massanjor
1 Location : 87°18’39.3”E, 24°6’29.9”N
Masanjore reservoir is situated in
Dumka District of Jharkhand.
2 Name of the River: Mayurakshi
3 Area: 5027
4 Wetland type : Reservoir
5 Average Annual Rainfall : 1447mm
6 Plankton: Agmenellum sp., Anabena sp. Ceratophyllum sp., Dentella sp. Diatomella sp.
7 Major Fish Species: W. attu, C. catla, N. chitala, H. fossilus, Papda, C.mirgala, L. rohita , M.aor etc.
8 Major Functions: To generate hydro-electricity and to facilitate irrigation in Jharkhand and West Bengal.
9 Major Weeds found were: Ipomia aquatica, Myriophyllum, Limnathemu, Potamogetan, Hydrilla and Ceratophyllum.
Plate 18: Massanjor Reservoir
IRS P6 LISS III, March 2007

131
Plate 19: Wetland map - 5 km buffer area of Massanjor Reservoir

132

133
Plate 20: IRS LISS-III FCC – 5 km buffer area of Massanjor Reservoir

134

135
SOI MAP-SHEET-WISE WETLAND MAPS (Selected maps)

136

137

138

139

140

141

142

143

144

145
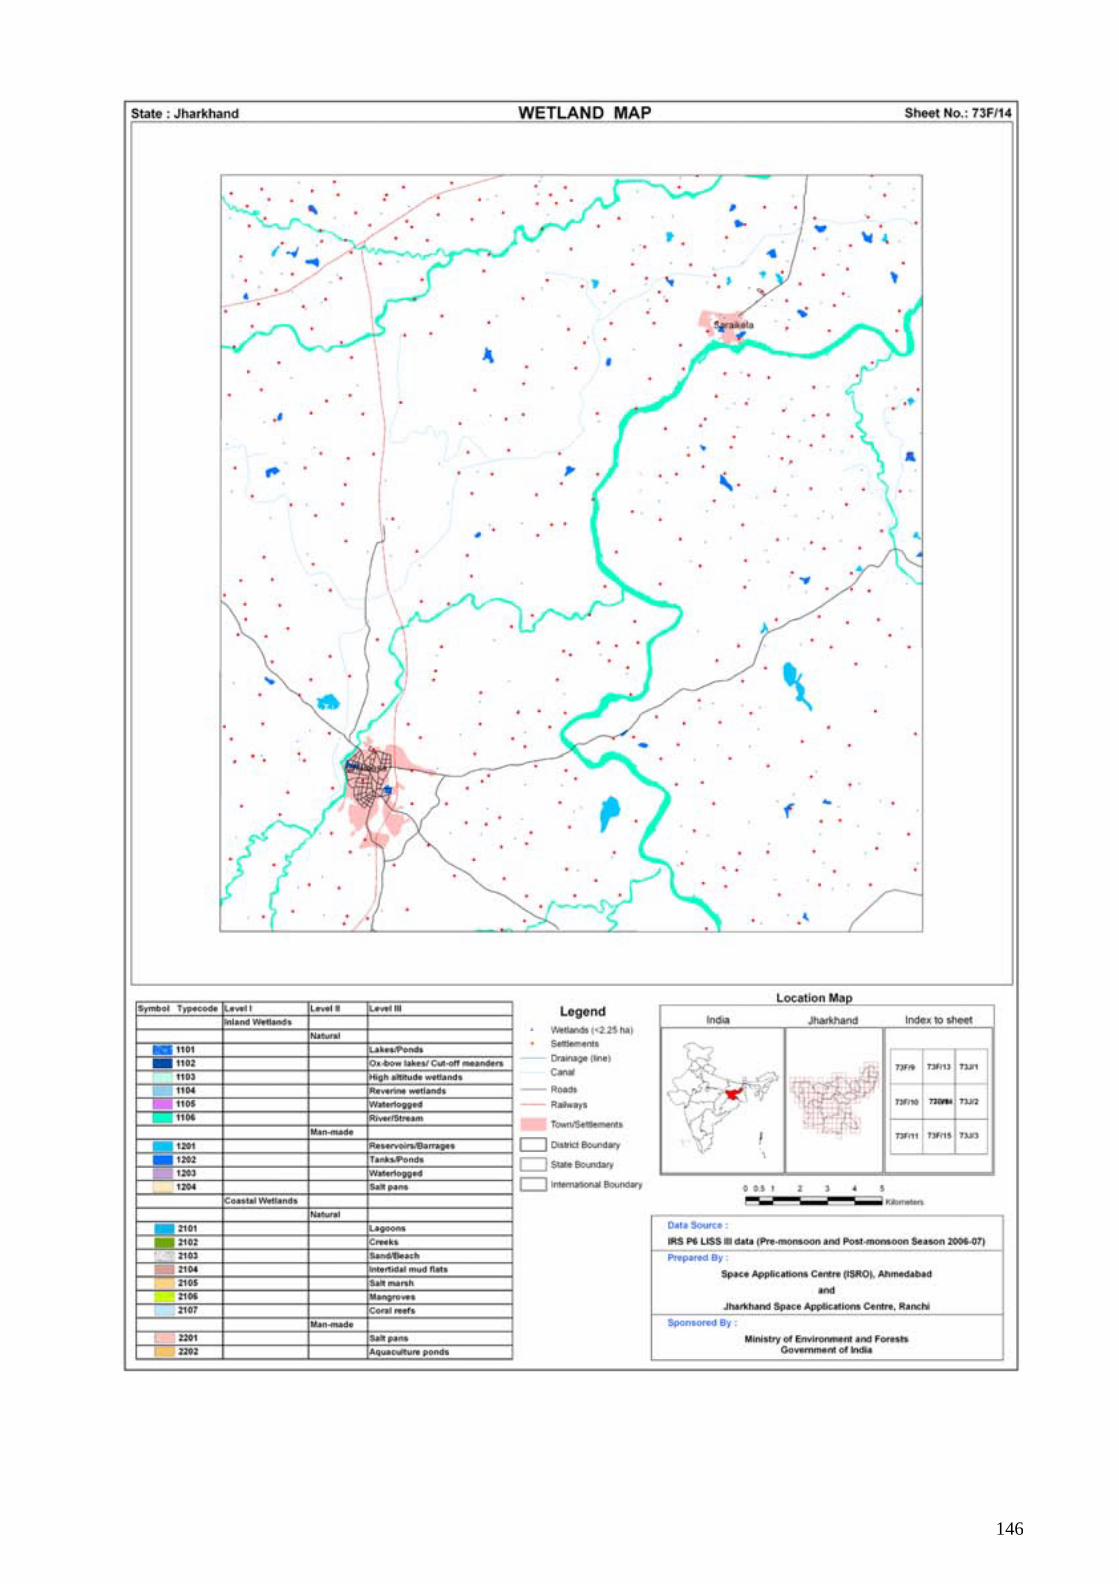
146

147

148

149
REFERENCES 1. Anon. 2005a. NNRMS Standards, A National Standard for EO images, thematic & cartographic maps,
GIS databases and spatial outputs. ISRO: NNRMS: TR: 112:2205. A Committee Report: National Natural Resources Management System, Bangalore.
2. Arvind Kumar,C. Bohra & A.K Singh, Environment Science Research unit S.K.M. University Dumka, Ecobiology of Avian Fauna of Udhuwa Lake of Jharkhand, India, - (2005 ) Pg 1-12
3. Ahmads S. H. and A.K. Singh, (1992). Present status potentialities and strategies for development of reservoir, Fisheries in Bihar. Fishing Chimes, 12(8); 49-57.
4. Annual Report 1997, Reservoir Fisheries of India. Food and Agriculture Organization of the United Nations (FAO) - Pg 357-37.
5. Cowardin, L.M., Carter, V., Golet, E.C. and La Roe 1979. Classification of wetlands and deep water habitats. USFWS/085-79/31, Office of the Biological Services, U.S. Fish and Wildlife Service, Washington, D.C.
6. Garg, J.K., Singh, T.S. and Murthy, T.V.R. (1998). Wetlands of India. Project Report: RSAM/sac/resa/pr/01/98, June 1998, 240 p. Space Applications Centre, Ahmedabad,
7. Garg J.K. and Patel J. G. 2007. National Wetland Inventory and Assessment, Technical Guidelines and Procedure Manual. SAC/EOAM/AFEG/NWIA/TR/01/2007. A Technical Report: Space Applications Centre, Ahmedabad.
8. H.S. Gupta, Water Birds Biodiversity of Ranchi District, Zoos ‘Print Journal (19(9): 1630; Manuscript 738; Zoo Outreach Organization; www. Zoosprint.org ,(September 2004)
9. Jensen, J.R. (1986). Introductory Digital Image Processing: A Remote Sensing Perspective, Prentice Hall, Englewoods Cliff, NJ.
10. Lacaux, J.P., Tourre, Y.M., Vignolles, C., Ndione, J.A. and Lafaye, M. 2007. Classification of ponds from high-spatial resolution remote sensing: Application to Rift valley fever epidemics in Senegal. Remote Sensing of Environment, 106, pp. 66-74.
11. Lillesand, T.M. and Keifer, R.W. 1987. Remote Sensing and Image Interpretation. John Wiley and Sons, New York.
12. Manorama Yearbook 2007 13. McFeeters, S.K. 1996. The use of Normalised Difference Water Index (NDWI) in the delineation of open
water features. International Journal of remote Sensing, 7, pp. 1425-1432. 14. Millennium Ecosystem Assessment. 2005, Ecosystems and Human Well-being: A Framework for
Assessment, http://www.MAweb.org 15. Navalgund, R.R., Nayak, S.R., Sudarshana, R., Nagaraja, R. and Ravindran, S. 2002. Proceedings of
the ISPRS Commission VII. Symposium on Resource and Environmental Monitoring, IAPRS & SIS, Vol.35, Part-7, NRSA, Hyderabad.
16. Negi, S.S. 1995. Handbook of National Parks, Sanctuaries and Biosphere Reserves in India. Indus Publishing Company, New Delhi. 270pp.
17. Patel J.G., Singh T.S., Garg J.K. 2003. Wetland Information System, West Bengal, SAC/RSAM/RESA/FLPG/WIS/01/2003. A Technical Report: Space Applications Centre, Ahmedabad.
18. Ramsar Convention (2007). www.ramsar.org 19. SACON, 2004, Inland Wetlands of India: Conservation Atlas. Coimbatore, Salim Ali Centre for
Ornithology and Natural History, 2004, ISBN 81-902136-1-X. , Vedams eBooks (P) Ltd. Vardhaman Charve Plaza IV, Building # 9, K.P Block, Pitampura,
20. Singh T.S., Patel J.G., Garg J.K. 2003. Loktak Lake Resources Information System (LRIS), SAC/RSAM/RESIPA/FLPG/WIS/ 02/ 2003. A Technical Report: Space Applications Centre, Ahmedabad.
21. Townshend, J.R., and Justice, C.O. 1986. Analysis of dynamics of African vegetation using the Normalised difference Vegetation Index. International Journal of Remote Sensing, 7, pp. 1435-1445.
22. Tucker, C.J. and Sellers, P.J. 1986. Satellite remote sensing of primary productivity. International Journal of Remote Sensing, 7, pp. 1395-1416.
23. Xu Hanqiu, 2006. Modification of normalised difference water index (NDWI) to enhance open water features in remotely sensed imagery. International Journal of Remote Sensing, 27, pp. 3025-3033.

150

151
Annexure I
Definitions of wetland categories used in the project
For ease of understanding, definitions of wetland categories and their typical appearance on satellite imagery is given below:
Wetland type code
Definition and description
1000 Inland Wetlands
1100 Natural
1101 Lakes: Larger bodies of standing water occupying distinct basins (Reid et al, 1976). These wetlands occur in natural depressions and normally fed by streams/rivers. On satellite images lakes appear in different hues of blue interspersed with pink (aquatic vegetation), islands (white if non-vegetated, red in case of terrestrial vegetation). Vegetation if scattered make texture rough.
1102 Ox-bow lakes/ Cut off meanders: A meandering stream may erode the outside shores of its broad bends, and in time the loops may become cut-off, leaving basins. The resulting shallow crescent-shaped lakes are called oxbow lakes (Reid et al, 1976). On the satellite image Ox-bow lakes occur near the rivers in plain areas. Some part of the lake normally has aquatic vegetation (red/pink in colour) during pre-monsoon season.
1103 High Altitude lakes: These lakes occur in the Himalayan region. Landscapes around high lakes are characterized by hilly topography. Otherwise they resemble lakes in the plain areas. For keeping uniformity in the delineation of these lakes contour line of 3000 m above msl will be taken as reference and all lakes above this contour line will be classified as high altitude lakes.
1104 Riverine Wetlands: Along the major rivers, especially in plains water accumulates leading to formation of marshes and swamp. Swamps are ‘Wetland dominated by trees or shrubs’ (U.S. Definition). In Europe, a forested fen (a peat accumulating wetland that has no significant inflows or outflows and supports acidophilic mosses, particularly Sphagnum) could be called a swamp. In some areas reed grass - dominated wetlands are also called swamps). (Mitsch and Gosselink, 1986).
Marsh: A frequently or continually inundated wetland characterised by emergent herbaceous vegetation adapted to saturated soil conditions. In European terminology a marsh has a mineral soil substrate and does not accumulate peat (Mitsch and Gosselink, 1986). Tone is grey blue and texture is smooth.
Comment: Using satellite data it is difficult to differentiate between swamp and marsh. Hence, both have been clubbed together.
1105 Waterlogged: Said of an area in which water stands near, at, or above the land surface, so that the roots of all plants except hydrophytes are drowned and the plants die (Glossary of Geology, 1974). Floods or unlined canal seepage and other irrigation network may cause waterlogging. Spectrally, during the period when surface water exists, waterlogged areas appear more or less similar to lakes/ponds. However, during dry season large or all parts of such areas dry up and give the appearance of mud/salt flats (grey bluish).
1106 River/stream: Rivers are linear water features of the landscape. Rivers that are wider than the mapping unit will be mapped as polygons. Its importance arises from the fact that many stretches of the rivers in Indo-Gangetic Plains and peninsular India are declared important national and international wetlands (Ex. The river Ganga between Brajghat and Garh Mukteshwar, is a Ramsar site, Ranganthattu on the Cavery river is a bird sanctuary etc.). Wherever, rivers are wide and features like sand bars etc. are visible, they will be mapped.
1200 Man-made
1201 Reservoir: A pond or lake built for the storage of water, usually by the construction of a dam across a river (Glossary of Geology, 1974). On RS images, reservoirs have irregular boundary behind a prominent dyke. Wetland boundary in case of reservoir incorporates water, aquatic vegetation and footprint of water as well. In the accompanying images aquatic vegetation in the reservoir is seen in bright pink tone. Tone is dark blue in deep reservoirs while it is ink blue in case of shallow reservoirs or reservoirs with high silt load. These will be annotated as Reservoirs/Dam. Barrage: Dykes are constructed in the plain areas over rivers for creating Irrigation/water facilities. Such water storage areas develop into wetlands (Harike Barrage on Satluj – a Ramsar site, Okhla barrage on the Yamuna etc. – a bird sanctuary). Water appears in dark blue tone with a smooth texture. Aquatic vegetation appears in pink colour, which is scattered, or contiguous depending on the density. Reservoirs formed by barrages will be annotated as reservoir/barrage.
1202 Tanks/Ponds: A term used in Ceylon and the drier parts of Peninsular India for an artificial pond, pool or lake formed by building a mud wall across the valley of a small stream to retain the monsoon (Glossary of Geology, 1974). Ponds Generally, suggest a small, quiet body of standing water, usually shallow enough to permit the growth of rooted plants from one shore to another (Reid et al, 1976). Tanks appear in light blue colour showing
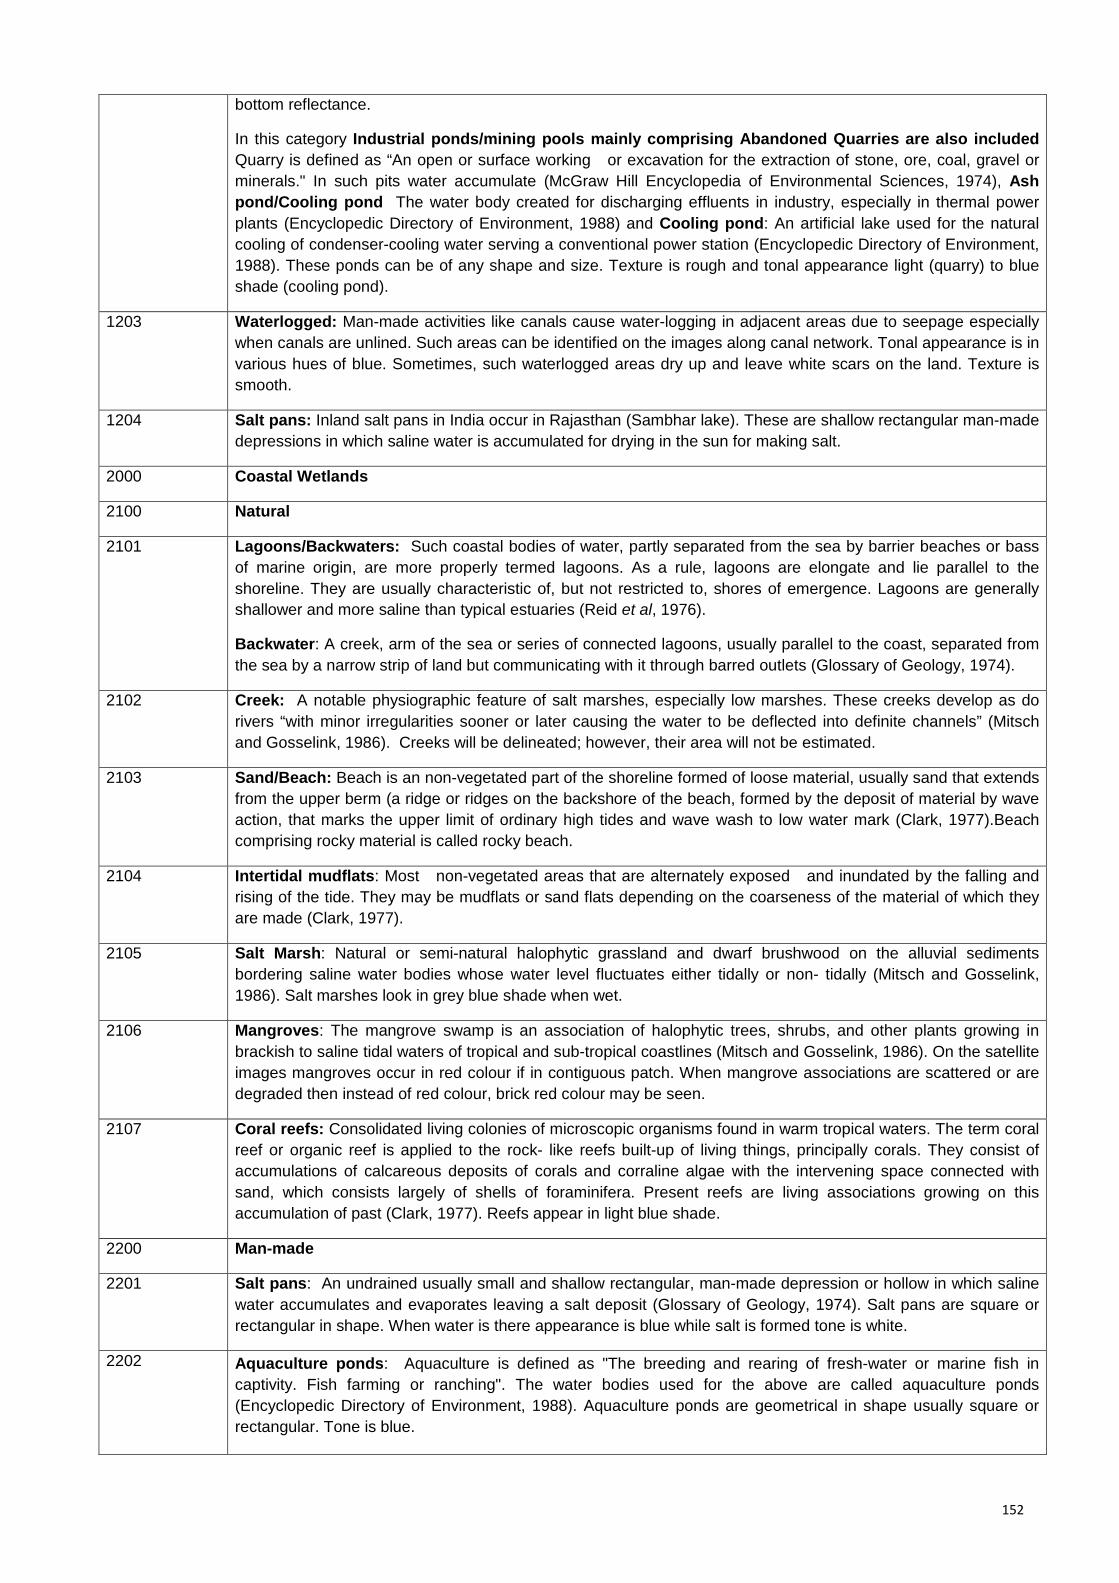
152
bottom reflectance.
In this category Industrial ponds/mining pools mainly comprising Abandoned Quarries are also included Quarry is defined as “An open or surface working or excavation for the extraction of stone, ore, coal, gravel or minerals." In such pits water accumulate (McGraw Hill Encyclopedia of Environmental Sciences, 1974), Ash pond/Cooling pond The water body created for discharging effluents in industry, especially in thermal power plants (Encyclopedic Directory of Environment, 1988) and Cooling pond: An artificial lake used for the natural cooling of condenser-cooling water serving a conventional power station (Encyclopedic Directory of Environment, 1988). These ponds can be of any shape and size. Texture is rough and tonal appearance light (quarry) to blue shade (cooling pond).
1203 Waterlogged: Man-made activities like canals cause water-logging in adjacent areas due to seepage especially when canals are unlined. Such areas can be identified on the images along canal network. Tonal appearance is in various hues of blue. Sometimes, such waterlogged areas dry up and leave white scars on the land. Texture is smooth.
1204 Salt pans: Inland salt pans in India occur in Rajasthan (Sambhar lake). These are shallow rectangular man-made depressions in which saline water is accumulated for drying in the sun for making salt.
2000 Coastal Wetlands
2100 Natural
2101 Lagoons/Backwaters: Such coastal bodies of water, partly separated from the sea by barrier beaches or bass of marine origin, are more properly termed lagoons. As a rule, lagoons are elongate and lie parallel to the shoreline. They are usually characteristic of, but not restricted to, shores of emergence. Lagoons are generally shallower and more saline than typical estuaries (Reid et al, 1976).
Backwater: A creek, arm of the sea or series of connected lagoons, usually parallel to the coast, separated from the sea by a narrow strip of land but communicating with it through barred outlets (Glossary of Geology, 1974).
2102 Creek: A notable physiographic feature of salt marshes, especially low marshes. These creeks develop as do rivers “with minor irregularities sooner or later causing the water to be deflected into definite channels” (Mitsch and Gosselink, 1986). Creeks will be delineated; however, their area will not be estimated.
2103 Sand/Beach: Beach is an non-vegetated part of the shoreline formed of loose material, usually sand that extends from the upper berm (a ridge or ridges on the backshore of the beach, formed by the deposit of material by wave action, that marks the upper limit of ordinary high tides and wave wash to low water mark (Clark, 1977).Beach comprising rocky material is called rocky beach.
2104 Intertidal mudflats: Most non-vegetated areas that are alternately exposed and inundated by the falling and rising of the tide. They may be mudflats or sand flats depending on the coarseness of the material of which they are made (Clark, 1977).
2105 Salt Marsh: Natural or semi-natural halophytic grassland and dwarf brushwood on the alluvial sediments bordering saline water bodies whose water level fluctuates either tidally or non- tidally (Mitsch and Gosselink, 1986). Salt marshes look in grey blue shade when wet.
2106 Mangroves: The mangrove swamp is an association of halophytic trees, shrubs, and other plants growing in brackish to saline tidal waters of tropical and sub-tropical coastlines (Mitsch and Gosselink, 1986). On the satellite images mangroves occur in red colour if in contiguous patch. When mangrove associations are scattered or are degraded then instead of red colour, brick red colour may be seen.
2107 Coral reefs: Consolidated living colonies of microscopic organisms found in warm tropical waters. The term coral reef or organic reef is applied to the rock- like reefs built-up of living things, principally corals. They consist of accumulations of calcareous deposits of corals and corraline algae with the intervening space connected with sand, which consists largely of shells of foraminifera. Present reefs are living associations growing on this accumulation of past (Clark, 1977). Reefs appear in light blue shade.
2200 Man-made
2201 Salt pans: An undrained usually small and shallow rectangular, man-made depression or hollow in which saline water accumulates and evaporates leaving a salt deposit (Glossary of Geology, 1974). Salt pans are square or rectangular in shape. When water is there appearance is blue while salt is formed tone is white.
2202
Aquaculture ponds: Aquaculture is defined as "The breeding and rearing of fresh-water or marine fish in captivity. Fish farming or ranching". The water bodies used for the above are called aquaculture ponds (Encyclopedic Directory of Environment, 1988). Aquaculture ponds are geometrical in shape usually square or rectangular. Tone is blue.

153
Annexure – II
Details of District information followed in the atlas
Source : Survey of India (Surveyed in 2004 and published in 2005)

154

Space Applications Centre (SAC) is one of the majorcentres of the Indian Space Research Organisation(ISRO). It is a unique centre dealing with a wide variety ofdisciplines comprising design and development ofpayloads, societal applications, capacity building andspace sciences, thereby creating a synergy oftechnology, science and applications. The Centre isresponsible for the development, realisation andqualification of communication, navigation, earth &planetary observation, meteorological payloads andrelated data processing and ground systems. Severalnational level application programmes in the area ofnatural resources, weather and environmental studies,disaster monitoring/mitigation, etc are also carried out. Itis playing an important role in harnessing spacetechnology for a wide variety of applications for societalbenefits.
SAC is a host institution for the training programmesrelated to Satellite Communication, Satellite Meteorologyand global change under the Centre for Space Science &Technology Education in Asia and the Pacific (CSSTEAP)affiliated to the United Nations (UN).
http://www.isro.org

Space Applications centre Indian Space Research Organisation
Ahmedabad – 380 015


