67
JHR PUBLICATIONS COMPAC' (LENDING SECTIUN)

JHR PUBLICATIONS COMPAC' (LENDING SECTIUN)

BMR GEOLOGY AND GEOPHYSICS AUSTRALIA
BMR RECORD 1991/102 FOSSIL FUELS 7
SEQUENCE STRATIGRAPHIC INTERPRETATION OF SEISMIC DATA IN THE TAROOM REGION,
BOWEN AND SURAT BASINS, QUEENSLAND
"' " , "" "" " * R 9 1 1 020 1 *
by
I.M. TOTTERDELL, A.T. WELLS, A.T. BRAKEL, R.I. KORSCH & M.G. NICOLL
Onshore Sedimentary & Petroleum Geology Program Bureau of Mineral Resources, Canberra.
A CONTRIBUTION TO THE NATIONAL GEOSCIENCE MAPPING ACCORD PROJECT:
SEDIMENTARY BASINS OF EASTERN AUSTRALIA

DEPARTMENT OF PRIMARY INDUSTRIES AND ENERGY
Minister: The Hon. Alan Griffiths
Secretary: G.L. Miller
BUREAU OF MINERAL RESOURCES, GEOLOGY AND GEOPHYSICS
Executive Director: R.W.R. Rutland AO
© Commonwealth of Australia, 1992
ISSN 0811 - 062X
ISBN 0642 17581 0
This work is copyright. Apart from any fair dealing for the purposes of study, research, criticism or review, as permitted under the Copyright Act, no part may be reproduced by any process without written permission of the Executive Director, Bureau of Mineral Resources, Geology and Geophysics. Inquiries should be directed to the Principal Information Officer, Bureau of Mineral Resources, Geology and Geophysics, GPO Box 378, Canberra, ACI' 2601.
It is recommended that this pUblication be referred to as:
TOTTERDELL, J.M., WELLS, A.T., BRAKEL, A.T., KORSCH, R.J. & NICOLL, M.G., 1992. Sequence stratigraphic interpretation of seismic data in the Taroom region, Bowen and Surat basins, Queensland. Bureau of Mineral Resources. Australia, Record 1991/102, 61 pp.
CONTENTS
Abstract (A TW) ......................................................................................................
Introduction (A TW)
Geological setting of the Bowen and Surat Basins (JMT)
Sequence boundaries and sequences in the Taroom region (ATB)
Geometry of stratigraphic sequences and stratigraphic units (A TW)
Structural configuration and tectonic development of the Bowen and Surat basins in the Taroom region (JMT & RJK)
Conclusions (A TW)
Acknowledgements
References
Appendices (MGN)
'. I
iv
1
7
11
23
35
53
54
55
60

ABSTRACT (ATW)
An interpretation of seismic stratigraphic sequences in the Bowen and Surat Basins commenced in a transect covering the Taroom Trough and Comet Ridge in the Taroom region. Thirteen reflectors in the Taroom Trough were selected for mapping on the basis of their continuity and integrity. U sing seismic stratigraphic principles it could be demonstrated that at least seven of these reflectors define sequences bounded by regional unconformities. In addition, three reflectors, also identified as sequence boundaries, were recognised near the Comet Ridge on the western margin of the Taroom region. Isopach and structure contour maps were produced for all reflections and intervals using Petroseis7M software. [The isopach and structure contours are expressed in twoway travel time in milliseconds and not as true thicknesses and depths in metres, and hence are referred to as isopach and structure contour maps for convenience.]
Isopachs for the Permian Back Creek and Blackwater Groups generally show a regional easterly increase in sediment thickness, a roughly meridional trend to the isopachs and depocentres commonly developed on the eastern side of the mapped area, so that there is an asymmetrical profile to the preserved sedimentary package. This profile illustrates the strong influence of basement subsidence and structural development on the history of sedimentation. Structural growth and thinning of some units over discrete structures within the mapped area can also be demonstrated.
A similar pattern of isopachs is common to the Permo-Triassic 'Mimosa Supergroup' except that they are strongly modified by
iv
erosion as a result of structural growth, uplift and erosion towards the Auburn Arch, combined with thinning of units in this direction.
Isopachs on the Jurassic Surat Basin show the preserved sedimentary succession in the Mimosa Syncline, with the sediments being symmetrically disposed around the south plunging synclinal axis and thinning gradually towards the exposed eroded margins.
The principal structural feature in the study area is the Mimosa Syncline which is well displayed in the Jurassic rocks in outcrop. The syncline is elongated and symmetrical at depth but becomes asymmetrical upwards and the depocentres for individual units have migrated northwards. However, at the base Surat Basin level the syncline is symmetrical and plunges southwards. The depocentre axes mostly occur to the east of the Mimosa Synclinal axis so that folding was independent of the position of the deepest part of the Taroom Trough.
A working model for the tectonic development of the Bowen Basin envisages initiation in the Late Carboniferous -Early Permian in a back arc extensional regime, with subduction well to the east of the Camboon Volcanic Arc. ENE-WSW compression in mid-Permian time caused the onset of foreland loading which accelerated in the Late Permian to lateEarly Triassic. During this time there was reactivation of earlier extensional related structures. Late Triassic erosion was followed by Jurassic Surat Basin deposition in a gently subsiding intracratonic sag.
Seismic surveys along the eastern margin of
the Bowen Basin indicate differing structural styles and change in character along strike. The eastern margin of the Bowen Basin in the Taroom area shows strong tilting of the sediments beneath the Surat Basin sediments and a monoclinal fold dominates the structure. Foreland loading in the Late Permian to late-Early or Middle Triassic with subsidence driven by thrust faults is a suggested mechanism for the late tectonic development of this region. Duplexing of the basement to the east is implied with west directed thrusting. Maximum subsidence occurred adjacent to the thrust sheets where the load was greatest. The western limb of the Mimosa Syncline probably resulted from depositional dips that was little modified by tectonism, whereas the steeper eastern limb was produced by thrusting on the eastern margin.
Tectonic subsidence curves for the Taroom area all have a consistent pattern showing four main stages of structural development: 1. early thennally-driven subsidence, 2. rapid subsidence with a sedimentary pile greater than 7 kIn thick in the Taroom Trough, 3. a period of non-deposition and erosion represented by the unconformity at the base of the Surat Basin, 4. finally, slow subsidence probably caused by thennal relaxation. It is estimated that it took about 10 Ma for the effects of thrusting to be propagated 100 kIn to the west.
v

INTRODUCTION (ATW)
PROJECT BACKGROUND
The Sedimentary Basins of Eastern Australia (SBEA) Project is a multidisciplinary study of the Bowen, Surat and Gunnedah Basins. It is part of the National Geoscience Mapping Accord and is a collaborative Project between the Bureau of Mineral Resources (BMR), Geological Survey of Queensland (Department of Resource Industries) and New South Wales Department of Mineral Resources (Geological Survey and Coal & Petroleum Geology Branches), with cooperation from CSIRO, universities and industry.
Although the Bowen, Surat and Gunnedah Basins have considerable resource potential and there have been both regional and local studies of the basin system, there are still uncertainties as to their precise geometry, mode of formation, the relationship of basin development to tectonic events in neighbouring orogenic zones, and the control exerted by these events on the timing of the generation and accumulation of hydrocarbons. In addition, a rationalisation and refinement of the information on dating the sediments is required, in particular, an improvement in the precision of dating and correlation of the sedimentary packages.
OBJECTIVES
The aim of the project is to undertake an integrated basin analysis with emphasis on sedimentary, structural, tectonic and thermal histories of the sedimentary basins in order to assess the economic potential for hydrocarbons in the basins. The strategies
1
applied to achieve the objectives of the project are:
1.
2.
3.
Determine the spatial and temporal distribution of the various sedimentary packages as an aid towards understanding the distribution and nature of hydrocarbon resources.
Determine the structural geometry, evolution and tectonic setting of the sedimentary packages.
Determine the maturation and burial history.
4. Provide an integrated geological history of the basin system.
The purpose of this report is to record the initial results of the first phase of a regional seismic synthesis, using the principles of sequence stratigraphy in the interpretation and integration of industry and BMR seismic data in the Taroom region of the Bowen and Surat Basins (Fig. 1).
TECHNIQUES AND METHODOLOGY
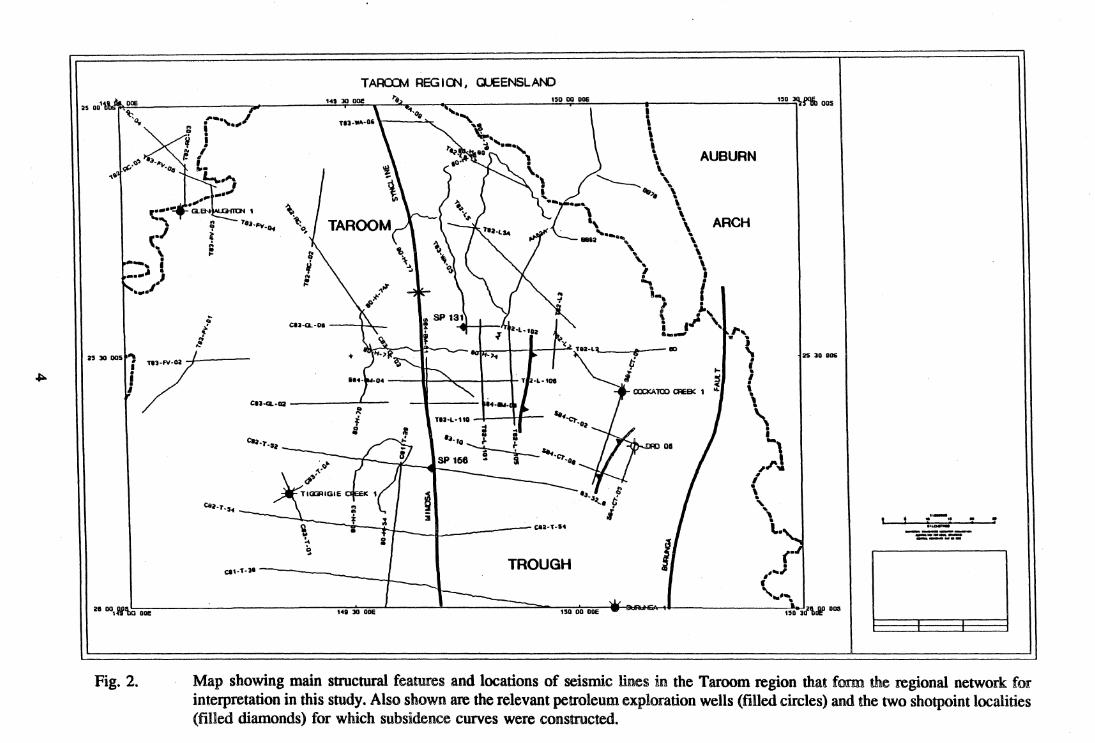
A network of industry seismic lines was selected to provide a regional coverage, with approximately 10 km line spacing where possible (Fig. 2). Preference was placed on the more recent multifold seismic surveys, but in some areas only early single fold data were available. Interpretation of the industry seismic lines commenced in the Taroom- Mundubbera Sheet areas in the northeastern comer of the Surat Basin (Fig. 1) where a very thick succession of Permian and Triassic

20°–
0^ 200 km
PACIFIC OCEAN
24°—
28°–
32 °–
LACHLANOROGEN
16/A/209-2
Study area
— — Concealed margin ofPermo-Triassic sediments
Fig. 1. Location of the Taroom region within the sedimentary basins of eastern Australia.
2

sediments is preserved beneath acomparatively thin succession of Jurassicsediments. We refer here to this area,shown in full on Figure 2, as the Taroomregion. The principles of sequencestratigraphy (for example, Vail & others,1977a, 1977b; Mitchum, 1977; VanWagoner & others, 1988, 1990) wereapplied to the interpretation of the seismicsections, as outlined in the section onSequence Boundaries and Sequences.
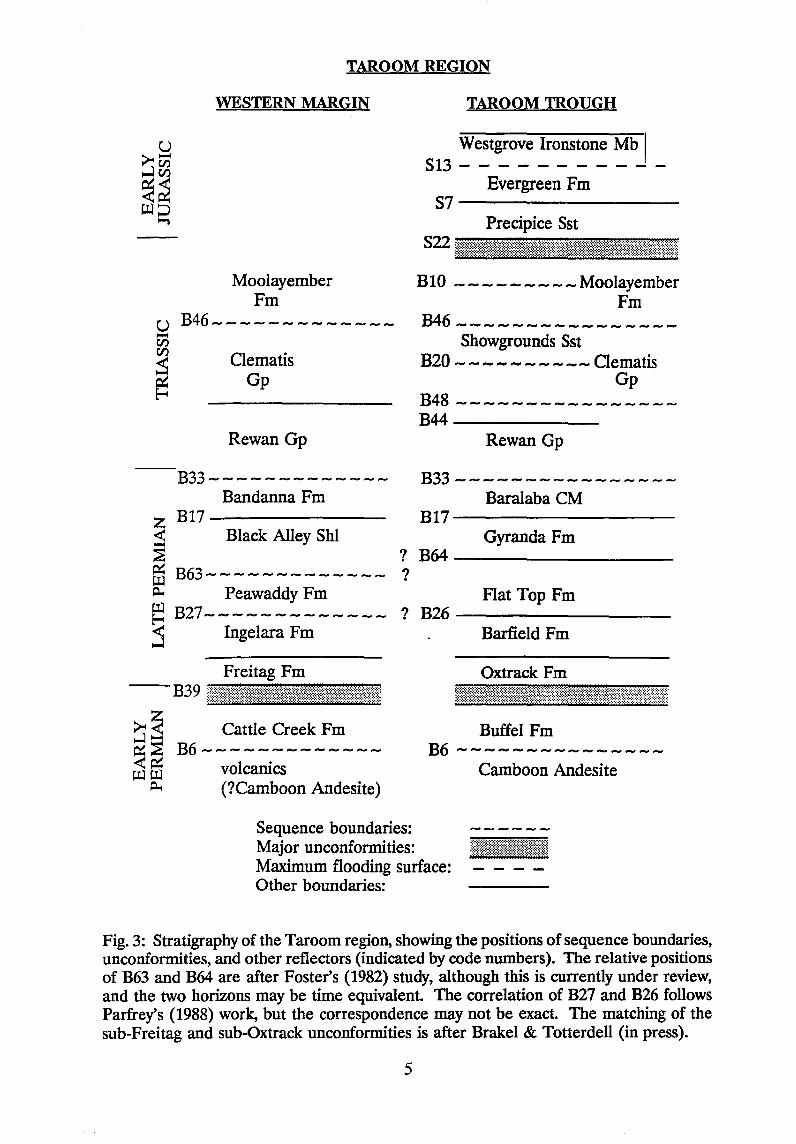
The formation boundaries and sequenceboundaries were colour coded on papercopies of the seismic sections and thepresence of stratal terminations, truncations,onlap, offlap and similar features related tothese boundaries were marked and tabulatedonto data record sheets where applicable. Astandard pro forma was used to record thedata obtained. The relationship of theseismic reflectors to the establishedstratigraphy, as determined from well logand outcrop correlation, was referenced toa stratigraphic table relating to the TaroomTrough (Fig. 3).
In addition to the characteristics ofsequence boundaries, any stratal patternsand intra-sequence formation patternsdiscernible on the seismic line were noted.Well ties were made using standard graphiclogs with well depths converted to two-waytime (TWT) using rms velocities. In thelonger term, when digitised sonic log dataare available, synthetic seismograms will beused to confirm well ties. The seismicsequence and formation boundaries weretied around closed loops wherever possible.
After completion of the interpretation,verification of the closures around loop ties,correlating the selected seismic reflectorswith wells and recording the data, thesequence and formation boundaries on theinterpreted lines were digitised andprocessed in the Petroseism seismic dataprocessing package. Using this system, two-
way travel time isopach and structurecontours, cross sections and isometricdiagrams of the network of industry seismicwere produced. The PEPTM system will beused to process digital wireline log data forthe production of synthetic seismogramsand the display of well log correlations andgraphic log displays. Digitised sonic logdata are being processed by the GeologicalSurvey of Queensland.
Most of the maps that form the basis forthis Record are not reproduced here, but arelisted in Appendix 1 and can be obtainedseparately at a scale of 1:250 000 from theBMR Sales Centre. The maps can beexamined in the BMR by arrangement withR.J. Korsch or A.T. Wells. A digitaldatabase including shot point and horizondata for all interpreted lines or anycombination of lines and horizon data isalso available (see Appendix 2).
Although we refer to the maps as isopachmaps or structure contour maps forconvenience, they have been compiled fromseismic two-way travel time data inmilliseconds and have not been convertedto depth or thickness in metres.
Nomenclature
An explanation of the nomenclatureemployed in this report for some of thecommonly used basin terms is deemednecessary to avoid any confusion. The twomost commonly used terms in the BowenBasin and Surat Basin to describe thedisposition, geometry and historical geologyof the sedimentary fill are the TaroomTrough and the Mimosa Syncline. The termTaroom Trough is used in this report todefine the limits of the depositional basin inwhich the thickest sediments weredeposited, that is, the area encompassingthe depocentres. Whilst it may be difficultto precisely define the boundaries between
3
~
TAR<XM REGI~, GlJEENSLAI'D '41 DOE '4' :JO - "t.l 150 DO ODE '.0 :JO OOE ~ , ~ I 2. 00 0 '",- I'" '\..."Ii i ' r' DO 005
~Oy ~I'I .. ·, ..... I Tn~W"aO' " )< '_... \
.o~ ... .,J_ ...
~ ..... "" ~'O ..
t:--_.
" rJ .. ,-... \ .. . .. " .. A ; .... ,.
., 30 ODS''') I o ,
I
:: ~ E
l : ..
<:ai'T.,.
'\'t. .~
cal-a.-De J '
\ \ , AUBURN \
~ \ ~.>. \ -.& \ , \
" \ ARCH _Ia .... ,. ... • .. , \
" .. .. " " . .. , I • • • ""\ ;
R .. , I , 0
\ J-, I I~" .. - 1" ...
~- .. ,IL_ L ""-~T ••• q , II> . \ If
i ... ~ II.
, • I
cu· ...... ------7-- \ \
L, n2·L·1tD I ,
ca.·T•Si
iI ;: . . ·~·'O -......L... ~ -..~
. a~ "'''-''0. SP 156 ~ S ~ ".r ...
~ ( . " .. i
\ _____ L - caa-T-S4
, \..
s (" C81-"(']O ~
TROUGH o
I'"'' ,
25 lD 011&
, ..... I ,===-- ' * &fiOIG' .1 \ I 28 OO,lII'lbO Doe '48 :JO ODE "0 00 ODE" 150"lQ2\Jl!l DDS
,,-. " ., ,. --------------_.
Fig. 2. Map showing main structural features and locations of seismic lines in the Taroom region that form the regional network for interpretation in this study. Also shown are the relevant petroleum exploration wells (filled circles) and the two shotpoint localities (filled diamonds) for which subsidence curves were constructed.
TARO OM REGION
WESTERN MARGIN
Moolayember Fm
u B46-,.,.------- ____ _ -en
~ ~
Clematis Gp
Rewan Gp
B33 - - - - - - - - - - - --Bandanna Fm
Z B17----------------
TAROOM TROUGH
Westgrove Ironstone Mb I S13 - - - - - - - - - - -
Evergreen Fm S7-------------------
Precipice Sst
BID - - _ - - ____ Moolayember Fm
B46 _______________ _
Showgrounds Sst
B20 ---------- Clematis Gp
B~-------________ _ B44----------__ _
Rewan Gp
B33 ----------------Baralaba CM
BI7-------------------Gyranda Fm ~ Black Alley Shl
~ ? B64 ---------___ .....;..-__ _ ffi B63------------- ? ~ Peawaddy Fm Flat Top Fm ~ B27------------_ ~ Ingelara Fm
? B26------------------Barfield Fm
Freitag Fm Oxtrack Fm B39!ffiIifffWfti!iiiiIiiifiii!i!fNIIIii!iiiiifiIIIifffff
~ 3 Cattle Creek Fm P::;::§ B6 -------------~ Uj volcanics
Buffel Fm B6---------------
Camboon Andesite ~ (?Camboon Andesite)
Sequence boundaries: Major unconformities: Maximum flooding surface: Other boundaries:
Fig. 3: Stratigraphy of the Taroom region, showing the positions of sequence boundaries, unconformities, and other reflectors (indicated by code numbers). The relative positions of B63 and B64 are after Foster's (1982) study, although this is currently under review, and the two horizons may be time equivalent. The correlation of B27 and B26 follows Parfrey's (1988) work, but the correspondence may not be exact. The matching of the sub-Freitag and sub-Oxtrack unconformities is after Brakel & Totterdell (in press).
5

the Taroom Trough and neighbouring Comet Ridge and Auburn Arch, it nevertheless follows that the axis defining the greatest thickness of sediments in the basins must be coincident with the axis of the Taroom Trough. The term Mimosa Syncline is used for the structural feature that postdates deposition in the Bowen Basin and was caused by deformation of probable Late Triassic age. Its geometry was possibly enhanced during subsidence associated with deposition of the Surat Basin and/or during deformation after deposition ceased. The syncline is well illustrated chiefly by the fold, so clearly displayed in the outcrop of the sedimentary succession in the Surat Basin in the Taroom region.
WORK PROGRAM
The work program of sequence stratigraphic interpretation in the Sedimentary basins of eastern Australia Project is designed so that a series of latitudinal transects across the Bowen, Surat and Gunnedah Basins are systematically interpreted, and contour maps and three dimensional displays of the data prepared.
This Record details the results from the major part of the fIrst transect which runs across the northeastern part of the Surat Basin, and underlying and cropping out Bowen Basin, in the Taroom region. A multifold line across the axis of the Taroom Trough was the starting point for selecting and defining prominent reflections and testing their continuity across the study area transect. Initially, reflections were picked for their continuity and integrity, and tested using seismic stratigraphic principles (see references above) to determine sequence boundaries; no attention was paid, in the fIrSt instance, to the lithostratigraphy. A corollary is that possibly some sequence boundaries are not represented by strong
6
reflectors. After the horizons were selected for interpretation, attempts were made to correlate them with exploration wells and identify their position relative to lithostratigraphic contacts. Well control on the eastern part of the Sheet area is sparse and identification of the reflection events relies largely on correlation with three deep wells - UOD Cockatoo Creek 1, COE Tiggrigie Creek 1 and MP A Glenhaughton 1, and one shallow stratigraphic bore, GSQ DRD 6. Initially, identification of the Triassic reflectors depended on an approximate projection to formation boundaries in outcrop on the eastern edge of the Bowen Basin to the north of the interpreted transect, in the Baralaba Sheet area. The tie with the Tiggrigie Creek 1 well gave a more definitive identification of the reflectors in the Triassic succession although there are still significant gaps in the line ties to the south. Direct line ties from east to west along the transect are not possible because the few seismic lines shot on the Comet Ridge are isolated from the more dense coverage over the Taroom and Denison Troughs on either side.
The analysis of the network industry seismic lines will continue westwards into the Denison Trough to complete the latitudinal transect. From here a tie will be made with seismic line BMR78.06 to the north completing the network of industry seismic lines on the Baralaba, Springsure, Duaringa and Emerald 1 :250 000 Sheet areas. From this point the interpretation coverage will continue to the south, progressing in latitudinal transects until the regional seismic coverage of the Bowen-Surat and Gunnedah Basins is completed.

GEOLOGICAL SETTING OF THE BOWEN AND SURAT BASINS (JMT)
INTRODUCTION
The Penno-Triassic Bowen Basin and the overlying Jurassic-Cretaceous Surat Basin are located in eastern Queensland and northern New South Wales (Fig. 1). The Bowen Basin is the northernmost part of the Sydney-Gunnedah-Bowen basin system. The basin contains up to 10 km of terrestrial and shallow marine, largely clastic sediments, and has substantial deposits of black coal. The thickest successions are found in the Taroom and Denison Troughs, which are separated by the Comet Ridge. Figure 3 shows the generalised stratigraphy of the Bowen and Surat basins in the study area, as well as the correlation between the Taroom Trough succession and the section intersected in the Glenhaughton 1 well on the Comet Ridge which has been interpreted in terms of Denison Trough nomenclature. Outcrops of the Bowen Basin extend from the Collinsville area in the north, south to approximately 25°S, where they are unconformably overlain by sedimentary rocks of the Surat Basin. The Bowen Basin succession continues in the subsurface beneath the Surat Basin southwards into New South Wales, where it is contiguous with the Gunnedah Basin. During its development, the Bowen Basin was bounded to the east by a continental margin volcanic arc and an active orogenic belt of the New England Orogen, and to the west by a relatively stable craton of Early to Middle Palaeozoic rocks.
The Surat Basin is continuous with the Eromanga Basin across the Nebine Ridge in the west, and with the Clarence-Moreton Basin across the Kumbarilla Ridge in the east. The basin extends well into New
7
South Wales where it unconformably overlies the Gunnedah Basin and parts of the Lachlan Orogen. The Surat Basin succession consists of up to 2500 m of generally flat-lying, clastic sedimentary rocks that were deposited in fluviolacustrine to shallow marine environments. Sedimentary rocks of the Surat Basin are more widespread than those of the Bowen Basin, although the greatest sediment thickness approximately coincides with the axis of the underlying Taroom Trough.
GEOLOGICAL DEVELOPMENT
The Bowen Basin was initiated in the latest Carboniferous or Early Permian due to back-arc extension associated with subduction along a continental margin volcanic arc (Camboon Volcanic Arc). This extension led to the development of a series of half-graben in the western part of the basin (Denison Trough); small half-graben have also been recognised at the base of the Taroom Trough succession (Elliott & Brown, 1988), and in the westernmost part of the Taroom Trough, south of the Denison Trough (Cosgrove & Mogg, 1985). Initial Early Permian sedimentation was confined to these structures. In the Denison Trough, quartzose clastics and coal were deposited in fluvial, lacustrine and deltaic environments (Reids Dome beds). Similar sediments were deposited in other halfgraben such as the Arbroath Trough to the south. Following the extensional phase, the basin underwent regional sag. Although sedimentation was initially restricted to the half-graben, a marine transgression subsequently covered much of the basin. Mixed carbonate and siliciclastic sedimentation occurred in the Taroom
, I

Trough (Buffel Formation and equivalents), while in the west, the fine-grained clastic rocks of the Cattle Creek Formation were deposited. Uplift on the basin margins led to the influx of coarse, quartzose sediments as deltas prograded into the basin from the west (Aldebaran Sandstone). Structural instability is reflected in unconformities within both the Cattle Creek Formation and Aldebaran Sandstone. This phase of deformation was again followed by a period of basinal sag. The subsequent marine transgression saw the deposition of deltaicshallow marine sediments throughout much of the basin. The sediments of the Cattle Creek Formation-Catherine Sandstone interval in the Denison Trough are quartzose, indicating derivation from the craton to the west. Equivalent sediments on the eastern side of the basin are more lithic and were probably derived from the inactive volcanic arc. Volcanolithic sediments in the Peawaddy and Flat Top Formations, together with the occurrence of air-fall tuffs, indicate tectonic activity in the orogen to the east and the onset of foreland basin conditions (Fielding & others, 1990). During the Late Permian, sediments shed from the orogen accumulated in alluvial plain, deltaic and paralic environments to form the extensive coal measures of the Blackwater Group and equivalents. Beginning in the latest Permian, the basin underwent a period of compression and partial inversion, which culminated in the Middle Triassic. Deposition of fluvial sediments, including red-beds, began in the latest Permian (Foster, 1983) and continued into the Middle Triassic. The ongoing deformation is reflected within the Triassic succession by the presence of alluvial fan sediments and unconformities of both local and regional extent. Deformation culminated in the Middle or early Late Triassic and deposition ceased in the basin. Up to 3000 m of sediment was eroded from its tilted eastern margin.
8
Surat Basin sedimentation commenced in the Early Jurassic with the deposition of the fluvial Precipice Sandstone. Fluvial and fluvio-lacustrine conditions, with some marine influence during deposition of the Evergreen Formation, prevailed until the Early Cretaceous. A basinwide marine transgression in the Early Cretaceous led to the deposition of coastal plain-marine shelf sediments of the Bungil Formation and Rolling Downs Group. Deposition was controlled by slow subsidence, with intermittent deformation due to movement on pre-existing faults.
TECTONIC SETTING
The Bowen Basin forms the northernmost section of the larger Sydney-GunnedahBowen basin system (Fig. 1). The basin contains two main depositional areas, the NNW -SSE trending Taroom and Denison Troughs, which are separated by the Comet Ridge. The troughs are bounded in the west by the Anakie Inlier and Drummond Basin, and the Collinsville, Springsure and Roma shelves, and in the east by the Gogango Overfolded Zone and the Connors and Auburn Arches. The Taroom Trough is an asymmetric, near-meridional trough that extends from Collinsville in the north to the Gunnedah Basin in NSW. The eastern boundary of the Taroom Trough is defined by the Burunga-Leichhardt-MoonieGoondiwindi-Mooki fault system. An intensely deformed region in the northeastern part of the Taroom Trough, east of the Comet Platform, is termed the Dawson Fold Zone.
Several models have been proposed for the tectonic and structural evolution of the Bowen Basin. A widely accepted model for the origin of the Sydney-Gunnedah-Bowen Basin system is that it is a foreland basin to the New England Orogen (see, for example, Murray, 1985; Fielding & others, 1990).

However, a number of workers (Scheibner, 1973; Harrington, 1982; Korsch, 1982; Harrington & Korsch, 1985; Ziolkowski & Taylor, 1985; Hammond, 1987; Mallett & others, 1988; Murray, 1990) have argued that the Sydney-Gunnedah-Bowen basin system had an extensional or transtensional origin. Korsch & others (1988, 1990b) suggested that a normal extensional model is not compatible with seismic evidence of nearly-vertical bounding faults. They proposed that the basin developed in a transtensional environment, with a significant component of strike-slip movement along the controlling BurungaGoondiwindi-Mooki Fault System.
Murray (1985) argued that the Bowen Basin was a retroarc foreland basin and proposed that the initial subsidence was due to loading of the crust, not by the foreland thrust pile, but by the volcanic and plutonic rocks of the adjacent Camboon Volcanic Arc. A period of Late Carboniferous-Early Permian extensional tectonism that produced half-graben in the Denison Trough and western Taroom Trough, however, has long been recognised (e.g. Paten & others, 1979; Bauer & Dixon, 1981; Cosgrove & Mogg, 1985). Subsequently, Hammond (1987) proposed the application of a crustal extension model to explain the early development of the Bowen Basin. Using this model, Mallett & others (1988) presented a three-stage history to describe the tectonic development of the Bowen Basin, based largely on the work of Ziolkowski & Taylor (1985) in the Denison Trough. In the Early Permian, the area underwent a rift phase, with thick sediments deposited in the Denison Trough, and abundant volcanics in the Taroom Trough. Bounding faults had a NNW -SSE orientation, following basement grain. The andesitic volcanics in the eastern part of the basin were the product of the Camboon Volcanic Arc, a major feature coincident in location with the Devonian-Carboniferous
9
Connors-Auburn Volcanic Arc (Day & others, 1983). This extensional regime was followed by a period of thennal relaxation, with shallow and marginal marine sedimentation over most of the basin and thick deposits in the Taroom Trough. Compression, with some inversion of halfgraben successions, was initiated during the late Early-early Late Permian. During the Late Permian, the basin underwent a forel!Jnd basin phase, with widespread marine transgression, followed by coal measure sedimentation. Deposition was concentrated in the Taroom Trough. In the latest Permian-Middle Triassic, the basin was subjected to a period of shortening with reactivation of the bounding faults, partial inversion of the basin and the development of new high-angle reverse faults (Ziolkowski & Taylor, 1985). The Gogango Overfolded Zone on the eastern side of the basin contains westward-directed thrusts and tight folds which are consistently overturned to the west; it has a typical foreland fold-thrust belt geometry (Murray, 1985).
"
As p~ of their extensional model for the initial development of the basin, Hammond (1987) and Mallett & others (1988) proposed the existence of a set of northeastsouthwest trending transfer faults. These inferred faults divide the basin into domains that are internally consistent with respect to NNW-SSE trending features, but which are significantly different from adjacent domains.
In 1989 the BMR conducted a deep seismic reflection survey in the Bowen Basin to test various tectonic and structural models for the basin. Line BMR89.BOl (see Korsch & others, 1990c for location) was located in a corridor between two of the postulated transfer faults. The data from this line suggest that the Permo-Triassic succession thickens to the east. The seismic line clearly illustrates the deformation of the
sedimentary succession, which is controlled by thin-skinned thrusting on a series of listric faults that dip to the east. These faults root in a major detachment that also dips to the east and appears to flatten in the ductile zone in the middle crust (Korsch & others, 1990c). BMR89.B03 was positioned to cross two of Hammond's postulated transfer faults, but there was little evidence on this line to suggest their presence.
As mentioned above, a number of authors (e.g. Harrington & Korsch, 1979, 1985; Korsch & others, 1988, 1990b) have suggested that a significant component of strike-slip movement was involved in the initial development of the Bowen Basin. The results of a deep seismic profile across the southern Bowen Basin (BMR Traverse 14, Wake-Oyster & others, 1987) indicate that the eastern bounding fault of the Taroom Trough is nearly vertical; Korsch & others (1988; in press; in preparation) therefore suggested that the trough did not develop as a result of pure extension in the plane of the section, but rather that the basin-forming mechanism was oblique extension.
In the study area, the Bowen Basin is overlain by the relatively flat-lying sediments of the Surat Basin. Deposition ceased in the Bowen Basin in the Middle Triassic and parts of the basin underwent' deformation and uplift. Harrington & Korsch (1985b) related this phase of deformation and the subsequent cessation of deposition to the accretion of the Gympie Terrane(s) to the eastern margin of Australia. The Bowen Basin structures underwent peneplanation prior to deposition of the Surat Basin succession. The structural axis of the Surat Basin is the Mimosa Syncline, which overlies the Taroom Trough. Structures within the Surat Basin succession were generally formed by reactivation of Permo-Triassic structures within the underlying Bowen Basin, which
10
led to minor fault displacements and faultrelated folds. The Jurassic-Cretaceous structural style was generally compressive (Elliott, 1989), although there is evidence of strike-slip movement on some faults (Cosgrove & Mogg, 1985). The basin was tilted to the south in the Late Cretaceous and affected by minor faulting in the midTertiary (Elliott, 1989). Veevers (1984) classified the Surat Basin as a distal foreland basin.
In summary, the Bowen Basin was initiated in the latest Carboniferous-Early Permian as a result of back-arc extension associated with subduction along a continental margin volc~lnic arc (Camboon Volcanic Arc). Following a period of regional sag, the basin was affected by ENE-WSW directed compression during the mid-Permian; this can be interpreted as the onset of foreland basin conditions. From the Late Permian to the late Early Triassic, foreland loading resulted in accelerated subsidence and the reactivation of earlier extension-related structures. This period of shortening culminated in the late Early Triassic or Middle Triassic and deposition ceased. After erosion and peneplanation in the Late Triassic, sedimentation resumed in a gently subsiding intracratonic sag (Surat Basin).

SEQUENCE BOUNDARIES AND SEQUENCES IN THE TAROOM REGION
(ATB)
SEISMIC INTERPRETATION METHODOLOGY
The seismic sequence analysis was carried out by identifying discontinuities on the basis of reflection terminations according to the method of Vail (1988). The seismic sections were frrst examined for places where two reflections converge, and these reflection terminations were marked with arrows. Where a number of such terminations occur along a reflector (or locally, a non-reflecting horizon), the discontinuity surface between truncating reflections below and onlapping and downlapping reflections above was drawn in with a colored pencil. Each reflection was given its own color and a provisional code number; we anticipate that pennanent designations will be given to significant reflectors later. Discontinuities which become confonnable were traced across the section by reflection correlation. Some reflectors which were not apparent discontinuity surfaces were also selected at this stage on the basis of the strength of their reflections. Correlation was continued onto intersecting lines, and all closed loops were checked by tracing the loop ties for each reflector. If drilling had taken place on or near a seismic line, the fonnation depths were converted to seismic two-way travel time using the supplied time-velocity table, and tied to the seismic section. Different published lithological well-picks and timedepth tables inevitably gave disparate results for the same well, and emphasise the need for caution with well ties. In future, generating synthetic seismograms for wells may enable well ties to be made with greater confidence. The interpreted seismic line was then digitized using Petroseis™
11
software and checked for mis-ties. In addition, any discernable stratal patterns and intra-sequence formation patterns were noted.
No attempt has been made at present to identify systems tracts. This is because most of the succession preserved in the region is non-marine, and the marine portion, mostly Permian, is relatively thin. Discriminating between systems tracts in non-marine sediments is not only difficult, but the sequences themselves may be more related to sediment supply and tectonics than to sea-level changes.
REFLECTORS AND SEQUENCE BOUNDARIES
Fourteen reflectors, eight of them sequence boundaries, were chosen as the framework for seismic interpretation in the study area (Fig. 3. Table 1). Eleven of these are within the Bowen Basin succession, one is the major unconformity between the Bowen and Surat Basins. and the remaining two lie within the lower Surat Basin succession. Thirteen of the reflectors (including seven recognised sequence boundaries) were used as mapping horizons.
In the descriptions that follow, examples of reflectors are generally not illustrated with diagrams, but reference is made to the sesimic sections in which the reflection can be inspected.
Permian
The basal Permian consists of a thick

volcanic sequence, known as the Camboon Andesite (Fig. 3), reached by the UOD Cockatoo Creek 1 well and exposed along the eastern side of the basin. The contact between the volcanic rocks and the underlying basement is not apparent in the seismic sections. A prominent reflector with onlaps at about 2200-2700 ms in line S84-CT -03 is interpreted as the near-strike intersection of a fault, which is seen to be a thrust in orthogonal lines S84-CT-02 (Fig. 4) and S84-CT-08.
The volcanics are overlain by Early Permian marine rocks, the base of which is a regional sequence boundary provisionally designated B6. This surface is usually marked by a high acoustic impedance contrast, and typically exhibits a strong peak flanked by strong troughs. A good example occurs in line C83-GL-02 at SP 420, 3000 ms. The only ties with wells in the Taroom region are poor ones to the base of the marine interval in UOD Cockatoo Creek 1 (Fig. 5) and MPA Glenhaughton 1.
Within the marine succession three reflectors have been selected. The lowest one (B39) is recognized only in the northwest comer of the region under consideration, as a sequence boundary at the base of the Freitag Formation. In that area, the Freitag base in Glenhaughton 1 corresponds to a moderately strong reflector only short distance (about 50 ms) above the base of the marine sediments, e.g. in line T82-RC-03 at SP 130, 1300 ms. This level was identified from well logs as an unconformity by Cundill & Meyers (1964). It is interpreted as corresponding to the major unconformity in the eastern Taroom Trough where the whole of the Fauna III zone (Dickins, 1964) is missing, but there it merges seismically with the underlying sequence boundary because the Buffel Formation is too thin to be resolved.
12
In the rest of the region there is a stratigraphically higher, usually strong but variable amplitude reflector (B26), exemplified by the strong trough flanked by strong peaks in line S84-BM-06 at SP1950, 3400 ms. It is tied reasonably well to Cockatoo Creek 1, at or above the base of the Flat Top Formation. Though it shows no explicit evidence of being a sequence boundary, and is not recognized in the northwest corner of the region, recent palaeontological work (Parfrey, 1988) suggests that it is possibly equivalent to the base' of the Peawaddy Formation (B27) in the Denison Trough to the west. The latter level has been interpreted to be of tectonosedimentary significance by Dickins (1983), in that it records a marine transgression, which is unconformable in places and marked by the immediate introduction of volcanic detritus.
The next reflector (B64) ties in poorly at or above the base of the Gyranda Formation in Cockatoo Creek 1, and is the strong reflection in line C83-GL-02 at SP 480, 2740 ms. The well tie is poor because the reflector, like many of the others, deteriorates in quality towards the structural high. Throughout this region the horizon usually displays no sequence boundary characteristics, but in section S84-BM-06 at SP 1815, 1845 and 1890 it truncates beds below it, and in section C83-GL-02 at SP 120, 185, 250 and 380 there are strata lapping onto it. It may therefore be a subtle expression of such a boundary, especially if it could be correlated across a gap in the seismic coverage to the base of the Black Alley Shale in the northwest comer. There, B64 may correspond to the very weak reflector (B63) defmed by the truncation of beds below it in line T82-RC-03 at SP 226, 1300 ms, and matching with the base of the Black Alley Shale in Glenhaughton 1. Our field studies have revealed that the contact between the Peawaddy Formation and the ovedying Black Alley Shale in a section

,.. In "C C 0
~ ~
I-' II> f.I,) E
:;::
i I
~
1.0
S84-CT-02
87 ~======================~~====================================~S22 844
817
864 826
2.0l-_---~ 86
--- -------- ---...--
-----
Fig. 4. Interpreted geology along seismic line S84-CT-02.
2 km

~ 1.0 c 0
~ ..., CD E := - f ~
~ I- 2.0
T82-L-7 UOD Cockatoo Creek 1
• Evergreen Fm Precipice Sst
S22~----------------------------------------------------------r-1
833
817
864
Fig. 5.
2 km
Rewan Gp
BaralabaCM
Gyranda Fm
Flat TopFm
Barfield Fm
Oxtrack & Buffel Fms Gamboon Andesite
Interpreted geology along seismic line T82-L-7 showing tie with Cockatoo Creek 1.
near Carnarvon Gorge is a sequence boundary truncating sandstone and mudstone beds; the suggestion of a hiatus between the Black Alley Shale and Peawaddy Formation in figure 4 of Dickins (1983) fits in with our observation. There is also evidence of truncation associated with this horizon on some seismic lines in the Denison Trough to the west.
The base of the Baralaba Coal Measures is usually expressed as a well-marked reflector (B 17) at the base of a zone of strong reflections, as in line C83-GL-02 at SP 480, 2530 ms. The tie to the COE Tiggrigie Creek 1 well is good, while that to the Cockatoo Creek 1 well, and to the base of the equivalent Bandanna Formation in Glenhaughton 1, is fair. As with the two preceding reflector picks (B64 and B26), this horizon is not readily apparent as a sequence boundary in the Taroom region. It shows some truncation of underlying beds in only two (possibly four) seismic sections, so it is doubtful that it is a sequence boundary, but it may be a parasequence boundary. It strikingly truncates beds in one seismic line in the Denison Trough, although this could record local tectonic movement.
The top of the coal measures and base of the Rewan Group is one of the most obvious of the sequence boundaries, confirming the numerous references in the literature to a regional scour surface at this level. Erosional relief on it is sometimes visible in the Taroom region, but the greatest incision, exceeding 30 m, is displayed in lines to the west and northwest of the study area. Underlying strata are truncated in many sections, and locally there are onlaps (Brakel & others, 1992, fig. 3) and downlaps onto it. The downlaps were probably formed at the toes of lacustrine delta foresets. The horizon is generally a strong reflector (B33) at the top of a zone of strong reflections caused by
15
coal seams, as, for example, in line C83-GL-03 at SP 480, 2300 ms. The well ties to the Rewan base are fair in Cockatoo Creek 1 and reasonably good in Glenhaughton 1.
Triassic
Of the five reflectors picked within the Triassic succession, all except the lowest one (B44) have been identified for certain as sequence boundaries. B44 is truncated by the sequence boundary above it in line C83-GL-02 (Fig. 6), and is therefore locally absent. In line S84-BM-06 at SP 1950, 2000 ms, the B44 reflection is the strong trough flanked by strong peaks, but on many other lines it is poorly defmed. Although its nature is obscure, it can be seen probably truncating strata below it in line T83-W A -06. Its position in the seismic sections locates it in the upper Rewan Group.
The reflector (B48) that truncates B44 (as well as many other beds) is only intermittently well developed. It is a strong reflector in lines S84-BM-06 (e.g. at SP 1715, 1700 ms) and C83-GL-02, and ties to the ,pase of the Clematis Group in the Tiggrigie Creek 1 well on line C83-T -4, where it separates two distinctly different packages of reflectors. The Clematis base has been described previously as locally disconformable (Dickins & Malone, 1973) or erosional (Elliott & Brown, 1988).
A reflector within the Clematis Group (B20) shows high impedance contrast in places, such as in line S84-BM-06 at SP 1630, 1200 ms, but is not evident as a sequence boundary from the seismic. However, it ties approximately with the base of the Showgrounds Sandstone in Tiggtigie Creek 1, a unit that elsewhere is known to have a hiatus below it (Elliott & Brown, 1988), implying that it is an erosion surface. The next reflector pick (B46 - SP

C83-GL-02
2 km 1 ;
-
to =------------^18%
g 2.0 -
1b1-..
-B10B46B20B48
- B44
^87^ 822
813
/
83-52/8
2.0
Fig. 6.^Interpreted geology along seismic line C83-GL-02.
Fig. 7.^Interpreted geology along seismic line 83-52/8.
1820, 1299 ms in line S84-BM-06)truncates underlying beds in some lines, andin C82-T-54 it cuts off the B20 surface.Usually, however, it does not show thistrait, and on the poorer quality seismic linesit can be difficult to identify. In theGlenhaughton 1 area it is the only non-Permian sequence boundary that can berecognized. It correlates with the base ofthe Moolayember Formation in TiggrigieCreek 1. A better-developed truncationsurface (B10) is present within theMoolayember Formation, and is typified bythe reflector at SP 1820, 240 ms in lineS84-BM-06.
Jurassic
The base of the Surat Basin succession(S22) is the strongest unconfortnity in theregion (e.g. SP 4740, 240 ms in line S84-CT-03). It represents the peneplanationsurface formed during the Late Triassic,following a major compressional episode.Erosional trimming of uptilted beds isconspicuous near the eastern margin of theBowen Basin (e.g. line 83-52/8, Figs 7 and8). In the axial portion of the TaroomTrough the angular discordance is not asgreat, and in places the reflectors areparallel.
Two reflectors have been picked in theoverlying sediments, corresponding to thePrecipice - Evergreen boundary (S7) andthe oolitic Westgrove Ironstone Member ofthe Evergreen Formation (S13) in the GSQDRD 6 bore. S7 is the strong reflector inline S84-CT-03 at SP 4740, 180 ms, butcan be difficult to pick in some other lines.S13 is the strong reflector in the same lineat SP 4950, 140 ms. No seismic evidencehas so far been found that either is asequence boundary, however Elliott &Brown (1988) report a reflector at the S13level as a "basin-wide sequence boundary".The Westgrove Ironstone Member records
widespread chemical sedimentation,denoting a deficiency of elastic input, at thetime of a marine incursion. Such "sedimentstarvation" is indicative of a maximumflooding surface.
SEQUENCE CHARACTERISTICS
Permian
Internally, the basal Permian volcanicsusually display poor or broad reflections,because the higher seismic frequencies arefiltered out by the overlying sedimentarypile so that only the lower frequency, longwavelength energy remains. Nevertheless, inseveral sections, such as C83-GL-02, somestrong reflections are present, implyinglithological contrasts between beds, perhapsdue to differing lava compositions orinterbedded elastics. Bifurcations andterminations of reflectors are evident inplaces (e.g. SP 280-320, line T83-FV-06);a lenticular body at SP 275-345 in line S84-BM-01 may be the cross-section of a lavaflow, and there is onlap of a reflector at SP220-310 in line T82-RC-05.
The marine Permian (B6-B17) is generallycharacterized by less prominent reflectionsthan in the adjacent units, although locallysome strong reflections are present. Thelower part of the marine interval (B6-B26)tends to have weak to disorganizedreflectors, the middle portion (B26-B64,approximately equivalent to the Flat TopFormation) has better developed reflectors,while the upper portion (B64-B17,approximately the Gyranda Formation)ranges between these in style. [Note that theGyranda Formation is often interpreted asnon-marine, based on the occurrence of afew thin coal seams, but this view is notuniversal. In UOD Burunga 1 the formationcontains some marine shells. It is likely thatthe unit represents an interfingering of
17

44I. VVA,^i' Nilljr7.:(We'V A "NrIe. 4'4+4, "/ :4.... `7. - ' "01,), ivo<ki,, • I) .11 "-Nws.k....--, - IT...re , -11' ' '0,. • 4"""rilZr41.01;"•*‘;‘Z$ Ni<0414:11/ e(7141V0(1.44.41Y11 4 VI% ' 4/11 ‘0,■41 0,e/0 'NZ '1",,I,411 11 ,,,,,,,ik 41.4 4,1
mr..01, , ;1 ,74 0 ,4, c4,4e11 ,,,...)1,i1(kti, 1,w,,v ,v,,440.e.?,4.040,(1,5<4,0,,,,,;114, olip,i,.‘.. ;,„z;-it 0,4,m At. taiN itALAIZ•ki‘ai'V<'ikfitt)e..<4(ta4;■::f4 tAtIk1/4iiikM4OU04 ON tiAt+ 4 ktittPN* 45rak ‘ i
141:#,.#,.,4,1`4,hli'e,,i411„Liti:,r:-114`;Iii;,,.P.P144.4.1"3,2,1,,tr,:g4i4',.i<itellf14tei)tc',,c.,*4,('73k‘-L:141 .* ,.S22 ., , 60 ,.e ,( j 4e,*,'iNfo* 4( ilrigdif SI10<( \ ,OV ‘11)1 ' 4( '1?4 a ''````
$494$4101,10,4tAilip04,141tn414)4,1k9iiiizpliii;7;i5 1 'swiirtiog 1jg Ida ,.: ...t . ix),."0,0,1, , J,, : .{i!,) .t , , t..44$ 04,,;,..'fitl11)„iati■,;.411 11,1::,,:iiil:fr,;11Si t ;,„edixiS
0lb ) aii. ,141 I1 iiii: II;3 liltst:1(411 1. ,:1 I 1itiI II It:III4,c:11l■1t.°f 11,Cir4!(1;1; i 411 i I111? :till 111; 1)1:I11Cifill1itiiiiiiill I ITIRC'
<a :4;$4■1,11A141.:',i./'sott-Olpf(011,0 ;110„zz;4411‘, tk1,6111 IiiimpullillY
a wc ( 1,1, ■, .4 .i I l I^.i.k^.4) 1 .1I. 1. ti L I^. 1..a.■ , JAI).^A^,
41 (140111;!)4,11:011-tAii5S;40*Illtf4iittljk ,illItt;A;fiTIS7111111ifet 4111:.' litAVKIlliggdq44,0-4;11-PKA/(a40qVII`qUeNsIIiill i 1 ,-;11L
,i 4 ■11:?'"cialigligfAk4t44(1141441gtdsaillA411101,k)fichR411F11;lit4S 'Po" AgATiit;g(A7,01111,1i4i10. .4S;'t1T1,1451s14,0tIfitzetitidlik.41/0
./0
"‘ ',Ott,10911)0140"t^1p0;403140' -e:i41;:1-001;;IiTittpviatT444..i`,„.^1:
iwall Oiti141(16.4c4,4/ 4114111,•4w.'-1”4/ "'qgik(;:Z`k.,‘tN,1 k :'^
s ,ts/ tfil"O' ti2*4..),ithIll,hr.,„440,,,•—,,„; -:-.-^l^f
11041?e4 d 1 ( ,',4; A 1)10)/1114^.^....... (1 #iii°11"I' Cik0
^
^'''''''. "'NWT .(7/ '44W.:44/11e 1 41 4$141i4,4'AsS /4/kik 1. 4 . -4..,,.."7,-* '- .q.." dad
S6° ) ‘f:414k 111411( WT417141q1).14:44<lif* . .;:f t<Ct144,tv ,- 11(t4;41:_4.4M.N1r111:::::).11. _!.1411:;4117:4iNCiI. '*.:(tt.;?(Iiiri4111111141(b;ti rlaqlri4f ?I‘Plill;11;::gri. ti(i 1. li14.10,L ;ttkr...tZ,^(<&0 .,0 _ , ,.
.114
it4
Fig. 8.^Unconformity between the Bowen and Surat basins (S22) in part of seismicsection 83-52/8 between stations 760 and 870. Vertical scale in two-way traveltime.
marine and non-marine facies.] In the areaaround Glenhaughton 1, the sub-Freitagsequence boundary (B39) lies only onereflector above the top of the volcanics, andthe rest of the marine interval is so poorlyexpressed seismically that even thesequence boundaries between B39 and B17cannot be recognized without reference tothe Glenhaughton 1 well. The only stratalpatterns of note within the marinesequences are uncommon bifurcations andterminations of beds, apparent downlaps inthe Black Alley Shale in section T83-FV-05, and possible foresets around SP 4540and 4740 in section S84-CT-03.
The Late Permian coal measures (B17-B33)typically display strong reflectors at the
interfaces between coal seams and clasticinterbeds. Bifurcations and terminations ofstrata due to seam splitting and pinch-outsare ubiquitous, and channels are fairlycommon. Some prograding foresets,presumably deltaic, are visible (SP 134-140,line 80-H70, and SP 100-103, line 80-H74).
Triassic
The non-marine succession of the RewanGroup, Clematis Group, and MoolayenaberFormation is generally at least twice asthick as the Permian succession above theCamboon Andesite, and comprises fiverecognizable genetic sequences. Strata arecharacterized by great lateral variability,
18

ranging from strong to poor, and fromcontinuous to lenticular reflectors, evenwithin the one seismic section. Line C83-GL-02 is a good example of the variabilitythat is possible. This is due to laterallithological changes within a largely fluvialassemblage of stacked channel andoverbank deposits. Some of the reflectors inthe Triassic succession, including somesequence boundaries, may representpaleosol horizons; Jensen (1975) noted thepresence of paleosols throughout the Rewanand Clematis Groups.
In the Rewan Group (B33-B48) there is atendancy for the lower part of the unit tohave weaker and less continuous reflectorsthan the upper part, indicating thedifference between the SagittariusSandstone and the overlying redbeds of theArcadia Formation. At the base of theRewan Group, strata commonly show onlapor downlap onto the underlying sequenceboundary. Higher up, bifurcating strata,prograding foresets (e.g. line T82-L-101, SP135, 225, 270) and large channels (e.g.same line, SP 200) can be identified inplaces. These features are to be expected ina fluvial facies with sporadic lakes. Notablein section S84-BM-04 (SP 2600-2725) isthe occurrence of a stacked series of 13clinoform sets, above and below reflectorB44, recognizable as such over a distanceof about 3 km, although they can becorrelated farther. Their thicknesses varyfrom 160 to 310 m (average 215 m). Theyare not visible on any other section, andtheir formation was probably a function oflocal conditions. A tentative interpretationis that they are lacustrine deltaparasequences, each formed whensubsidence caused the previous delta lobe tosink below the lake surface, creatingaccommodation space for the next deltalobe to build out. S84-CT-03, a NNE-trending section, exhibits a remarkableseries of convex-upwards patterns (SP5050-4800), which we interpret as alluvial
fans extending over a distance of 9 km, thatwere supplied from the same point sourcesuntil they accumulated sedimentary piles tocompacted thicknesses of up to 2.2 km.Similar patterns occur in approximately N-Ssections S84-CT-05, C83-GL-03 and T82-RC-0l.
Two sequences have been recognized in theClematis Group correlative. In many lines,such as S84-BM-06, the lower B48-B20sequence is similar to the lower RewanGroup in seismic expression, in that bedstend to be weakly reflecting and lenticular,whereas the upper B20-B46 sequence (theShowgrounds Sandstone equivalent)typically has stronger and more continuousreflectors than the adjacent intervals. Inother lines such as C83-GL-02 and C83-T-4, however, the reverse situation exists,again illustrating the spatial variability offluvial deposits. Some westerly-progradingforesets downlap onto the Clematis base(B48) east of SP 1770 in section S84-BM-06.
The Moolayember Formation correlative,with its two identified sequences, isgenerally similar in seismic style to the restof the Triassic succession, but there isusually a greater abundance of medium tostrong reflectors, and because the unit liesat shallower depths where most higheracoustic frequencies have not beenattenuated, a finer resolution of strata hasoften been achieved. On many lines, suchas S84-BM-01, the lower sequence (B46-B10) has weaker and less organizedreflectors than the upper one (B10-S22), butin other sections there is no appreciabledifference in seismic response between thetwo genetic sequences. Bifurcation patternsare common in S84-BM-01, S84-BM-06,T83-FV-04, and T83-FV-06.
19

Jurassic
Poor quality seismic recording is commonfor the Jurassic interval over most of theregion, due in part to its very shallowdepth. Where better quality was obtained,moderately strong reflectors are seen, andusually they are more numerous in themeandering fluvial to lacustrine and marinelower Evergreen Formation (S7-S13) thanin the braided fluvial Precipice Sandstone(S22-S7), as in line S84-BM-01. Therelative abundance of reflectors isinterpreted as being indicative of the degreeof sandstone-shale interbedding. Only rarelyare structures other than planar beddingdiscerned; delta foresets occur at SP 4940-4970 in line S84-CT-03 in the lowerEvergreen, and possible channels may bepresent in the Precipice Sandstone of lineS84-BM-01. No downlaps onto the S13maximum flooding surface have been foundto date.
20
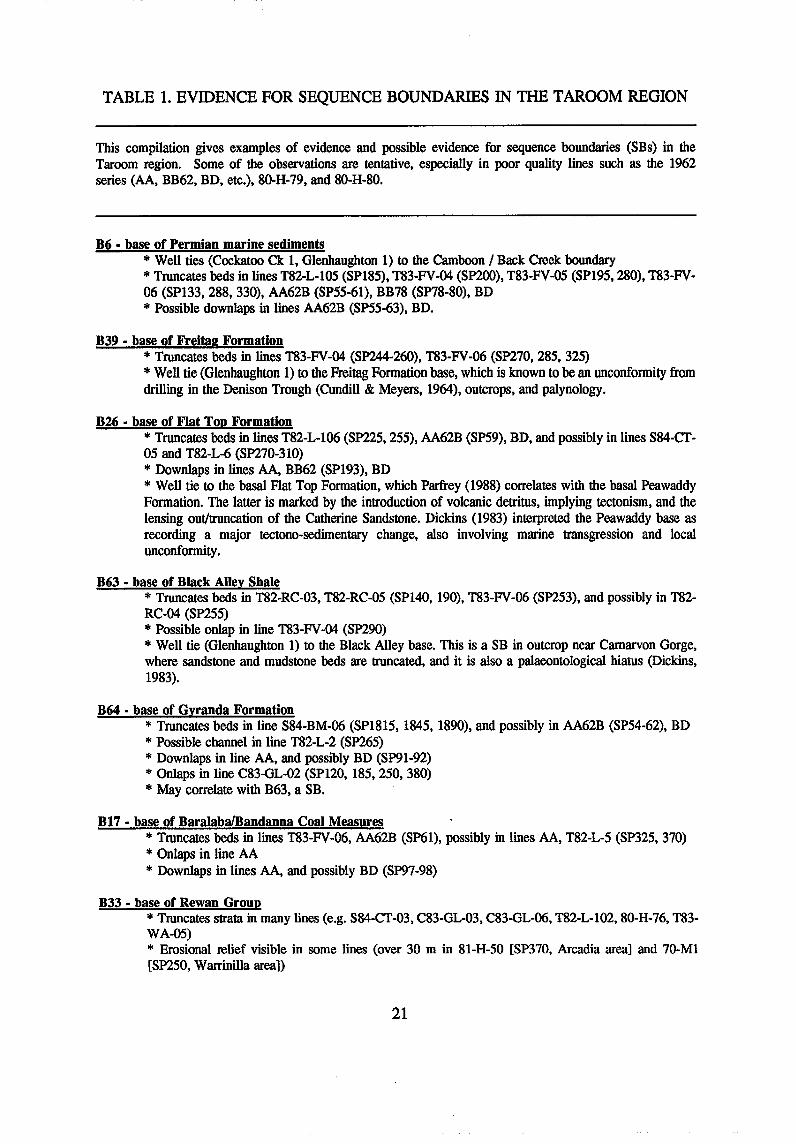
TABLE 1. EVIDENCE FOR SEQUENCE BOUNDARIES IN THE TAROOM REGION
This compilation gives examples of evidence and possible evidence for sequence boundaries (SBs) in the Taroom region. Some of the observations are tentative, especially in poor quality lines such as the 1962 series (AA, BB62, BD, etc.), 80-H-79, and 80-H-80.
B6 • base of Permian marine sediments * Well ties (Cockatoo Ck 1, Glenhaughton 1) to the Camboon / Back Creek boundary * Truncates beds in lines T82-L-10S (SPI8S), T83-FV-04 (SP200), T83-FV-OS (SPI9S, 280), T83-FV-06 (SP133, 288, 330), AA62B (SPSS-61), BB78 (SP78-80), BD * Possible downlaps in lines AA62B (SPS5-63), BD.
B39 • base of Freitag Formation * Truncates beds in lines T83-FV-04 (SP244-260), T83-FV-06 (SP270, 285, 325) * Well tie (Glenhaughton 1) to the Freitag Formation base, which is known to be an unconformity from drilling in the Denison Trough (Cundill & Meyers, 1964), outcrops, and palynology.
B26 • base of Flat Top Formation * Truncates beds in lines T82-L-I06 (SP225, 255), AA62B (SP59), BD, and possibly in lines S84-CT-05 and T82-L-6 (SP270-310) * Downlaps in lines AA, BB62 (SP193), BD * Well tie to the basal Flat Top Formation, which Parfrey (1988) correlates with the basal Peawaddy Formation. The latter is marked by the introduction of volcanic detritus, implying tectonism, and the lensing out/truncation of the Catherine Sandstone. Dickins (1983) interpreted the Peawaddy base as recording a major tectono-sedimentary change, also involving marine transgression and local unconformity .
B63 • base of Black Alley Shale * Truncates beds in T82-RC-03, T82-RC-05 (SPl40, 190), T83-FV-06 (SP253), and possibly in T82-RC-04 (SP255) * Possible onlap in line T83-FV -04 (SP290) * Well tie (Glenhaughton I) to the Black Alley base. This is a SB in outcrop near Carnarvon Gorge, where sandstone and mudstone beds are truncated, and it is also a palaeontological hiatus (Dickins, 1983).
B64 • base of Gyranda Formation * Truncates beds in line S84-BM-06 (SPI815, 1845, 1890), and possibly in AA62B (SPS4-62), BD * Possible channel in line T82-L-2 (SP265) * Downlaps in line AA, and possibly BD (SP91-92) * Onlaps in line C83-GL-02 (SP120, 18S, 250, 380) * May correlate with B63, a SB.
B17 • base of Baralaba/Bandanna Coal Measures * Truncates beds in lines T83-FV-06, AA62B (SP6l), possibly in lines AA, T82-L-5 (SP325, 370) * Onlaps in line AA * Downlaps in lines AA, and possibly BD (SP97-98)
B33 • base of Rewan Group * Truncates strata in many lines (e.g. S84-CT-03, C83-GL-03, C83-GL-06, T82-L-102, 80-H-76, T83-WA-OS) * Erosional relief visible in some lines (over 30 m in 81-B-SO [SP370, Arcadia area] and 70-Ml [SP2S0, Warrinilla area])
21

TABLE 1: Continued
* Channels in line T83-FV-01* Onlaps in lines AA, 80-H-79, AA62B (SP38, 59)* Downlaps in lines AA, T82-RC-04 (SP150-250), S84-BM-01, S84-BM-04, C83-GL-02* Known to be a regional scour surface from outcrop studies (Mollan & others, 1969; Jensen, 1975;Chiu Chong, 1969).
B44 - intra-Rewan Group * Truncates beds in line T83-WA-05, and possibly in lines C81-T-29, AA, T83-FV-01* Downlaps in line AA
B48 - base of Clematis Group * Truncates B44 in line C83-GL-02, C81-T-38, C83-T-1, C82-T-52* Truncates beds in lines T82-L-105, BB62, C83-T-4, C82-T-54, C81-T-29, possibly in line 80-H-79* Possible erosional low in line T82-L-106 (SP175)* Possible channel in line S84-BM-01 (SP155-240)* Possible onlaps in line 80-H-79* Downlaps in line AA.
B20 - base of Showgrounds Sandstone * Possible truncation in line S84-BM-01 (SP180)* Probable erosional relief, truncation and onlap in line S84-BM-04 (SP2630)* Downlaps (prograding foresets?) in line 80-11-79 (SP112)* Probable well tie to Showgrounds Sandstone base in Tiggrigie Creek 1, which elsewhere has a hiatusbelow it (Elliott & Brown, 1988).
B46 - base of Moolayember Formation * Truncates B20 in line C82-T-54* Truncates beds in lines T82-L-105 (SP110-140), T82-L-6 (SP300), T83-FV-05 (SP296, 155), T83-FV-06 (SP160, 185)* Possible channel in line T83-FV-04 (SP207)* Onlap in line T83-FV-06 (SP130).
B10 - intra-Moolayember Formation * Truncates beds in several lines, e.g. T82-L-6, T82-L-105 (SP360), 80-11-74, 80-H-79, S84-BM-01,S84-BM-04, S84-BM-06, and possibly C83-T-1, C83-T-10.
S22 - base of Precipice Sandstone* Major angular unconformity at the base of the Surat Basin (e.g. lines S84-CT-03, T82-L-7, 83-52/8)* Well ties (Cockatoo Creek 1, Tiggrigie Creek 1) to the Precipice Sandstone base.
S7 - base of Evergreen Formation * No seismic evidence for being a SB.
S13 - Westgrove Ironstone Member * No seismic evidence for being a SB* Correlation with Westgrove Ironstone Member in DRD 6 bore. The widespread chemicalsedimentation as recorded by the oolite indicates a dearth of elastic input - such a "starvation surface"is a maximum flooding surface.* Elliott & Brown (1988) report a reflector at "top of Boxvale Sandstone" (which given the resolutionof the seismic is probably the same as what we interpret as S13) as a "basin-wide sequence boundary".
22

GEOMETRY OF STRATIGRAPHIC SEQUENCESAND STRATIGRAPHIC UNITS
(ATVV)
DATABASE AND DERIVATION OFDATA
The database on thicknesses of svratigraphicsequences and/or lithostratigraphic units inthe Bowen and Surat Basins in the studyarea was derived from the interpretation ofa network of chiefly industry-acquiredseismic lines in the Taroom region. Themethodology used in the interpretation ofthe seismic sections and the derivation ofthe mapped reflectors is described in theIntroduction, and in the section onSequence Boundaries and Sequences in theTaroom region (see above).
The isopach maps (displayed in two-waytravel time) are based on the selection ofthirteen reflectors in the Taroom Trough, atleast seven of which show indubitableevidence of being sequence boundaries. Thereflectors on the seismic lines weredigitised and the digital data entered andprocessed by PetroseisTM System software.The PetroseisTM software generates contoursof equal seismic two-way travel timethrough the unit which are not directlyequivalent to true isopachs. However, thetwo-way time isopachs, or time intervalcontours, can be used as a rough guide tochanges in sequence or formation thickness.The two-way time isopachs were convertedto approximate thicknesses in metres usingrms velocities and two-way time interceptson the seismic record section. Isopach mapswere produced for all the intervals betweensuccessive mapped reflectors (formationand/or sequence boundaries), andcombinations of these units in the threemajor successions (Back Creek andBlackwater Groups; 'Mimosa Supergroup';and the Surat Basin) for analysis and
confirmation of interpretation. [The term'Mimosa Supergroup' is used herecollectively for the Rewan Group, ClematisGroup and Moolayember Formation. It isused informally in this report but may beproperly defined at a later stage.] It shouldbe stressed that the formation identificationsshown on the isopach maps are preliminary,mainly because of sparse well control. Moredefinitive identifications will be possible asthe interpretation proceeds into areas wherethere are a greater number of petroleumexploration wells, and hence more precisecontrol on sequence boundary identification.
Previous data
There are numerous references that includedata on the distribution and thickness offormations in the Bowen and Surat Basins.However, probably the majority of thesereferences discuss only restricted parts ofthe basins or treat only one or two units ina small area. Only the references to regionalsurveys are included in this chapter of thereport and the reader is referred to morecomprehensive bibliographies (e.g. Dickins& Malone, 1973; Exon, 1976; Day &others, 1983) of the basins for detailedinformation on local areas.
ILLUSTRATIONS OF ISOPACHGENERATION
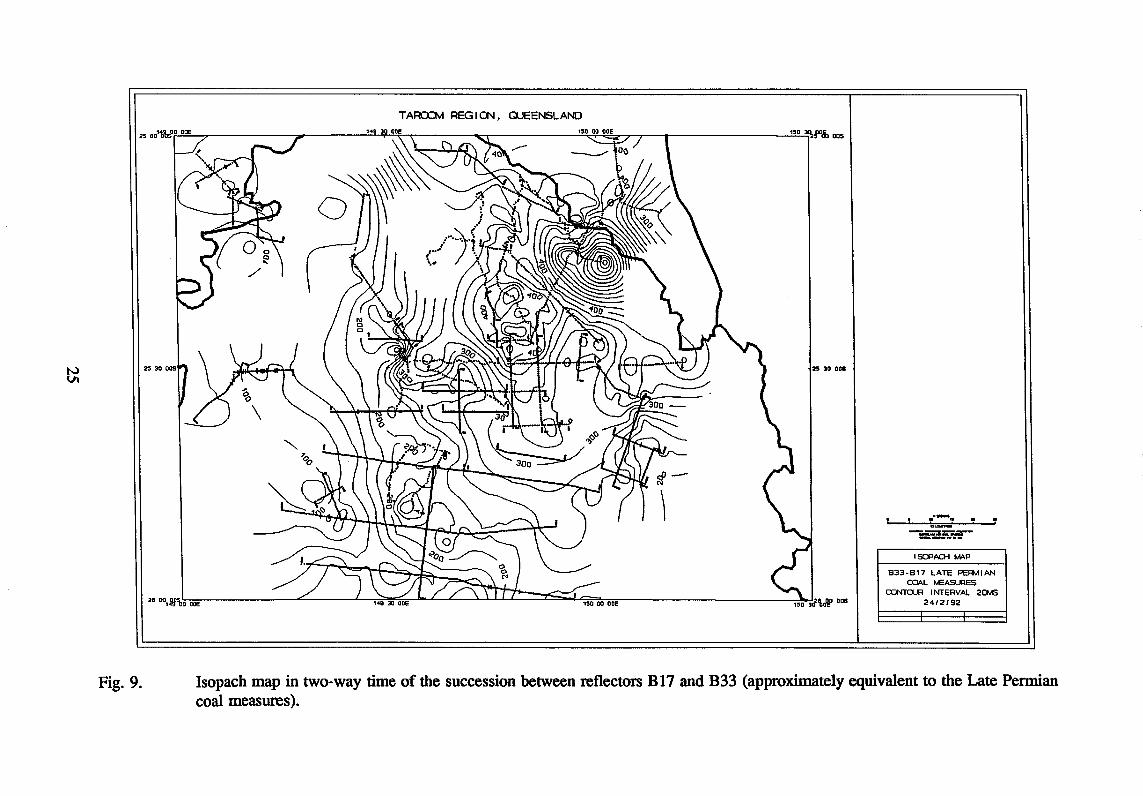
Two examples of isopachs generated byPetroseisTm software are shown in Figures 9and 10. Figure 9 is an isopach generated forthe Late Permian coal measures (BandannaFormation and equivalents; intervalB33-B17), and Figure 10 shows the
23

isopachs generated for the LatePermian-Triassic Rewan Group, ClematisGroup and Moolayember Formation(`Mimosa Supergroup'; Interval S22-B33).A brief description of each of theseintervals will be given to illustrate the detailthat can be generated from the contouringpackage, and the interpretation that can beobtained from the maps.
It should be noted that only a fewrepresentative maps discussed here areillustrated by the figures, but all areavailable at 1:250 000 scale from the BMRSales Centre, and are listed in Appendix 1.
Late Permian coal measures (BandannaFormation and equivalents; intervalB33-B17)
A central area of relatively uniformsediment thickness (the equivalent of350-400 ms, that is, approximately 1260 mof coal measures based on calculationsusing rms velocities on Line T82-L-101 atabout SP 500) interrupts the gradualeastward thickening of the coal measureswith an equivalent of —640 ms of sedimentssituated at the eastern margin of the BowenBasin in what appears to be a depocenvetowards the eastern edge of the TaroomTrough. In this particular case the shape ofthe depocentre is an extrapolation producedby the contouring program; neighbouringlines are very widely spaced and thus exertlittle influence on the shape of the isopachs.In addition, the interpretation is based onsome poor quality line data and must betreated with caution.
The coal measures thin gradually westwardand at the western extremity a broad bandof thin sediments that show relatively littlechange in thickness coincides approximatelywith the flanks, and in the region towardsthe crestal area of the Comet Ridge.However there are very few seismic
sections in this area and therefore littlecontrol on isopach spacing.
The thickness of coal measures apparentlystill reflects the shape of the basement floorbut the isopach gradients show that theinfluence is more subdued compared todeeper horizons. The meridional trend ofthe depocentre, ignoring the doubtfulthickening in the northeast, is parallel toand roughly coincident with the trend ofdepocentres in deeper units and hence alsowith the deepest part of the TaroomTrough. A regional thinning of the coalmeasures along their eastern mapped extentsuggests the presence of a depositional edgein this direction and provenance areas, withpossibly exposed basement, in this generalregion. The presence of conglomerateinterpreted as local alluvial fans (Fielding &others, 1990) along the eastern basin marginsupports this conclusion.
An isometric diagram, showing the base ofthe coal measures, is illustrated in Figure11.
Late Permian-Triassic 'MimosaSupergroup' (Rewan Group, ClematisGroup and Moolayember Formation)(S22-B33)
A summary of the main attributes of thissuccession is given under the description ofregional isopach trends and only thedetailed features of the 'MimosaSupergroup' will be given here (Fig. 10).
The north-northwest trending depocentrelies to the east of the Mimosa Synclinalaxis and contains in excess of 2600 msequivalent of the sedimentary section (at thenorth end of Line T83-WA-09, and on LineT83-WA-06) in the central northern part ofthe Taroom Sheet area. The sedimentarywedge is the preserved remnant of the LatePermian to Middle Triassic, and possibly as
24
TARCCM PEG I CN , QUEENSL AND
52E^149 30 000^ 150 OD 00E "° 3°2491325 0011555 Dos
2, 30 p3O
.^---.-• 41k
2s 30 003
alplip?
'NW r‘
414141111115-r
40.
........- -,...,,
..
imb
c ,,-- ,
..„.......••
,.... .14
•:,„ •
•000
\
0 111Stv.•?,r.
400 __,
0r300 _.,
I
i
,
AA:......_ \ 7.,
CS
3
r^.
0?
hitI
,Doo —,------.,I. .1111111k^sa.__^0
...iiiiiIVItatipr--_,.IIA1111111ear... I
I SCPACH MAP
933. 9 17 LATE FERMI ANcom. NEASURES
CCNTO JR INTERVAL 20M624/219225 551M30 me^ 149 30 ODE^ 15000 00E^ 150 dila) 555
I I
Fig. 9.^Isopach map in two-way time of the succession between reflectors B17 and B33 (approximately equivalent to the Late Permiancoal measures).

•^•^.1:1•11•07.,
[11.1111•1
ISOPACH MAP
S22-233LATE PERMIAN - TRIASSICCONTOUR INTERVAL 50MS
24/2192
Fig. 10.^Isopach map in two-way time of the succession between reflectors B33 and S22 (approximately equivalent to Rewan Group,Clematis Group and Moolayember Formation)

BASE OF COAL MEASURES
N
VIEWltG AN3..E ... , ~E5 VERTICAL ~TIO'I 13.42
Fig. 11. Isometric diagram of the B17 reflector (approximate base of the Late Permian coal measures).

young as early ?Late Triassic (Evans, 1964;Burger, 1992), succession beneath theJurassic sediments of the Surat Basin. Thethickness of preserved sediments is inexcess of 7000 metres based on calculationsusing nns velocities from line T83-WA-06.This figure is in broad agreement with theaggregate of the maximum thicknessesestimated by Dicldns & Malone (1973), butboth sets of figures should be regarded asvery approximate.
The thickest sediments occur in a relativelynarrow north to northwesterly (north in thesouthern part of the mapped area andnorthwest in the northern part) trendingzone with the succession increasing inthickness gradually and consistently to thenorthwest. The axis of the greatest thicknessof sediments along the north-west trendingdepocentre is approximately parallel withthe axis of the Mimosa Syncline and evenmore approximately with the axis of theTaroom Trough. It is displaced reasonablyconsistently up to about 10 km to theeast-northeast of the plotted approximateposition of the synclinal axis on thegeological map and slightly less whencompared with the position of the axis ofthe syncline determined from seismic data(see structure contour on S22 below, Fig.16). This phenomenon could be explainedby assuming that the Triassic sedimentswere asymmetrically folded before erosion.Alternatively the thickness of Triassicsediments could have originally increasedmarkedly to the east so that the depocentreis apparently east of the fold axissubsequent to folding.
The Triassic succession decreases inthickness relatively more rapidly to the eastcompared to the western flank of thedepocentre axis. This is caused by the LateTriassic uplift of the Bowen Basinsediments along the eastern side of theTaroom Trough with strong uplift apparenton the western flank of the Auburn Arch
and near the Burunga Fault. Thinning of thesediments here was partly caused bystructural growth during sedimentation andpartly by subaerial erosion after the LateTriassic uplift. It is apparent from the crosssetions displayed on several seismic linesacross the basins (for example on the fencediagram, Fig. 12) that the width of the tiltedTriassic sediments affected by this erosionwas a minimum of 25 km.
Two small closures on the south-east sideof the mapped area are structurallycontrolled; the closures are produced by thepreservation of sediments in truncated foldsbeneath the Surat Basin (see section onStructural Configuration and TectonicDevelopment below). One of these is shownon Line S84-CT-02 (Fig. 4).
There is insufficient control on the isopachsto the west to indicate any strong regionaltrend. The western side of the mapped arealies in the region of the Comet Ridge andhere the sediments are relatively thin andflat lying. The sedimentary section thinsgradually westwards towards the CometRidge and is well illustrated on LineC83-GL-02 (Fig. 6).
DESCRIPTION OF REGIONALISOPACH TRENDS
The following description is a summary ofthe main attributes of the distribution andthickness trends shown by the three majorgroups of sedimentary successions in theBowen and Surat Basins, the Blackwaterand Back Creek Groups (essentially thePermian succession), the 'MimosaSupergroup' and the Surat Basin sediments.
Although only the major groups arediscussed and illustrated here (Figs 9, 10and 16) it is worth noting that within thethree major groups described (Back Creekand B lackwater Groups;'Mimosa
28
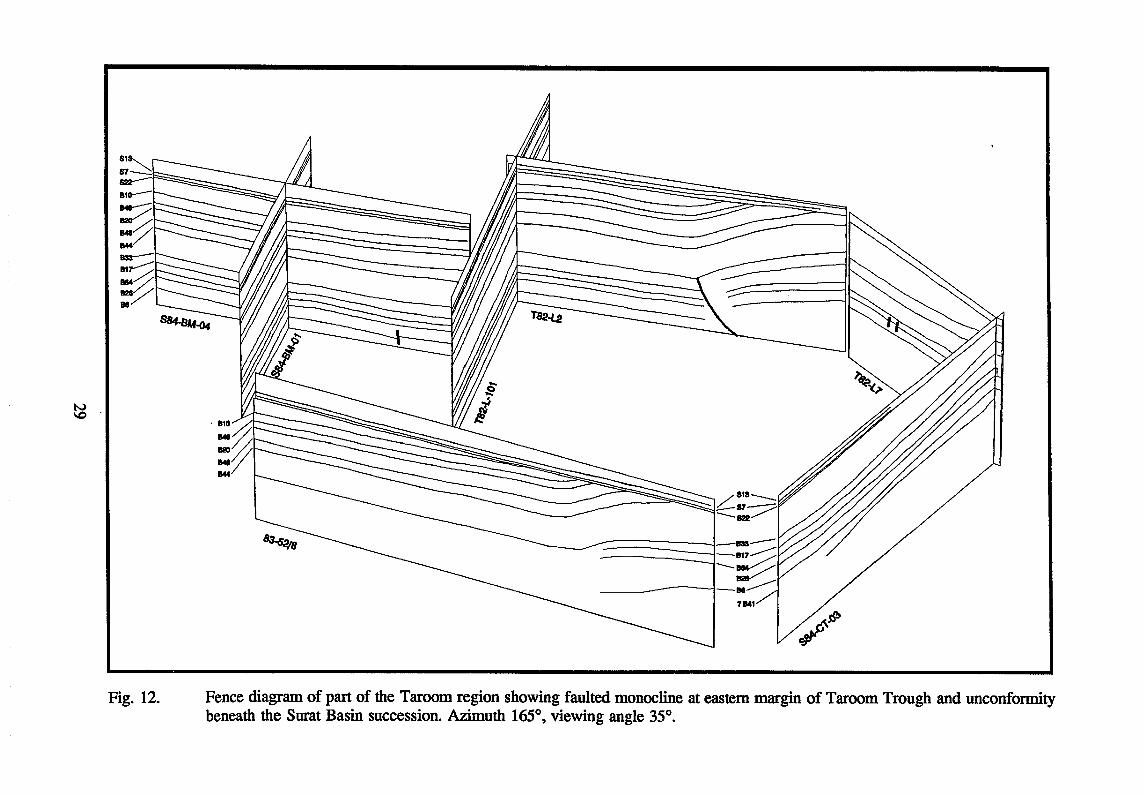
Fig. 12.^Fence diagram of part of the Taroom region showing faulted monocline at eastern margin of Taroom Trough and unconformitybeneath the Surat Basin succession. Azimuth 165°, viewing angle 35°.
Supergroup'; and Surat Basin succession)there are changes in isopach gradients,trends, and depocentses from one mappedunit to another that probably reflect thepresence of bounding unconformitysurfaces. Hence units above and belowsequence boundaries are more likely toshow disparate isopachs compared with theboundaries of conformable stratigraphicunits.
Back Creek and Blackwater Groups(B33-B6)
With a few exceptions the isopachs for theBack Creek and Blackwater Groupsgenerally show the following features:
1. A regional easterly increase inthickness of constituent units.
2. A roughly meridional trend of theisopachs, with some showingnorth-northwesterly trends.
3. Depocentres are commonlydeveloped on the eastern side of themapped area so that there is apronounced asymmetrical profile ofpreserved sediment packages. Theasymmetry is accentuated by theuplifted and truncated units at theeastern margin of the basin.
4. The asymmetrical profile,demonstrated by the isopachs forthis interval, clearly reflects themajor structural divisions (CometRidge, Taroom Trough, AuburnArch) described from the area byDickins & Malone (1973) and Exon(1976).
5.^The distribution, and variation ofsubsurface geometry and facies inthe units of this division across thearea indicates that there is a close
connection between the developmentof the major structures and historyof sedimentation.
The sediment packages thicken off theComet Ridge eastwards into the TaroomTrough (Fig. 6) with several separated.epocentres in areas near the Auburn Archand towards the Burunga Fault. A sedimentthickness equivalent to about 2000 ms isindicated in this region, and on lineT82-L-7 (Fig. 5) the Back Creek andBlackwater Groups attain almost 3000 m,calculated using rms velocities. A decreasein isopach gradient, with comparativelywidely spaced contours in a broadmeridional zone, is commonly developedbetween the axis of the Mimosa Synclineand the depocentres towards the easternbasin margin, in the Taroom Trough area.The precise reason for the presence of thiszone of much diminished rate of sedimentthickness increase in an easterly direction isnot readily apparent. The disparity betweenthe two position of the two structural axesindicates that the Late Triassic folding ofthe sediments was independent of theposition of the main depocentre axis in theTaroom Trough.
'Mimosa Supergroup' (Rewan Group,Clematis Group & MoolayemberFormation: S22-B33)
The isopachs for the preservedPermo-Triassic 'Mimosa Supergroup' (Fig.10) show the following regional features:
1. A regional north-easterly to easterlyincrease in sediment thickness.
2. A meridional depocentle lying eastof, and adjacent to, the trace of theMimosa Syncline.
3.^Steep isopach gradients andpronounced thinning towards the
30

east whereas others do not. Similarly somesequences, such as the basal Moolayemberunit and top Clematis unit, show thinningover, the Tiggrigie structure in thesouth-west, indicating intermittent structuralgrowth.
eastern edge of the Taroom Trough.
4.^Thin 'Mimosa Supergroup'preserved in the western TaroomTrough and Comet Ridge area.
5. There is evidence in this region forthinning both by decreaseddepositional thickness and/or byerosion with the generation ofunconformity surfaces in both areas,to the east and west of the TaroomTrough.
Maximum indicated thicknesses calculatedalong three seismic lines is as follows:T82-L-102, 5100m; T83-WA-09, 6600m;T83-WA-06, 7300m.
The sediment thicknesses indicated for the'Mimosa Supergroup' are stronglyinfluenced by erosion mainly in the easternpart of the area, unlike those for theBlackwater and Back Creek Groups. Thisgeometry exists primarily because of themajor Late Triassic uplift and erosion priorto Jurassic sedimentation of the Surat Basin(see Lines 83-52/8, Fig. 7, Line T82-L-2,Fig. 13, and the fence diagram, Fig. 12).The strongest uplift and erosion in the areaoccurred in the region of the Auburn Arch,and extended to a lesser degree across thewhole Late Triassic surface. The interpretedseismic lines showing the basalunconformity in this area (fence diagram,Fig. 12) illustrate the amount of erosion thathas occurred. The thickness of sedimentremoved by erosion decreases rapidlywestwards as the distance from the easternedge of the Bowen Basin increases, so thatit is at a minimum either at or near the axisof the Taroom Trough. There is also anindication of depositional thickness decreasetowards the Auburn Arch which mayindicate a depositional edge in this directionand possibly structural growth duringsedimentation. Some of the units andsequences show evidence of thinning to the
Hence the top of the 'Mimosa Supergroup'is an erosion surface and the isopachsindicate only the preserved remnant of the'Supergroup'. It is difficult to gauge theextent of erosion in the centre of theMimosa Syncline where the minimumthickness of sediments has been removed.Seismic sections across this part of thebasin (e.g., Fig. 6) show no apparentdiscordance between reflectors below andabove the base Surat Basin unconformity.However, the interval represents a hiatusspanning at least the whole of the LateTriassic and it seems unlikely that thesurface would remain unaltered over thislength of time. In addition the detailrecorded on the seismic section is notsufficient to resolve the fine details oferosion that may be present at the junctionof parallel strata at an erosion surface.
The preserved maximum thickness ofsediments now lies near the middle of themapped area in a broad (about 20 km wide)meridional band and correspondsapproximately in position to the meridionalzone of uniform thicknesses indicated bythe isopachs drawn for the Blacicwater andBack Creek Groups. The reason for thecorrespondence is a combination of theeffects of erosion and structural history ofthe region. The coal measures weremodified by erosion before the Permian -Middle Triassic 'Mimosa Supergroup' wasdeposited, so that the position of thedepocentre axis is no longer certain.Similarly, the eastern edge of the 'MimosaSupergroup' was strongly modified and thevend and parallelism of the two features inthe isopached intervals appear to be acoincidence of structural uplift and the
31

T82-L-2
T^1^7^7^1^1^er^7^7^7^T^1^7^T^7^T^7^1^7^7
1.0
2.0
3.0
2 km
Fig. 13.^Interpreted geology along seismic line T82-L-2.
amount of erosion. The depocentre of the'Mimosa Supergroup' was mostly removedand the locus of the preserved maximumthickness moved westwards away from theAuburn Arch. The steep gradients to theeast of the preserved maximum thicknessare caused by major uplift and erosion ofthe 'Mimosa Supergroup' towards theAuburn Arch and the Burunga Fault; thisfeature is less pronounced in the deepersediments.
Two minor reversals of the steep easterlygradient occur at the southern part of theisopached area. These depocentres arestructural in origin and reflect smallpackages of sediments in the Bowen Basinpreserved in eroded folds beneath theJurassic unconfonnity.
The presence of depocentres in the basalpart of the 'Mimosa Supergroup' on theeastern side of the Taroom Trough at thelevel of the lower Rewan (B44-B33)interval suggests that the 'MimosaSupergroup', considered as an entity,probably had a similar distribution. Thedepocentre lying to the east of the Mimosasynclinal axis (mapped both at the surfaceand at a slightly different position at thelower Rewan Group level from seismicstructure contours) would then correspondwith the broad meridional trending zone oflow isopach gradients shown on deeperunits. This distribution of sediments in theTaroom region would suggest that adepositional edge for the 'MimosaSupergroup' lay to the east. In addition, themain provenance for the Late Permian -Triassic sediments here was probably in thearea of the Auburn Arch.
A summary of cross-stratification trends inthe units of the 'Mimosa Supergroup' isgiven by Jensen (1975), who discussed thetrends in terms of his subdivisions of theRewan Group, the Sagittarius Sandstoneoverlain by the Arcadia Formation, and the
younger Clematis Group, composed of theGlenidal Formation overlain by theExpedition Sandstone. The relationship ofJensen's formations to the sequences andsequence boundaries recognised in theTaroom region is, as yet, unknown. Thesediment dispersal patterns between theseunits within the 'Supergroup' are noticeablydifferent (see Jensen, 1975, figs 76-81). Inthe Taroom region, the palaeocurrentdirections for the Arcadia Formation andGlenidal Formations are consistent with thepostulated easterly derivation of sediments.The palaeocurrents for the ExpeditionSandstone are north to south in the Taroomregion, with easterly-directed palaeocurrentsindicated by cross stratification in outcropon the western flank of the MimosaSyncline. However, they do not entirely ruleout the postulated wdstance of provenanceareas in the east. The south-directedsediment transport direction could indicatea different basin palaeogeographic settingduring deposition of this sandstone so thatboth easterly and westerly directed feederstreams could have supplied detritus to theprincipal axial drainage system which hada meridional trend. Alcock (1970) indicatedthat palaeocurrent directions for theMoolayember Formation were alsoapproximately southward-directed withprovenance areas in the north and east.
Surat Basin (Precipice Sandstone,Evergreen Formation, S22)
The isopachs for the Jurassic Surat Basinsediments are about the same (relative tothe selected datum plane) as the structurecontours for the base of the PrecipiceSandstone (S22, base of Surat Basin, seeFig. 16 below) and show the followingregional features:
1.^A preserved, gently folded, wedgeof sediments symmetrically disposedapproximately around the axis of the
33

Mimosa Syncline.
2. A maximum thickness of preservedsediments of 740 ms at the southernend of the Mimosa synclinal axis inthe mapped area, corresponding to athickness of about 1200 m ofsediments (calculated from nnsvelocities on seismic line C81-38).
It is important to emphasise that becausethe Surat Basin sediments are exposed ineroded folds, the contours on the S22interval show only the preserved thickness(relative to the arbitrary datum) of theJurassic Surat Basin sediments in theMimosa Syncline. The Late Jurassic andmid-Tertiary movements caused broadtilting to the south and west according toExon (1974) and hence the preservedsedimentary succession increases inthickness southward in the direction ofplunge of the Mimosa Syncline. Thecontours are approximately symmetricallydisposed around the synclinal axis,reflecting the broad structure contours ofthe basal Surat Basin unconformity.
An indication of the original sedimentdistribution and geometry is given byisopachs on individual units in thepreserved Surat Basin taking into accountthe eroded edge effects. Isopachs on thePrecipice Sandstone (S7-S22) show nocoherent trends across the mapped area - analmost random distribution of thin and thicksediment 'closures' occur across the region.The thickest pod of sediment is —90 msnear the northeastern part of the contouredarea which is equivalent to a thickness ofabout 130 m. Isopachs on the basal unit ofthe Evergreen Formation (S13-S7) show asomewhat similar distribution, but thedepocentre with an equivalent of —130 msof sediment, in this case, occurs in thenorthwest; a thickness of about 180 m wascalculated for this interval on seismic lineC83-GL-06.
Isopachs on the basal units within the SuratBasin succession show no clear indicationof a regional trend in the central part of themapped zone. The units thin both to theeast and west which suggests that structurein the basement was still influencingdeposition of the Jurassic sediments becausea proportion of this thinning is independentof the effects of erosion at the exposededges. There is no well defined trend to thedepocentres for the individual units and thislends little supporting evidence for theinfluence of the basement on sedimentationsuggested above.
34
STRUCTURAL CONFIGURATION AND TECTONICDEVELOPMENT OF THE BOVVEN AND SURAT BASINS
IN THE TAROOM REGION(JMT & RJK)
STRUCTURAL GEOMETRY
A series of 13 structure contour maps (intwo-way travel time) have been producedwithin PetroseisTm (see Appendix 1) basedon the regional network of interpretedseismic lines, and have been printed at ascale of 1:250 000. These maps show thepresent day geometries of the interpretedsequence boundaries and seismic horizons.
The main geological structure in the studyarea is the Mimosa Syncline, a nearly-meridionally trending syncline that isdominant in most of the structure contourmaps and which is generally asymmetricalfor the Bowen Basin succession, except atthe lowermost structure contour level (B6,approximate base of Buffel Formation).
At the base of the Permian sedimentarysuccession (B6, Fig. 14), the MimosaSyncline is elongate and almostsymmetrical, with closure around its deepestpoint at 25°45' (>3900 ms). In the west, theB6 reflector dips approximately 12-15° tothe east, whereas in the east it dips about 8°to the west (dips were calculated afterconverting two-way times to depths usingrms velocities). Upwards, the synclinebecomes increasingly asymmetrical, withthe dips on the eastern limb being steeperthan those on the western limb throughoutthe Permian and Early Triassic succession,as seen in the isometric projection (Fig. 11).
For the rocks deposited towards the end ofthe Permian, the depression (the lowestpoint in the syncline) is located farthernorth at approximately 25°25'. At the baseof the Rewan Group (B33, Fig. 15, and
within it (B44), the depression is elongate,with the deepest area being between about25°10' and 25°45' (2700-2800 ms); thesyncline is markedly asymmetrical, theeastern limb dipping more steeply than thewestern limb. For example, the B33reflector dips approximately 10° in the westand 28° in the east, and the B44 reflectordips approximately 12° in the west and 25°in the east.
The structure contour maps of reflectorsfrom the Clematis Group and MoolayemberFormation (listed in Appendix 1) show thatthe depression extends slightly southward:from 25°35%25°45' (1800 ms) at B48 to25°25%>26°00' (1000 ms) at B10.
The structure contours on S22 (Fig. 16)show that the base of the Surat Basinsuccession is a broad, symmetrical synclineplunging to the south of the study area andshallowing to the north to where theunconformity is exposed in outcrop.
To the east of the strongly tilted easternlimb of the syncline, in the southeasternpart of the study area, there is a flatteningof the structure contours (from B6 to B44).This can be seen readily in the isometricprojection of the B17 reflector (Fig. 11).
Dickins & Malone (1973, p.93) consideredthat "The Mimosa Syncline is mainly anunfolded depositional downwarp." However,dips of 25-30° on the eastern limb of thesyncline are too steep for a depositionalslope or even for one altered by compactionand , later differential subsidence; weconsider that this steepness resulted frommovements during the Middle to Late
35
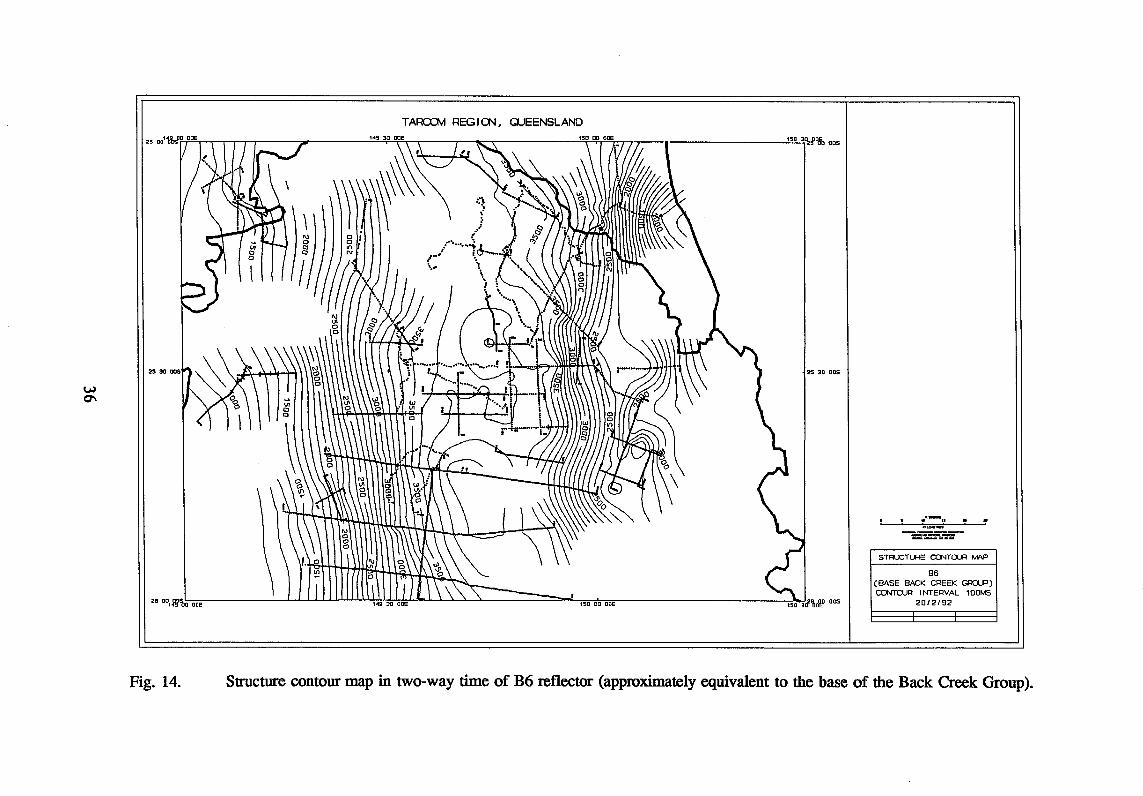
TAROOM REG I CN , QUEENSLAND
SOD ^°'^149 30 00E^ 150 00 ODE^ 1" arg9F13
25 30 005
r^ivic,
r005
23 30 005
;11111114411 111......,.0
\
1./
\
fg
i. s
.. ,........,.,,
(....
e ..•^/.,•
..
, :.\\
i
---;^....
%.:^„;1
‘ .......1 1
\ut
c:2)
in
N;
-'^"^d^111118,
•• el^..... ....•i .^,.,). \till 1
. lc i kilt 1t,
.-..
i11
11111111kSTRUCTURE CCNTOJR NAP
86(EASE SACK CREEK GRCLP)CC{TOUR INTERVAL 10ONS
2012/9225 551.R%0 Doe^ 149 30 00E^ 130 00 00E^ 150 4 111015 555
I I
Fig. 14.^Structure contour map in two-way time of B6 reflector (approximately equivalent to the base of the Back Creek Group).

25 30 005 25 30 005
TARCOM REGICN, GUEENSLANDes odits°° ("E
10.'"*“.11
150 3AOT SOS
STRUCTURE CONTOUR MAP
B33(BASE PEWAN GROUP)
CONTOUR INTERVAL 100MS20/2/92
Fig. 15.^Structure contour map in two-way time of B33 reflector (approximately equivalent to the base of the Late Permian coal measures).

TARDOM REGION, QUEENSLAND
vimme
—1===miT77—
25 00111so0 150 312f9fo oos
STRUCTURE CONRCUR MAP
522(EASE SURAT BASIN)
CONTOUR INTERVAL 201620/2/92
Fig. 16.^Structure contour map in two-way time of S22 reflector (base of the Surat Basin succession).
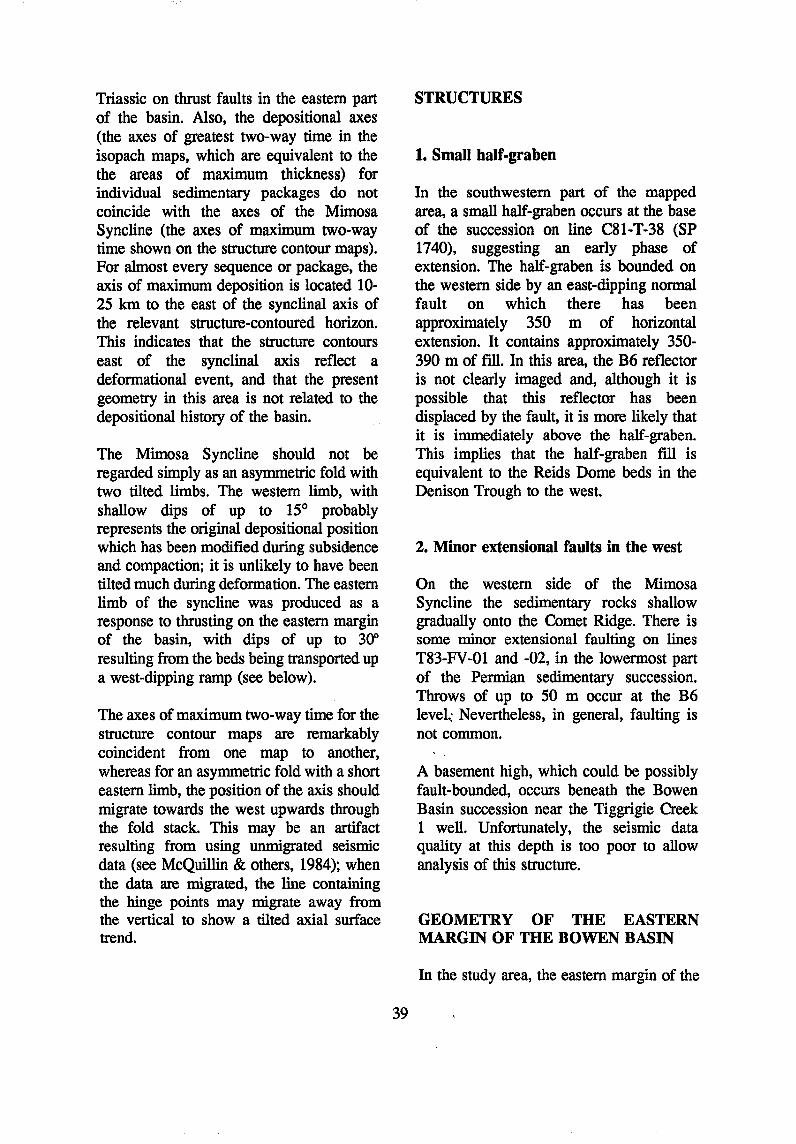
Triassic on thrust faults in the eastern part of the basin. Also, the depositional axes (the axes of greatest two-way time in the isopach maps, which are equivalent to the the areas of maximum thickness) for individual sedimentary packages do not coincide with the axes of the Mimosa Syncline (the axes of maximum two-way time shown on the structure contour maps). For almost every sequence or package, the axis of maximum deposition is located 10-25 km to the east of the synclinal axis of the relevant structure-contoured horizon. This indicates that the structure contours east of the synclinal axis reflect a deformational event, and that the present geometry in this area is not related to the depositional history of the basin.
The Mimosa Syncline should not be regarded simply as an asymmetric fold with two tilted limbs. The western limb, with shallow dips of up to 15° probably represents the original depositional position which has been modified during subsidence and compaction; it is unlikely to have been tilted much during deformation. The eastern limb of the syncline was produced as a response to thrusting on the eastern margin of the basin, with dips of up to 30° resulting from the beds being transported up a west-dipping ramp (see below).
The axes of maximum two-way time for the structure contour maps are remarkably coincident from one map to another, whereas for an asymmetric fold with a short eastern limb, the position of the axis should migrate towards the west upwards through the fold stack. This may be an artifact resulting from using unmigrated seismic data (see McQuillin & others, 1984); when the data are migrated, the line containing the binge points may migrate away from the vertical to show a tilted axial surface trend.
39
STRUCTURES
1. Small half-graben
In the southwestern part of the mapped area, a small half-graben occurs at the base of the succession on line C81-T-38 (SP 1740), suggesting an early phase of extension. The half-graben is bounded on the western side by an east-dipping normal fault on which there has been approximately 350 m of horizontal extension. It contains approximately 350-390 m of fill. In this area, the B6 reflector is not clearly imaged and, although it is possible that this reflector has been displaced by the fault, it is more likely that it is immediately above the half-graben. This implies that the half-graben fill is equivalent to the Reids Dome beds in the Denison Trough to the west.
2. Minor extensional faults in the west
On the western side of the Mimosa Syncline the sedimentary rocks shallow gradually onto the Comet Ridge. There is some minor extensional faulting on lines T83-FV-Ol and -02, in the lowermost part of the Permian sedimentary succession. Throws of up to 50 m occur at the B6 level.; Nevertheless, in general, faulting is not common.
A basement high, which could be possibly fault-bounded, occurs beneath the Bowen Basin succession near the Tiggrigie Creek 1 well. Unfortunately, the seismic data quality at this depth is too poor to allow analysis of this structure.
GEOMETRY OF THE EASTERN MARGIN OF THE BOWEN BASIN
In the study area, the eastern margin of the

Taroom Trough is defined by the Burunga Fault, which forms part of a much larger fault system, the Burunga-LeichhardtMoonie-Goondiwindi-Mooki-Hunter-fault system (Fig. 1). Power & Devine (1970) suggested that the Burunga-MoonieGoondiwindi part of the fault system was a major normal fault with downthrow to the west. Exon (1976) considered that the faults were part of a thrust fault system. This high angle reverse fault interpretation strongly influences current thinking: see, for example, Thomas & others (1982); Elliott & Brown (1988); Elliott (1989); Fielding & others (1990); Finlayson (1990); Finlayson & others (1990a, 1990b).
An alternative interpretation that the fault system was extensional and listric in character was presented by Wake-Dyster & others (1987), principally to provide a mechanism for the large amount of subsidence and accumulation of a thick sediment pile in the Taroom Trough compared with that to the east of the fault system.
Deep seismic reflection surveys have now been carried out at three locations across the Sydney-Gunnedah-Bowen basin system:
1. Across the Bowen Basin farther to the north in the vicinity of Blackwater. At this latitude (approximately 23.5°S), seismic line BMR89.BOI shows that the succession within the basin, as well as the eastern margin, is dominated by east-dipping thrust faults with west-directed thrust movements (Korsch & others, 1990c).
2. In southernmost Queensland to the south of the present study area (about 27.1°S), seismic line BMR84.14 shows the Taroom Trough to be an asymmetrical trough bounded to the east by a
40
steeply-dipping fault, the Leichhardt Fault. Korsch & others (in prep.) interpret this fault as a planar fault which dips very steeply to the west; they consider that the basin was initiated by an oblique extensional mechanism.
3. In the Gunnedah Basin in New South Wales at about 30.7°S, preliminary geological interpretation of seismic line BMR91.G01 by Korsch & others (1992) suggests that the Mooki Fault is a low-angle thrust fault on which the Tamworth .J3elt has been thrust westwards over the eastern margin of the Gunnedah Basin. There is virtually no internal deformation of the Gunnedah Basin by thrusting.
These three seismic traverses show totally different seismic images of the eastern margin of the Bowen-Gunnedah-Sydney basin system, indicating that the eastern margin is extremely complex, and that its character changes along strike.
Seismic lines in the eastern part of the Taroom region show a different geometry again, with a considerable amount of tilting of the Bowen Basin succession beneath the Precipice Sandstone of the Surat Basin (e.g. lines T82-L-2 and 83-52/8, see Figs. 13, 7). The Bowen Basin succession now dips up to 30° to the west and a classic angular unconformity is the result (Figs 7, 13). In the Taroom region, up to 4400 m of the succession has been eroded and in the east the Precipice Sandstone sits directly on the Re~an Group and possibly on the Baralaba Coal" Measures. This monocline is the dominant structure of the Taroom region and traditionally has been regarded as the eastern limb of the Mimosa Syncline. Unfortunately, the seismic coverage in the Taroom region does not extend as far east as the position of the inferred bounding
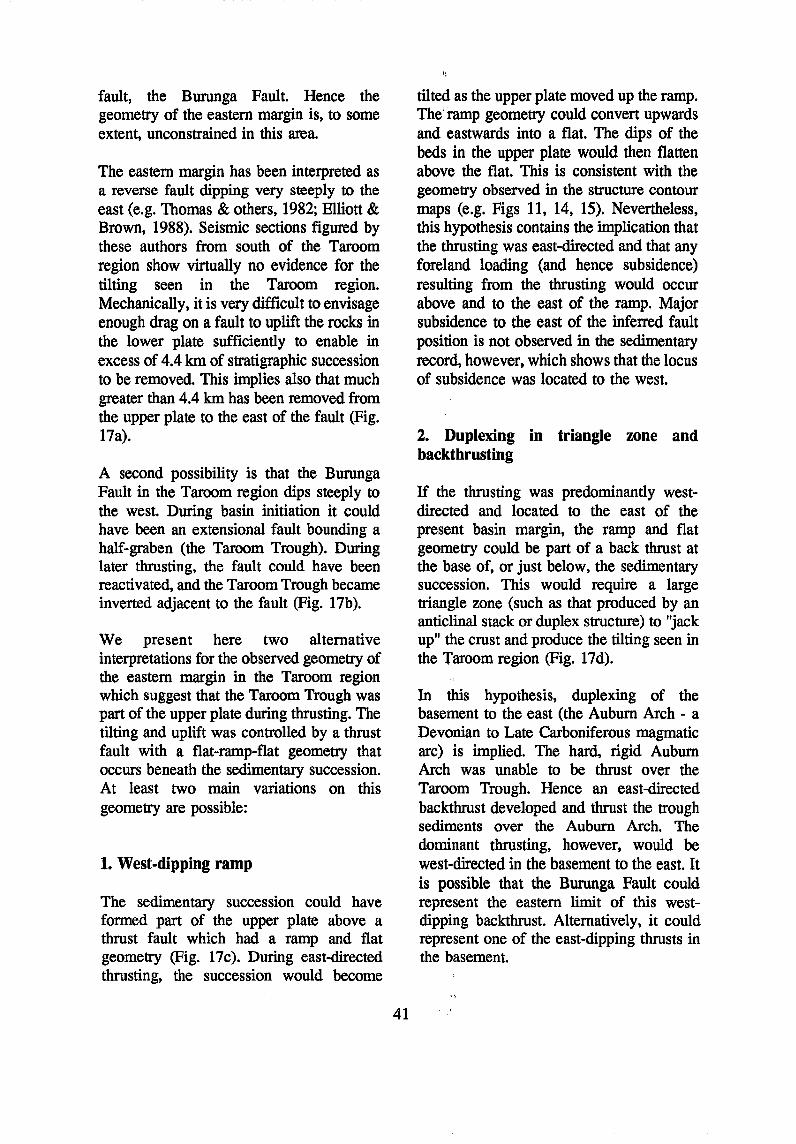
fault, the Burunga Fault. Hence the geometry of the eastern margin is, to some extent, unconstrained in this area.
The eastern margin has been interpreted as a reverse fault dipping very steeply to the east (e.g. Thomas & others, 1982; Elliott & Brown, 1988). Seismic sections figured by these authors from south of the Taroom region show virtually no evidence for the tilting seen in the Taroom region. Mechanically, it is very difficult to envisage enough drag on a fault to uplift the rocks in the lower plate sufficiently to enable in excess of 4.4 km of stratigraphic succession to be removed. This implies also that much greater than 4.4 km has been removed from the upper plate to the east of the fault (Fig. 17a).
A second possibility is that the Burunga Fault in the Taroom region dips steeply to the west. During basin initiation it could have been an extensional fault bounding a half-graben (the Taroom Trough). During later thrusting, the fault could have been reactivated, and the Taroom Trough became inverted adjacent to the fault (Fig. 17b).
We present here two alternative interpretations for the observed geometry of the eastern margin in the Taroom region which suggest that the Taroom Trough was part of the upper plate during thrusting. The tilting and uplift was controlled by a thrust fault with a flat-ramp-flat geometry that occurs beneath the sedimentary succession. At least two main variations on this geometry are possible:
1. West-dipping ramp
The sedimentary succession could have formed part of the upper plate above a thrust fault which had a ramp and flat geometry (Fig. 17c). During east-directed thrusting, the succession would become
41
tilted as the upper plate moved up the ramp. Thei ramp geometry could convert upwards and eastwards into a flat. The dips of the beds in the upper plate would then flatten above the flat. This is consistent with the geometry observed in the structure contour maps (e.g. Figs 11, 14, 15). Nevertheless, this hypothesis contains the implication that the thrusting was east-directed and that any foreland loading (and hence subsidence) resulting from the thrusting would occur above and to the east of the ramp. Major subsidence to the east of the inferred fault position is not observed in the sedimentary record, however, which shows that the locus of subsidence was located to the west.
2. Duplexing in triangle zone and backtbrusting
If the thrusting was predominantly westdirected and located to the east of the present basin margin, the ramp and flat geometry could be part of a back thrust at the base of, or just below, the sedimentary succession. This would require a large triangle zone (such as that produced by an anticlinal stack or duplex structure) to "jack up" the crust and produce the tilting seen in the Taroom region (Fig. 17d).
In this hypothesis, duplexing of the basement to the east (the Auburn Arch - a Devonian to Late Carboniferous magmatic arc) is implied. The hard, rigid Auburn Arch was unable to be thrust over the Taroom Trough. Hence an east-directed backthrust developed and thrust the trough sediments over the Auburn Arch. The dominant thrusting, however, would be west-directed in the basement to the east. It is possible that the Burunga Fault could represent the eastern limit of this westdipping backthrust. Alternatively, it could represent one of the east-dipping thrusts in the basement.

Fig. 17.
A
..
B
.. . . . . '.
, ,I I ,I
" /
,.. , ,'" /'
,1- ,
c
D
I ; '-, , "
. .' . ....
" - , ...
WEDGE
Cartoons to illustrate some possible geometries for the eastern margin of the Taroom Trough in the Taroom region. a. High-angle reverse fault with the Taroom Trough on the lower plate
(footwall). b. High-angle reverse fault with the Taroom Trough on the upper plate
(hanging wall). c. East-directed thrusting with the thrust fault having a ramp-flat
geometry. d. Duplexing in the basement during west-directed thrusting, with the
Taroom Trough being associated with a higher level east-directed backthrust (modified from Roure & others, 1990).
42

Backthrusting in sedimentary successions above duplex structures in either the succession or in the basement appears to be a very common geometry and has been reported from many areas (e.g. European Alps - Roure & others, 1990, Stauble & Pfiffner, 1991; Wales - Jones, 1991; Greenland - Soper & Higgins, 1990; Newfoundland - Cawood & Botsford, 1991; Alberta - Skuce & others, 1992; Argentina-Vines, 1990; central Africa - Daly &
others, 1991)
Four possible geometries for the nature of the eastern margin of the Taroom Trough in the study area are presented in Figure 17. Although we favour the last alternative, conclusive evidence is lacking for any of the hypotheses. Work to the south of the Taroom &gion, where the seismic coverage is more extensive, may shed some light on the problem, but possibly it will be resolved only by a deep seismic reflection traverse oriented east-west across the eastern margin in the Taroom region.
3. Minor thrust faults
A west-dipping thrust fault affects Permian and Triassic sediments in lines S84-CT-02 (Fig. 4) and S84-CT-08. Approximately 340 ms of displacement (about 750 m) has occurred. This fault is located about 15 km to the west of the inferred position of the Burunga Fault (Fig. 2) and occurs to the east of the tilting discussed above; it is possible that the thrust is a splay off the Burunga Fault.
There is some evidence of faulting at the inflexion point between relatively flat-lying or gently dipping strata and more steeply inclined sediments on the eastern limb of the Mimosa Syncline on lines T82-L-2 (Fig. 13) and T82-L-IlO. It is possible, however, that the structuring seen in the sediments is a result of local accommodation caused by
43
a ramp and flat geometry of an underlying thrust fault (Fig. 18). If this were the case, the thrust would be a small backthrust to the main backthrust, possibly the Burunga Fault.
One possible geometry that could link the minor thrusts to the main thrust is the faultbend fold mechanism described by Suppe (1983). Minor thrusting could occur in contractional areas as the upper plate moves over a ramp in the main thrust (see fig. 18).
TECTONIC DEVELOPMENT
Tectonic subsidence curves
Subsidence patterns in sedimentary basins result from a combination of mechanical and thermal processes such as crustal thinning (due to stretching), crustal thickening and loading (due to shortening by thrusting) and thermal cooling. The subsidence history of a basin caused by one or a combination of these mechanisms can be examined by constructing subsidence curves from stratigraphic data.
Tectonic subsidence curves, constructed by the backstripping technique (as described by Sleep, 1971; Watts & Ryan, 1976; Steckler & Watts, 1978; Sclater & Christie, 1980; Ungerer & others, 1984; and many others), provide valuable information on basin evolution, because they attempt to remove the effects of processes such as sediment loading, loading due to the water column, sediment compaction and eustatic sea-level changes. Thus these curves attempt to show the sl}bsidence that would have occurred as a result of tectonic processes alone. A major benefit is that they can provide an indication of the origin of the basin, even if the shape of the basin has changed due to subsequent deformation or erosion.
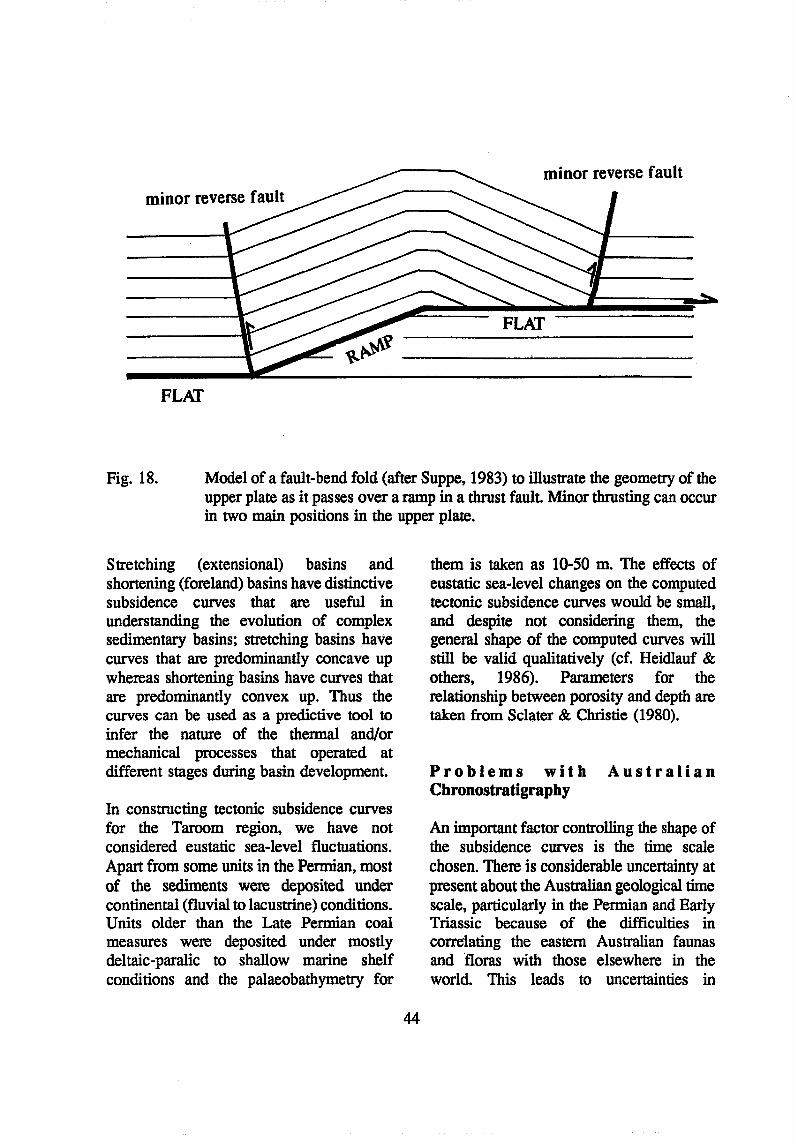
minor reverse fault
FLAT
Fig. 18. Model of a fault-bend fold (after Suppe, 1983) to illustrate the geometry of the upper plate as it passes over a ramp in a thrust fault. Minor thrusting can occur in two main positions in the upper plate.
Stretching (extensional) basins and shortening (foreland) basins have distinctive subsidence curves that are useful in understanding the evolution of complex sedimentary basins; stretching basins have curves that are predominantly concave up whereas shortening basins have curves that are predominantly convex up. Thus the curves can be used as a predictive tool to infer the nature of the thermal and/or mechanical processes that operated at different stages during basin development.
In constructing tectonic subsidence curves for the Taroom region, we have not considered eustatic sea-level fluctuations. Apart from some units in the Permian, most of the sediments were deposited under continental (fluvial to lacustrine) conditions. Units older than the Late Permian coal measures were deposited under mostly deltaic-paralic to shallow marine shelf conditions and the palaeobathymetry for
44
them is taken as 10-50 m. The effects of eustatic sea-level changes on the computed tectonic subsidence curves would be small, and despite not considering them, the general shape of the computed curves will still be valid qualitatively (cf. Heidlauf & others, 1986). Parameters for the relationship between porosity and depth are taken from Sclater & Christie (1980).
Problems with Australian Chronostratigraphy
An important factor controlling the shape of the subsidence curves is the time scale chosen. There is considerable uncertainty at present about the Australian geological time scale, particularly in the Permian and Early Triassic because of the difficulties in correiating the eastern Australian faunas and floras with those elsewhere in the world. This leads to uncertainties in

applying a numerical time scale to the eastern Australian biostratigraphy. In addition, calibration of the international time scale with high resolution isotopic ages is only in its infancy and many uncertainties still exist. Current time scales show considerable variations. For example, the age of the Permian-Triassic boundary is given as 250 Ma by Haq & Van Eysinga (1987) and as 245 Ma by Harland & others (1990). New U-Pb SHRIMP dating of zircons from a Chinese bentonite by Claoue-Long & others (1991) suggests that the boundary is about 251.2 ± 3.4 (2cr) Ma. Based on U-Pb analyses on zircons from the northern Sydney Basin, Oulson & others (1990) suggested that the age of this boundary was 255 ± 4 Ma.
In contrast, the Carboniferous-Permian boundary is given as 290 Ma by both Haq & Van Eysinga (1987) and Harland & others (1990). In Oermany, Hess & Lippolt (1986), using Ar-Ar dating of sanidines, have suggested that the upper limit of the Carboniferous is 300 Ma. Based on their work in the northern Sydney Basin, this age is supported by Oulson & others (1990). New SHRIMP dating of zircons from tuffs in eastern Australia by I.C. Claoue-Long suggests that here this boundary could be as young as about 275 Ma (Roberts & others, 1991).
There are also disagreements over the ages and durations of the stages within the periods. For the Permian Artinskian stage, for example, a duration of 5 m.y. is proposed by Haq & Van Eysinga (1987), whereas Harland & others (1990) propose a duration of 9.1 m.y.
Hence, considerable differences in the duration of time available for the deposition of individual stratigraphic formations are possible, depending upon which numerical time scale the individual formations are calibrated with. The best constrained ages
45
are the SHRIMP age for the PermianTriassic boundary (Claoue-Long & others, 1991) and the Ar-Ar age of Hess & Lippolt (1986) for the Carboniferous-Permian boundary. Hence, until a consistent Australian time scale has been developed, we have chosen to follow the time scale of Haq & Van Eysinga (1987) because this time scale is closest to the above two age determinations. We use this time scale consistently for all the tectonic subsidence curves so that individual subsidence histories can be compared. Note that this time scale produces different numerical ages for stratigraphic formations compared with the time scales used by some other workers in the Bowen and Surat basins such as Fielding & others (1990); most of the sequence boundaries used here become slightly older.
As a note of caution, until a wellconstrained Australian numerical time scale has been developed, the subsidence curves should not be used for detailed interpretation, but only used as a guide to the overall subsidence history of the basin and to indicate when major changes in subsidence rate occurred.
Subsidence curves for the Taroom region
For the Permian, biostratigraphic ages for the southwest part of the Bowen Basin were taken from Archbold & Dickins (1990) and these were correlated with the numerical time scale of Haq & Van Eysinga (1987). Correlations of lithostratigraphy from the southwest part of the basin with the southeast part of the basin follow Draper & others (1990). Biostratigraphic ages for the Triassic formations follow Balme (1990) and Burger (1992), and those for the Jurassic follow Burger (1990).
Preliminary subsidence curves are presented here for four petroleum exploration wells

and also for two of the thickest stratigraphic sections in the Taroom Trough within the study area. The depths for the thick stratigraphic sections in the trough were determined from seismic data, with the twoway travel time converted to depths using rms velocities. The positions are shotpoint 156 on seismic line C82-T-52 and shotpoint 131 on seismic line T82-L-102 (Fig. 2).
Because we have no constraints on the thickness of the Early Permian volcanic pile, we have used the top of this unit (reflector B6, equivalent to the base of the B uffel and Cattle Creek formations) as a common base level; all the subsidence curves commence from this horizon.
Cockatoo Creek 1
The tectonic subsidence curve for the Cockatoo Creek 1 well (Fig. 19a) shows that the rate of subsidence was initially very slow. An unconformity between the Buffel and Oxtrack formations, which has been taken into account in the subsidence curve, suggests that more sediment was originally deposited. The early slow subsidence was followed by a period of extremely rapid subsidence and sedimentation which commenced with the deposition of the Barfield Formation. Rapid subsidence continued until the Early or Middle Triassic and was followed by uplift and erosion of the eastern margin prior to deposition of the Surat Basin succession in the Early Jurassic. Approximately 4.25 km of stratigraphic section was removed at this locality prior to deposition of the Surat Basin (as indicated by the dotted line in Figure 19a).
Burunga 1
This well (Fig. 19b) exhibits a similar subsidence history to Cockatoo Creek 1, although a more complete record of the
46
Surat Basin has been preserved. Approximately 4.4 km of stratigraphic section was removed prior to deposition of the Surat Basin. One problem is that, as yet, the stratigraphic units within the Back Creek Group have not been differentiated. This group is relatively thick (about 980 m) and hence it is not possible to detect the time of commencement of the rapid subsidence phase seen in Cockatoo Creek 1, except to say that it was before the deposition of the Gyranda Formation.
Shotpoint 156, line C82-T-52 and shotpoint 131, line T82-L-I02
These shotpoints represent the thickest, preserved parts of the Bowen Basin in the study area (see Fig. 2 for locations). Using rms velocities, the depth to the top of the volcanics (B6) is about 9.9 km at shotpoint 156 and about 8.7 km at shotpoint 131. Although there is a significant time break from the Middle Triassic to Early Jurassic, it is difficult to estimate the amount of stratigraphic succession that might have been removed. In the seismic sections, the youngest formation of the Bowen Basin, the Moolayember Formation, is very thick (about 1400 m at SP 156 and 1370 m at SP 131) and there is very little evidence for erosion at the top of this formation. Hence, the amount of erosion in the central part of the ,Taroom Trough may have been minimal.
In line C82-T-52, seismic resolution below the base of the Baralaba Coal Measures (B 17) is poor, and reflectors B64 and B26 are not recognisable. In T82-L-102, no reflectors have been interpreted between the base of the Flat Top Fonnation (B26) and the base of the Buffel Formation (B6). This is a reasonably thick interval (about 885 m at SP 131), but it is not possible to determine whether the period of rapid subsidence commenced at or before the

Fig. 19.
o. a.
2000 .
....--.. 4000. 8
---- · · ..c:: · -+-l .-4
0.- • ~ OJ 6000. . IZ:I
Cl r:a 0::
• t) . . . 0 · . 0 · . Eo< 8000. • ~ -- Backstripped t)
.....----+ Decompacted 0 t)
Q 0
10000. :=> 280 205 130
Age (Ma)
b. o.
2000.
4000.
..c:: • -+-l 0.-OJ 6000. • o
8000.
10000. 280
•• LEGEND
-- Backstripped .....----+ Decompacted
205
Age (Ma)
.-4
Tectonic subsidence curve for (a) UOD Cockatoo Creek 1 and (b) UOD B urunga 1 wells. The dotted lines indicate an estimate of the amount of sediment that was deposited and then eroded prior to the deposition of the Early Jurassic Precipice Sandstone. This estimate is derived from the thickness of non-eroded material in the seismic sections immediately to the west.
47
base of the Flat Top Formation. Overall, tectonic subsidence curves for these shotpoint localities (Fig. 20a, 20b) are very similar to Cockatoo Creek 1 and Burunga 1 prior to the Middle to Late Triassic erosional event.
Glenhaughton 1
This well is located on the western margin of the Taroom Trough where the succession is thinning up onto the Comet Ridge. The early part of the Permian succession has been subdivided in some detail for only Cockatoo Creek 1 and this well; hence these wells give the best indication of the nature of the tectonic subsidence for the early part of the history of the basin. During this time interval, several unconformities (between Cattle Creek and Freitag formations, Ingelara and Peawaddy formations, and Peawaddy Formation and Black Alley Shale) suggest that more sediment was originally deposited. These unconformities have been taken into account in the subsidence curve. The initial part of the subsidence curve (Fig. 21a) has a concave-up profile which is typical of a curve due to lithospheric cooling (thermal relaxation) after a thermal event. It is not possible from subsidence curves alone to determine whether the thermal event was associated with a crustal extensional event or not.
The early exponential decay in subsidence is punctuated by a phase of more rapid subsidence that commenced with deposition of the Black Alley Shale. This is over 10 million years later than the increase in subsidence seen in Cockatoo Creek 1, over 100 km to the east-southeast.
Tiggrigie Creek 1
This well bottomed in the Gyranda
48
Formation, but the seismic section (C83-T-4) in the vicinity of the well shows about 975 m of sediment between the base of the Late Permian coal measures (B 17) and the top of the volcanics (B6). Only two individual formations below the coal measures have been distinguished on the seismic section (Gyranda and Flat Top formations). Hence, it is not possible to determine the time of commencement of the rapid subsidence phase, except to suggest that it probably occurred before the deposition of the Flat Top Formation. This well contains a good record of the Triassic sediments and the subsidence curve (Fig. 21b) is typical of all the subsidence curves through this part of the succession.
Summary of the tectonic subsidence curves
The six subsidence curves overall show a very consistent pattern, with the subsidence history subdivided into four main stages:
1. Early thermal relaxation. Evidence for this is best seen in Glenhaughton 1. Eruption of a thick volcanic pile (which could be up to several kilometres thick) in the earliest Permian occurred over a large area I from the northernmost part of the Bowen Basin south into the Sydney Basin. This event, which caused elevated temperatures in the lithosphere, was followed by deposition of the Buffel and Cattle Creek formations in the Taroom region. This subsidence resulted from the thermal response following the input of heat, as represented by magma generation and volcanic activity. That is, cooling and thermal relaxation of the lithosphere drove the subsidence for about 10 m.y. after the cessation of volcanism in the eastern part of the "area, and for at least 20 m.y. in the western part of the area (cf. Figs 19a and 21a).\
Because there are only shallow industry

a.
~
S '-"
..c ~
Pot (1)
Cl
b.
Fig. 20.
o.
2000.
4000.
6000.
8000.
10000. 280
o.
2000.
4000.
6000.
8000.
10000. 280
205
Age (Ma)
205
Age (Ma)
130
130
co lD -c.. rt.l C\l lD I
E-o I
N co 0 riI z ::s 0 .... ::!! Ul -riI Ul
-t'? ..... c.. t7.l C\2 o -I ...:I I
C\2 co E:-< ~ z :3 o -::!! t7.l ~ tzl
Tectonic subsidence curve for (a) shotpoint 156 on seismic line C82-T-52 and (b) shotpoint 131 on seismic line T82-L-102. Note the extremely thick sedimentary successions at these localities of 9.9 Ian for (a) and 8.7 Ian for (b).
49

a.
-.... S
'--"
,.q +oJ p.... Q)
Q
b.
-.... S
'--"
..c: +oJ p.... Q)
Q
Fig. 21.
4000.
~
6000. Z 0 E-o :I:
LEGEND 0 ~ < 8000. :I:
~ Backstripped z E'3 -- Decompacted 0
~ 10000. ::a
280 205 130
Age (Ma)
o.
2000.
4000.
-6000. ~ ~ Iil ~ t)
LEGEND Iil ..... 8000. 0 .....
Backstripped p::; ~
0
Decompacted 0 -- .... £:-t ~ 0
10000. 0
280 205 130
Age (Ma)
Tectonic subsidence curve for (a) MPA Glenhaughton 1 and (b) COE Tiggrigie Creek 1 wells.
so

seismic data in the area, it is not possible to detennine the geometry of the volcanic pile below the sedimentary succession. That is, it is not known whether there was active mechanical extension of the crust at the time of the eruption of the volcanics, and the question remains as to whetherthey filled a graben-like structure or not.
2. The relatively slow initial subsidence was interrupted at about 270-260 Ma by the onset of a phase of rapid subsidence which continued until the Middle Triassic, a period lasting over 30 m.y. This resulted in the deposition of a pile of sediments over 7 km thick in the central part of the Taroom Trough.
Rapid subsidence can be generated by several mechanisms, including mechanical rifting during extension, foreland loading during shortening, and transtension asociated with strike-slip faults (pull apart basins). In the New England Orogen to the east of the basin system, major deformation commenced in the 'mid' Permian at about the same time as the increase in the subsidence rate. In places, the deformation is controlled by major thrusting (e.g. Korsch & others, 199Oc; Fergusson, 1990, 1991); subsidence of the basin during this stage is therefore inferred to be due to foreland loading (as previously suggested by Scheibner, 1976; Veevers, 1984). Murray (1985) suggested that the subsidence was due to loading of the crust by the magmatic arc, and Murray (1990) gives a review of the suggested loading mechanisms.
In foreland loading, subsidence is driven by thrust faults which load and thicken the crust, causing subsidence in front of the thrust sheets. In this situation, the maximum subsidence is located adjacent to thrust sheets where the load is greatest, with subsidence diminishing away from the thrust sheets; the basin shape is extremely
51
asymmetric.
For any particular locality within a foreland basin, the rate of subsidence should increase as the thrust sheets approach. After cessation of thrusting, the sediment loading effect would produce further subsidence, but this would not be sustained for a substantial period because of the absence of any thermal recovery.
Because the thrusting was located principally to the east of the eastern margin, its effects are first noticed in the eastern part of the Taroom Trough. After the rapid subsidence phase commenced at, for example, Cockatoo Creek 1, there is a time lag of some 10 m.y. before the effects of the thrusting are felt in the western part of the area at, for example, Glenhaughton 1. That is, it took over 10 m.y. for the effects of thrusting to be propagated some 100 km to the west.
The tectonic subsidence curves (Figs 19 -21) mostly show an increasing rate of tectonic subsidence up until the end of deposition of the Rewan Group. All curves then. show a decrease in the subsidence rate during deposition of the Clematis Group. The .clematis Group is more quartz-rich when compared with the lithic sandstones of the Rewan Group below it and the Moolayember Formation above it. Deposition of the Clematis Group may represent a period of quiesence or a pause in thrusting. That is, uplift in the source area could have ceased and no new sediment was being added from the eastern margin of the basin. Derivation of the sediments from the west is supported by the palaeocurrent data of Jensen (1975). The incoming of more lithic detritus in the Moolayember Formation may represent commencement of the final phase of thrusting and foreland loading on the eastern margin of the basin.

As a note of caution, the slower subsidence rate for the Clematis Group compared with the Rewan Group and Moolayember Formation might be an artefact of the poor absolute age control due to the problems of converting from the lithostratigraphy to biostratigraphy to the numerical time scale. Nevertheless, the change in sandstone composition coupled with a significant unconformity at the base of the Clematis Group suggests that a significant change in the tectonic situation occurred at this time.
3. A period of non-deposition and/or erosion that lasted for nearly 40 m.y. This is represented by the unconformity between the Bowen Basin and the Surat Basin, which changes from a paraconformity in the central part of the Taroom Trough (e.g. Fig. 6) to a pronounced angular unconformity in the east (e.g. Fig. 7).
Cessation of sedimentation after the Moolayember Formation was deposited was caused most likely by uplift of the eastern margin due to the westward advance of the thrust sheets. Prior to this time, the deformation had been located farther to the east; hence in the Taroom region the main effect of the deformation was subsidence and input of sediment derived from the uplifted thrust sheets. By the end of deposition of the Moolayember Formation, the thrust front had advanced to the west sufficiently far to actively affect the Taroom region, causing the uplift in the eastern part of the trough.
Following cessation of thrusting, a protracted period of erosion across the entire basin produced the subdued topography on which the Surat Basin was deposited. This is reflected in the regularity of the structure contours for the base of the Precipice Sandstone (Fig. 16).
4. Subsidence recommenced in the Early Jurassic, leading to the deposition of the
52
sediment pile in the Surat Basin. Compared with the Bowen Basin, the rate of subsidence was extremely slow. The concave up pattern of the curves suggest that the subsidence was probably driven by thermal relaxation due to cooling of the lithosphere.

CONCLUSIONS (ATW)
Interpretation of a network of industry seismic lines in a transect across the Bowen and Surat Basins in the Taroom Trough using sequence stratigraphic techniques has indicated the presence of at least seven sequence boundaries out of thirteen mapped seismic reflectors. The succession includes both continental and marine rocks and a new approach has been the recognition and definition of sequence boundaries in both categories of rocks.
The identification and verification of sequence boundaries in the Bowen and Surat Basins relies on the recognition of a variety of stratal boundary types, and the ease of their recognition depends largely on the quality of the seismic sections. The sequence boundaries were recognised by stratal geometry (truncation, downlapping, overlapping, etc), erosional features such as channels and erosional relief, separation of packages of reflectors of different character and by other evidence of unconformities. In most cases the stratal terminations and other indicators of sequence boundaries are mostly very subtle and several seismic sections may have to be interpreted before any evidence is found to support the conclusions. The sequence boundaries were compared with established stratigraphy by identifying well ties and by projecting to outcrop data.
The processing of the digitised data by Petroseis™ software facilitates the display of a variety of contoured, sectional and three dimensional data, and detailed isopach and structure contour maps, fence and isometric diagrams and cross-sections were used to illustrate thirteen mapped reflectors. This gave a better understanding of the geometry of the sedimentary packages and
53
their subsurface configuration, and allowed a better interpretation of their genesis and palaeotectonic history.
The early subsidence history of the basin system was driven by thermal relaxation after a major episode of volcanic activity. Foreland loading in the Late Permian to Middle or early Late Triassic, with subsidence driven by thrust-plate loading, is the suggested mechanism for the later tectonic development of this region. Duplexing of the basement to the east is implied, with the thrusting being mainly west-directed. Maximum subsidence occurred adjacent to the thrust sheets where the load was greatest It is estimated, from an interpretation of tectonic subsidence curves, that it took about 10 m.y. for the effects of the thrusting to be propagated 100 km to the west.
ACKNOWLEDGEMENTS
This Record is a contribution to the National Geoscience Mapping Accord project Sedimentary Basins of Eastern Australia. We thank our colleagues in the project for their support. In particular, we are indebted to officers of the Geological Survey of Queensland for organising copies of the industry seismic sections and for the provision of data from QPEO (Queensland Petroleum Exploration Database). We thank C.L. Foster for comments on the biostratigraphy of the Permian and Triassic. The backstripping program to generate the subsidence curves was written originally by J. Tipper and subsequently modified by R. Stamm and B.I. Drummond. Figure 1 was drafted by B. Cotton, and the final format of the 1:250000 maps was developed in consultation with Martyn Moffat of the BMR Cartographic Services Unit and W.O. Palfreyman. We thank H.I.M. Struckmeyer and P.E. O'Brien for their very useful comments on the manuscript.
54
REFERENCES
Alcock, PJ., 1970 - A report on the sedimentology of the Moolayember Formation, Bowen Basin, Queensland. Bureau of Mineral Resources, Australia, Record 1970/25.
Archbold, N.W., & Dickins, 1M., 1991 - Australian Phanerozoic Timescales: 6. A standard for the Permian System in Australia. Bureau of Mineral Resources, Australia, Record 1989/36.
Balme, B.E., 1990 - Australian Phanerozoic timescales: 7. Triassic biostratigraphic charts and explanatory notes. Bureau of Mineral Resources, Australia, Record, 1989/37, 28 pp.
Bauer, J.A., & Dixon, 0., 1981 - Results of a seismic survey in the southern Denison Trough, Queensland, 1978-9. BMR Journal of Australian Geology & Geophysics, 6, 213-222.
Brakel, A.T., & Totterdell, J.M., in press - The Permian palaeogeography of Australia. Bureau of Mineral Resources, Australia, Record, 1990/60, Palaeogeography 19.
Brakel, A.T., Totterdell, J.M., & Wells, A.T., 1992-Sequence boundaries interpreted from seismic data in the Central Taroom Trough, SE Queensland. Proceedings of the 26th Newcastle Symposium on Advances in the study of the Sydney Basin. Department of Geology, University of Newcastle, Publication, 477, 64-71.
Burger, D., 1990 - Australian Phanerozoic timescales: 8. Jurassic biostratigraphic charts and explanatory notes. Bureau of Mineral Resources, Australia, Record, 1989/38, 32 pp.
Burger, D., 1992 - Triassic palynostratigraphy in eastern Australia, a summary. In Burger, D., Foster, C.B., & McKellar, J.L. (contributors), A review of Permian to Cretaceous palynostratigraphy in eastern Australia. Bureau of Mineral Resources, Australia, Record, 1992/5, 12-16.
Cawood, P.A., & Botsford, J.W., 1991 - Facies and
55
structural contrasts across Bonne Bay crossstrike discontinuity, western Newfoundland. American Journal of Science, 291, 737-759.
Chiu Chong, E.S., 1969 - Baralaba-Moura-KiangaTheodore Coalfield - correlation of coal seams between Moura No. 1 area and the southern boundary of Thiess Peabody Mitsui Coal Pty Ltd franchise area. Geological Survey of Queensland, Report 28.
Claoue-Long, J.C., Zhang, Z., Ma, 0., & Du, S., 1991 - The age of the Permian-Triassic boundary. Earth and Planetary Science Leners, 105, 182-190.
Cosgrove, J.L., & Mogg, W.G., 1985 - Recent exploration and hydrocarbon potential of the Roma Shelf, Queensland. The APEA (Australian Petroleum Exploration Association) Journal, 25, 216-234.
Cundill, J., & Meyers, N., 1964 - A discussion of the Permian geology in the area of the Planet Warrinilla and Warrinilla North wells. The APEA (Australian Petroleum Exploration Association) Journal, 4, 133-139.
Daly, M.C., Lawrence, S.R., Kimun'a, D., & Binga, M., 1991 - Late Palaeozoic deformation in central Africa: a result of distant collision ? Nature, 350,605-607.
Day, R.W., Whitaker, W.O., Murray, C.O., Wilson, I.H., & Grimes, K.O., 1983 - Queensland Geology: a companion volume to the 1:2 500 000 scale geological map (1975). Geological Survey of Queensland, Publication 383, 194 pp.
Dickins, J.M., 1964 - Permian macrofossils from Homevale and from the Mount Coolon 1:250 000 Sheet area. In Malone, EJ., Corbett, D.W.P., & Jensen, A.R., Geology of the Mount Coolon 1:250000 Sheet area. Bureau of Mineral Resources, Australia, Report, 64, 54-65.
Dickins, J.M., 1983 - The Permian Blenheim Subgroup of the Bowen Basin and its time relationships. Proceedings of the Symposium
on the Permian Geology of Queensland, Brisbane, 1982. Geological Society of Australia, Queensland Division, 269-274.
Dickins, lM, & Malone, EJ., 1973 - Geology of the Bowen Basin, Queensland Bureau of Mineral Resources, Australia, Bulletin 130.
Draper, 1.1., Palmieri, V., Price, PL., Briggs, DJ.C., & Parfrey, S.M, 1990 -A biostratigraphic framework for the Bowen Basin. In Beeston J.W. (compiler), Bowen Basin Symposium 1990 Proceedings. Geological Society of Australia (Queensland Division), Brisbane, 26-35.
Elliott, L., 1989 - The Surat and Bowen Basins. The APEA (Australian Petroleum Exploration Association) Journal, 29, 398-416.
Elliott, L.G., & Brown, R.S., 1988 - The Surat and Bowen Basins - a historical review. In Petroleum in Australia: the fll'st century. Australian Petroleum Exploration Association, Melbourne, 120-138.
Evans, P.R., 1964. Some palynological observations on the Mesozoic of the baralaba, Monto, Taroom & Mundubbera 1:250 000 Sheet areas, Bowen Surat Basin, Qld. Bureau of Mineral Resources, Australia, Record, 1964/91.
Exon, N.F., 1974 - The geological evolution of the southern Taroom Trough and the overlying Surat Basin. The APEA (Australian Petroleum Exploration Association) Journal, 14, 50-58.
Exon, N.F., 1976 - Geology of the Surat Basin in Queensland. Bureau of Mineral Resources, Australia, Bulletin 166.
Fergusson, C.L., 1990 - Thin-skinned thrusting in the Bowen Basin and northern New England Orogen, central Queensland. In J.W. Beeston (compiler), Bowen Basin Symposium 1990 Proceedings. Geological Society of Australia (Queensland Division), Brisbane, 42-44.
Fergusson, C.L., 1991 - Thin-skinned thrusting in the northern New England Orogen, central Queensland, Australia. Tectonics, 10, 797-806.
56
Fielding, C.R., Gray, A.R.G .• Harris, G.I .• & Salomon, J.A., 1990 - The Bowen Basin and overlying Surat Basin. In Finlayson, D.M. (Compiler and editor) - The Eromanga-Brisbane Geoscience Transect: a guide to basin development across Phanerozoic Australia in southern Queensland. Bureau of Mineral Resources. Bulletin, 232. 105-116.
Finlayson, D.M., 1990 - Basin and crustal evolution along the Eromanga-Brisbane Geoscience Transect: precis and analogues. Bureau of Mineral Resources. Australia, Bulletin. 232, 253-261.
Finlayson. D.M .• Leven, J.H., Wake-Dyster, K.D .• & Johnstone, D.W., 1990a - A crustal image under the basins of southern Queensland along the Eromanga-Brisbane Geoscience Transect. Bureau of Mineral Resources, Australia, Bulletin, 232. 153-176.
Finlayson, D.M .• Wake-Dyster, K.D .• Leven, J.H .• Johnstone. D.W., Murray, C.G., Harrington, HJ., Korsch. RJ. & Wellman, P., 1990bSeismic imaging of major tectonic features in the crust of Phanerozoic eastern Australia. Tectonophysics, 173,211-230.
Foster, C.B., 1982 - Biostratigraphic potential of Permian spore-pollen floras from GSQ Mundubbera 5 & 6, Taroom Trough. Queensland Government Mining Journal, 81,82-96.
Foster, C.B., 1983 - Review of the time frame for the Permian of Queensland. In Proceedings of the Symposium on the Permian Geology of Queensland. Geological Society of Australia (Queensland Division), 107-120.
Golson, B.L., Diessel. C.F.K., Mason, D.R., & Krogh, T .E., 1990 - High precision radiometric ages from the northern Sydney Basin and their implication for the Permian time interval and sedimentation rates. Australian Journal of Earth Sciences, 37, 459-469.
Hammond, R.. 1987 - The Bowen Basin, Queensland, Australia: an upper crustal extension model for its early history. Bureau of Mineral Resources, Australia, Record, 1987/51, 131-139.
Haq, B.U., & van Eysinga, F.W., 1987 - Geological time scale (fourth revised edition). Elsevier. Amsterdam.
Harland, W.B., Annstrong, R.L., Cox, A.V., Craig, L.E., Smith, A.G., & Smith, D.G., 1990 - A geologic time scale, 1989. Cambridge University Press, Cambridge.
Harrington, HJ., 1982 - Tectonics and the Sydney Basin. Proceedings of the 16th Newcastle Symposium on Advances in the study of the Sydney Basin. Department of Geology. University of Newcastle, 15-19.
Harrington, HJ., & Korsch, RJ., 1979 - Structural history and tectonics of the New EnglandYarrol orogen. Bureau of Mineral Resources. Australia. Record, 1979/2, 49-51.
Harrington, HJ., & Korsch, RJ., 1985a - Tectonic model for the Devonian to middle Pennian of the New England Orogen. Australian Journal of Earth Sciences, 32, 163-179.
Harrington, HJ., & Korsch, RJ., 1985b -Deformation associated with the accretion of the Gympie Terrane in eastern Australia. In Leitch, E.C. (Editor) - Third circumPacific terrane conference, extended abstracts. Geological Society of Australia. Abstracts, 14, 104-108.
Heidlauf, D.T., Hsui, A.T. & Klein, G. deV., 1986 -Tectonic subsidence analysis of the illinois
Basin. Journal of Geology, 94, 779-794.
Hess, J .C. and Lippol!, HJ., 1986 - 40 Arf9 Ar ages of tonstein and tuff sanidines: new calibration points for the improvement of the Upper Carboniferous time scale. Chemical Geology, 59, 143-154.
Jensen, A.R., 1975 - Permo-Triassic stratigraphy and sedimentation in the Bowen Basin, Queensland. Bureau of Mineral Resources. Australia. Bulletin 154.
Jones, J.A., 1991 - A mountain front model for the Variscan deformation of the south Wales coalfield. Journal of the Geological Society of London, 148,881-891.
57
Korsch, RJ., 1982 - Early Permian events in the New England Orogen. In Flood, P.G., & Runnegar, B.N. (Editors) - New England geology. Department of Geology and Geophysics. University of New England, 35-42.
Korsch, RJ., Harrington, HJ., Wake-Dyster, K.D., O'Brien, P.E., & Finlayson, D.M., 1988 -Sedimentary basins peripheral to the New England Orogen: their contribution to understanding New England tectonics. In Kleeman, J.D. (Editor), New England Orogen - tectonics and metallogenesis. Department of Geology and Geophysics. University of New England. Armidale, 134-140.
Korsch, RJ., Harrington, HJ., Murray, C.G., Fergusson, C.L., & Flood, P.G., 1990a -Tectonics of the New England Orogen. In Finlayson, D.M. (Compiler and editor), The Eromanga-Brisbane Geoscience Transect a guide to basin development across Phanerozoic Australia in southern Queensland. Bureau of Mineral Resources. Australia. Bulletin 232, 35-52.
Korsch, RJ., O'Brien, P.E., Harrington, HJ., Wake-Dyster, K.D., Finlayson, D.M., & Johnstone, D.W., 1990b - Constraints from deep seismic profiling on models for the evolution of Permian Mesozoic sedimentary basins in eastern Australia. In Pinet, B., & Bois, C. (editors), The potential of deep seismic profiling for hydrocarbon exploration. Editions Technip. Paris, 275-290.
Korsch, RJ., Wake-Dyster, K.D., & Johnstone, D.W., 1990c - Deep seismic profiling across the Bowen Basin. In Beeston J.W. (compiler), Bowen Basin Symposium 1990 Proceedings. Geological Society of Australia (Queensland Division). Brisbane, 10-14.
Korsch, RJ., Wake-Dyster, K.D., & Johnstone, D.W., 1992 - Preliminary geological results from deep seismic reflection profiling in the Gunnedah Basin and New England Orogen. In Earth sciences, computers and the environment. Eleventh Australian Geological Convention. Geological Society of Australia. Abstracts 32, 27.

Korsch, RJ., Wake-Dyster, K.D., O'Brien, P.E., Finlayson, D.M., & Johnstone, D.W., in , press - Geometry of Pennian to Mesozoic 'I
sedimentary basins in eastern Australia and their relationship to the New England Orogen. In Proceedings of the Ninth International Conference on Basement Tectonics. Kluwer Academic Publishers, Dordrecht.
Korsch, RJ., Wake-Dyster, K.D., & Johnstone, D.W., in preparation - Seismic imaging of extensional and contractional structures in the Bowen and Surat basins, eastern Australia. Submitted to Tectonophysics.
Mallett, C.W., Hammond, R.L., & Sullivan, T.D., 1988 - The implications for the Sydney Basin of upper crustal extension in the Bowen Basin. Proceedings of the 22nd Newcastle Symposium on Advances in thestudy of the Sydney Basin, Department of Geology, University of Newcastle, 1-8.
McQuillin, R, Bacon, M., & Barclay, W., 1984 -An introduction to seismic interpretation: reflection seismics in petroleum exploration. Graham and Trotman, London.
Mitchum, RM., 1977 - Seismic stratigraphy and global changes of sea level, Part 1: Glossary of tenns used in seismic stratigraphy. In Payton, C.E. (Editor), Seismic stratigraphy - applications to hydrocarbon exploration. American Association of Petroleum Geologists, Memoir 26, 205-212.
Mollan, R.G., Dickins, J.M., Exon, N.F., & Kirkegaard, A.G., 1969 - Geology of the Springsure 1:250 000 Sheet area, Queensland. Bureau of Mineral Resources, Australia, Report 123.
Murray, C.G., 1985 - Tectonic setting of the Bowen Basin. In Bowen Basin Coal Symposium. Geological Society of Australia, Abstracts 17,5-16.
Murray, C.O., 1990 • Tectonic evolution and metallogenesis of the Bowen Basin. In Beeston, I.W., (compiler), Bowen Basin Symposium 1990 Proceedings. Geological Society of Australia (Queensland Division), Brisbane, 201-212.
58
Parfrey, S.M., 1988 - Biostratigraphy of the Barfield Fonnation, southeastern Bowen Basin, with
- , a review of the fauna from the Ingelara and lower Peawaddy Formations, southwestern Bowen Basin. Queensland Department of Mines, Report, 1.
Paten, RJ., Brown, L.N., & Groves, RD., 1979 -Stratigraphic concepts and petroleum potential of the Denison trough, Queensland. The APEA (Australian Petroleum Exploration Association) Journal, 19, 43-52.
Power, P.E., & Devine, S.B., 1970 - Surat Basin, Australia - subsurface stratigraphy, history and petroleum. American Association of Petroleum Geologists, Bulletin, 54(12), 2410-2437.
Roberts, J., Claou6-Long, J.C., & Jones, PJ., 1991 -Calibration of the Carboniferous and Early
Pennian of the southern New England Orogen by SHRIMP ion microprobe zircon analyses. In Diessel, C.F.K., (convenor), 25th Newcastle Symposium on Advances in the study of the Sydney Basin. University of Newcastle, Department of Geology, Publication, 413,38-43.
Roure, F., Howell, D.O., Ouellec, S., & Casero, P., 1990 - Shallow structures induced by deepseated thrusting. In Letouzey, J. (editor), Petroleum and tectonics in mobile belts. Editions Technip, Paris, 15-30.
Scheibner, E., 1973 - A plate tectonic model of the Palaeozoic tectonic history of New South Wales. Journal of the Geological Society of Australia, 20, 405-426.
Scheibner, E., 1976 - Explanatory notes on the tectonic map of New South Wales. Geological Survey of New South Wales, Sydney, 283 pp.
Sclater, J.G. & Christie, P.A.F., 1980 - Continental stretching: an explanation of the post-mid-Cretaceous subsidence of the central North Sea basin. Journal of Geophysical Research, 85, 3711-3739.
Skuce, A.G., Goody, N.P., & Maloney, J., 1992 -Passive-roof duplexes under the Rocky Mountain foreland basin, Alberta. American
Association of Petroleum Geologists, Bulletin, 76, 67-80.
Sleep, N.H., 1971 - Thermal effects of the formation of Atlantic continental margins by continental break up. Geophysical Journal of the Royal Astronomical Society, 24, 325-350.
Soper, N.J., & Higgins, A.K., 1990 - Models for the , Ellesmerian mountain front in North Greenland: a basin margin inverted by basement uplift. Journal of Structural Geology, 12, 83-97.
SUluble, M., & Pfiffner, O.A., 1990 - Processing, interpretation and modelling of seismic reflection data in the Molasse Basin of eastern Switzerland. Eclogae Geologicae Helvetiae, 84, 151-175.
Steckler, M.S., & Watts, A.B., 1978 - Subsidence of the Atlantic- type continental margin off New York. Earth and Planetary Science Letters, 41, 1-13.
Suppe, J., 1983 - Geometry and kinematics of fault-bend folding. American Journal of Science, 283, 684-721.
Thomas, B.M., Osborne, D.G.,& Wright, A.J., 1982 - Hydrocarbon habitat of the Surat/Bowen Basin. The APEA (Australian Petroleum Exploration Association) Journal, 22, 213-226.
Ungerer, P., Bessis, F., Chenet, P.Y., Durand, B., Nogaret, E.,Chiarelli, A., Dudin, J .L., & Perrin, J.F., 1984 - Geological and geochemical models in oil exploration; principles and practical examples. American Association of Petroleum Geologists, Memoir, 35, 53-77.
Vail, P.R., 1988 - Seismic stratigraphy interpretation utilizing sequence stratigraphy. Part 1: Seismic stratigraphy interpretation procedure. In Sequence stratigraphy workbook. Earth Resources Foundation, University of Sydney.
Vail, P.R., Mitchum, R.M., & Thompson, S., 1977a - Seismic stratigraphy and global changes of sea level, part 3: Relative changes of sea level from coastal onlap. American
59
Association of Petroleum Geologists, Memoir, 26, 63-81.
Vail, P.R., Mitchum, R.M., & Thompson, S., 1977b - Seismic stratigraphy and global changes of sea level, part 4: Global cycles of relative changes of sea level. American Association of Petroleum Geologists, Memoir, 26, 83-97.
Van Wagoner, J.C., Posamentier, H.W., Mitchum, R.M., Vail, P.R., Sarg, J.F., Loutit, T.S., & Hardenbol, J., 1988 - An overview of sequence stratigraphy and key definitions. In Wilgus, C.W., & others (Editors), Sea level changes: an integrated approach. Society of Economic Paleontologists and Mineralogists, Special Publication 42, 39-45.
Van Wagoner, J.C., Mitchum, R.M., Campion, K.M., & Rahmanian, V.D., 1990 -Siliciclastic sequence stratigraphy in well logs, cores, and outcrops: concepts for highresolution correlation of time and facies. American Association of Petroleum Geologists, Methods in Exploration Series 7.
Veevers, JJ. (Editor), 1984 - Phanerozoic earth history of Australia. Clarendon Press, Oxford.
Vines, R.F., 1990 - Productive duplex imbrication at the Neuquina Basin thrust belt front Argentina. In Letouzey, J. (editor), Petroleum and tectonics in mobile belts. Editions Technip, Paris, 69-80.
Wake-Dyster, K.D., Sexton, MJ., Johnstone, D.W., Wright, C., & Finlayson, D.M., 1987 - A deep seismic profIle of 800 km length recorded in southern Queensland, Australia. Geophysical Journal of the Royal Astronomical Society, 89,423-430.
Watts, A.B., & Ryan, W.B.F., 1976 - Flexure of the lithosphere and continental margin basins. Tectonophysics, 36, 25-44.
Ziolkowski, V., & Taylor, R., 1985 - Regional structure of the North Denison Trough. In Bowen Basin Coal Symposium. Geological Society of Australia. Abstracts 17, 129-135.

APPENDICES (MGN)
Appendix 1. List of maps available through BMR Sale Centre.
All maps are available as paper copies at a scale of 1:250 000. We refer to the maps as isopach maps or structure contour maps for convenience, but they have been compiled from seismic two-way travel time data in milliseconds and have not been converted to depth or thickness in metres.
Map No. Description
1 Taroom Region shotpoint map (interpreted lines only)
Structure Contour Maps
2 S 13 reflector - Westgrove Ironstone Member 3 S7 reflector - Base of Evergreen Formation 4 S22 reflector - Base of Precipice Sandstone 5 BlO reflector - Intra-Moolayember Formation 6 B46 reflector - Base of Moolayember Formation 7 B20 reflector - Intra-Clematis Group 8 B48 reflector - Base of Clematis Group 9 B44 reflector - Intra-Rewan Group
10 B33 reflector - Base of Rewan Group 11 B 17 reflector - Base of Baralaba Coal Measures 12 B64 reflector - Base of Gyranda Formation 13 B26 reflector - Base of Flat Top Fomlation 14 B6 reflector - Base of Buffel Formation
Isopach Maps
15 16 17 18 19 20 21 22 23 24 25 26 27 28 29
S7 - S13 S22 - S7 BlO - S22 B46 - BlO B20 - B46 B48 - B20 B44 - B48 B33 - B44 B17 - B33 B64 - B17 B26 - B64 B6 - B26 B33 - S22 B6 - B33 B6 - B17
Base of Evergreen Formation to Westgrove Ironstone Member Base of Precipice Sandstone to base of Evergreen Formation Intra-Moolayember Formation to base of Precipice Sandstone Base of Moolayember Formation to intra-Moolayember Formation Intra-Clematis Group reflector to base of Moolayember Formation Base of Clematis Group to intra-Clematis Group reflector Intra-Rewan Group reflector to base of Clematis Group Base of Rewan Group to intra-Rewan Group reflector Base of Baralaba Coal Measures to base of Rewan Group Base of Gyranda Formation to base of Baralaba Coal Measures Base of Flat Top Formation to base of Gyranda Formation Base of Buffel Formation to base of Flat Top Formation Rewan & Clematis Groups,- & Moolayember Formation (c. Triassic) Base of Buffel Formation to base of Rewan Group (c. Permian) Base of Buffel Formation to base of Baralaba Coal Measures
60
Appendix 2. Data from Petroseis™ available in digital format.
Digital data for the Taroom region includes shot point and horizon (reflector) data for all interpreted seismic sections or any combination of sections and horizon data. It can be exported in the following formats:
- Petroseis™ dump file, which can be imported into any Petroseis7M system. - UKOOA or other fixed format ASCn dump file.
For further information contact:
Chief, Onshore Sedimentary & Petroleum Geology Program Bureau of Mineral Resources GPO Box 378 CANBERRA ACT 2601
Phone: FAX:
06-2499111 06 - 248 8178
61


