Abstract Massive debris flows or rock avalanches falling into a water reservoir may cause devastating hazardssuch as overtopping or dam breakage. This paper presents a coupled Computational Fluid Dynamics andDiscrete Element Method (CFD-DEM) analysis on the impacting behaviour of a granular flow falling from aninclined slope into a water reservoir. The coupling between CFD and DEM considers such important fluid–particle interaction forces as the buoyancy force, the drag force and the virtual mass force. It is found that thepresence of water in the reservoir can generally help to reduce direct impact of granular flow on the check dambehind the reservoir, minimizes the intense collisions and bouncing among particles and helps form a morehomogeneous final deposited heap as compared to the dry case. While the interparticle/particle–wall frictionsand collisions dominate the energy dissipation in the dry granular flow, the majority of kinetic energy of thegranular system in the wet case is first transferred to the water body, which leaves the granular flow itselfto become a contact-shearing dominant one and causes impulse wave travelling between the check dam andthe slope surface for a rather sustained period before settling down. A power law distribution is found for thevelocity profile of the granular flow travelling on both the slope and the reservoir ground surfaces, and it maychange temporarily to a linear distribution at the transition point of the slope toe where the Savage numberdepicts a peak. The consideration of rolling friction among particles may homogeneously reduce the travellingvelocity of the granular flow and alleviate the overall impact on the check dam. The impact on the check damdepends on both the initial debris releasing height and the reservoir water level. Medium water levels in thereservoir have been found to be generally safer when the initial debris height is relatively high.
1 Introduction
Granular flows in forms of snow avalanches, landslides, rock falls and debris or mud flows are among themost devastating natural hazards that cause massive losses of both human lives and properties around theworld annually [2,18]. A recent catastrophic debris flow occurred in Zhouqu City of China in August 2010,for example, killed 1,765 people, injured more than 2,000 and demolished approximately 5,500 houses [43].The significance of effective characterization and prediction of the impact of these types of granular flowshas been well recognized. The currently available approaches on avalanche and debris flow simulation areeither continuum based (see, e.g. [19,23,35,37] and [38,39]) or totally discrete in nature (see, [4,15]). Forexample, Pitman and Le [36] proposed a geophysical mass flow model based on the depth-averaged ‘thin layer’,by considering debris flow as a mixture of solid material and fluid. Chiou et al. [7] used a special integration
Presented at the 8th European Solid Mechanics Conference in the Graz University of Technology, Austria, 9–13 July 2012.
T. Shan · J. Zhao (B)Department of Civil and Environmental Engineering,Hong Kong University of Science and Technology, Clear Water Bay, Kowloon, Hong KongE-mail: [email protected]: 852-2358 1534
2450 T. Shan, J. Zhao
technique by solving the hyperbolic Savage–Hutter equations to numerically investigate the rapid gravity-drivendense granular flows, partly blocked by obstacles with different shapes, sizes and positions. Teufelsbauer et al.[44] presented a comparative study of experimental and DEM investigations of the interaction between rapidgranular flow and an obstacle. Knoll et al. [22] studied the formation of particles flowing between two parallelplates hitting a rectangular obstacle in a simplified two-dimensional model. Zhou and Ng [55] simulated thegranular flows with mixed sized grains using DEM. Mollon et al. [25] employed angular-shaped elementsto investigate the transition of granular masses changing from continuum to discrete form when propagatingdown a slope, in an attempt to capture the behaviour of rock avalanche.
When landslides or avalanches happen to fall into reservoirs or open seas, or they simply occur in forms ofsubaerial/submarine landslides, they may further cause massive impulsive water waves which may generateserious threats to dam safety (such as overtopping or damage caused by wave impact) or far-reaching damagesto offshore and coastal engineering in the open sea case [33,34,48]. The Vajoint dam disaster which occurredin Italy in 1963 is probably one of the most widely known tragedies. A landslide of 300 million m3 in volumeran into the Vajoint reservoir and generated a devastating wave of 80 m high. The overtopping of water overthe dam totally wiped the city of Longarone and claimed a death toll of 1,909 people [9]. More recently, agiant debris flow triggered by heavy rainfall in a mountain zone of south-western China previously shakenby the 2008 earthquake indeed caused the breakage of a check dam of 150 m long and 8 m high, and resultedin great fatalities and losses [43]. Great efforts have been devoted to better understanding the features andinfluencing factors of landslide-generated water waves, based on both numerical and experimental tests (see,e.g. [16,17,25,33]). There have been a number of investigations on case history study of past landslides andinduced wave cases as well [12,34].
In the study of debris flow and its impacts, numerical modelling has proved to be a powerful tool providingrich and insightful information for our analysis. While the existing numerical methods on debris flow simulationhave gained limited success, the majority of them have difficulties to deal with the situation involving withwater, mainly due to their inability to account for the interaction between the particle system and the water.Indeed, fluid–particle interaction underpins the performance for a wider range of key engineering applicationsrelevant to granular media besides debris flow and avalanche, including internal/surface erosion of embankmentdams, oil production in petroleum industries and others [52]. A quantitative understanding of the microscalephenomena relative to fluid–particle interaction may help to establish general methods for reliable scale-up, design and control of different particulate systems and processes [59]. To this end, the ComputationalFluid Dynamics and Discrete Element Method (CFD-DEM) proves to be more computationally efficient andnumerically convenient than many other alternatives, such as the lattice Boltzmann-DEM coupling method andthe Direct Numerical Simulation-DEM coupling methods [32,45,50,58]. The CFD-DEM method typicallysolves the locally averaged Navier–Stokes equation for the fluid flow by CFD which is continuum based, andNewton’s equation for the motions of the particle system by DEM which is discrete based. The coupling betweenDEM and CFD computations is furnished by exchanging fluid-particle interaction forces. The coupled CFD-DEM method is hence a coupled continuum–discrete method indeed. This method has gained much success inapplication to many engineering branches and industries including chemical engineering and mining industriesas well as material processing and manufacturing, involving the modelling of fluidization, pneumatic conveyingand pipeline flow, blast furnace, cyclone, and film coating (see [59]). It has more recently seen a handfulapplications in problems related to geotechnical engineering, such as the seepage flow in soils, sinkholes, theflow under sheet pile walls and sand pile formation in water ([6,42,52–54]). The current paper aims to use acoupled CFD-DEM numerical tool developed by the authors [52,54] to investigate the impacts of a gravity-driven granular flow falling into a water reservoir from an inclined slope, in an attempt to provide usefulreference for debris flow hazard mitigation and future safe design and maintenance of relevant infrastructuressuch as water dams.
2 Coupled CFD-DEM approach on fluid–particle interaction simulation
The adopted CFD-DEM tool has been modified from the open-source software CFDEM (www.cfdem.com)developed originally by [13]. In this coupled CFD-DEM approach, the motion of particles is governed byNewton’s laws of motion which will be solved by the DEM, while the fluid system is assumed to be continuousand can be described by the locally averaged Navier–Stokes equation to be solved by the CFD ([3,45,46]). Thecoupling between CFD and DEM is furnished via proper consideration of particle–fluid interaction forces.Among the typical particle–fluid interaction forces it has been shown [52,53,58] that the consideration of
buoyancy force and drag force may offer reasonable predictions for general geomechanics problems, such asparticle settling, 1D consolidation and sand piling in water. When the unsteady flow behaviour is significant,other unsteady forces such as virtual mass force, Basset force and lift forces may become important [58].Following [54], in addition to the buoyancy force and the drag force, a third unsteady flow force, the virtualmass force, is also considered. The formulation of the coupled CFD-DEM approach is briefly described asfollows. In addition, the surface tension force is regarded important during the entry of the granular particlesinto water and is also considered here.
2.1 Governing equations for the particle system
Following [8], the DEM is employed to solve the following equations governing the motion of a particle i inthe particle system
⎧⎪⎪⎪⎪⎨
⎪⎪⎪⎪⎩
midUp
i
dt=
nci∑
j=1Fc
i j + F fi + Fg
i
Iidωi
dt=
nci∑
j=1Mi j
(1)
where Upi and ωi denote the translational and angular velocities of particle i , respectively. Fc
i j and Mi j are thecontact force and contact torque acting on particle i by particle j or the wall(s), respectively; nc
i is the number of
total contacts for particle i . F fi is the particle–fluid interaction force acting on particle i . Fg
i is the gravitationalforce. mi and Ii are the mass and moment of inertia of particle i . Either the Hooke or Hertzian contact law isemployed in conjunction with Coulomb’s friction law to describe the interparticle contact behaviour.
Particle shape is an important property in the simulation of granular materials, especially for naturallyoccurring materials such as sand and rock (see Zhou et al. [57]; Zuriguel and Mullin [60]; [1,26–29,51,56]).To consider its influence in the DEM, it is convenient to use sphere particles with further consideration ofrolling resistance between contacted particles. In line with this idea, we adopt the directional constant torquemodel proposed by Zhou et al. [57] to calculate the interparticle rolling torque
Mr = −μr Fn Rrωrel
|ωrel | (2)
where Mr is the torque between two contacted particles. Fn is the contact normal force. Rr is the rolling radiusdefined by Rr = rir j/
(ri + r j
)where ri and r j are the radii of the two spherical particles in contact. μr is the
coefficient of rolling resistance.
2.2 Governing equations for the fluid system
The continuous fluid domain is discretized into cells in the CFD method. The CFD will solve the followinggoverning equations at each cell for locally averaged state variables such as fluid velocity, pressure and density:
⎧⎪⎨
⎪⎩
∂(ερ)∂t + ∇ · (
ερU f) = 0
∂(ερU f
)
∂t + ∇ · (ερU f U f
) − ε∇ · (μ∇U f
) = −∇ p − f p + ερg + fs
(3)
where U f is the average velocity of a fluid cell. p is the fluid pressure in the cell; μ is the averaged viscosity;f p is the interaction force averaged by the cell volume exerted by the particles inside the cell on the fluid. g isthe body force vector. In particular, a specific cell can be occupied by immiscible gas and liquid (e.g. air andwater), and its density is the weighted average of the two phases (excluding the volume of particles if they arepresent in a cell). ε = vvoid/vc = 1 − vp/vc denotes the porosity (void fraction) (vvoid is the total volume ofvoid in a cell which may contain either air or water or both; vp is the volume occupied by the particle(s) ina cell; vc is the total volume of a cell). ρ is the averaged fluid density defined by: ρ = αρl + (1 − α) ρg (ρlis the density of liquid phase, and ρg is the density of gas phase), where α = vl/vc = 1 − vg/vc denotes the
2452 T. Shan, J. Zhao
nominal volume fraction of liquid phase in a cell, where vl is the nominal liquid phase volume in the cell andvg the nominal gas phase volume, and vl + vg = vc. Evidently, the total void volume in a cell can be writtenas vvoid = ε
(vl + vg
). If α = 1, the void of a cell will be fully occupied by liquid (like water), and if α = 0,
the void is full of gas (like air). The case of 0 < α < 1 normally refers to a cell with void filled by both liquid(water) and gas (air). This definition of average fluid density in conjunction with the porosity ε leads to a neatlyexpressed continuity equation in Eq. (3) which has been widely followed. Zhao and Shan [52,53] have shownin their benchmarking problem of one particle settling in water that this definition offers a convenient way tosimulate the transition process of particles passing between the interface between (pure) air phase and liquidphase. Surface tension at the air–water interface has an important impact on the slide-induced wave (see, e.g.[16]) which is one of the concerns in this study. In Eq. (3), we have also considered the surface tension forcefs at the air–water interface, where fs is calculated by an interFoam solver in the CFD as follows [11]:1
fs = σκn (4)
where κ = −∇n is the local curvature at the interface. σ is the surface tension coefficient. For water at20◦C, σ = 0.073 N/m. In this study, the surface tension forces on the particles are neglected.
2.3 Fluid–particle interaction forces
In simulating the falling of granular flow into a reservoir, the relatively high-speed impact of particles on thewater body may generate considerable unsteady flows. To account for this behaviour, an unsteady interactionforce, the virtual mass force Fvm , has also been considered in the study, in addition to the buoyancy force Fb
and the drag force Fd . The following average density based formulation is adopted for the buoyancy force (c.f.[20,32]):
Fb = 1
6πρd3
pg. (5)
The drag force is calculated according to the expression proposed by [10]:⎧⎪⎪⎪⎪⎪⎪⎪⎨
⎪⎪⎪⎪⎪⎪⎪⎩
Fd = 18 Cdρπd2
p
(U f − Up
) ∣∣U f − Up
∣∣ ε1−χ ,
Cd =(
0.63 + 4.8√Rep
)2
,
Rep = ερdp∣∣U f −Up
∣∣
μ,
χ = 3.7 − 0.65 exp
[
− (1.5−log10 Rep)2
2
]
(6)
where dp is the diameter of the considered particle. Cd is the particle–fluid drag coefficient which dependson the Reynolds number of the particle, Rep is the particle Reynolds number, and ε−χ denotes a correctivefunction accounting for the presence of other particles in the system on the drag force of the particle underconsideration.
When a particle accelerates or decelerates in a fluid, it needs to deflect a certain volume of the surroundingfluid to move through and hence generates some extra virtual inertia to the system. The virtual mass force issuch an interaction force to account for this effect and is considered important in the current study. In thisstudy, the following expression is employed to calculate the virtual mass force (Odar and Hamilton [30,31]):
⎧⎨
⎩
Fvm = Cvmρ f Vp(v̇p − v̇ f
)/2
Cvm = 2.1 − 0.132/(0.12 + Ac)
Ac = (vp − v f
)2/[(
v̇p − v̇ f)
dp]
(7)
where Vp is the volume of the particle; ρ f = ρ is the averaged fluid density; vp is the velocity of the particle;v f is the velocity of the fluid cell. v̇p is the acceleration of the particle; v̇ f is the acceleration of the fluid cell.
The three forces defined in Eqs. (5)–(7) add up to the total interaction force considered in solving thecoupling particle–fluid system by the CFD-DEM approach
F f = Fd + Fb + Fvm . (8)
1 Surface tension at the free surface has not been considered in [52,53]. This is because free water surface wave was not amajor concern in [52,53], and indeed the effect of surface tension has been found negligible therein.
Granular flow impacting on water reservoir 2453
2.4 Solution procedures and benchmarking of the CFD-DEM approach
In solving the coupled system, an iterative procedure is adopted rather than solving the particle and thefluid systems simultaneously. Specifically, with some initial conditions and incremental loads, the DEM firstsolves the particle system and then computes the resultant interaction forces. The interaction forces are thentransferred to the fluid system to solve the fluid system by the CFD. With all state variables of the fluid solved,these interaction forces are then updated and transferred back to the DEM to solve the particle system forthe next time step. The detailed solution procedure can be referred to [52,54]. In computing the interactionforces in the study, the divided void fraction method proposed in [52] is followed. In this divided void fractionmethod, the void fraction ε of each CFD cell is accurately determined by considering the actual portion ofvolume a particle (or particles) occupies in the cell when the particle is located at the boundary of the cell.This is in contrast to the commonly used centre void fraction method where the volume of a particle is entirelyconsidered towards one single cell once its centre is located in that cell. When applied to the calculation ofinteraction forces, the divided void fraction method has been shown to lead to more reasonable results inmany cases than the centre void method [52]. The coupled CFD-DEM approach has been benchmarked byclassical soil/fluid mechanics problems, such as the classic Stokes’s problem of sphere settling into water andTerzaghi’s one-dimensional consolidation problem. In consideration of buoyancy force and drag force only,this developed approach has shown good benchmarking results as compared to the theoretical results (see[52,53]). With further consideration of the virtual mass force, the predictions have been further improved,which has been shown in a more recent work by the authors [54].
3 Simulation of granular flow falling into water reservoir
To simulate the impacting behaviour of granular flow falling into a water reservoir, we consider an idealizedmodel set-up illustrated in Fig. 1. A packing of granular particles is generated behind a valve wall over theslope surface and is set free to fall down on gravity along the slope into a water reservoir at the foot of theslope. There is a check dam behind the reservoir. The adopted geometries of the inclined slope, the waterreservoir and the check dam are presented in Fig. 1. Figure 1 is indeed the side view of a three-dimensionalchannel flow where the channel width is set to be 1.5 m. Two infinitely high side walls are used to confine thechannel granular flow. The sidewalls, the slope surface and the ground surface of the reservoir as well as thecheck dam surface are idealized as elastic walls, with a modulus ten times of that of the granular particle. Theadopted modelling parameters are summarized in Table 1.
To investigate the influences of initial debris height and water level, we consider three different initial debrisheights (denoted, respectively, in capital letter H , M & L: H = 8 m [High initial debris height], M = 6 m[Medium initial debris height] and L = 4 m [Low initial debris height]) and three different water levels in thereservoir (denoted, respectively, in small letter h, m& l: h = 2.25 m [high water level], m = 1.5 m [mediumwater level] and l = 0.75 m [low water level]). Among the total nine different cases of combination (denotedby Hh, Hm, Hl, Mh, Mm, Ml, Lh, Lm, Ll, respectively), the case of initial debris height of 8 m (H) and basinwater level of 1.5 m (m) (hereafter denoted by Case Hm) will be chosen as a representative one for detailedanalysis. Two additional comparison cases are also investigated for Hm. One corresponds to a case with thesame releasing height but no water in the reservoir, which will be denoted as ‘dry’ or Case Hd; the other caseconsiders the influence of particle shape by changing the rolling resistance from μr = 0 to μr = 0.1 (based onthe torque model proposed in Zhou et al. [57]). Note that the different value for μr is applied after the granularpacking is generated and before it is released from the valve, and therefore, the initial granular packings areindeed identical for all cases.
We take Case Hm shown in Fig. 1 as an example to illustrate the CFD domain discretization. A trapezoidalzone bounded between the slope surface and the check dam shown in Fig. 1, abcd, is treated as the CFD domainand is discretized by CFD mesh. For the 1.5 m basin water level case, a water subdomain of 1.4 m is consideredand is discretized by a CFD mesh of 20 × 10 × 7 (L × W × H), and in each cell of this subdomain α = 1. Anair domain of 2.4 m high (an extra 1 metre above the dam crest is considered) is discretized by a CFD meshof 20 × 10 × 12, and in each cell of this subdomain α = 0. A 0.2 m high subdomain between the pure air andwater subdomains is treated as a transitional zone and is discretized by one layer of mesh (20 × 10 × 1) withα = 0.5 specified for each cell. A mesh sensitivity study has shown that the chosen mesh is generally able toensure the efficiency and stability of the coupled computations while providing reasonable predictions.
A total of 15,000 monosized spherical particles are generated for each packing used in the simulation.Starting from releasing the granular assembly from the valve, a total of 10-seconds real time of flowing and
2454 T. Shan, J. Zhao
Fig. 1 Numerical model set-up and initially deposited granular materials (shown Case Hm)
Table 1 Geometric and model parameters used in the granular flow simulations
Characteristics of the initial packing Monosized 15,000 particles, 70 mm in diameterParticle density 2,700 kg/m3
(Hertz model) 700 GPa (particle–wall contact)Poisson’s ratio 0.3Restitution coefficient 0.7Rolling friction μr = 0 and μr = 0.1 (for Case Hm only)
(using the torquemodel in Zhouet al. [57])
Geometry of the slope and the reservoir Initial release height (case letter) 8 m (H), 6 m (M), 4 m (L)Slope angle 45◦Distance from dam to slope toe 4 mDam height 3 mBasin water level (case letter) 2.25 m (h), 1.5 m (m), 0.75 m (l), 0 m (d)
Simulation control Time step (DEM) 5 × 10⁻⁷ sTime step (CFD) 1 × 10⁻³ sSimulated real time 10 s (20,000,000 steps in DEM)
mixing process has been simulated. Small time steps have been used in both the DEM and CFD computations.As such, adequate accuracy can be achieved by stepping 2000 DEM calculations after one step CFD compu-tation. While the CFD and DEM computations are carried out on parallel, the total computing time for eachsimulation, on a 4-core Intel CPU (3.2 GHz) desktop computer, is around 3 days.
3.1 Kinematics of the granular flow and its impact on the water
To illustrate the flow kinematics of the particle system and its impact on the water, Fig. 2 presents the sideviews of the velocity development of the particle system and the fluid flow (wet case Hm). In each panel of thefigure for the first five seconds of simulation, the dry case (top) is comparatively presented against the wet case
Granular flow impacting on water reservoir 2455
t=1.0s
t=2.0s
t=3.0s
Dry
Wet
Dry
Wet
Dry
Wet
t=4.0s
Dry
Wet
Fig. 2 Side view of the velocity profile of the granular flow into a reservoir (wet case Hm in comparison with the dry case Hd forthe first 5 s. After t = 5 s only close-ups around the reservoir for the wet cases are shown)
2456 T. Shan, J. Zhao
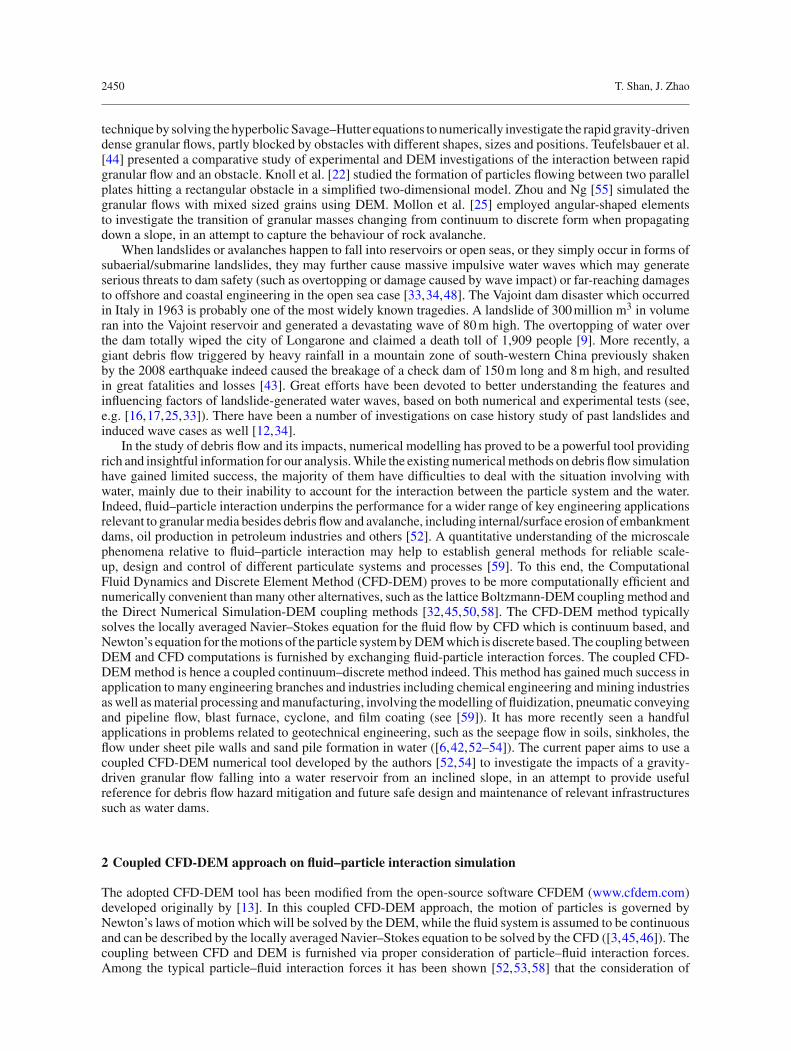
t=5.0s
t=6.0s
Dry
Wet
t=7.0s
t=8.0s
(a) without rolling friction ( 0rµ = ) (b) With rolling friction ( 0.1rµ = )
Fig. 2 continued
(bottom). Beyond t = 5 s, the granular particles totally settle down in the dry case, and only close-up figuresof the wet cases are shown (for t = 6.0–8.0 s).The colour bar is used to indicate the velocities of the particlesystem, and both colour bar and arrows are used to show the fluid field in the wet case. As can be seen, in thedry case, the kinetics of the granular flow changes dramatically when the granular flow reaches the transitionalzone of the slope with the reservoir ground at around t = 2.0 s. At the same time instant, the forefront of thegranular flow in the dry case already hits the check dam and bounces back. In all cases, all particles settledown on the ground in front of the dam at t = 5.0 s. The consideration of rolling resistance apparently drags thefalling of the granular flow slower than the case without rolling resistance and leads to a final stable depositwith a peak close to the transitional point of the slope, while the heap formed without consideration of rollingresistance shows a peak at the check dam surface.
While the behaviour of granular flow on the slope in the wet case appears to be roughly the same with thedry case before it hits the water reservoir, the subsequent behaviour is totally changed by the presence of water.
Granular flow impacting on water reservoir 2457
The forefront movement of the granular flow is significantly delayed by the water. The flow of the granularsystem also depicts a thicker vertical profile moving along the reservoir ground surface than in the dry case. Arelatively stable heap (except some surface particles) is formed at around t = 5.0 s, with an apparently differentshape than that in the dry case. In consideration of rolling resistance, a significant portion of the heap staysat the foot of the slope whose peak occurs at some point over the slope surface. Due to the influence of bothwater and rolling resistance, the granular flow totally settles down before it reaches the check dam. Withoutconsideration of rolling resistance, a relatively levelled deposit is formed which is in contact with the checkdam. Meanwhile, the mixing process of the particles with water transfers significant energies from the particlesystem to the fluid system. As a result, a surging fluid flow field is developed. The maximum fluid velocityoccurs at the proximity of the forefront of the granular system. When the particles finally settle down, a surgingwave is observed travelling between the check dam and the slope surface. The wave is so intense at around t= 5.0 s that it climbs the slope surface up to as high as 3.5 m over the ground, which is more than double of theoriginal hydrostatic height of the water reservoir (1.5 m).
From the close-up around the reservoir for the wet cases at t = 6.0, t = 7.0 and t = 8.0 s in Fig. 2, thegranular systems in both rolling and non-rolling cases almost settle down. While the surging water waveswings between the dam and the slope surface, a small number of particles on the surface of the depositedparticle heap may be mobilized and travel backwards to the slope surface and then fall down again. Suchprocesses can sustain for rather a long period. Some interesting observations on the fluid field can be foundfrom these figures. a) The overall velocity of the fluid within the granular deposit is rather small or almoststagnant, while the fluid body over the deposit (we term it surface flow here for convenience) exhibits a largekinetic energy swinging between the dam and the slope surface; b) the surface swing water waves in the twocases of with rolling and non-rolling depict different behaviour, due primarily to the different bed surfacesformed by the deposited granular particles in the two cases. A relatively plateau particle bed is formed in thenon-rolling case, in comparison with a wedge shape in the rolling case. The former bed surface appears tolead to larger wavy fluctuations for the surface water, which may cause some spilling over the check dam. Inthe rolling case, a portion of the water body is trapped in a triangle zone between the particle wedge and thedam surface whose velocity is rather low. The average velocity of the surface wave in the latter case is hencesmaller than in the former case, and there is no spilling happening either in the rolling case. c) The 10 s ofsimulation in this study can only capture about 2 cycles of the water wave, which partially indicates that thewater alone has a relatively low efficiency in dissipating energy (the subsequent analysis on energy evolutioncan further indicate this).The overall flow fields of both the granular system and the fluid shown in Fig. 2appear to reasonably capture the behaviours of the granular flow and impact of granular flow on the water inthe reservoir.
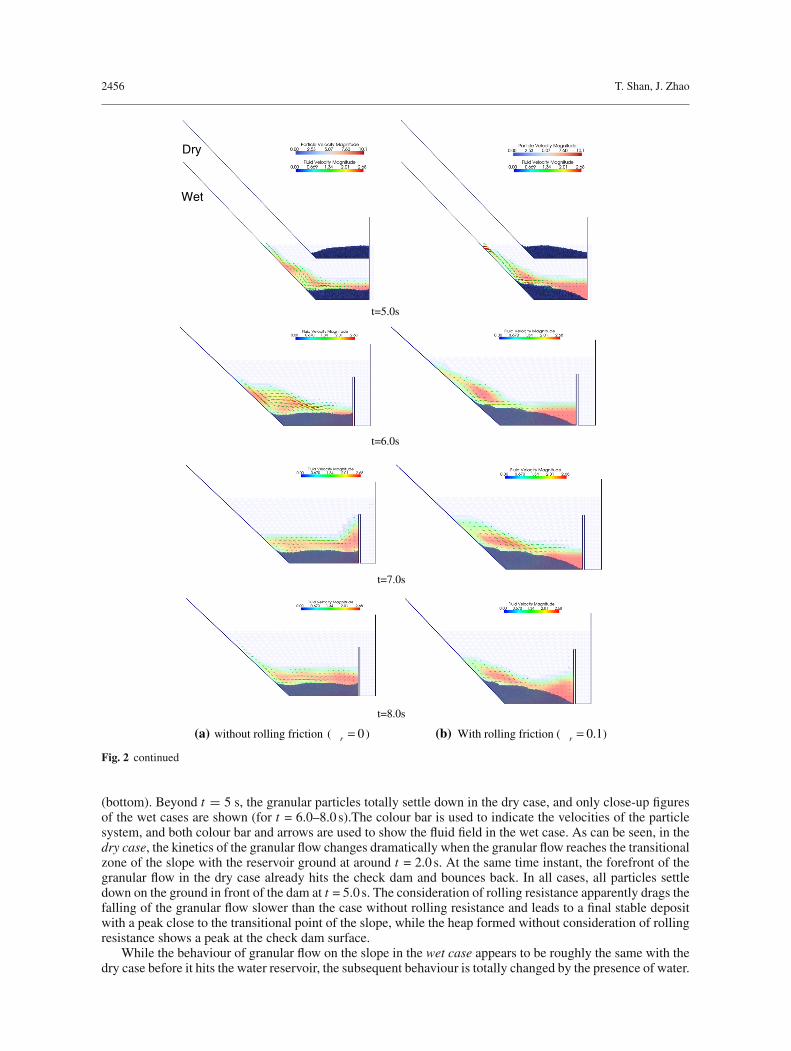
We have further plotted in Fig. 3 the oscillations of impulse water wave surface with the advancing ofgranular flow for three cases, Hm, Hl and Lm (without consideration of rolling resistance). These watersurfaces have been identified based on the contour of α [defined in Eq. (3)]. Specifically, in each instant oftime, the contour of α = 0.5 is taken as the water–air interface which is regarded as the water surface. Alsoplotted in Fig. 3a are the fluid velocities at the fluid cells (represented by arrows) which form the water surface.For Case Hm, prior to the impacting of granular flow, the water surface is hydrostatically levelled at 1.5 mheight. When the forefront of the granular flow hits the water, the particle flow rapidly penetrates the waterbody from below along the slope surface and rushes onto the reservoir ground. From the water surface contourat t = 2.0 s and t = 3.0 s, it appears that the granular flow acts like a solid body splitting the water body. Indeed,there is still water remaining inside the granular body as the fluid field is considered continuum. Nevertheless,the water content in each fluid cell is rather low (i.e. α is typically less than 0.5). With the further advancingof the granular flow beyond t = 4.0 s, the granular body is totally submerged in water, and the surging waveis travelling between the check dam and the slope with oscillated water surface. Interestingly, the observedbehaviour of the impulse water wave in our CFD-DEM simulations is qualitatively in good agreement withthe experimental observations by [16], albeit their water basin is much longer than in our simulations.
The water surface changes for the two comparison cases, Hl and Lm, are also shown in Fig. 3b, c, respec-tively. For Case Hl, the decrease in water level and volume leads to a larger and more inhomogeneous fluidvelocity field. The shapes of the water field at different times are much more complex and irregular in com-parison with Case Hm. The effective mixing zone between particle phase and water phase is below the waterlevel of Case Hl. Therefore, the kinetic energy transferred from particles to the water is almost the samefor both Hl and Hm. While the total water volume is less, the water body in Case Hl gains a larger averagevelocity than in Case Hm. This explains why relatively larger fluctuations of water surface are observed inCase Hl at 4.0 and 5.0 s. For Case Lm, the lower releasing height leads to early entry of the forefront of the
2458 T. Shan, J. Zhao
(a)
(b)
(c)
Fig. 3 Water surface evolution and the fluid velocity distribution on the water surface (μr = 0). a Case Hm; b Case Hl;c Case Lm
granular flow, i.e. at t = 1.0 s, as compared to t = 2.0 s for Case Hm. The subsequent oscillation of the watersurface is similar to Hm but is moderately weaker than Case Hm due to an overall smaller transfer of kineticenergy.
Granular flow impacting on water reservoir 2459
(a)
(b)
Fig. 4 Energy evolution in the granular flow into a reservoir (Cases Hm and Hd): a rolling friction μr = 0; b rolling frictionμr = 0.1. (E p
k = the total kinetic energy of the particle system; �E fp = potential energy change of the fluid system; E f
k = thetotal kinetic energy of the fluid system)
3.2 Energy evolutions
It is instructive to see how the energy evolves, transfers, and dissipates during the entire process. Figure 4presents in the wet case Hm and the comparison dry case Hd the evolution of the kinetic energy for boththe particle and the fluid systems and the total energy dissipated over the process in terms of the differencebetween the total energy input and output of the entire system (i.e. between the potential energy change ofthe particle system �E p and the total kinetic energy of both system plus the potential energy change of thewater system).Notably, in either the dry or the wet case, the kinetic energy of the particle system evolves ina similar manner. It increases steadily with the release of the valve wall but the increasing rate slightly dropsat around t = 0.8 s. This is caused by some initially free-falling particles at relatively high elevations behindthe valve hitting the slope surface or other particles, which induces certain disruptions to the increase in theparticle kinetic energy. The particle kinetic energy reaches a peak at around t = 2 s and then decreases steadilyto almost zero after t = 4 s. The presence of water causes a slightly smaller kinetic energy for the particlesystem than in the dry case at the same time instant. The consideration of rolling resistance leads to a moremoderate reduction in kinetic energy for the particle system than otherwise. The evolutions of the potentialenergy and kinetic energy for the water system appear to be similar in both μr = 0 and μr = 0.1.
The seemingly similar trends of the kinetic energy evolution for the particle system in the dry and wet casescorrespond indeed to rather different underlying physical mechanisms. In the dry case, a large portion of theenergy is dissipated by such physical processes as the interparticle friction, particle–wall friction, interparticle
2460 T. Shan, J. Zhao
collisions and particle–wall collisions (in the rolling resistance case, rolling friction may also contribute to theenergy dissipation but the contribution is rather minor). In the wet case, the direct impact of the particle flowleads to a small peak in the kinetic energy of water at around t = 2 s. However, the subsequent reduction inkinetic energy of the particle system after t = 2 s has not entirely been caused by dissipations of the variousorigins mentioned in the dry case. A good proportion of the system energy has been first transferred to thewater system to raise the potential energy of water, which helps the water to achieve a peak potential change ataround 3.6–3.8 s. Indeed, as mentioned by [47] and [33], the major part of kinetic energy is transferred from thegranular system to the water system during the underwater movement of the debris flow, which is in agreementwith our numerical simulations here. Due to unbalanced distribution of the water potential in the horizontaldirection of the reservoir, surging impulse waves are subsequently generated which will periodically changethe kinetic energy of the water system. With the oscillation of water surface in the reservoir, the energy will begradually dissipated out. Though we have not carried out wavelet analysis on the characteristics of the impulsewave (see [33]), the observed water wave appears to be of an oscillatory nature due probably to the relativelyshort distance from the impact point to the check dam where a reflective wave comes back. During this processof wave propagation, the particle system plays a minimal role, which is evidenced by the almost vanishingkinetic energy of the particle system after t = 4 s.
Further evidence reflecting the two different energy dissipation mechanisms in the dry and wet casescan be found from the evolution of energy dissipation of the whole system, which is also plotted in Fig. 4(denoted by lines for Ed ). Ed is calculated according to Ed = �E p
p − E pk for the dry case (�E p
p = thepotential energy change of the particle system; E p
k = the total kinetic energy of the particle system), and
Ed = �E pp − E p
k − E fk − �E f
p (�E pp = the potential energy change of the particle system; E p
k = the total
kinetic energy of the particle system; �E fp = the potential energy change of the fluid system; E f
k = the totalkinetic energy of the fluid system). From around t = 1.6 s, the initial mixing of water with particles leads toa slightly faster dissipation of energy of the system in the wet case than in the dry case, which is indicatedby the diverging dashed line of the wet case from the solid line for the dry case from above. However, thisprocess is rather brief when the two lines cross over at t = 1.9 s. After t = 1.9 s, the energy dissipation line ofthe dry case stays above that of the wet case, indicating a faster dissipation process in the dry case. This isa stage where the two energy dissipation mechanisms mentioned in the last paragraph come into effect. Thetotal energy dissipation in the dry case approaches to a steady value when the particle system settles down,while the non-smooth curve of energy dissipation for the wet case reflects the fluctuation of the water wavetravelling between the check dam and the slope surface which needs sustained time to eventually dissipate outthe energy and settle down.
3.3 Impacting force on the check dam
It is also important to see how the granular flow and the induced surging wave impact the check dam. Figure 5ashows the evolution of the normal force exerted by the granular system and the excess normal force generatedby the oscillated water for both the dry case Hd and the wet case Hm (for both cases of μr = 0 and μr = 0.1).Note that in the figure the curve F f
n corresponds to the excess normal fluid pressure exerted on the dam surface,i.e. the difference between the impulse water pressure and the initial hydrostatic pressure. Apparently, the totalnormal forces applied by the particle system to the dam surface are considerably reduced in the wet cases ascompared to the dry case. In the wet cases, the impulse wave in the reservoir applies to oscillating positiveand negative excess normal fluid pressure to the dam surface, the magnitudes of which are much larger thanthe nearly constant normal pressure applied by the particles after t = 4 s. In the case of a water dam, especiallya concrete arch dam, this kind of pressure change pattern may be potentially harmful to the dam body. In thecase considering rolling resistance, all the impacting forces are notably reduced. It is especially obvious in thewet case since the forefront of the particle flow has barely reached the check dam due to the presence of waterand rolling resistance.
To investigate the influence of initial releasing height and water level in the reservoir on the impact force,we present in Fig. 5b a comparison among different initial debris heights with a fixed basin water level at1.5 m and in Fig. 5c a comparison of different water levels with fixed dropping height at 8 m. As expected,the increase in initial releasing height generally leads to increased normal impacting force by the particles, aswell as a higher first peak of excess normal water pressure, as shown in Fig. 5b. The subsequent evolutions ofexcess normal water force after the first peak, however, are quite different from the previous trend. The second
Granular flow impacting on water reservoir 2461
(a)
(b)
(c)
Fig. 5 Impact forces evolution of the granular flow into a reservoir: a Cases Hm & Hd; b Fixed water level m = 1.5 m with threedifferent releasing heights (μr = 0); c Fixed initial releasing height H = 8 m with three different water levels (μr = 0). (F p
n =the total normal force of the particle system; F f
n = the total excess normal force exerted by the excess fluid pressure)
water pressure peak, for example, is higher for the low releasing height than the medium case. This is due tothe different granular deposition and final water level in the reservoir after some water spilt over the dam. Aninteresting finding from Fig. 5c is that with the same initial releasing height the medium water level appearsto lead to smaller particle impacting forces as well as a first water pressure peak than the other two water level
2462 T. Shan, J. Zhao
cases. It suggests that an optimal water level (close to the medium water level) may exist where the overallinitial impacting forces may be rendered minimum. Meanwhile, it is observed that the post-first-peak waterpressure fluctuation behaviour of the medium case is also more moderate than in the other two cases. Thehigh water case Hh produces a much deeper valley for the excess water pressure, while the low water case Hlgenerates a higher second excess water pressure peak than the other two cases. In addition, due to the shallowwater in the Hl case, it is found that when the impulse water wave travels back from the slope towards the damsurface for the second time, it mobilizes a portion of the surface granular particles to hit the check dam again.The travelling velocity of the water wave is also higher in the Hl case. In the other two relatively deep watercases (Hm and Hh), the particles almost totally settle down and are rarely affected by the reversing surfacewater wave.
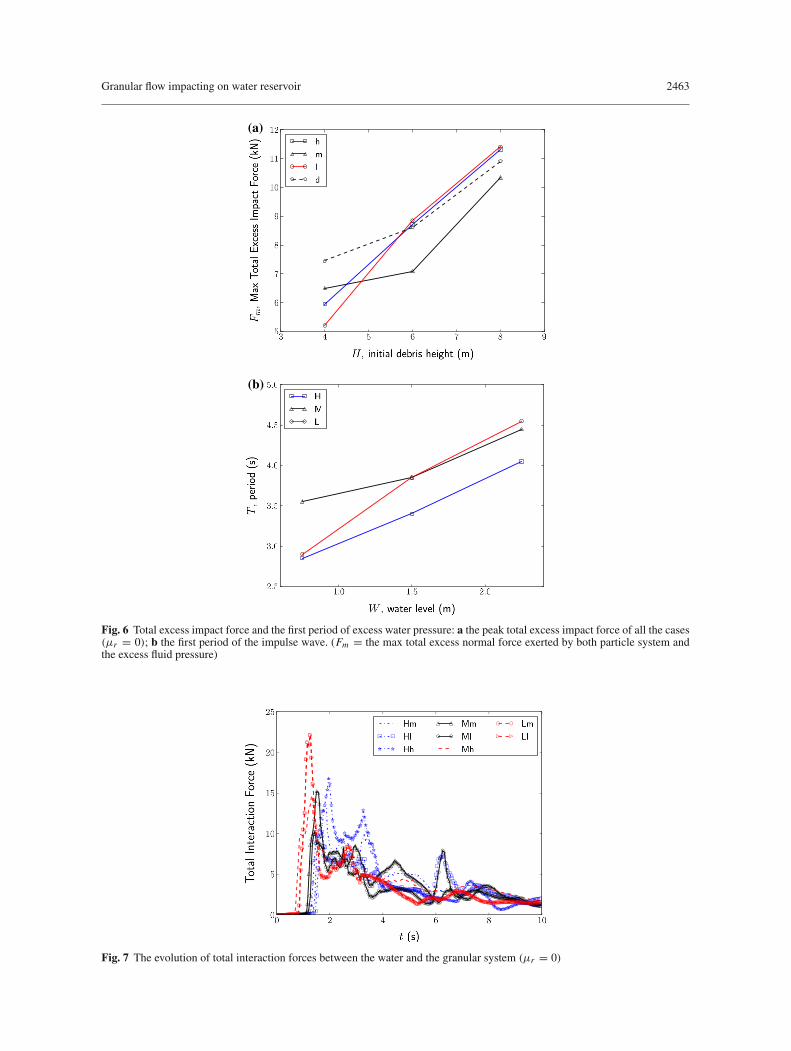
It should also be noted that the large positive normal excess water pressure, if aggregated by the particlenormal force and the initial hydrostatic water force, may significantly exceed the particle normal force in thedry cases. This indicates that special care has to be paid to the adverse effect of a debris flow falling into areservoir which may potentially cause dam breakage, or cause overtopping if the surging wave is high. TheItalian Vajont dam tragedy caused by a high-speed gigantic landslide in 1963 is a well-known example of thiskind (see, [9]; Wikipedia-Vajont Dam: http://en.wikipedia.org/wiki/Vajont_Dam). Figure 6a presents the maxtotal excess forces for all the cases. Of all cases, it appears Case Hl (high releasing height, low basin water)gives rise to the most dangerous behaviour of total excess force exerted on the dam surface. From Fig. 6a, weobserve that when the water level is high or low, the induced max total excess force increases roughly linearlywith the releasing height, which differs from the medium water level and dry cases. Interestingly, when thewater level in the basin is of medium height, the dam appears to be safer in terms of total excess impactingforce, given the initial releasing height of the debris is not very high. Indeed, the maximum total excess forcesin all three cases of the medium water level are smaller than in the dry case, which can be seen from Fig. 6a.We further present in Fig. 6b the first period of the impulse wave for all cases, where an increasing trend ofthe wave period with the water level is observed. When the initial debris packing is high, a smaller period isfound than in the other cases. When the basin water is low, the case of medium releasing height is found togive rise to longer wave period, which appears to be consistent with the observations in Figs. 5 and 6a since alonger wave period may be associated with low velocity and smaller impact.
3.4 Particle–fluid interaction force and particle–particle contact force
We have also monitored the evolution of the total interaction force between the particle system and the waterduring the impacting process for all cases. The total particle–fluid interaction force may be closely correlatedwith the momentum and energy transfer between the particle system and the fluid. Figure 7 indicates that thelow initial height cases (Lm and Ll) generate higher total interaction forces than the other cases, but the forcesquickly drop to a relatively small value due to the fast emerging of the total volume of particles into the water.In contrast, in the high initial releasing cases, the interaction force at the initial entry is not so high but staysfor a relatively long time, and this is because the travelling path of the high initial height cases is long and thetotal volume of the particle system is spreading over the slope. Though the travelling velocity on entering thewater may be high, the total interaction force is low due to small volume.
It is also interesting to monitor the evolution of the mean normal contact force in the particle system duringthe flow. Since in such a granular flow, as treated in this study, the contact force is dominated by interparticlecollisions, the contact force may also be used as an indicator on observing the degree of collisions in thegranular flow. The evolutions of the mean contact normal forces are plotted in Fig. 8. As can be seen inFig. 8a,b, the mean contact normal force increases steadily over time when the particles flow down on theslope, reaches a peak at a time (around t = 2 s) coinciding with the peak of the kinetic energy of the particlesystem (see Fig. 4) and then gradually decreases to a rather small value at around t = 4 s which corresponds tothe time when all particles nearly settle down. The mean contact normal force has a positive correlation withthe evolution of the kinetic energy for the particle system. In Fig. 8a, the presence of water in the reservoircan generally help to reduce the peak mean contact force by 30 % as compared to the dry cases. The peak inthe wet cases also appears to occur slightly earlier than in the dry cases, which may be partially attributable tothe interaction with water involved in the early stage of the granular flow. The rolling resistance plays a ratherminor role in affecting the mean normal contact force. An interesting observation from Fig. 8b is that when theinitial releasing height is high, the mean normal contact force appears to be correlated with the initial heightbut not the presence of water. Lower initial debris height generally leads to a smaller and earlier peak of meannormal contact force.
Fig. 6 Total excess impact force and the first period of excess water pressure: a the peak total excess impact force of all the cases(μr = 0); b the first period of the impulse wave. (Fm = the max total excess normal force exerted by both particle system andthe excess fluid pressure)
Fig. 7 The evolution of total interaction forces between the water and the granular system (μr = 0)
2464 T. Shan, J. Zhao
(a)
(b)
Fig. 8 Evolution of mean normal contact force in the granular system during the flow process: a Cases Hd & Hm; b Six othercases (μr = 0)
3.5 Fabric structure of the final deposition
It is also interesting to explore the characteristics of the fabric structure of the final stable granular deposit inthe reservoir to see how the presence of water and consideration of rolling resistance may affect the final fabricformation. To this end, we employ the contact force network to represent the internal fabric structure formedin the granular deposition [5,14,41]. Without considering rolling resistance (Fig. 9a), the force chain networkof the deposited heap is much stronger in the dry case than in the wet case. The strong force chains in thedry case tilt preferably towards the slope direction, and there is also considerable lateral pressure between thegranular heap and the check dam surface. By comparison, due to the mixing process with water, the final fabricstructure in the wet case presents a considerably weaker contact force network. Almost all strong force chainsin the network orientate almost vertically, which indicates that the final packing is mainly affected by gravity.The lateral pressure exerted by the final sand heap to the check dam is also much smaller than in the dry case.The consideration of rolling resistance changes the final heap pattern (Fig. 9b), but the observed differencesin the fabric structure for the dry and the wet cases remain largely the same as in the case without consideringrolling resistance.
3.6 Flow regimes influenced by the water
The velocity distribution of granular flow at different cross sections along the flow path is of major interestfor researchers working on dry granular flow. It is instructive to compare how the presence of water affects
Granular flow impacting on water reservoir 2465
Fig. 9 Comparison of contact force networks (Case Hm) in the final stable heap formed in the reservoir for a the free rolling case(μr = 0), and b considering rolling resistance case (μr = 0.1)
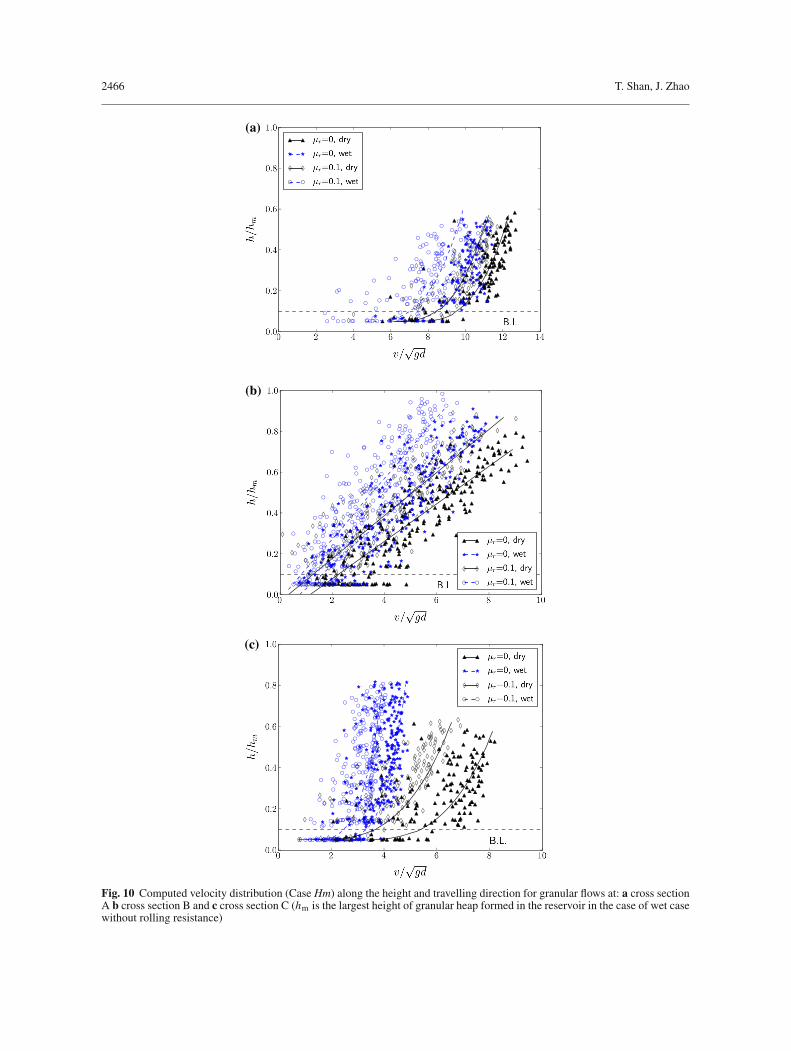
the characteristics of the velocity profile of the granular flow. We choose a time instant when the granular flowshortly passes by the transitional point of the slope and the ground and its forefront moves roughly halfwaytowards the dam. For cases without consideration of rolling resistance, it corresponds to t = 2.25 s. For therolling resistance cases, it is t = 2.5 s. The computed particle velocity distributions along the travelling direction(parallel to the slope surface or the ground surface) in the channel at three cross sections indicated in Fig. 1(cross sections A and C are located 1.0 m from the transitional point at the slope surface and at the reservoirground, respectively. Cross section B is to the right of the transitional point) are plotted in Fig. 10. All thefour cases are under the same conditions of H=8 m and W =1.5 m in the two wet cases. Different symbolsare used in the figure to distinguish the particle velocities for the four different cases (dry + without rollingresistance; wet + without rolling resistance; dry + with rolling resistance and wet + with rolling resistance).The velocity is normalized by
√gd where d is the particle diameter. For each fitting curve, the reciprocal value
of the tangential slope at each point of the curve represents the shear rates γ̇ defined in the rapid granular flowtheory proposed by [40]. The following indicative information can be found from Fig. 10:
(a) The velocity profile of the granular flow at both cross sections A and C can be well fitted by a power lawfunction, while the velocity profile at cross section B is best fitted by a linear function which implies aconstant shear rate case. Note that cross section B is shortly after the transitional point from the slopeto the reservoir ground. The above observation implies the profile change is mainly due to the geometrychange of the bedding plane on which the granular flow travels. Indeed, a further correlation with Fig. 2
2466 T. Shan, J. Zhao
(a)
(b)
(c)
Fig. 10 Computed velocity distribution (Case Hm) along the height and travelling direction for granular flows at: a cross sectionA b cross section B and c cross section C (hm is the largest height of granular heap formed in the reservoir in the case of wet casewithout rolling resistance)
Granular flow impacting on water reservoir 2467
Fig. 11 Variation of Savage number Nsav (Case Hm: H = 8 m, W = 1.5 m) along the travelling direction for fully developedgranular flows (L denotes the parallel to the surface distance of a cross section from the transitional point, e.g. L = −1.0 mcorresponds to cross section A and L = 1.0 m corresponds to cross section C shown in Fig. 1)
indicates that at the chosen time (t is around 2 s), the transitional corner traps some particles close to thebottom which forms a nearly stagnant fan-shape zone. This contributes to the linear distribution of thevelocity profile at cross section B, e.g. reduced velocities close to the bottom. With further movement ofthe granular flow along the ground surface, the top particles of the zone begin to regain their velocities,and the stagnant zone granular gradually diminishes. Up to cross section C, the velocity profile recoversits original power law form as at cross section A.
(b) The presence of water appears to only have a marginal influence on the velocity profile at cross section Awhere the particles have not experienced intense mixing with the water on the slope surface. Its influence,however, becomes more evident at both cross sections B and C. At cross section C, in particular, theinteraction with water renders the entire velocity profile of the granular flow displaced leftwards ascompared to the dry case (Fig. 10c), indicating a systematic dragging down of the flow speed of theparticle system at the entire cross section by water. Meanwhile, the total height of the granular flow bodyis also pushed higher than the dry cases, up to more than 30 %. Nevertheless, the mixing of granularparticles with water does not change the power law nature of the velocity distribution of the granularflow.
(c) The consideration of rolling resistance may homogeneously slow down the movement of the particlesystem. At cross sections A and B, the dry case considering rolling resistance has a comparable profilewith the wet case without consideration of rolling resistance. At cross section C, however, the profile ofthe former case is pushed up and leftwards as compared to the latter case, which indicates the effect ofmixing with water may dominate the granular flow when it regains momentum on the ground surface.
(d) For all cases, there is a boundary layer wherein the frictional wall effect impacts the granular flowsignificantly and the shear rate is considerably larger than in the other part of a profile. The thickness ofthis boundary layer is found to be around one particle diameter.
To gain deeper understanding towards the influences of rolling resistance and water presence on the flowregimes of the granular flow, we may further investigate the change of the Savage number Nsav [40] at differentcross sections. The Savage number is an indicator of the relative significance of the contact shearing and thecollision (inertial effect) in granular flow, which is defined as follows:
Nsav = γ̇ 2d2
gH tan ϕ(9)
where d is the particle diameter, H is the thickness of the granular flow, and ϕ is the interparticle sliding frictionangle. According to the definition of the Savage number, Nsav < 0.1 means that contact-shearing stress isdominant over the solid inertial stress by collision, and the collisions are dominant if Nsav ≥ 0.1.
In Fig. 11, we plot the change of the Savage number at different cross sections for the four cases (Inplotting Fig. 11, the shear rate γ̇ at the section top of the flow and the flowing thickness H can be determined
2468 T. Shan, J. Zhao
in conjunction with Fig. 10). It is found that the Savage number increases when the chosen location is movingtowards the transitional point, reaches a peak at the transitional point and then gradually decreases to a verysmall value when the flow moves farther from the transitional point. This implies the granular flow can becharacterized by a collision-dominant flow when it travels along the slope surface up to the transitional point.When the flow travels beyond the transitional point over the ground surface of the reservoir to cross section C,it remains a collision-dominant one in the dry cases, but gradually evolves to a contact-shearing dominant onefor the wet cases. It appears that the presence of water can totally change the granular flow pattern. Figure 11also indicates that the consideration of rolling resistance consistently leads to reduced Savage number for allcases, which is not surprising since from Fig. 10 we observe that it can help to homogeneously reduce theshear rate of the particle flow in all cases.
4 Conclusions
A coupled CFD-DEM approach was employed in this study to investigate the behaviour of granular flow fallingfrom an inclined slope into a water reservoir. To simulate the fluid–particle interaction, three interaction forceswere considered, including the buoyancy force, the drag force and the virtual mass force. The flow behavioursof both the granular system and the reservoir water were closely monitored. The evolution of energy dissipationand the underlying physical mechanisms was analysed. The study also explored the impacting forces on thecheck dam, the velocity profile of the granular flow at different locations along its travelling path and the fabricstructure of the final stable deposit. The corresponding case of granular flow into a totally dry reservoir wascalculated as a comparison. Interparticle rolling resistance was also considered in the DEM to account for theparticle shape effect on the overall behaviour of the granular flow. The major conclusions drawn from the studyare summarized as follows:
• The presence of water in the reservoir may change the granular flow from a collision dominant one to acontact-shearing dominant one, signified by a dramatic decrease of Savage number for the granular flowafter entering the water. The water presence may also help to form a more homogeneous fabric structurethan the dry case in the final deposited granular heap.
• The observed change of granular flow pattern in the presence of water is related to the underlying energytransfer and dissipation mechanisms. In the dry case, the energy of the granular flow can be rapidly dissipatedby interparticle/particle–wall frictions and collisions. In the wet case, the granular flow first transfers themajority of its kinetic energy to the water body during its underwater movement, which induces surgingimpulse waves oscillating between the check dam and the slope surface for a sustained period before theenergy can be totally dissipated and the wavy water surface settles down.
• The presence of water may help to reduce the direct impacting force on the check dam by the debris flow, butthe maximum excess pressure exerted by the surging water wave plus the original hydrostatic pressure in thereservoir can be dangerously large and may cause catastrophic dam breakage or overtopping when the waveis higher than the dam. The total excess impacting force on the check dam generated by the particle systemand the excess water pressure of the impulse wave depends on both the reservoir water level and the initialdebris releasing height. A sensitivity study shows a medium water level in the reservoir may be relativelysafer for cases with medium to high initial debris height. We have found that the medium water level casemay even lead to smaller total maximum impact force than the dry case when the initial releasing height ishigh. When the initial debris height is low, however, a lower water level will be safer. The velocity profilesof the granular flow retain a power law distribution on both the slope surface and the ground surface of thereservoir. It changes temporarily to a linear distribution at the transition point from the slope to the levelledreservoir ground where the Savage number reaches a peak. The presence of water considerably slows downthe overall velocity of granular flow and pushes up its profile height as well.
• As an approximate way to account for the particle shape effect, the consideration of rolling friction amongparticles may homogeneously reduce the travelling velocity of the granular flow and alleviate the overallimpact on the check dam.
It should be noted that the above conclusions have been made based on rather idealized model set-up andmono-dispersed particles. The real behaviour of granular flow falling into a water reservoir can be intractablymore complicated. Nevertheless, the coupled CFD-DEM approach proves to be a rational micromechanicaltool helping us to gain deeper understanding towards the complex mechanisms governing the granular flowand its impact on the water reservoir and the dam body. Riding on the results obtained from the study, morerealistic models, boundary conditions and grain size distribution and grain shapes (e.g. based on realistic shape
Granular flow impacting on water reservoir 2469
characterization approaches proposed in [26,27,51]) can be further considered, with further experimentalverifications, to offer more insights into debris flow related geohazards.
Acknowledgments The study was supported by Research Grants Council of Hong Kong (RGC/GRF 623211).
References
1. Ai, J., Chen, J.F., Rotter, J.M., Ooi, J.Y.: Assessment of rolling resistance models in discrete element simulations. PowderTechnol. 206, 269–282 (2011)
2. Alexander, D.: Urban landslides. Prog. Phys. Geogr. 13, 157–191 (1989)3. Anderson, T.B., Jackson, R.: Fluid mechanical description of fluidized beds. Equations of motion. Ind. Eng. Chem. Fun-
dam. 6, 527–539 (1967)4. Bharadwaj, R., Wassgren, C., Zenit, R.: The unsteady drag force on a cylinder immersed in a dilute granular flow. Phys.
Fluids 16, 1511–1517 (2006)5. Cates, M.E., Wittmer, J.P., Bouchaud, J.P., Claudin, P.: Jamming, force chains, and fragile matter. Phys. Rev. Lett. 81,
1841–1844 (1998)6. Chen, F., Drummb, E.C., Guiochon, G.: Coupled discrete element and finite volume solution of two classical soil mechanics
problems. Comput. Geotech. 38, 638–647 (2011)7. Chiou, M.-C., Wang, Y., Hutter, K.: Influence of obstacles on rapid granular flows. Acta Mech. 175, 105–122 (2005)8. Cundall, P.A., Strack, O.: A discrete numerical model for granular assemblies. Géotechnique 29, 47–65 (1979)9. Datei, C.: Riproduzione su modello in scala 1:500 della franacadutanel 1959 entroillago-serbatoio del Maé, Internal Report,
Univ. Of Padova, Padova, Italy (1968)10. Di Felice, R.: The voidage function for fluid–particle interaction systems. Int. J. Multiph. Flow 20, 153–159 (1994)11. Deshpande, S.S., Anumolu, L., Trujillo, M.F.: Evaluating the performance of the two-phase flow solver interFoam. Comput.
Sci. Discov. 5, 014016 (2012)12. Giachetti, T., Paris, R., Kelfoun, K., Pérez-Torrado, F.: Numerical modelling of the tsunami triggered by the Güìmar debris
avalanche, Tenerife (Canary Islands): comparison with field-based data. Mar. Geol. 284, 189–202 (2011)13. Goniva, C., Kloss, C., Hager, A., Pirker, S.: An open source CFD-DEM perspective. In: Proceedings of OpenFOAM
Workshop, Göteborg, June 22–24 (2010)14. Guo, N., Zhao, J.D.: The signature of shear-induced anisotropy in granular media. Comput. Geotech. 47, 1–15 (2013)15. Hanes, D.M., Walton, O.R.: Simulations and physical measurements of glass spheres flowing down a bumpy incline. Powder
691–703 (2008)17. Heller, V., Hager, W.H.: Impulse product parameter in landslide generated impulse waves. J. Waterw. Port Coast. Ocean
Eng. 136, 145–155 (2010)18. Hürlimann, M., Copons, R., Altimir, J.: Detailed debris flow hazard assessment in Andorra: a multidisciplinary
approach. Geomorphology 78, 359–372 (2006)19. Hutter, K., Wang, Y., Pudasaini, S.P.: The Savage–Hutter avalanche model: how far can it be pushed?. Phil. Trans. R. Soc.
A 363, 1507–1528 (2005)20. Kafui, K.D., Thornton, C., Adams, M.J.: Discrete particle-continuum fluid modelling of gas–solid fluidised beds. Chem.
Eng. Sci. 57, 2395–2410 (2002)21. Kloss, C., Goniva, C.: LIGGGHTS: a new open source discrete element simulation software. In: Proceedings 5th International
Conference on Discrete Element Methods, London, UK, August (2010). (website: www.liggghts.com)22. Knoll, P., Mirazei, S., Rodrigues, M.: Interaction of a granular flow with a rectangular obstacle. Appl. Math. Model. 34,
407–414 (2010)23. Lehning, M., Doorschot, J., Bartelt, P.: A snowdrift index based on SNOWPACK model calculations. Ann. Glaciol. 31,
382–386 (2000)24. Mohammed, F., Fritz, H.M.: Physical modelling of tsunamis generated by three-dimensional deformable granular land-
slides. J. Geophys. Res. 117, C11015 (2012)25. Mollon, G., Richefeu, V., Villard, D., Daudon, D.: Numerical simulation of rock avalanches: Influence of a local dissipative
contact model on the collective behavior of granular flows. J. Geophys. Res. 117, F02036 (2012)26. Mollon, G., Zhao, J.D.: Fourier–Voronoi-based generation of realistic samples for discrete modeling of granular materi-
als. Granul. Matter 14, 621–638 (2012)27. Mollon, G., Zhao, J.D.: Generating realistic 3D sand particles using Fourier descriptors. Granul. Matter 15, 95–108 (2013)28. Mollon, G., Zhao, J.D.: Characterization of fluctuations in granular hopper flow. Granul. Matter 15, 827–840 (2013)29. Mollon, G., Zhao, J.D.: The influence of particle shape on granular Hopper flow. In: AIP Conference Proceedings 1542,
690-693 (2013)30. Odar, F., Hamilton, W. S.: Forces on a sphere accelerating in a viscous fluid. J. Fluid Mech. 18, 302–314 (1964)31. Odar, F., Hamilton, W. S.: Verification of the proposed equation for calculation of the forces on a sphere accelerating in a
viscous fluid. J. Fluid Mech. 25, 591–592 (1966)32. O’Sullivan, C.: Particulate Discrete Element Modelling: A Geomechanics Perspective. Spon Press (an imprint of Taylor and
Francis), London (2011)33. Panizzo, A., De Girolamo, P., Petaccia, A.: Forecasting impulse wave generated by subaerial landslides. J. Geophys.
34. Phillips, C.B., Martin, R.L., Jerolmack, D.: Impulse framework for unsteady flows reveals super-diffusive bed load trans-port. Geophys. Res. Lett. 40, 1328–1333 (2013)
35. Pitman, E.B., Long, L.E.de : A two-fluid model for avalanche and debris flows. Phil. Trans. R. Soc. A Math. Phys. Eng.Sci. 363, 1573–1601 (2005)
36. Pitman, E.B., Le, J.: A two-fluid model for avalanche and debris flows. Phil. Trans. R. Soc. A 363, 1573–1601 (2005)37. Pudasaini, S.P., Hutter, K.: Rapid shear flows of dry granular masses down curved and twisted channels. J. Fluid
Mech. 495, 193–208 (2003)38. Pudasaini, S.P., Hutter, K.: Dynamics of rapid flows of dense granular avalanches. In: Avalanche Dynamics. Springer, Berlin
(2007)39. Sailer, R., Fellin, W., Fromm, R., Jörg, P., Rammer, L., Sampl, P., Schaffhauser, A.: Snow avalanche mass-balance calculation
and simulation-model verification. Ann. Glaciol. 48, 183–192 (2008)40. Savage, S.B.: The mechanics of rapid granular flows. Adv. Appl. Mech. 24, 289–366 (1984)41. Snoeijer, J.H., Vlugt, T.J.H., Hecke, M.van , Saarloos, W. van : Force network ensemble: a new approach to static granular
matter. Phys. Rev. Lett. 92, 054302 (2004)42. Suzuki, K., Bardet, J., Oda, M., Iwashita, K., Tsuji, Y., Tanaka, T., Kawaguchi, T.: Simulation of upward seepage flow in a sin-
gle column of spheres using discrete-element method with fluid–particle interaction. J. Geotech. Geoenviron. Eng. 133, 104–10 (2007)
43. Tang, C., Asch, T.W.J.van , Chang, M., Chen, G.Q., Zhao, X.H., Huang, X.C.: Catastrophic debris flows on 13 August 2010in the Qingping area, southwestern China. Geomorphology 139, 559–576 (2010)
44. Teufelsbauer, H., Wang, Y., Chiou, M.C., Wu, W.: Flow–obstacle interaction in rapid granular avalanches: DEM simulationand comparison with experiment. Granul. Matter 11, 209–220 (2009)
45. Tsuji, Y., Kawaguchi, T., Tanaka, T.: Discrete particle simulation of two-dimensional fluidized bed. Powder Technol. 77,79–87 (1993)
46. Tsuji, Y., Tanaka, T., Ishida, T.: Lagrangian numerical simulation of plug flow of cohesionless particles in a horizontalpipe. Powder Technol. 71, 239–250 (1992)
47. Walder, J.S., Watts, P., Sorensen, O.E., Janssen, K.: Tsunamis generated by subaerial mass flows. J. Geophys.Res. 108, 2236 (2003)
48. Watt, S.F.L., Talling, P.J., Vardy, M.E., Heller, V., Hühnerbach, V., Urlaub, M., Sarkar, S., Masson, D.G., Henstock, T.J.,Minshull, T.A.: Combinations of volcanic-flank and seafloor-sediment failure offshore Montserrat, and their implicationsfor tsunami generation. Earth Planet. Sci. Lett. 319, 228–240 (2012)
49. Xu, B.H., Feng, Y.Q., Yu, A.B., Chew, S.J., Zulli, P.: A numerical and experimental study of gas–solid flow in a fluid-bedreactor. Powder Handl. Process. 13, 71–76 (2001)
50. Xu, B.H., Yu, A.B.: Numerical simulation of the gas-solid flow in a fluidized bed by combining discrete particle methodwith computational fluid dynamics. Chem. Eng. Sci. 52, 2785–2809 (1997)
51. Zhao, J.D., Mollon, G.: A statistically-based approach on reconstructing sand particles for discrete modelling. In: Proceedingsof the Workshop on Experimental Micromechanics for Geomaterials, Hong Kong (May 2013)
52. Zhao, J.D., Shan, T.: Coupled CFD-DEM simulation of fluid-particle interaction in geomechanics. Powder Technol. 239,248–258 (2013)
53. Zhao, J.D., Shan, T.: Numerical modelling of fluid-particle interaction in granular media. Theor. Appl. Mech.Lett. 3(2), 021007 (2013)
54. Zhao, J.D., Shan, T.: A coupled CFD-DEM approach on modelling fluid-particle interactions in granular materials. Eng.Comput. Under review (2013)
55. Zhou, G.D., Ng, C.W.W.: Numerical investigation of reverse segregation in debris flows by DEM. Granul. Matter 12,507–516 (2010)
56. Zhou, C., Ooi, J.Y.: Numerical investigation of progressive development of granular pile with spherical and non-sphericalparticles. Mech. Mater. 41, 707–714 (2009)
57. Zhou, Y.C., Wright, B.D., Yang, R.Y., Xu, B.H., Yu, A.B.: Rolling friction in the dynamic simulation of sandpile formation.Physica A 269, 536–553 (1999)