Jim Ray , NOAA/National Geodetic Survey Xavier Collilieux & Paul Rebischung, IGN/LAREG Tonie van Dam, University of Luxembourg Zuheir Altamimi, IGN/LAREG CONSISTENCY OF CRUSTAL LOADING SIGNALS DERIVED FROM MODELS & GPS: INFERENCES FOR GPS POSITIONING ERRORS • Quantify error budget for weekly dNEU GPS positions – use IGS solutions for a global set of 706 stations • Include results from subset of 119 close station pairs – isolate electronic/thermal noise component • Assess draconitic errors too – spatial distribution & station vs. satellite source AGU Fall 2011, Session G51B-06, San Francisco, 9 December 2011
Transcript
Jim Ray, NOAA/National Geodetic Survey
Xavier Collilieux & Paul Rebischung, IGN/LAREG
Tonie van Dam, University of Luxembourg
Zuheir Altamimi, IGN/LAREG
CONSISTENCY OF CRUSTAL LOADING SIGNALSDERIVED FROM MODELS & GPS:
INFERENCES FOR GPS POSITIONING ERRORS
• Quantify error budget for weekly dNEU GPS positions– use IGS solutions for a global set of 706 stations
• Include results from subset of 119 close station pairs– isolate electronic/thermal noise component
• Assess draconitic errors too– spatial distribution & station vs. satellite source
AGU Fall 2011, Session G51B-06, San Francisco, 9 December 2011
• GPS station position time series from IGS reprocessing– analysis consistent with IERS 2010 Conventions (more or less)– combined results from up to 11 Analysis Centers– 706 globally distributed stations, each with >100 weeks– data from 1998.00 to 2011.29– Helmert alignment (no scale) w.r.t. cumulative solution uses a well-
distributed subnetwork to minimize aliasing of local load signals– care taken to find position/velocity discontinuities
• Mass load displacement time series for the same stations– 6-hr NCEP atmosphere– 12-hr ECCO non-tidal ocean– monthly LDAS surface ice/water, cubic detrended to remove model drift– all computed in CF frame– sum is linearly detrended & averaged to middle of each GPS week– data from 1998.0 to 2011.0
• Study dN, dE, dU non-linear residuals (1998.0 – 2011.0)– bias errors not considered here !
Input Data Sets to Compare
02
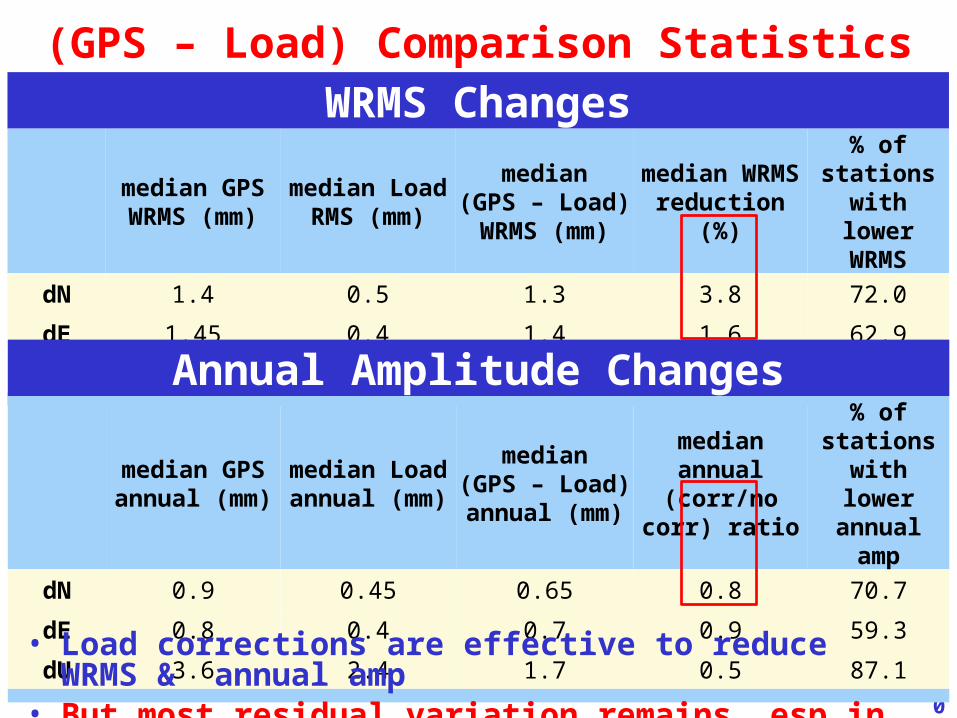
(GPS – Load) Comparison Statistics
03
WRMS Changesmedian GPS WRMS (mm)
median Load RMS (mm)
median(GPS – Load) WRMS (mm)
median WRMS reduction (%)
% of stations with lower
WRMSdN 1.4 0.5 1.3 3.8 72.0
dE 1.45 0.4 1.4 1.6 62.9
dU 4.6 2.6 3.8 15.2 87.4
Annual Amplitude Changesmedian GPS annual (mm)
median Load annual (mm)
median(GPS – Load) annual (mm)
median annual (corr/no corr)
ratio
% of stations with lower annual amp
dN 0.9 0.45 0.65 0.8 70.7
dE 0.8 0.4 0.7 0.9 59.3
dU 3.6 2.4 1.7 0.5 87.1
• Load corrections are effective to reduce WRMS & annual amps– for most stations, esp for dU – but less for dN & even less for dE
(GPS – Load) Comparison Statistics
04
WRMS Changesmedian GPS WRMS (mm)
median Load RMS (mm)
median(GPS – Load) WRMS (mm)
median WRMS reduction (%)
% of stations with lower
WRMSdN 1.4 0.5 1.3 3.8 72.0
dE 1.45 0.4 1.4 1.6 62.9
dU 4.6 2.6 3.8 15.2 87.4
Annual Amplitude Changesmedian GPS annual (mm)
median Load annual (mm)
median(GPS – Load) annual (mm)
median annual (corr/no corr)
ratio
% of stations with lower annual amp
dN 0.9 0.45 0.65 0.8 70.7
dE 0.8 0.4 0.7 0.9 59.3
dU 3.6 2.4 1.7 0.5 87.1
• Load corrections are effective to reduce WRMS & annual amp• But most residual variation remains, esp in dN & dE
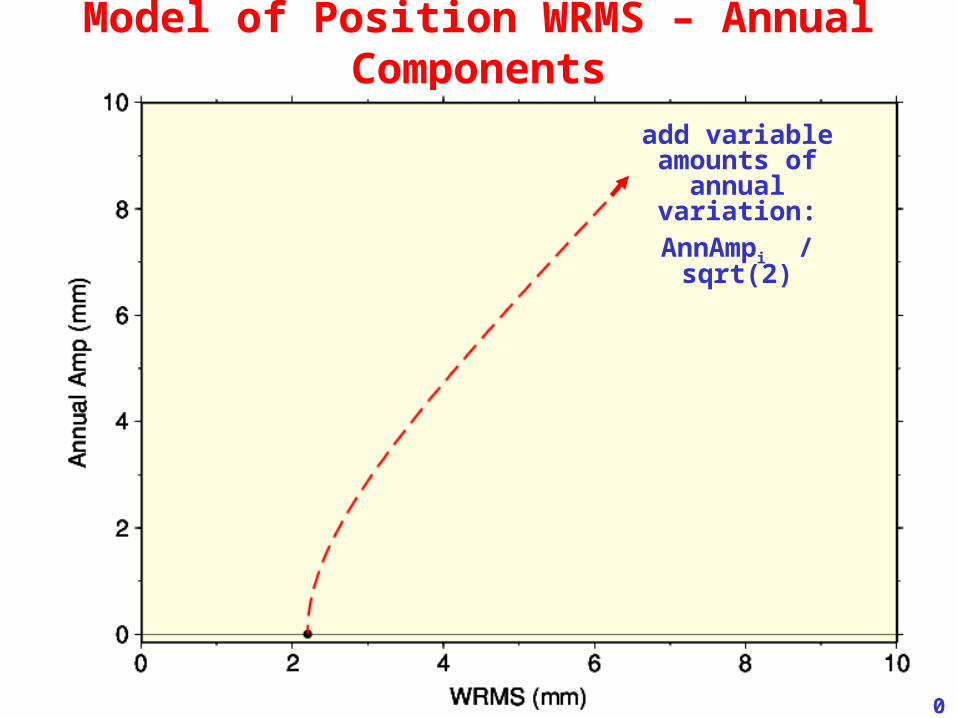
• AnnAmpi = mean annual amplitude– Ai = 1 / sqrt(2) = 0.7071 or Ai
2 = 0.5 → for stationary sinusoid– Ai 2 > 0.5 → for non-stationary seasonal variations– includes loads + all other annual effects (e.g., technique errors)
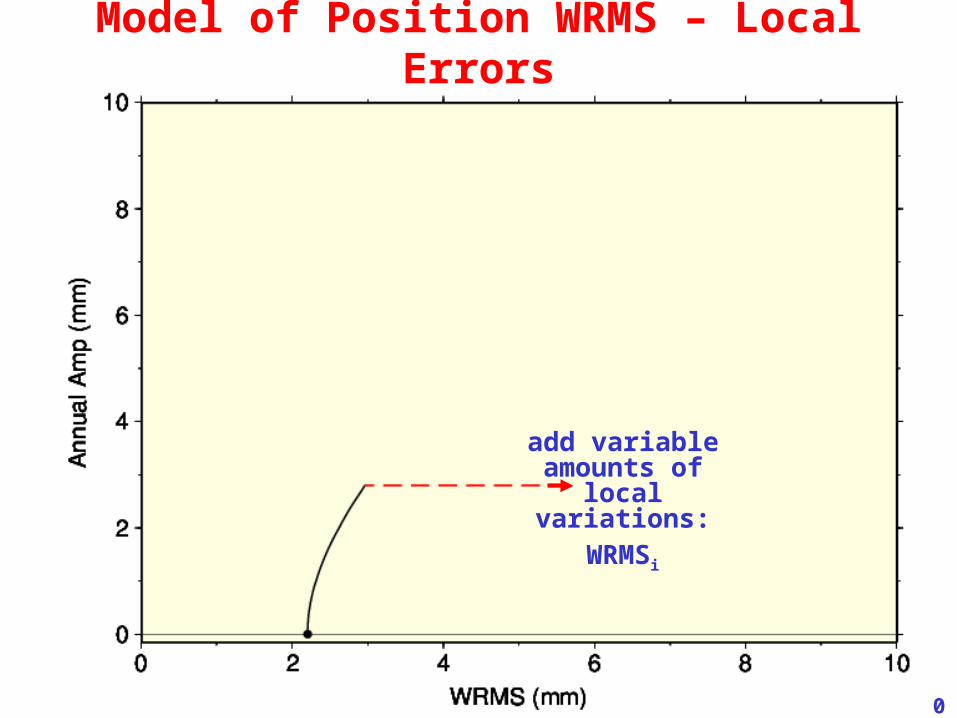
• WRMSi2 = local site-specific errors (non-annual part only):
– multipath & monument noise– antenna mis-calibration– thermal expansion of antenna installation & bedrock– tropo mis-modeling + geography-dependent orbit errors– non-annual loads (or residual load model errors, if corrected)– inter-AC analysis & station usage differences + RF realization
A Generalized Model of Position WRMS
05
Model of Position WRMS – Global Error Floor
06
WRMSo error floor
Model of Position WRMS – Annual Components
07
add variable amounts of annual variation:AnnAmpi / sqrt(2)
Model of Position WRMS – Local Errors
08
add variable amounts of local variations:
WRMSi
IGS Results – dN With/Without Loads
09
• Load corrections have no impact on noise floor assessment– local site & non-load errors overwhelmingly dominate
A2 : 0.5 0.6
IGS Results – dE With/Without Loads
10
• Load corrections have no impact on noise floor assessment– local site & non-load errors overwhelmingly dominate
A2 : 0.5 0.6
IGS Results – dU With/Without Loads
11
• Load corrections move results much closer to noise floor– but local site & non-load errors still dominate
A2 : 0.5 0.6
IGS Results – dU With/Without Loads
12
A2 : 0.5 0.6
• “Best” 2 stations in dU (WRMS = 2.2 mm) are:– LAGO (S. coast, Portugal) & GLPS (island, Pacific Ocean)
GLPSLAGO
IGS Results – dU With/Without Loads
13
LAGO (coast) GLPS (island)
dN & dE scatters (~1 mm) are not the “best” . . .
dU scatters have same WRMS but different characters
possibly related to weaknesses of IB assumption or load models
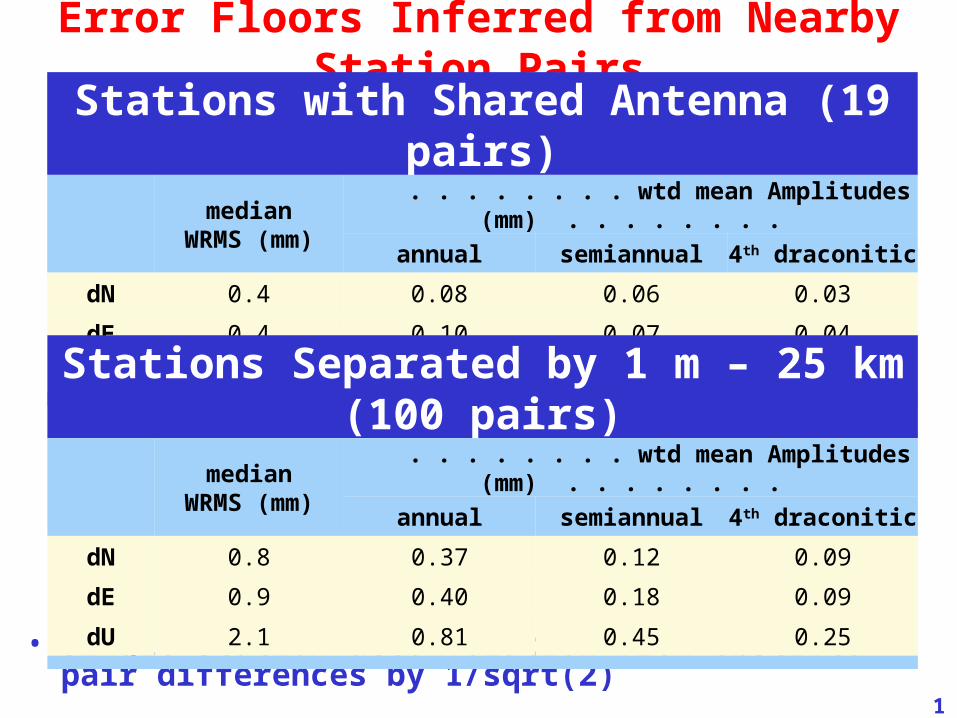
} estimates of electronic & thermal noise basementdE 0.4
dU 1.3
• Good agreement of short-baseline & global WRMSo estimates implies that orbit errors are not significant part of error floor
Stations Separated by 1 m – 25 km (100 pairs)median
WRMS (mm)
dN 0.8
} match prior global estimates of WRMSo error floor(0.65, 0.7, 2.2, respectively)
dE 0.9
dU 2.1
Decomposition of Weekly GPS Position Errors
16
IGS Error Budget for Weekly IntegrationsWRMSo (mm) median
Annual Amps (mm)median site
WRMSi (mm)
median total WRMS(mm)thermal
(via pairs)models + analysis total loads total
dN 0.4 0.5 0.65 0.45 0.9 1.0 1.4
dE 0.4 0.6 0.7 0.4 0.8 1.1 1.45
dU 1.3 1.7 2.2 2.4 3.6 2.9 4.6
• Infer site WRMSi2 using:
WRMSo2 + (A * AnnAmpi)2 + WRMSi
2 = WRMS2
where A2 = 0.6
• Noise floor WRMSo & local site errors WRMSi dominate over loads– esp for N & E components
• Non-load GPS annual errors are as large as annual load signals– unless load models missing ~half of total signal
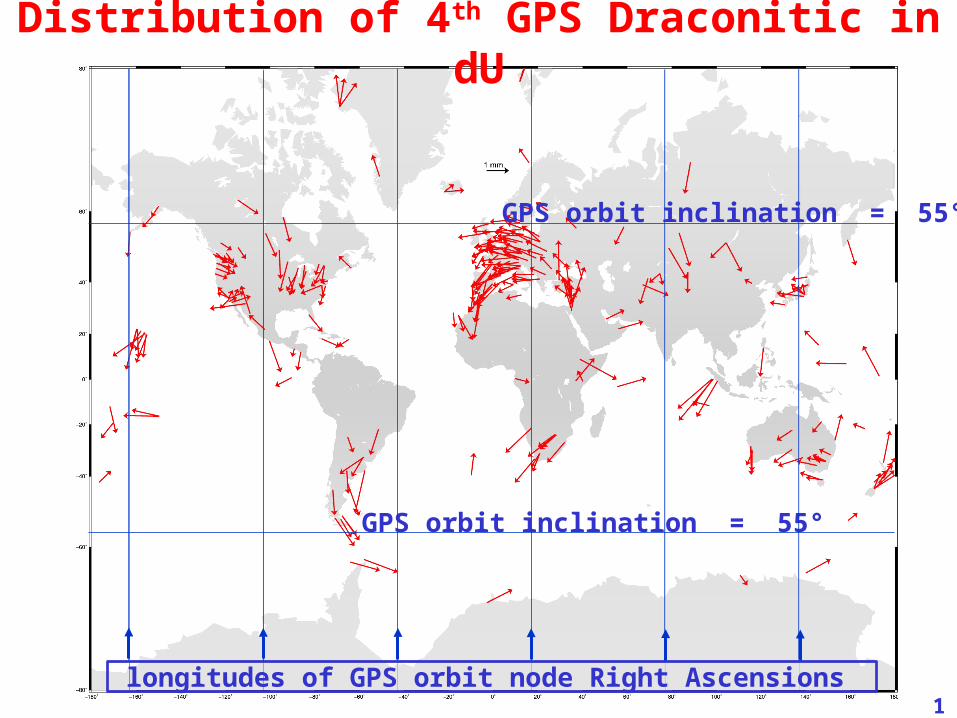
• Draconitic year = 351.2 d – or frequency = 1.04 cpy– fit (1.0 + 2.0 + 3.12 + 4.16) cpy – phases clockwise from N w.r.t. 2000.0– plot significant 4th harmonics
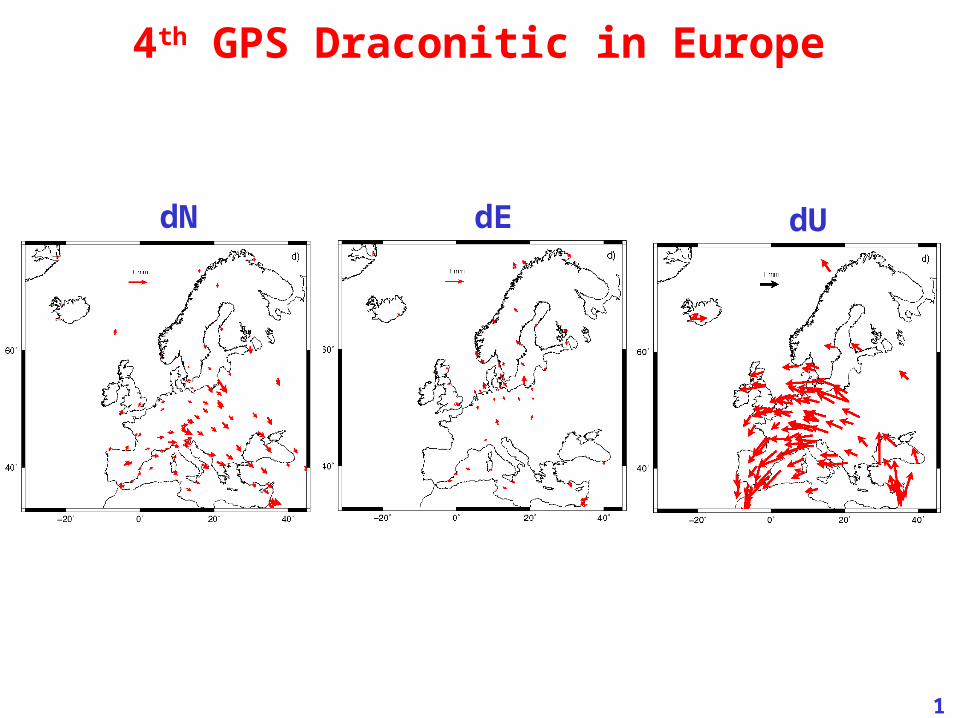
• Strong spatial correlations– very striking in most regions– also seen in dN distribution– esp coherent in Europe– even for tiny dE signals
• Implies orbit-related source– at least for most of effect– smaller local contributions also likely based on close pairs
Distribution of 4th GPS Draconitic in dU
17
Distribution of 4th GPS Draconitic in dU
18longitudes of GPS orbit node Right Ascensions
GPS orbit inclination = 55°
GPS orbit inclination = 55°
4th GPS Draconitic in Europe
19
dN dE dU
• Load corrections reduce WRMS & annual amps for most stations– but most residual variation remains, esp for dN & dE– implies load models are inaccurate &/or other sources of scatter/error
• Station weekly scatter can be decomposed into 3 categories: dN dE dU
global average floor WRMSo (mm) 0.65 0.7 2.2 median annual amp WRMS (mm) 0.7 0.6 2.8
(for A2 = 0.6; about half due to loads)median local site WRMSi (mm) 1.0 1.1 2.9 total WRMS (mm) 1.4 1.45 4.6
• Harmonics of GPS draconitic period are pervasive– strong spatial correlations imply a major orbit-related source (see
Griffiths & Ray, G54A-01, this afternoon)– but significant draconitics in close pair differences imply smaller local
contributions likely too– 1.04 cpy signal must contribute to observed annual variations but
magnitude is unknown
• Major non-load technique improvements still badly needed!