Beyond Google: I mproving Searchers’ Experience & Satisfaction Using their Behaviors and Contexts. Jingjing Liu [email protected] A talk at School of Information and Library Science University of North Carolina – Chapel Hill November 30, 2012. Outline. Background - PowerPoint PPT Presentation
Jingjing Liu [email protected]A talk at School of Information and Library Science University of North Carolina – Chapel Hill November 30, 2012 Beyond Google: Improving Searchers’ Experience & Satisfaction Using their Behaviors and Contexts
understand and make use of users’ behaviors and contexts, and provide desired search results or search assistanceo Personalization of search using behaviors
and context factorso Understanding and predicting search task
difficulty from behaviorsFuture directionsWrap up
Search enginesDo a decent job with simple and
unambiguous search tasksFor example:
where is the University of North Carolina at Chapel Hill?
Google search featureso Query automatic completiono Instant resultso Address right there in the search result snippieto Maps, pictureso …
other tasks which could be ambiguous, e.g., o “jaguar” by a kid looking for some fun pictures of the big animal
or o by a car buyer looking for information about the car make
5
Or…
6
Tasks could be complex or difficult, e.g., o Collect information about good renting
apartments in Chapel Hill, NCWhy is this not easy? Could be due to…
o Searchers’ lack of knowledge about the neighborhood
o Not a single webpage available to complete this task
o Analysis need(s) to be done, and decision(s) needs to be made
o …
The problem
7
Traditional search systems return results based almost only on search queries by keywords matching
Little consideration on who, when, where, and why (for what purposes), or the searcher’s task at hand
Current search engines have started to incorporate some of these factors into search algorithms, e.g.,o location detectiono search historyo peer use…
But there are more that needs to be done
Two approaches
8
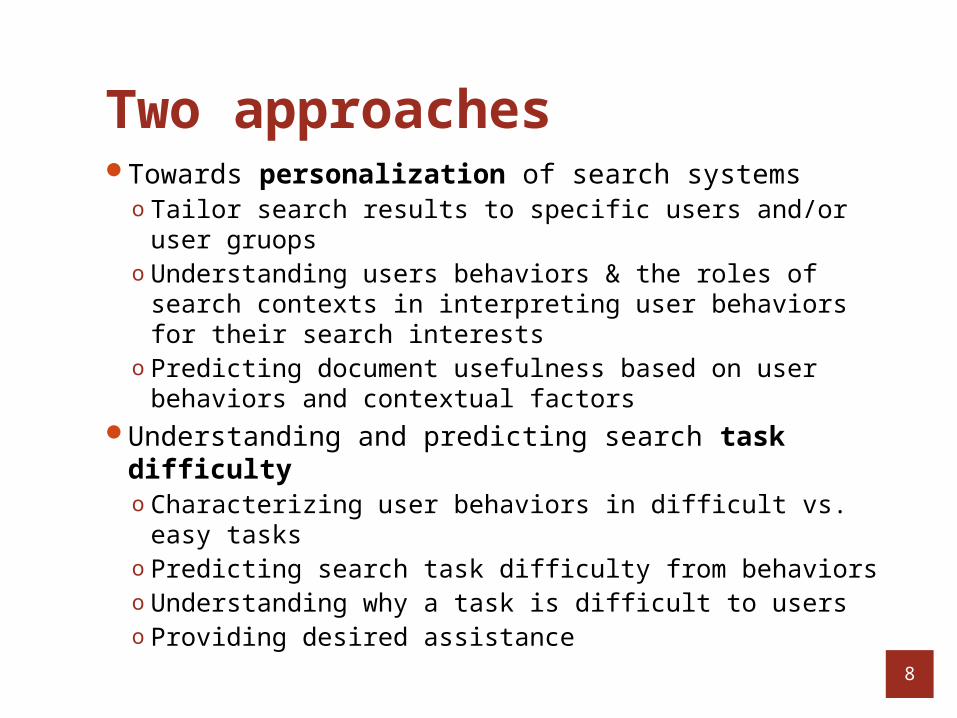
Towards personalization of search systemso Tailor search results to specific users and/or user
gruopso Understanding users behaviors & the roles of search
contexts in interpreting user behaviors for their search interests
o Predicting document usefulness based on user behaviors and contextual factors
Understanding and predicting search task difficultyo Characterizing user behaviors in difficult vs. easy taskso Predicting search task difficulty from behaviorso Understanding why a task is difficult to userso Providing desired assistance
9
Approach 1:
Towards Personalization of Search:
Understanding the Roles of ContextsRelated publications:
Liu, J. & Belkin, N. J. (journal article in process). Exploring the roles of contextual factors in personalizing information search.
Liu, J. & Belkin, N. J. (2010). Personalizing information retrieval for multi-session tasks: The roles of task stage and task type. SIGIR ’10.
Liu, J. & Belkin, N. J. (2010). Personalizing information retrieval for people with different levels of topic knowledge. JCDL ’10.
Rationale
10
Tailoring search toward specific users or user groups to improve users’ search experience and satisfaction
Further understanding of users & their contextso preferences & interests: what information is
desired and useful?o a person's individual characteristics:
Logging software Morae:mousekeyboardtime stamps of each action eventscreen video
Data analysis
cannot reliably predict(Behavioral data)
Reading time
Document
usefulness
(Contextual factors)
(User interest)
23
Task stage
Data analysis methodGeneral Linear Model
Time = αusefulness + βstage + γusefulness*stage
Examination of the relationship among three variables1. time:
first reading time on a page (revisiting not counted)total reading time on a page (revisiting counted)
2. usefulness: 7-point ratings 3 levels: little, somewhat, very useful
3. stage: 1, 2, 3Analysis conducted in
o both tasks combinedo dependent tasko parallel task
24
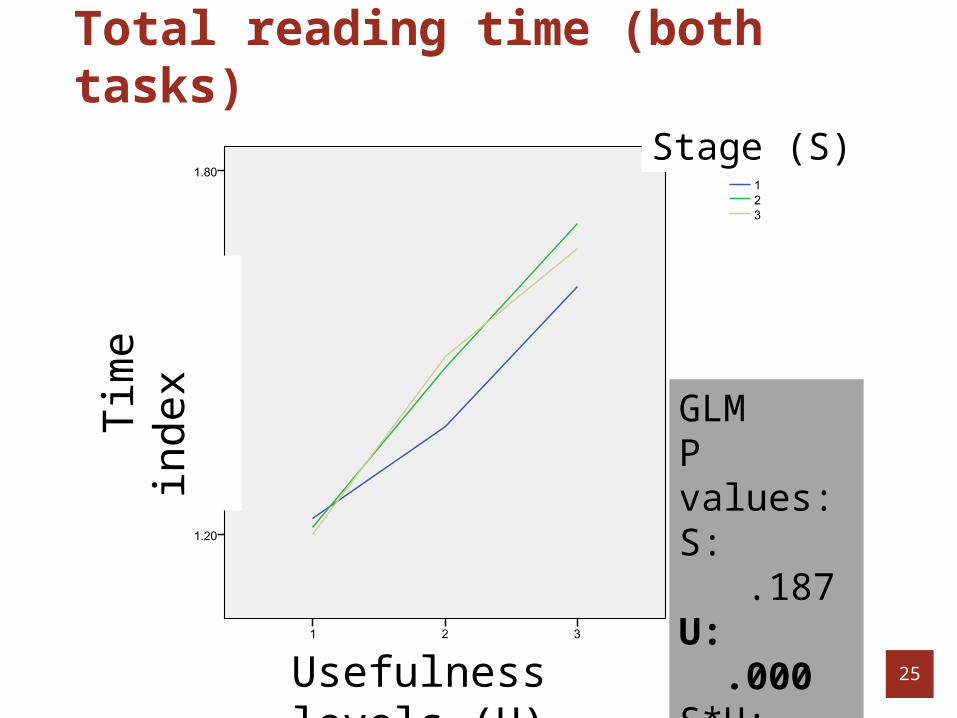
Total reading time (both tasks)
25
GLM P values:S: .187U: .000S*U: .514
Tim
e in
dex
Usefulness levels (U)
Stage (S)
Total reading time (dependent task)
GLM P values:S: .276U: .000S*U: .507
Tim
e in
dex
Usefulness levels (U)
Stage (S)
26
Total reading time (parallel task)
GLM P values:S: .621U: .000S*U: .791
Tim
e in
dex
Usefulness levels (U)
Stage (S)
27
Summary of these findings
28
Strong correlation between usefulness and timeo Possible reason: writing reports in parallel with
searching and reading informationo Implications: this time alone can be a reliable
indicator of usefulnessNo significant difference among different stages
o Stage did not play a roleNo differences between task types
o Task type did not play a roleHowever, total reading time cannot be easily
obtain by system in real-time
First reading time (both tasks)
29
GLM P values:S: .722U: .116S*U: .006
29
Tim
e in
dex
Usefulness levels (U)
Stage (S)1
3
2
Summary: both tasks combined
30
Usefulness and first reading time did not have significant correlationo First reading time only is not a reliable indicator
of usefulnessStage and usefulness had significant
interaction on time.o Stage played a role
30
First reading time (parallel task)
31 31
Tim
e in
dex
Usefulness levels (U)
Stage (S)
GLMP values:S: .639U: .869S*U: .043
1
2
3
Summary: parallel task task
32
Usefulness and first reading time did not have significant correlationo First reading time only is not a reliable
indicator of usefulnessStage and usefulness had significant
interaction on timeo Possible explanation: subtask differences
were only car type; users in later sessions could have obtained some knowledge about what kinds of pages were useful
32
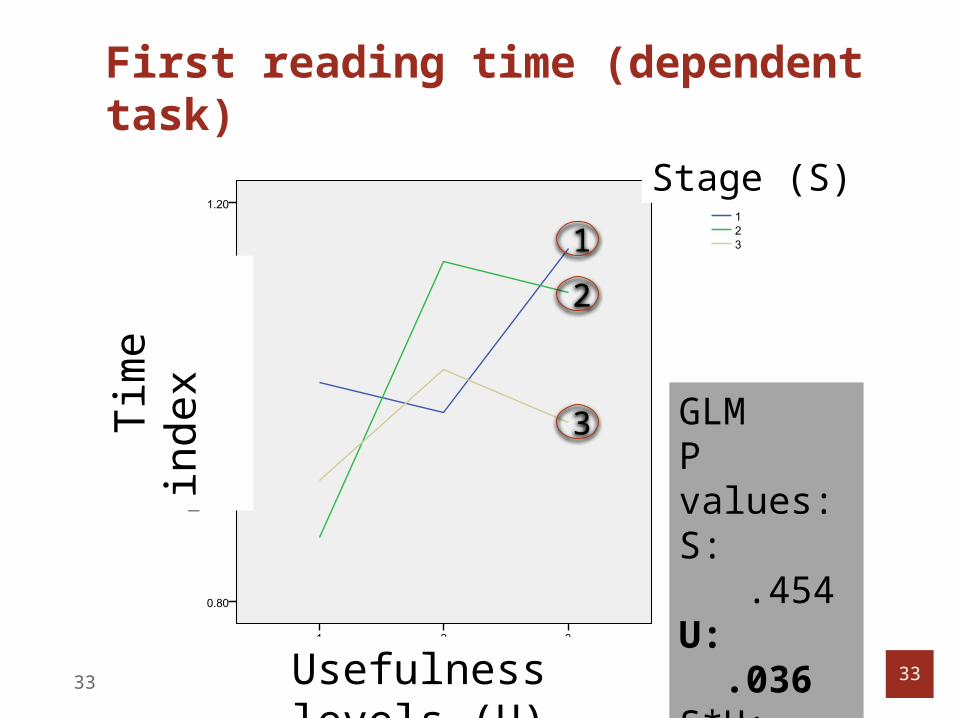
First reading time (dependent task)
33 33
Tim
e in
dex
Usefulness levels (U)
Stage (S)
GLMP values:S: .454U: .036S*U: .180
1
2
3
Summary: dependent task
34
Usefulness and first reading time have significant correlationo First dwell time only could reliably indicate
usefulnessStage and usefulness did not have
significant interaction on time.o Stage did not play a roleo Possible explanation: sub-tasks are
independent upon each other; users’ knowledge did not increase for each of them
34
Summary of findings for reading time
35
First reading time (which can be easily captured by the system) cannot always be a reliable indicator of usefulness on its own
Stage could helpTask type matters
The factor of user knowledge
36
In addition to task stage, we also looked at users’ knowledge as a contextual factor
Similar patterns as the stage factor When knowledge and stage both
considered, knowledge plays a more significant role
However, stage is more easily determined in practice
Significance of the study
37
Found that contexts do matter in inferring document usefulness from behaviorso Task stageo Task typeo User knowledge
Created a method to explore the effects of contextual factors through lab experiments
Has implications on search system design o Taking account of task stage, user knowledge,
and task type could help infer users’ interests and accordingly tailor search results to specific searchers
Limitationso Lab experimento Effect size
Future studieso Other contextual factors: other task type, etc.o Other behaviors than dwell time: clickthrough,
revisit, etc.o Naturalistic studyo Build models of usefulness prediction based
on behaviors and contextual factorso Prototype building and evaluation
Limitations & follow up studies
38
39
Approach 2:
Understanding and Predicting Search Task Difficulty
Related publications:Liu, J. & Kim, C. (2012). Search tasks: Why do people feel them difficult? HCIR 2012.Liu, J., Liu, C., Cole, M., Belkin, N. J., & Zhang, X. (2012). Examining and predicting search task difficulty. CIKM 2012. Liu, J., Liu, C., Yuan, X., & Belkin, N. J. (2011). Understanding searchers’ perception of task difficulty: Relationships with task type. ASIS&T 2011.Liu, J., Gwizdka, J., Liu, C., & Belkin, N. J. (2010). Predicting task difficulty in different task types. ASIS&T 2010. Liu, J., Liu, C., Gwizdka, J., & Belkin, N. J. (2010). Can search systems detect users’ task difficulty? Some behavioral signals. SIGIR 2010.
Rationale
40
Search systems needs to be improved for better performance in “difficult” search tasks
It is important for the system to detect when users are having “difficult” tasks
Whether and when to intervene and/or provide assistance
Prevent users from getting frustrated or switching to other search engines (from individual search engine’s perspective)
Task difficulty & search behaviors
41
Previous studies found more difficulty tasks are associated with users
visiting more webpages (Kim 06; Gwizdka & Spence 06)
issuing more queries (Kim 06; Aula et al., 10)spending more time on Search Engine
Result Pages (SERPs) (Aula et al., 10)
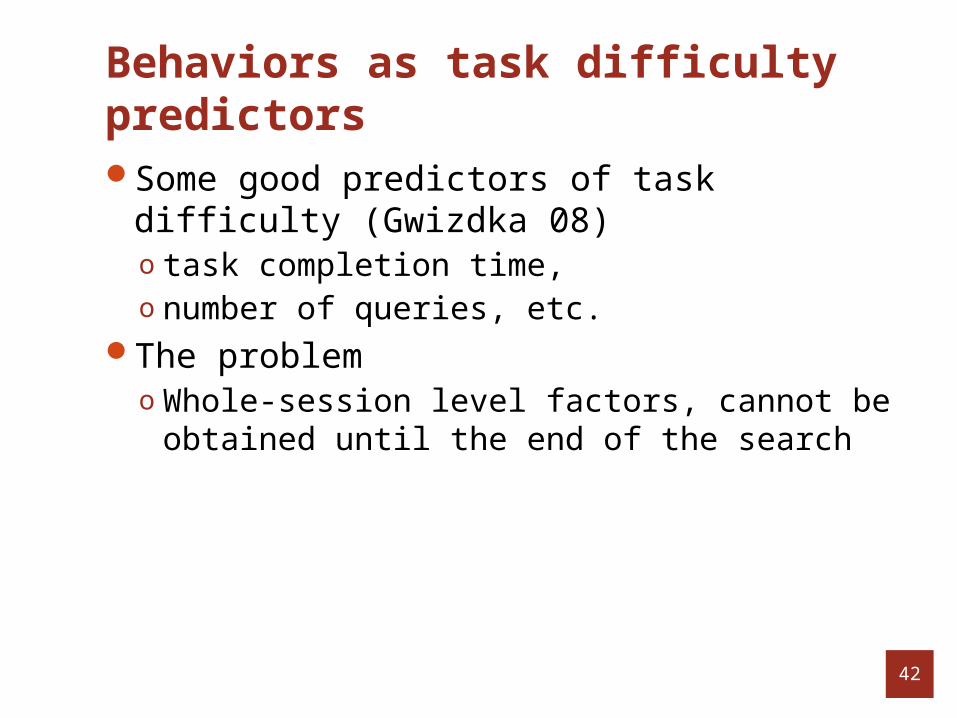
Behaviors as task difficulty predictors
42
Some good predictors of task difficulty (Gwizdka 08)o task completion time, o number of queries, etc.
The problemo Whole-session level factors, cannot be
obtained until the end of the search
Levels of user behaviors
43
Whole-task-session levelo e.g., task completion time, total number of
queries, total number of webpage visitso cannot be captured until the end of a session,
therefore, not good for real-time system adaptation
Within-task-session levelo e.g., dwell (reading) time, number of content
pages viewed per queryo can be captured in real-time
The current study
44
Revisits relations between task difficulty and user behaviors
Explores what behaviors are significant in predicting task difficultyo Especially within-session behaviors
Methodology
45
Controlled lab experiment48 student participantso Find useful webpages and save (bookmark &
tag) themSearch tasks o 12-task pool: 6 pairso Each participant worked with 6 out of 12, at
the choice of their preferences in 6 pairs of questions
o 3 typesFF-S: fact finding – single item FF-M: fact finding – multiple items IG-M: information gathering – multiple items
o Task type showed effects on user behaviors, but the current presentation does not focus on this
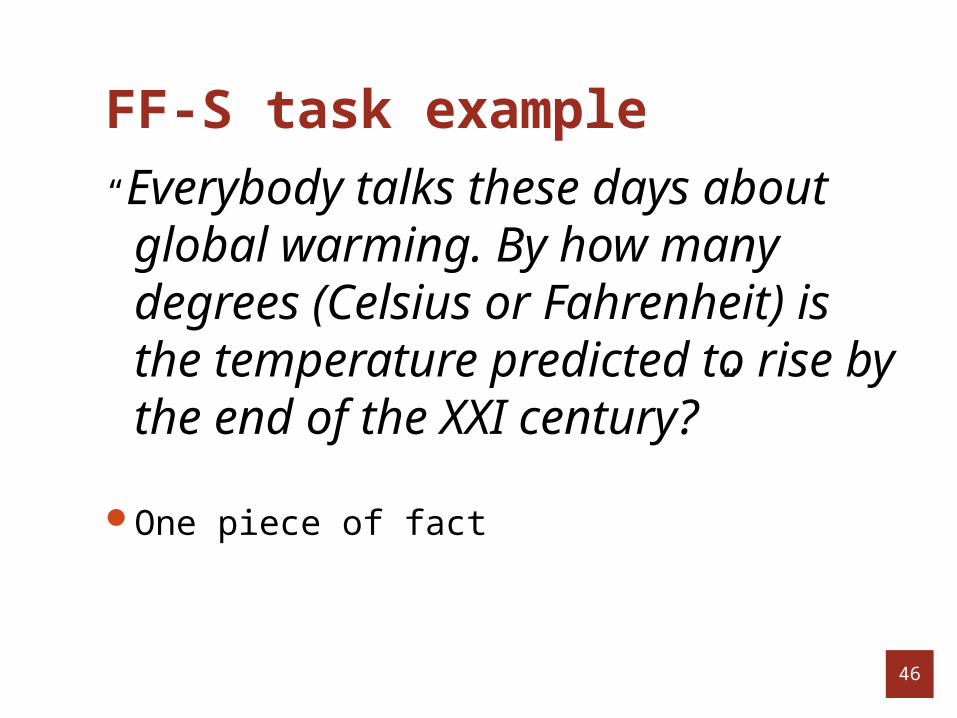
FF-S task example
46
“Everybody talks these days about global warming. By how many degrees (Celsius or Fahrenheit) is the temperature predicted to rise by the end of the XXI century?”
One piece of fact
FF-M task example
47
“A friend has just sent an email from an Internet café in the southern USA where she is on a hiking trip. She tells you that she has just stepped into an anthill of small red ants and has a large number of painful bites on her leg. She wants to know what species of ants they are likely to be, how dangerous they are and what she can do about the bites. What will you tell her?”
3 pieces of facts
IG-M task example
48
“You recently heard about the book "Fast Food Nation," and it has really influenced the way you think about your diet. You note in particular the amount and types of food additives contained in the things that you eat every day. Now you want to understand which food additives pose a risk to your physical health, and are likely to be listed on grocery store labels.”
Information gathering of 2 concepts
Data collection
49
Post-task questionnaires o Ratings of task difficulty, etc.o 5 point binary (rating scores 1-3; 4-5)
Morae logging softwareo Mouseo Keyboardo Webpageso Time stamp of each activityo Screen video
Whole-session level behaviors
50
Pages visitedo Number of content pages (all, unique)o Number of SERPs (all, unique)
Querieso Number of all queries issuedo Queries leading to saving pages (number,
ratio)o Queries not leading to saving pages (number,
ratio)Time
o Task completion timeo Total time on content pageso Total time on SERPs
Results: whole-session behaviors in difficult vs. easy tasks
51
p=.276
p=.000
p=.000
p=.000
p=.000p=.000
p=.000p=.000p=.000p=.000p=.000p=.000
Within-session level behaviors
52
Timeo First dwell (reading) time (content pages,
SERPs)o Mean dwell (reading) time (content pages,
SERPs)Number of pages per query (all, unique)
Within-session behaviors in difficult vs. easy tasks
53
p=.778 p=.386
p=.217 p=.660
p=.000 p=.000
Prediction models in general
54
Logistic regression (forward conditional method)o Good for binary data predictiono Automatically select significant variables in
the modelTwo models
o Whole-session level behaviorsBoth whole-session level and within-task-session
levels variables consideredOnly whole-session level variables considered
o Within-session level behaviorsOnly within-session level variables considered
Whole-session level model
55
Variables
Number of unique SERPs
Number of queries with saving pages
Total dwell time on
unique SERPs
p value
.000 .013 .008
B value
-.434 .381 -.023Log(p/1-p) = c - .434*number of unique SERPs
+ .381*number of queries with saving pages
- .023*total dwell time on unique SERPs
(p: the probability of a task being difficult)
Whole-session level model accuracy
56
Predicted
Difficult Easy
Observed Difficult 54 46
Easy 20 168
Prediction accuracy 77.1%
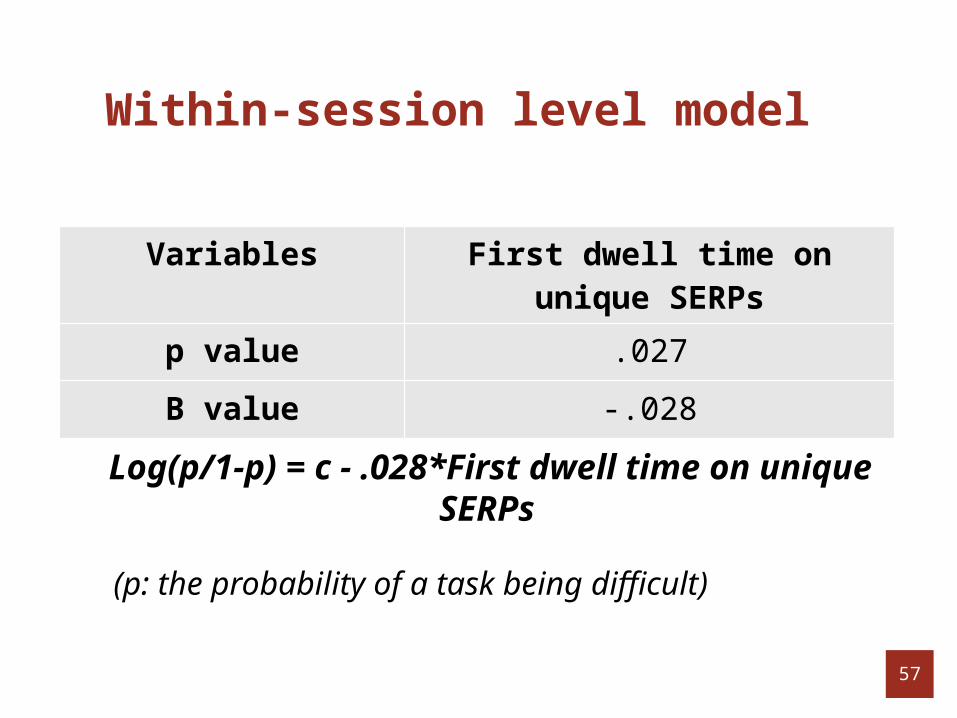
Within-session level model
57
Variables First dwell time on unique SERPs
p value .027
B value -.028
Log(p/1-p) = c - .028*First dwell time on unique SERPs
(p: the probability of a task being difficult)
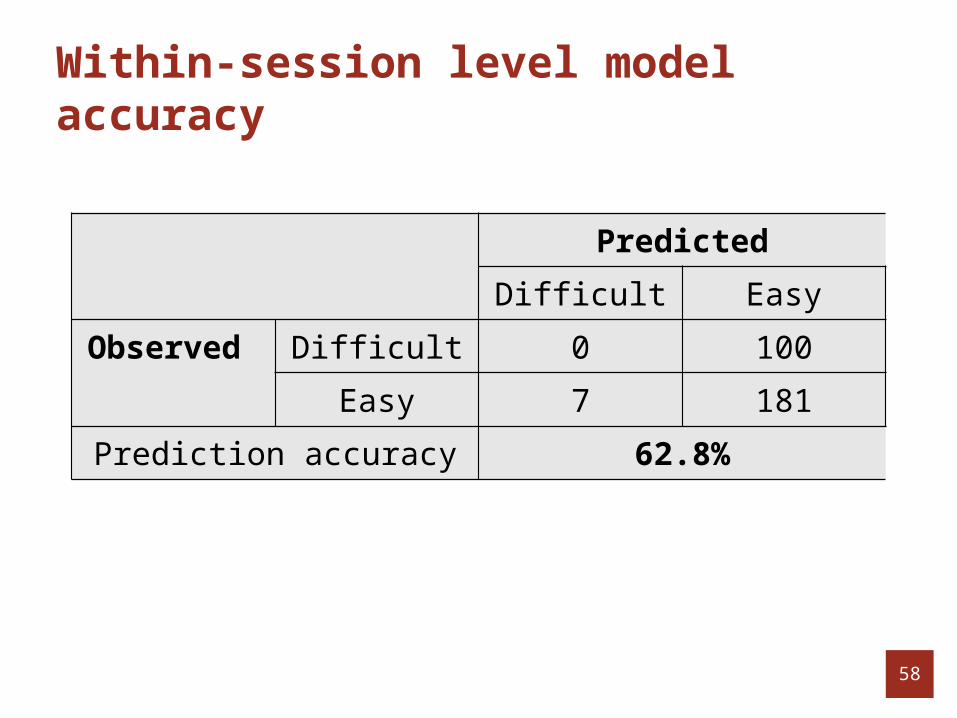
Within-session level model accuracy
58
Predicted
Difficult Easy
Observed Difficult 0 100
Easy 7 181
Prediction accuracy 62.8%
Summary
59
Whole-session level indicators showed higher prediction accuracybut they cannot be obtained real-time for ongoing
sessionsWithin-session level indicators
o can be used for ongoing sessionso but more behaviors need to be identified to
improve overall prediction accuracy
A further studyControlled lab experiment using a system built
with TREC 2004 Genomics track collectiono documents from 2000-2004 (n=1.85 million)
38 medical/health related major studentso Undergraduate to postdocs (treat as graduates)
Tasks: TREC 2004 Genomics track topic poolo A pool of 5 topics, selected by their difficulty (using
topic title as query in our system)o 4 topics each participants
Questionnaireso Elicited task difficulty ratings, etc.
Liu, J., Liu, C., Cole, M., Belkin, N. J., & Zhang, X. (2012). Examining and predicting search task difficulty. CIKM 2012.
More behavioral variables
61
First round (8 variables)o Variables captured in the first query roundo E.g., first query length, first dwell time on first SERP,
first dwell time on first viewed document…
Accumulated level (16 variables)o Captured during the search processo E.g., mean dwell time of all documents, average rank
of viewed docs, average query length…
Whole session level (21 variables)o Captured by the end of the search sessiono E.g., task completion time, total number of pages, total
Findings summaryUser behavior differences were found in in easy
and difficult tasks at all 3 levelsThe real-time prediction model (FA) had fairly
good performance (accuracy 83%; precision 88%)Using a limited number of significant factors
in the model (FA_FC) had comparable performance (accuracy 79%; precision 88%)
Some significant behavioral predictors of task difficulty can be captured early in the search process
66
Other Research on Task Difficulty
Task difficulty and task type
67
Liu et al., ASIS&T 2011: Understanding searchers’ perception of task difficulty: Relationships with task typeo Post- vs. pre-task difficulty: increase, no
change, decreaseo Users’ background factors do not usually
related to the changeo Task type matters
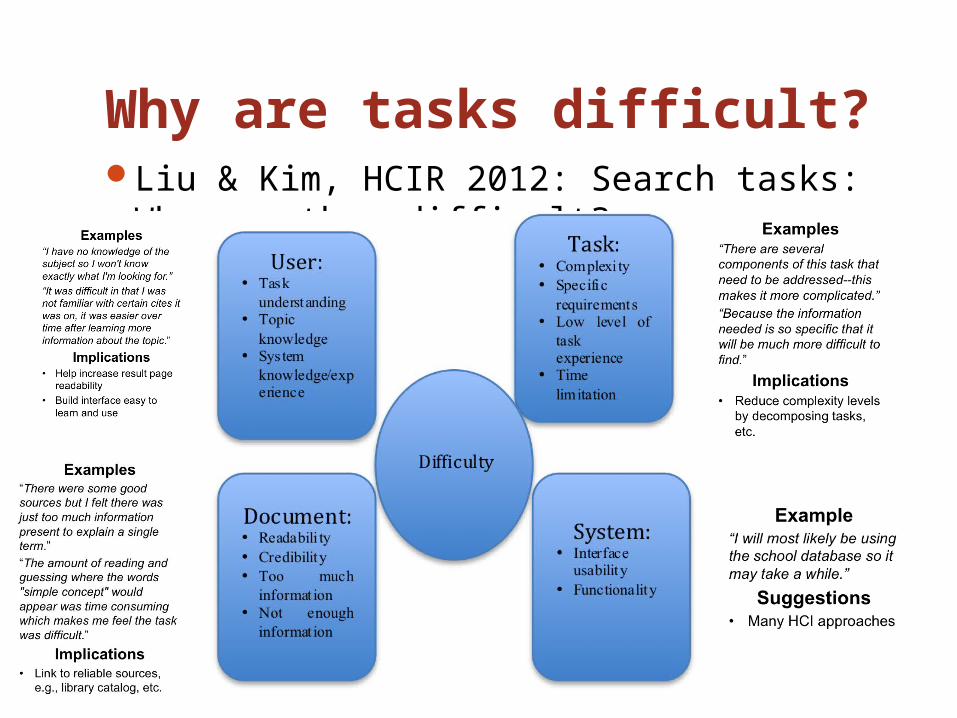
Why are tasks difficult?
68
Liu & Kim, HCIR 2012: Search tasks: Why are they difficult?
Future research directions
69
Continue with the ongoing project about understanding task difficulty
Propose and validate a task difficulty taxonomy
Explore and test ways of helping with different types of difficult tasks/difficulties
Aula, A., Khan, R. & Guan, Z. (2010). How does search behavior change as search becomes more difficult? Proceedings of CHI '10, 35-44.
Donato, D., Bonchi, F., Chi, T., & Maarek, Y. (2010). Do you want to take notes? Identifying research missions in Yahoo! Search Pad. In Proceedings of WWW 2010.
Gwizdka, J., Spence, I. (2006). What can searching behavior tell us about the difficulty of information tasks? A study of Web navigation. ASIST '06.
Kim, J. (2006). Task difficulty as a predictor and indicator of web searching interaction. CHI '06, 959-964.
Lin, S.-J. (2001). Modeling and Supporting Multiple Information Seeking Episodes over the Web. Unpublished dissertation. Rutgers University.


![arXiv:1909.11740v2 [cs.CV] 23 Apr 2020 · Faisal Ahmed, Zhe Gan, Yu Cheng, and Jingjing Liu Microsoft Dynamics 365 AI Research fyen-chun.chen,lindsey.li,licheng.yu,ahmed.elkholy,fiahmed,](https://static.documents.pub/doc/80x56/5f07952c7e708231d41db495/arxiv190911740v2-cscv-23-apr-2020-faisal-ahmed-zhe-gan-yu-cheng-and-jingjing.jpg)


![Quantization for Energy Efficient Convolutional Neural ...sc16.supercomputing.org/sc-archive/src_poster/... · Oxford University Press, 2006. [4] Y. Gong, L. Liu, M. Yang, and L.](https://static.documents.pub/doc/80x56/5ec4a4711d09796673191372/quantization-for-energy-efficient-convolutional-neural-sc16-oxford-university.jpg)


