19
JK LAKSHMI CEMENT LTD. SIROHI, RAJASTHAN-307019
JK LAKSHMI CEMENT LTD.SIROHI, RAJASTHAN-307019
PLANT YEAR OFCOMMISSIONING
INSTALLED CAPACITY(TPD)
PRESENT STATUS(TPD)
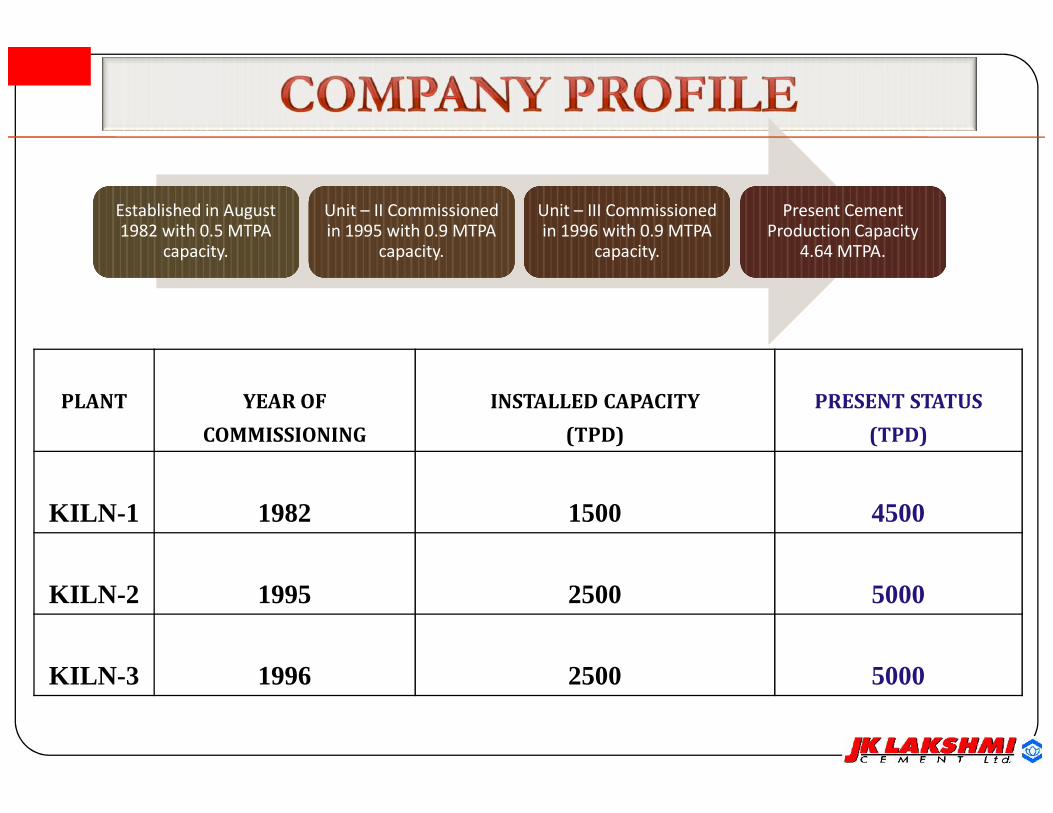
Established in August1982 with 0.5 MTPA
capacity.
Established in August1982 with 0.5 MTPA
capacity.
Unit – II Commissionedin 1995 with 0.9 MTPA
capacity.
Unit – II Commissionedin 1995 with 0.9 MTPA
capacity.
Unit – III Commissionedin 1996 with 0.9 MTPA
capacity.
Unit – III Commissionedin 1996 with 0.9 MTPA
capacity.
Present CementProduction Capacity
4.64 MTPA.
Present CementProduction Capacity
4.64 MTPA.
PLANT YEAR OFCOMMISSIONING
INSTALLED CAPACITY(TPD)
PRESENT STATUS(TPD)
KILN-1 1982 1500 4500
KILN-2 1995 2500 5000
KILN-3 1996 2500 5000
75.00
76.00
77.00
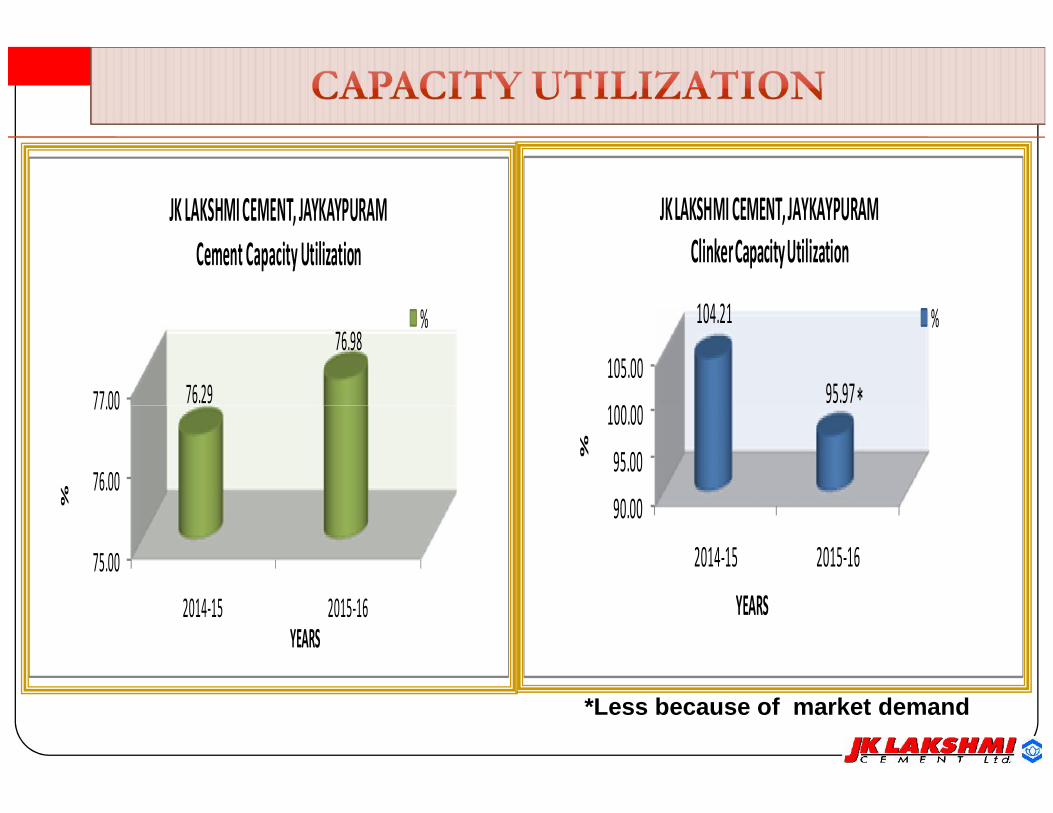
2014-15 2015-16
76.29
76.98
%
YEARS
JK LAKSHMI CEMENT, JAYKAYPURAMCement Capacity Utilization
%
90.0095.00
100.00105.00
2014-15 2015-16
104.21
95.97
%
YEARS
JK LAKSHMI CEMENT, JAYKAYPURAMClinker Capacity Utilization
%
*
*Less because of market demand
75.00
76.00
77.00
2014-15 2015-16
76.29
76.98
%
YEARS
JK LAKSHMI CEMENT, JAYKAYPURAMCement Capacity Utilization
%
90.0095.00
100.00105.00
2014-15 2015-16
104.21
95.97
%
YEARS
JK LAKSHMI CEMENT, JAYKAYPURAMClinker Capacity Utilization
%
*
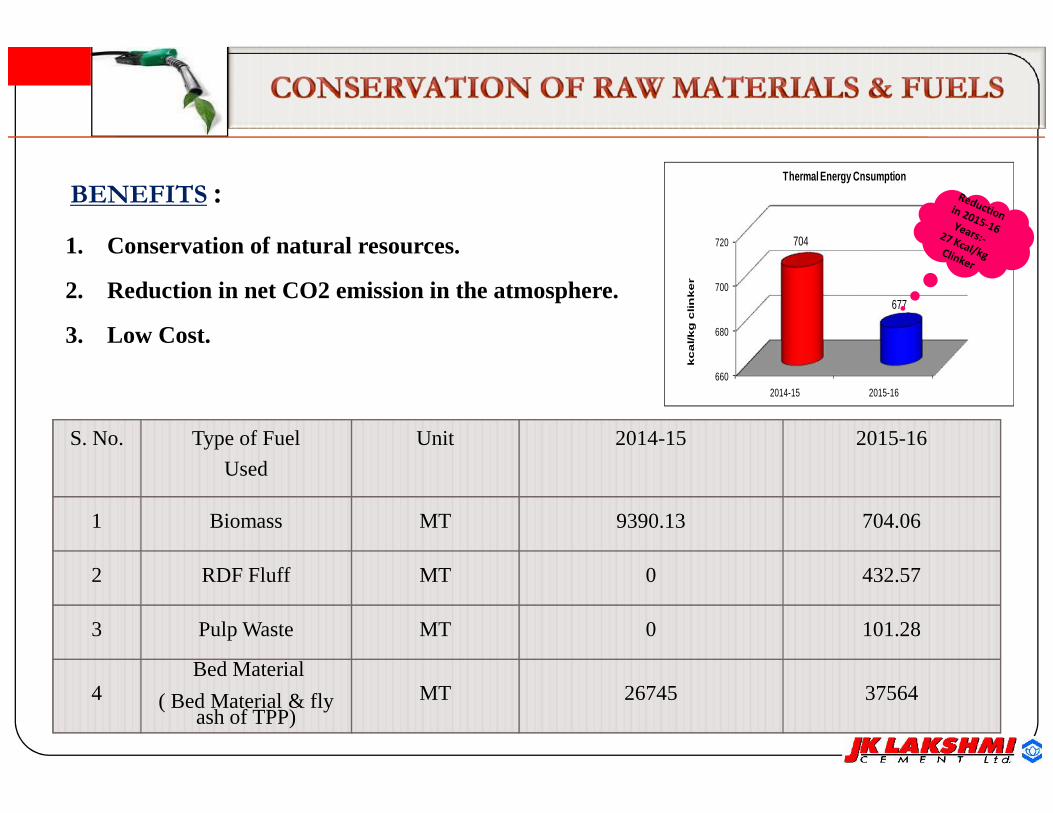
BENEFITS :1. Conservation of natural resources.
2. Reduction in net CO2 emission in the atmosphere.
3. Low Cost.
660
680
700
720
2014-15 2015-16
704
677
kc
al/k
g c
lin
ke
r
Thermal Energy Cnsumption
**- Less due to Unavailability of Biomass
S. No. Type of Fuel
Used
Unit 2014-15 2015-16
1 Biomass MT 9390.13 704.06
2 RDF Fluff MT 0 432.57
3 Pulp Waste MT 0 101.28
4Bed Material
( Bed Material & flyash of TPP)
MT 26745 37564
660
680
700
720
2014-15 2015-16
704
677
kc
al/k
g c
lin
ke
r
Thermal Energy Cnsumption
70.0075.0080.0085.0090.0095.00
2014-15 2015-16
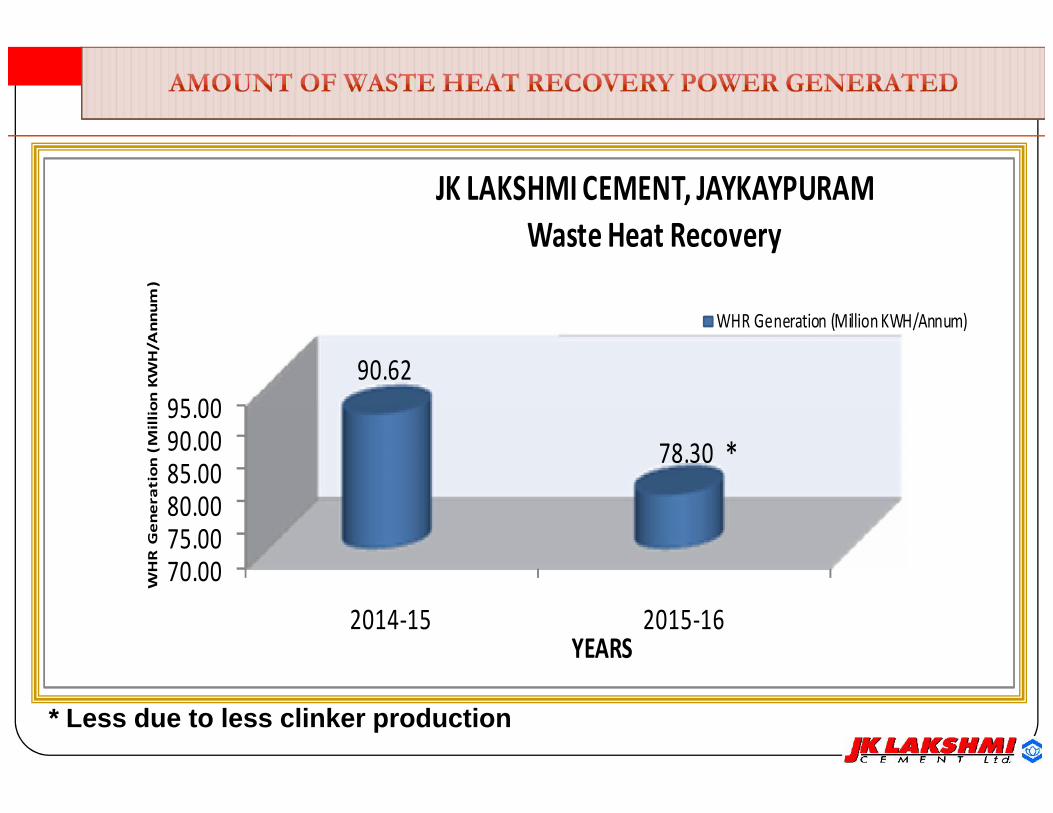
90.62
78.30
WH
R G
en
era
tio
n (
Mil
lio
n K
WH
/An
nu
m)
YEARS
JK LAKSHMI CEMENT, JAYKAYPURAMWaste Heat Recovery
WHR Generation (Million KWH/Annum)
*
70.0075.0080.0085.0090.0095.00
2014-15 2015-16
90.62
78.30
WH
R G
en
era
tio
n (
Mil
lio
n K
WH
/An
nu
m)
YEARS
JK LAKSHMI CEMENT, JAYKAYPURAMWaste Heat Recovery
WHR Generation (Million KWH/Annum)
*
* Less due to less clinker production
These are various platforms that are being for implementing best practices
UDDAN COMPETITION FOR ENCOURAGING INNOVATIVE IDEAS
ENGINEERING CONFERENCE ACROSS GROUP COMPANY FOR SHARING OF BEST PRACICES
COMPARASION WITH NATIONAL AND INTERNATIONAL BENCHMARKING
PARTICIPATION IN NATIONAL & INTERNATIONAL SEMINAR
CROSS FUNCTIONAL TEAM(CFT)
KAIZEN ACTIVITY
QUALITY CIRCLE(QC)
QUALITY IMPROVEMENT TEAM(QIT)
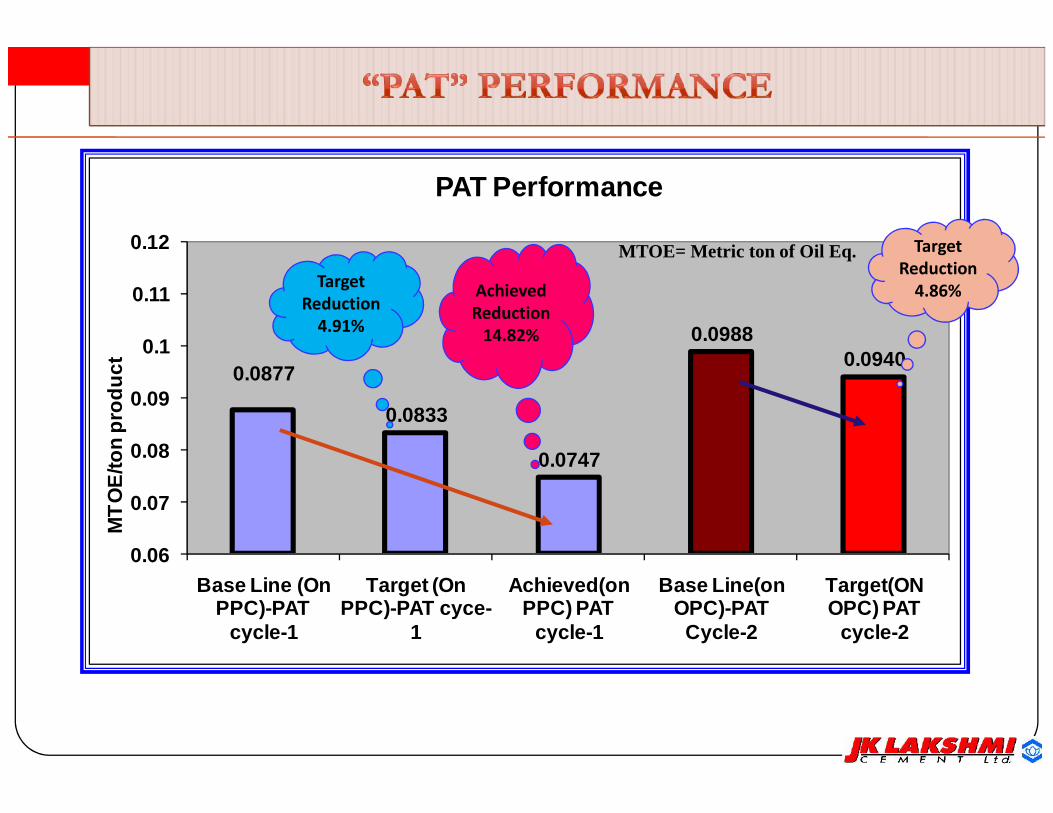
0.0877
0.0833
0.0747
0.09880.0940
0.06
0.07
0.08
0.09
0.1
0.11
0.12
Base Line (OnPPC)-PAT
cycle-1
Target (OnPPC)-PAT cyce-
1
Achieved(onPPC) PAT
cycle-1
Base Line(onOPC)-PAT
Cycle-2
Target(ONOPC) PAT
cycle-2
MTO
E/to
n pr
oduc
t
PAT Performance
MTOE= Metric ton of Oil Eq.
TargetReduction
4.91%
AchievedReduction
14.82%
TargetReduction
4.86%
0.0877
0.0833
0.0747
0.09880.0940
0.06
0.07
0.08
0.09
0.1
0.11
0.12
Base Line (OnPPC)-PAT
cycle-1
Target (OnPPC)-PAT cyce-
1
Achieved(onPPC) PAT
cycle-1
Base Line(onOPC)-PAT
Cycle-2
Target(ONOPC) PAT
cycle-2
MTO
E/to
n pr
oduc
t
PAT Performance
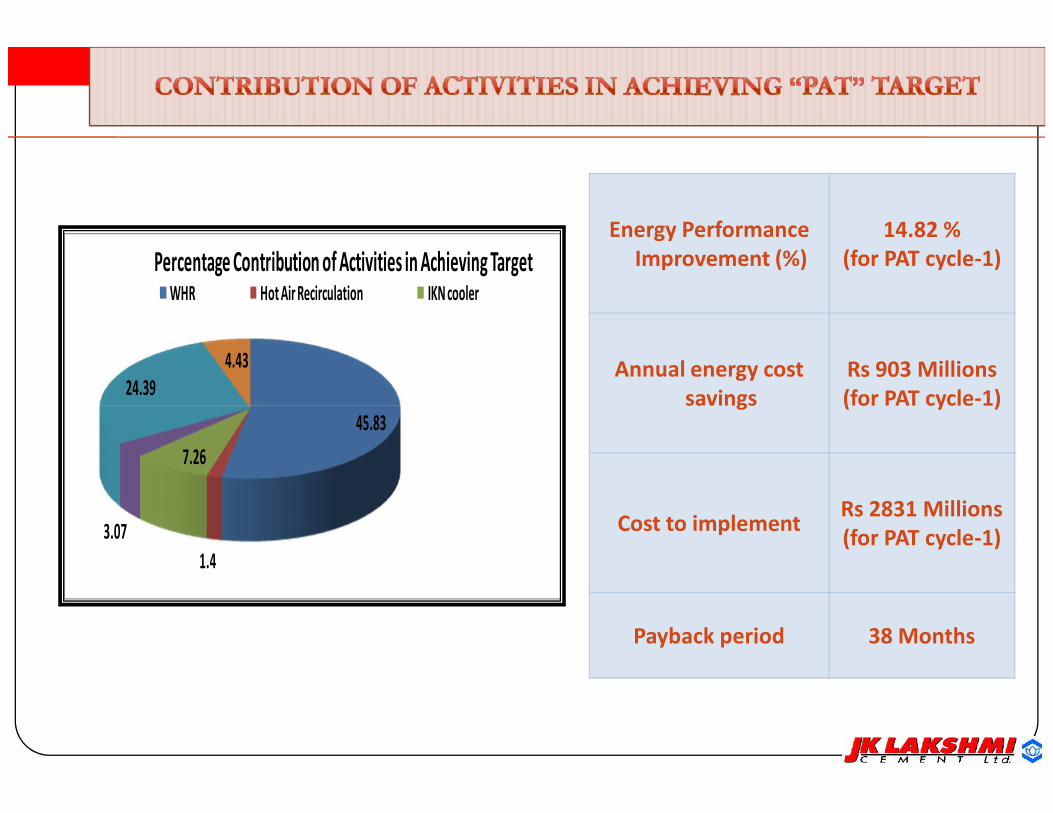
45.83
1.4
7.26
3.07
24.394.43
Percentage Contribution of Activities in Achieving TargetWHR Hot Air Recirculation IKN cooler
Energy PerformanceImprovement (%)
14.82 %(for PAT cycle-1)
Annual energy costsavings
Rs 903 Millions(for PAT cycle-1)
45.83
1.4
7.26
3.07
24.394.43
Percentage Contribution of Activities in Achieving TargetWHR Hot Air Recirculation IKN cooler
Annual energy costsavings
Rs 903 Millions(for PAT cycle-1)
Cost to implement Rs 2831 Millions(for PAT cycle-1)
Payback period 38 Months
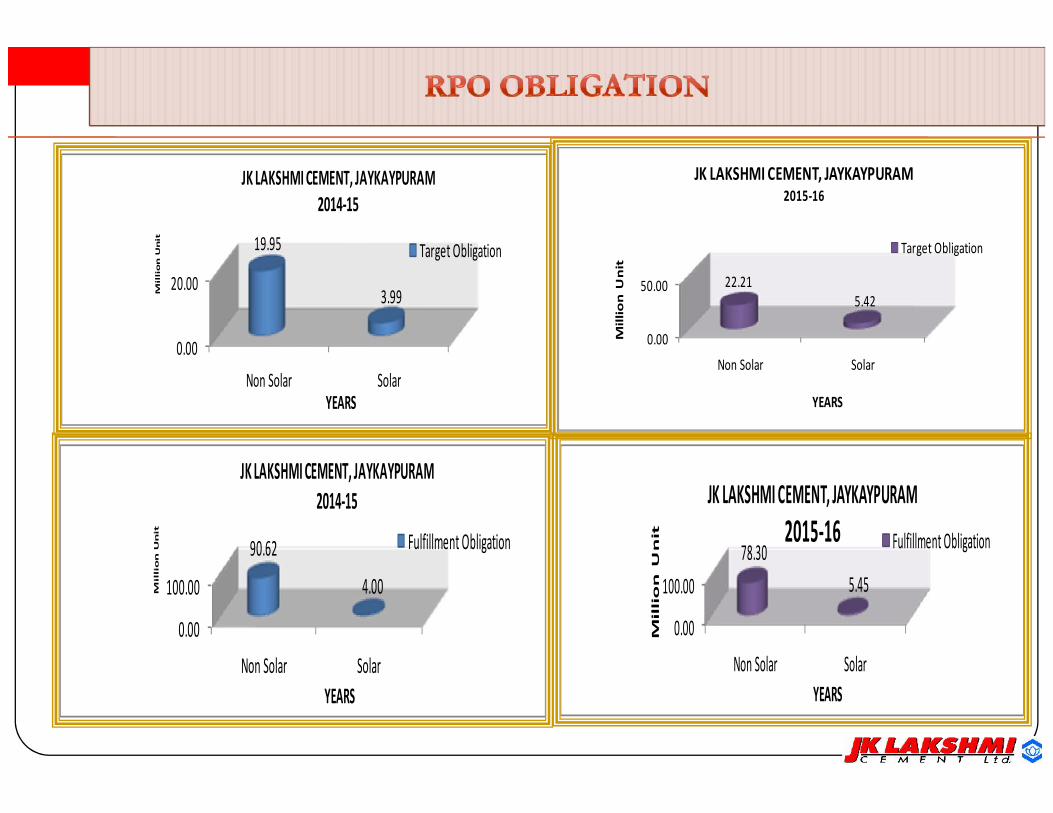
0.00
20.00
Non Solar Solar
19.95
3.99Mil
lio
n U
nit
YEARS
JK LAKSHMI CEMENT, JAYKAYPURAM2014-15
Target Obligation
0.00
50.00
Non Solar Solar
22.215.42
Mil
lio
n U
nit
YEARS
JK LAKSHMI CEMENT, JAYKAYPURAM2015-16
Target Obligation
0.00
20.00
Non Solar Solar
19.95
3.99Mil
lio
n U
nit
YEARS
JK LAKSHMI CEMENT, JAYKAYPURAM2014-15
Target Obligation
0.00
100.00
Non Solar Solar
90.62
4.00Mil
lio
n U
nit
YEARS
JK LAKSHMI CEMENT, JAYKAYPURAM2014-15
Fulfillment Obligation
0.00
50.00
Non Solar Solar
22.215.42
Mil
lio
n U
nit
YEARS
JK LAKSHMI CEMENT, JAYKAYPURAM2015-16
Target Obligation
0.00
100.00
Non Solar Solar
78.305.45
Mil
lio
n U
nit
YEARS
JK LAKSHMI CEMENT, JAYKAYPURAM2015-16 Fulfillment Obligation
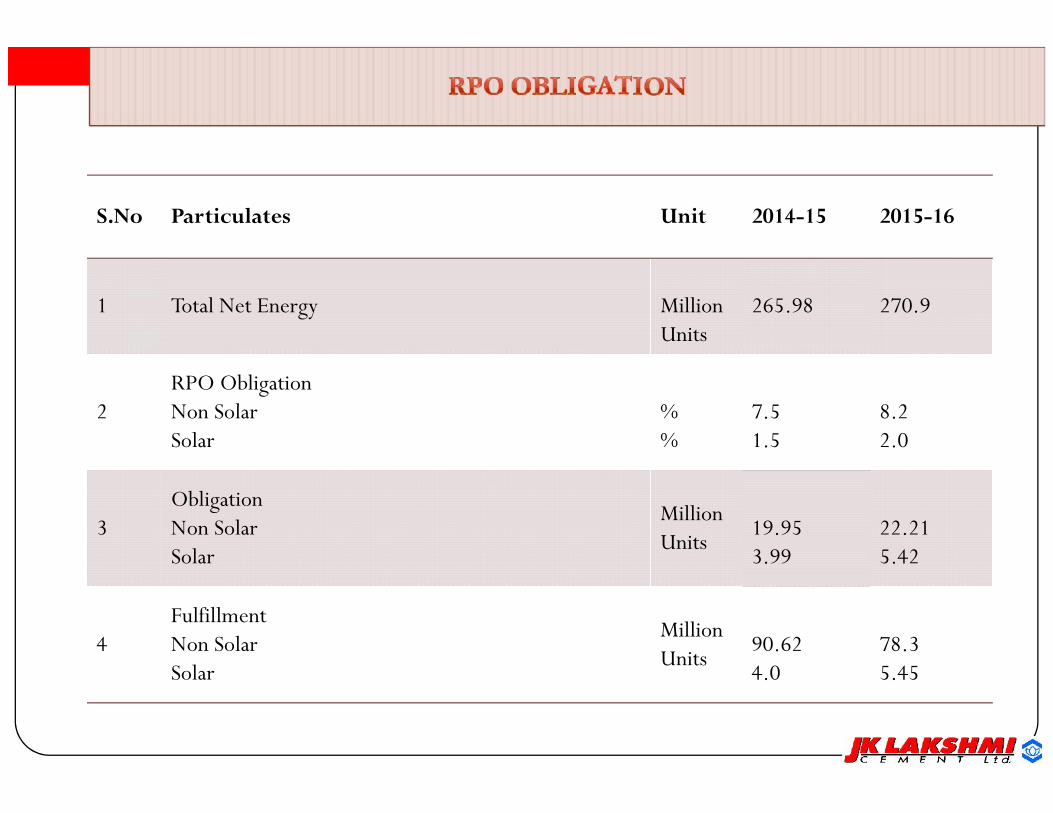
S.No Particulates Unit 2014-15 2015-16
1 Total Net Energy MillionUnits
265.98 270.9
2RPO ObligationNon SolarSolar
%%
7.51.5
8.22.0
2RPO ObligationNon SolarSolar
%%
7.51.5
8.22.0
3ObligationNon SolarSolar
MillionUnits 19.95
3.9922.215.42
4FulfillmentNon SolarSolar
MillionUnits 90.62
4.078.35.45
S.No
Particulates Unit 2014-15 2015-16
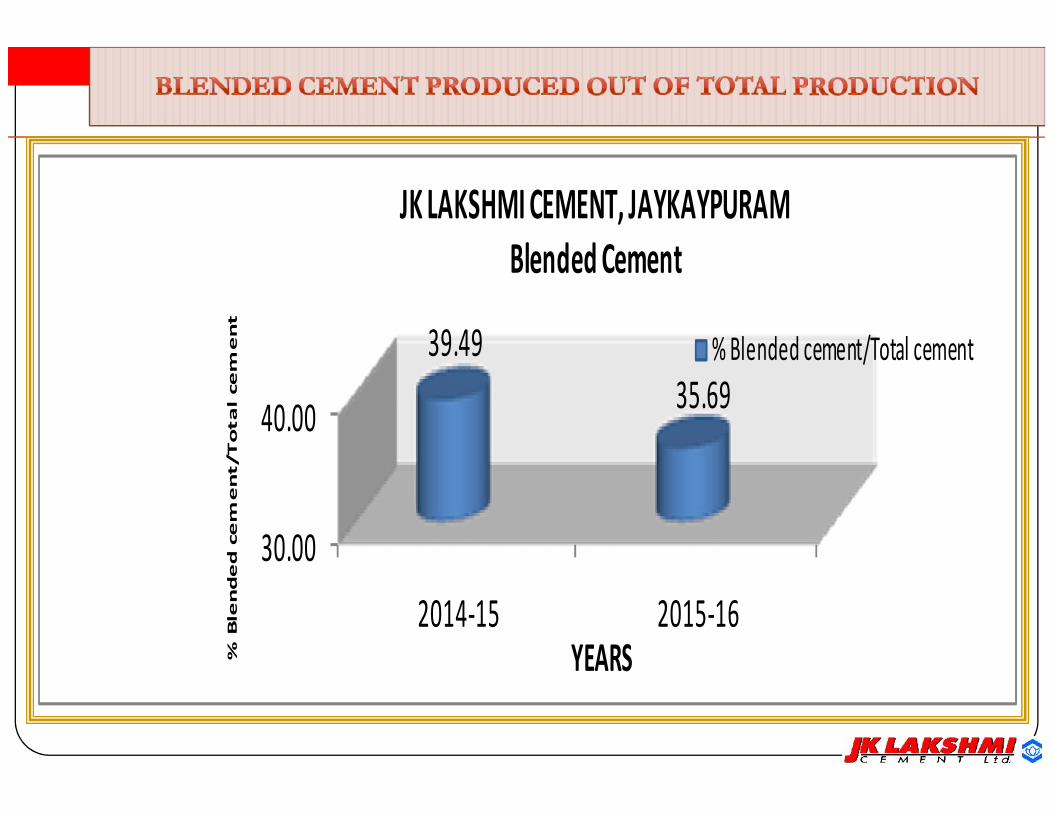
Blended Cement % 39.49 35.69
30.00
40.00
2014-15 2015-16
39.4935.69
% B
len
de
d c
em
en
t/T
ota
l ce
me
nt
YEARS
JK LAKSHMI CEMENT, JAYKAYPURAMBlended Cement
% Blended cement/Total cement
30.00
40.00
2014-15 2015-16
39.4935.69
% B
len
de
d c
em
en
t/T
ota
l ce
me
nt
YEARS
JK LAKSHMI CEMENT, JAYKAYPURAMBlended Cement
% Blended cement/Total cement
Sr.No
Particulates Unit 2014-15 2015-16
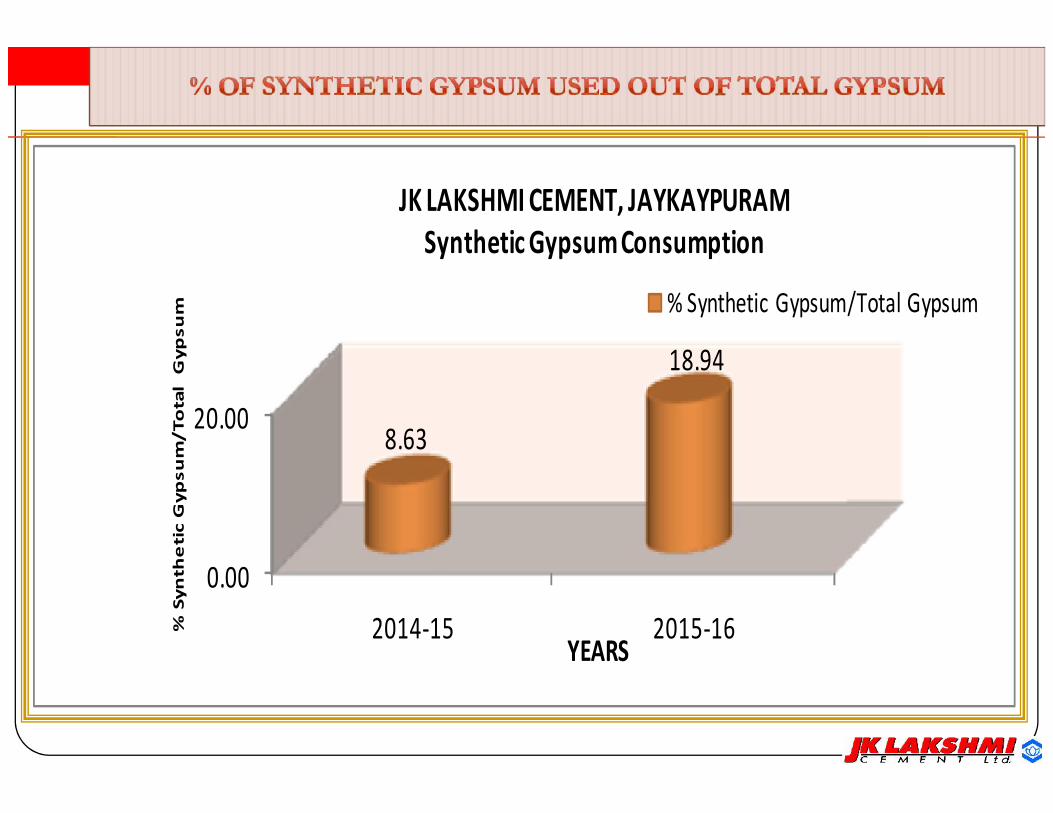
1 Total Gypsum % 4.66 4.71
0.00
20.00
2014-15 2015-16
8.63
18.94
% S
ynth
eti
c G
ypsu
m/T
ota
l G
ypsu
m
YEARS
JK LAKSHMI CEMENT, JAYKAYPURAMSynthetic Gypsum Consumption
% Synthetic Gypsum/Total Gypsum
0.00
20.00
2014-15 2015-16
8.63
18.94
% S
ynth
eti
c G
ypsu
m/T
ota
l G
ypsu
m
YEARS
JK LAKSHMI CEMENT, JAYKAYPURAMSynthetic Gypsum Consumption
% Synthetic Gypsum/Total Gypsum
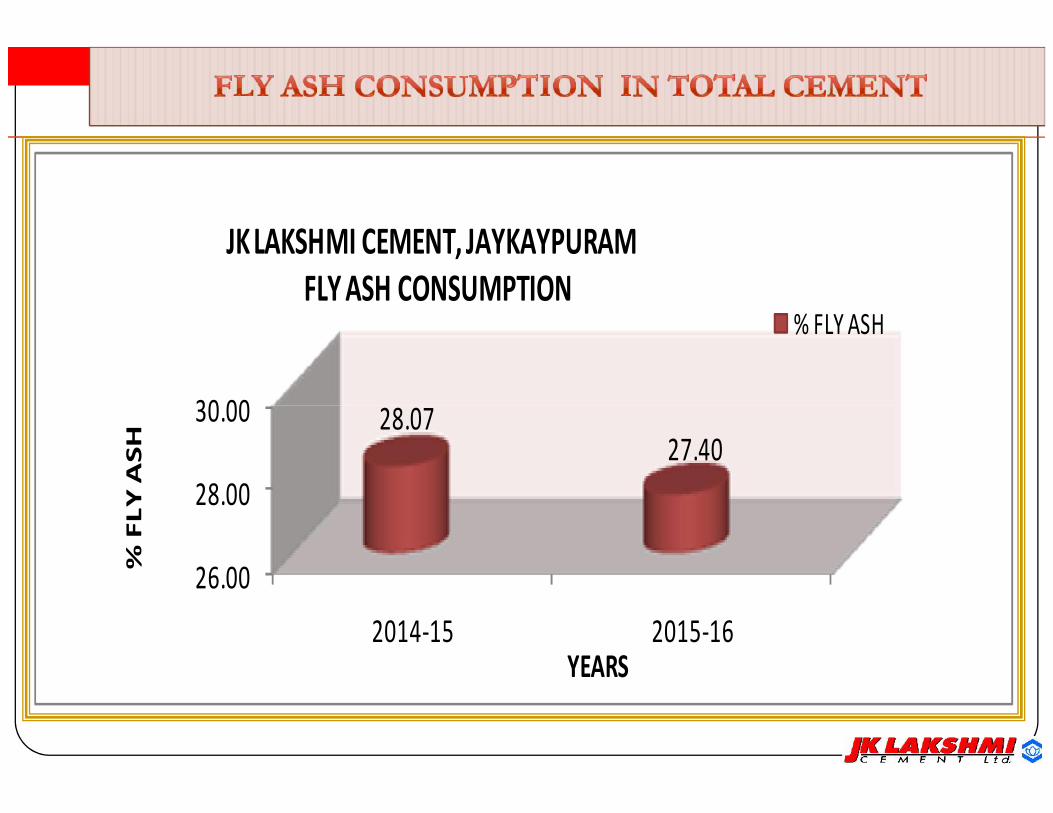
26.00
28.00
30.00
2014-15 2015-16
28.0727.40
% F
LY
AS
H
YEARS
JK LAKSHMI CEMENT, JAYKAYPURAMFLY ASH CONSUMPTION
% FLY ASH
26.00
28.00
30.00
2014-15 2015-16
28.0727.40
% F
LY
AS
H
YEARS
JK LAKSHMI CEMENT, JAYKAYPURAMFLY ASH CONSUMPTION
% FLY ASH
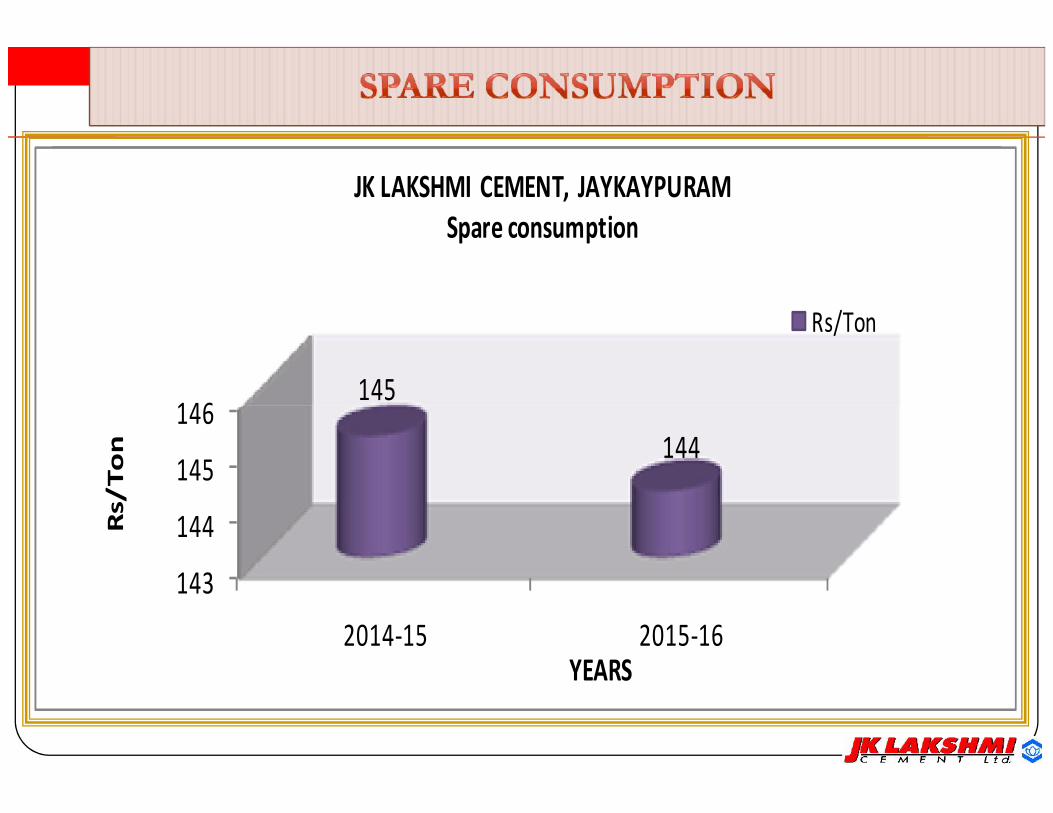
Sr.No.
CONSUMPTION UNITS 2014-15 2015-16
A SPARE & Other Rs/Ton 145.15 144.18
143
144
145
146
2014-15 2015-16
145
144
Rs/
Ton
YEARS
JK LAKSHMI CEMENT, JAYKAYPURAMSpare consumption
Rs/Ton
143
144
145
146
2014-15 2015-16
145
144
Rs/
Ton
YEARS
JK LAKSHMI CEMENT, JAYKAYPURAMSpare consumption
Rs/Ton
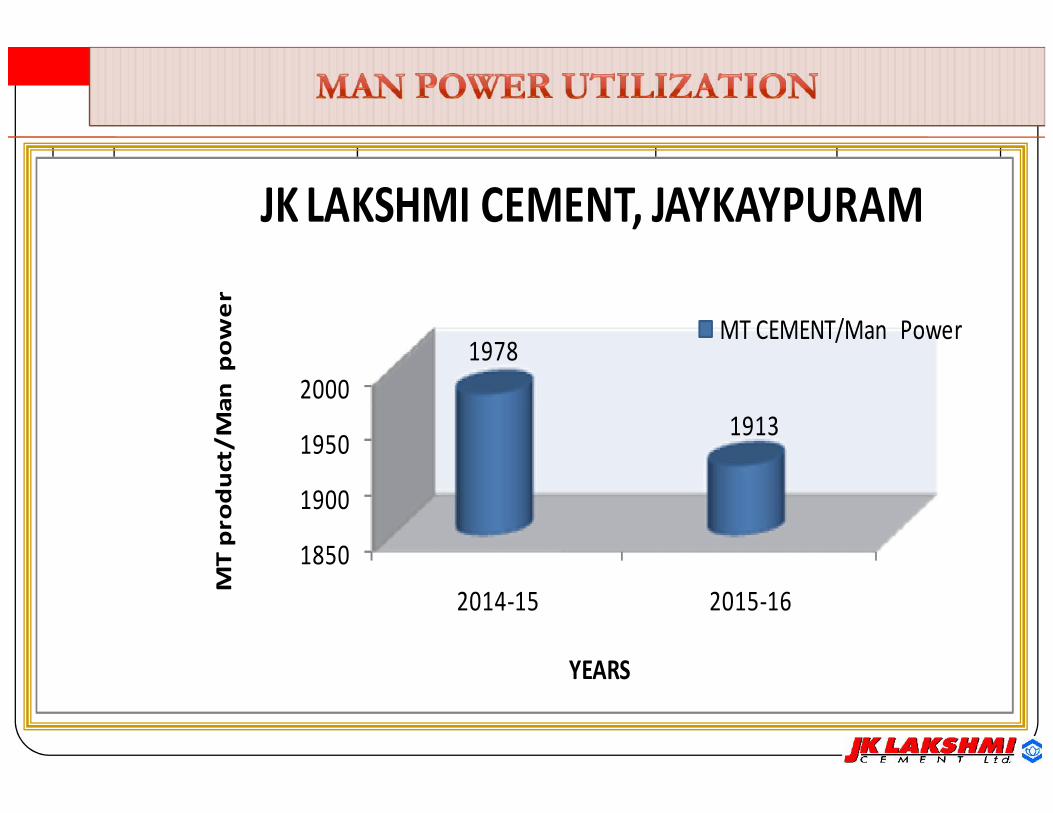
Sr.No.
Utilization UNITS 2014-15 2015-16
A Man Power MT product/Man power 1978 1913
1850
1900
1950
2000
2014-15 2015-16
1978
1913
MT
pro
du
ct/M
an p
ow
er
YEARS
JK LAKSHMI CEMENT, JAYKAYPURAM
MT CEMENT/Man Power
1850
1900
1950
2000
2014-15 2015-16
1978
1913
MT
pro
du
ct/M
an p
ow
er
YEARS
JK LAKSHMI CEMENT, JAYKAYPURAM
MT CEMENT/Man Power
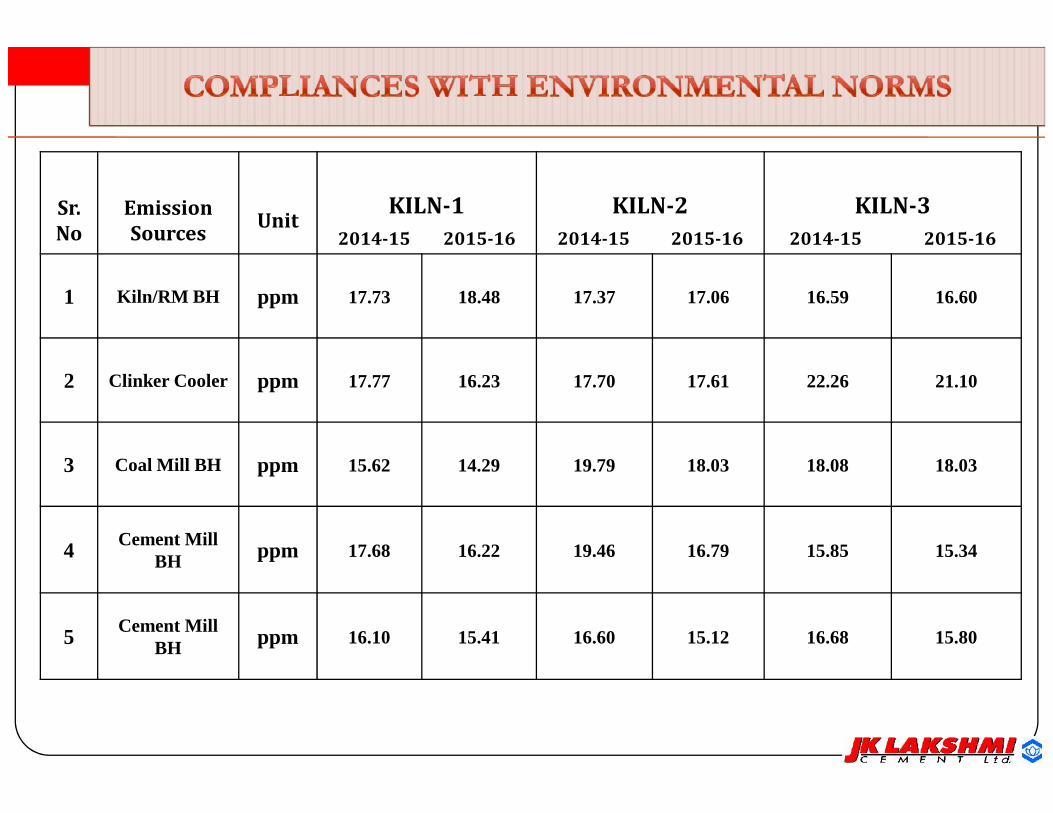
Sr.No
EmissionSources Unit KILN-1
2014-15 2015-16
KILN-22014-15 2015-16
KILN-32014-15 2015-16
1 Kiln/RM BH ppm 17.73 18.48 17.37 17.06 16.59 16.60
2 Clinker Cooler ppm 17.77 16.23 17.70 17.61 22.26 21.10
3 Coal Mill BH ppm 15.62 14.29 19.79 18.03 18.08 18.03
4 Cement MillBH ppm 17.68 16.22 19.46 16.79 15.85 15.34
5 Cement MillBH ppm 16.10 15.41 16.60 15.12 16.68 15.80
It’s a matter of privilege that we have not faced any kind ofproblems and issues regarding industrial relations till now.
This shows how we are determined to our responsibilities bykeeping healthy terms and friendly approach to all partnerindustries that fulfils the criteria of need for both of us.
It’s a matter of privilege that we have not faced any kind ofproblems and issues regarding industrial relations till now.
This shows how we are determined to our responsibilities bykeeping healthy terms and friendly approach to all partnerindustries that fulfils the criteria of need for both of us.
Maintenance practices are very crucial in smooth functioningof a plant and it plays an indespensable role in keeping upwith the pace of productivity without any hindrance.
It is carried out in three major forms:
Preventive
Proactive
Condition monitoring
Maintenance practices are very crucial in smooth functioningof a plant and it plays an indespensable role in keeping upwith the pace of productivity without any hindrance.
It is carried out in three major forms:
Preventive
Proactive
Condition monitoring


