52
JKU | Department of Particulate Flow Modelling Annual Report | 2014 FM

JKU | Department of Particulate Flow Modelling
Annual Report | 2014
FM
Front cover: Visualization of a silo discharge LIGGGHTS simulation which was done using our hybrid parallelization on 128 processor cores. MPI processes were used to distribute work among multiple compute nodes. Threads then utilize all cores on each node. Using this model we achieved speedups of up to 44% in typical test cases. © R. Berger
DEPARTMENT OF PARTICULATE FLOW MODELLING
Dear Readers,
2014 has been a year of consolidation and re-organization. As Department of Particulate Flow Modelling we are shaping the road towards a new research endeavor being initiated by our successful Christian-Doppler Laboratory.
One major step on this road has been the successful application of the K1MET competence center, in which our research group will play a leading role. Here we will build up an application oriented open-source simulation platform, which will enable industrial partners to efficiently harness our model developments. Dedicated Rock’n’Roll computer science is needed to improve the computational efficiency of these models. Our Dust’n’Dirt group, in turn, successfully applied their new filtered solid phase models to industrial scale reactors, paving the path to our future Christian-Doppler Laboratory of Simon Schneiderbauer.
Even more important than acquiring future sources of funding is a thorough definition of the future scientific path our research group wants to follow. We worked hard to define our groups’ future core topics in a stringent and concise way. Now, we are full of new ideas and eager to realize them.
With these introducing words I wish you a pleasant reading!
Sincerely,
1

CD-Lab²
2
In 2015 I will apply for a follow-up Christian Doppler Laboratory entitled “Multi-scale modeling of multiphase flows”. This CD-Lab should start at the beginning of 2016, directly by the end of the current CD-Lab on Particulate Flow Modeling.
As the title of the follow-up CD-Lab suggests, it will deal with multi-scale modeling methods for general multiphase flows. In particular, the topics will complement to the recently approved K1MET, which deals with the “coarse graining” of the current CFDEM methods to make them available to industrial scale analyses. However, the K1MET does not explicitly include, on the one hand, the mutual influence of the micro-scale on the global process. On the other hand, the “coarse graining” has a special focus on the spatial length scales, while the “coarse graining” of the temporal length is put aside. Nevertheless, the numerical investigation of long term industrial processes, therefore, demands a huge amount of computational resources due to the large number of time steps required. And these are exactly the points, where the new CD-Lab comes into play.
a) The highly efficient Lattice Boltzmann method allows the concurrent implementation of micro-scale phenomena such as particle growth, jet disintegration, slag entrainment, etc.
b) The “coarse graining” of the time scales will be achieved by multi-zonal process model as well as statistical methods.
I am looking forward to these new challenges!
Sincerely,

ROCK ́ N´ ROLL
DUST ´N´ DIRT
EXPERIMENTS
SEMINAR | AEROSOL DETECTION
Hybrid Parallelization in LIGGGHTS
LBDEMcoupling
Materials2Simulations2Applications
Die Filling
Particle Fragmentation
Pneumatic Conveying
High Pressure Die Casting
Aerated Stirred Tanks
Fluidized Beds
Why not double hybrid? ...............................................................
Metallurgical Flows ......................................................................
Industrial Dust Recycling
Jet in crossflow dispersion
.....................................................................................
......................................................................................................................
.............................................
...........................................................................
............................................
.....................................................................................
.................................................................
..................................................................
..........................................................
..................................................................
..............................................................................
.............................................................
...........................................................
Bubble Stirred Flows ...................................................................................................................................................
..........................................
Packed Beds
OSCCAR
SCIENTIFIC FRIENDSSELECTED PUBLICATIONS
CONTENTS
3
6 8
10
12
14
18
20
22
24
26
28
32
34
36
38
40
42
44-46
48
2014 | Particulate Flow Modelling

Dear Readers,
In 2014 the core developers of LIGGGHTS and CFDEMcoupling – Christoph Kloss and Christoph Goniva – left their academic harbor towards their spin-off company. Being the first PhD students of our CD-Lab, those two build up our Rock’n’Roll group, which experienced exciting international success. Now, while it is very rewarding to see academic developments make it to the market, it is a farewell to two brilliant coworkers.
In order to guarantee continuous prospering of our Rock’n’Roll group we jointly discussed how to carefully develop research in the future. We agreed that our academic research group will focus on model development in the field of fluid-particle interaction. Here we will explore possibilities of multi-scale CFD-DEM simulations. In doing that we will stick to our fundamental three-fold investigation approach comprising analytical considerations, numerical simulations and experimental measurements.
Obviously, these are big footsteps for a Rock’n’Roll successor to follow. With Thomas Lichtenegger we found a really promising candidate. Being an excellent (sub auspiciis) physicist he certainly has the capacity and enthusiasm to shape the future of our Rock’n’Roll group!
Sincerely,
EDITORIAL | ROCK ´N´ ROLL
4
Stefan Pirker | Thomas Lichtenegger

5
EDITORIAL | ROCK ´N´ ROLL
2014 | Particulate Flow Modelling
Fig. 1: „Sandy“ (left) mimics the die filling process and was adapted to handle 4 ìm cohesive metallic powder (middle). Extended analysis on coarse graining and cohesive forces to correctly simulate such material. Uniaxial compression to test cohesion scalability (right).
Fig. 2: Breakage of a brittle particle after collision with an unbreakable particle (red). The arrows indicate the direction and magnitude of the fragment velocities. The colors illustrate the particle size distribution.
Fig. 3: Finding correlations between numerical parameters and bulk behaviours is a computationally expensive task: Artificial Neural Networks can optimize it, allowing the investigation of a massive a m o u n t o f pa r a m e t e r s ’ combinations.
Source: www.stern-apotheke-berlin.de
2014 | Particulate Flow Modelling
ROCK ´N´ ROLLHYBRID PARALLELIZATION IN LIGGGHTS
6
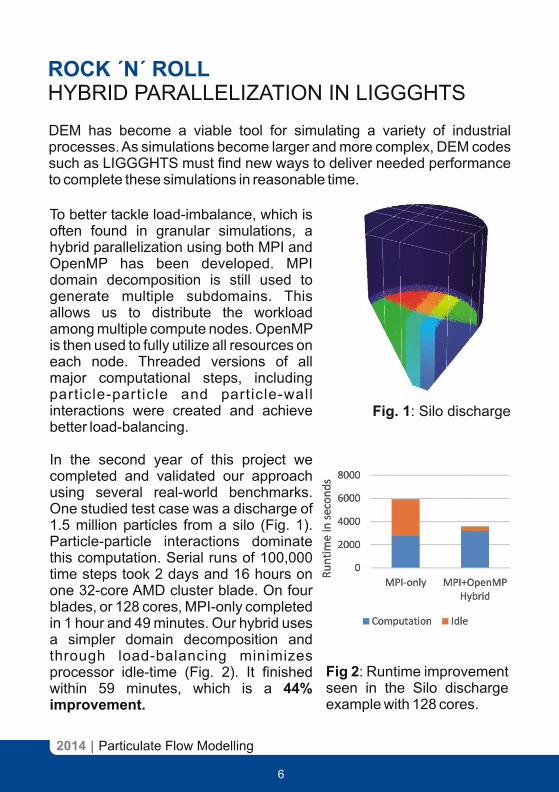
DEM has become a viable tool for simulating a variety of industrial processes. As simulations become larger and more complex, DEM codes such as LIGGGHTS must find new ways to deliver needed performance to complete these simulations in reasonable time.
Fig. 1: Silo discharge
Fig 2: Runtime improvement seen in the Silo discharge example with 128 cores.
To better tackle load-imbalance, which is often found in granular simulations, a hybrid parallelization using both MPI and OpenMP has been developed. MPI domain decomposition is still used to generate multiple subdomains. This allows us to distribute the workload among multiple compute nodes. OpenMP is then used to fully utilize all resources on each node. Threaded versions of all major computational steps, including particle-particle and particle-wall interactions were created and achieve better load-balancing.
In the second year of this project we completed and validated our approach using several real-world benchmarks. One studied test case was a discharge of 1.5 million particles from a silo (Fig. 1). Particle-particle interactions dominate this computation. Serial runs of 100,000 time steps took 2 days and 16 hours on one 32-core AMD cluster blade. On four blades, or 128 cores, MPI-only completed in 1 hour and 49 minutes. Our hybrid uses a simpler domain decomposition and through load-balancing minimizes processor idle-time (Fig. 2). It finished within 59 minutes, which is a 44% improvement.

7
Richard Berger [email protected]|
Fig. 3: Mixing process
We also simulated a mixing process which contains a complex rotating mesh geometry interacting with about 770,000 large particles (Fig. 3). This 50,000 time step benchmark took 15 hours 38 minutes to complete on a s ing le processor. A MPI-only simulation with 128 cores was able to reduce simulation time to 35 minutes. D u e t o a s i m p l e r d o m a i n decomposition, our hybrid could reduce MPI communication overheads which were introduced by rotating mesh geometry. It finished within 20 minutes on 128 cores, which is 42% faster than using MPI-only.
Both benchmarks illustrate the benefit of multiple decomposition layers. One layer for mapping the physical layout of computing hardware. And another focusing on balancing the workload among compute resources.
Overall this development also improved baseline performance of LIGGGHTS because various internals needed to be adapted.
All of these changes will be made available to a broader audience in 2015. This will help sort out remaining bugs and improve quality through Open-Source collaboration.
Fig 4: Runtime improvement seen in the Mixing benchmark with 128 cores.
FMParticulate Flow Modelling
8
ROCK ´N´ ROLL | LBDEMCOUPLING: EFFICIENT RESOLVED OPEN-SOURCE SIMULATION OF FLUID-PARTICLE SYSTEMS
2014 | Particulate Flow Modelling
During the last year, huge progress was made in the creation of a new tool called LBDEMcoupling for resolved simulation of fluid-particle systems. This tool uses the lattice Boltzmann (LB) method instead of classical finite-volume CFD (FV-CFD) to simulate fluid flow. The LB method is very well suited to flows in complex, moving geometries because it does not operate on a complicated mesh but on a regular grid. LBDEMcoupling creates a coupling between two well-established open-source platforms: the DEM code LIGGGHTS [1] for particle simulation and the LB library Palabos [2].
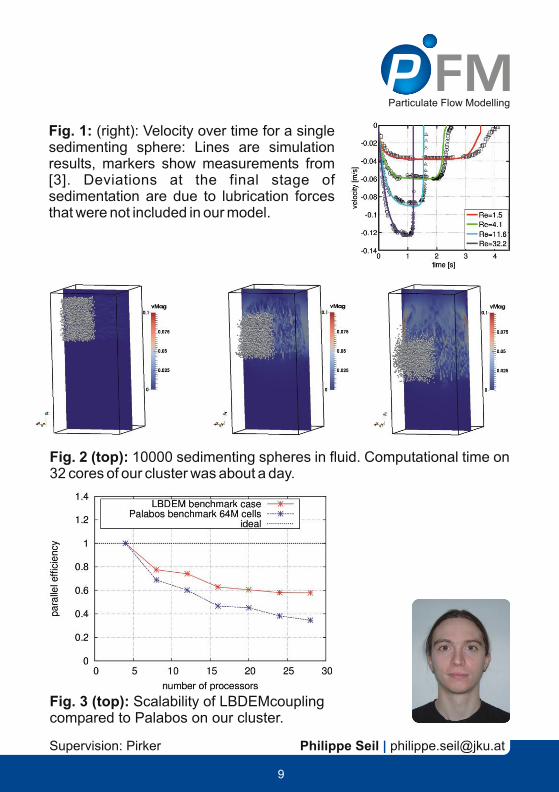
Thorough testing of this coupled approach was performed. First, we tested the evaluation of drag and torque on a single fixed particle in several flow configurations and compared the results to values obtained by very finely resolved FV-CFD simulations. We found excellent agreement between the two approaches. Then, we considered a test case by Ten Cate et al. [3]: a single sedimenting sphere in a tank of fluid. We compared our simulations to measurements published in [3] and found good agreement (see figure 1).
We also tested the parallel efficiency of this new tool. For this, we set up a case of approximately 10000 spheres sedimenting in a tank of fluid resolved by a grid of 300x300x600 = 54mio cells (see figure 2). We found this rather large case to be feasible in approximately 30h on 32 cores of our cluster. Also, parallel efficiency was tested (figure 3) and it was found that the scalability of the coupling is comparable to the scalability of a pure LB simulation of comparable size.
First real-world applications of this tool will be: simulation of the behaviour of suspensions in narrow channels, and sediment transport in open channel flow.
[1] www.liggghts.com[2] www.palabos.org[3] Ten Cate et al., Phys.Fluids 14, 4012 (2002)
9
Supervision: Pirker Philippe Seil [email protected]|
Fig. 1: (right): Velocity over time for a single sedimenting sphere: Lines are simulation results, markers show measurements from [3]. Deviations at the final stage of sedimentation are due to lubrication forces that were not included in our model.
Fig. 3 (top): Scalability of LBDEMcoupling compared to Palabos on our cluster.
FMParticulate Flow Modelling
Fig. 2 (top): 10000 sedimenting spheres in fluid. Computational time on 32 cores of our cluster was about a day.

2014 | Particulate Flow Modelling
ROCK ´N´ ROLL MATERIALS2SIMULATIONS2APPLICATIONS
10
Gravels, corn seeds, pharmaceutical powders, sands and ores can not be easily characterized as for instance a steel beam.
A set of experimental and numerical solutions, together with artificial neural networks, can improve the accuracy and the range of applicability of the characterization of particles properties, and reduce the computational costs.After the data collection (thanks to a set of characterization devices) physical key parameters (bulk-macro behavior) of particles are identified.
Meanwhile, combinations o f DEM-mic roscop i c parameters have been simulated, each leading to a different numerical bulk-macroscopic behavior, t h r o u g h D E M (LIGGGHTS) and CFDEM (CFDEMcoupling).
The predictive capability of any simulation strongly depends on the validity of t h e p a r t i c l e b a s e d simulation parameters. To ensure it is not necessary to evaluate a huge number of parameter sets, but rather to evaluate the
Fig 2 : Biological inspiration
Fig 3 : Artificial neural network
Fig 1 : Comparison [ www.wonderwhizkids.com - broadwaysand.com ]
[ www.extremetech.com ]
11
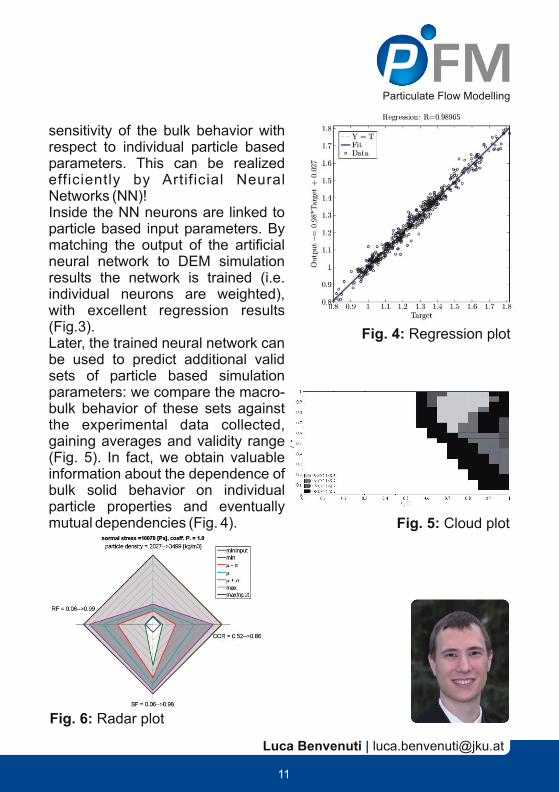
sensitivity of the bulk behavior with respect to individual particle based parameters. This can be realized efficiently by Artificial Neural Networks (NN)! Inside the NN neurons are linked to particle based input parameters. By matching the output of the artificial neural network to DEM simulation results the network is trained (i.e. individual neurons are weighted), with excellent regression results (Fig.3). Later, the trained neural network can be used to predict additional valid sets of particle based simulation parameters: we compare the macro-bulk behavior of these sets against the experimental data collected, gaining averages and validity range (Fig. 5). In fact, we obtain valuable information about the dependence of bulk solid behavior on individual particle properties and eventually mutual dependencies (Fig. 4). Fig. 5: Cloud plot
Luca Benvenuti [email protected]|
Fig. 4: Regression plot
Fig. 6: Radar plot
FMParticulate Flow Modelling

2014 | Particulate Flow Modelling
ROCK ´N´ ROLL | DIE FILLING
12
Simulation of the die filling process
Die filling process deals with a prohibitive number of particles to be simulated in most of the cases. Coarse graining methodology replaces individual particles by representative parcels, substantially reducing the required number of particles to represent a process. Analytical considerations and numerical simulations were performed to ensure that the physics is captured correctly in the different regimes the material may be inserted. A shear box using Lees-Edwards boundary conditions in different shear rates was simulated with different solid fractions to investigate different flow regimes (Fig. 1).
A characteristic of many metallic powders used in the die filling process is their complex dynamic and static behaviour. We use cohesion models like JKR and capillary in addition to standard DEM contact models to depict this behaviour (Fig. 2). The calibration process of cohesive material is not yet well known. Most promising calibration process we conduct involve a shear cell like device where material can reach a unique consolidation stage and Coulomb cohesion can also be captured (Fig. 3).
Fig. 1: Effect of coarse graining in the particle stress for flow regimes (top). Stress box with boundary conditions to mimic different regimes (bottom).
Fig. 2: Metallic powders used in die filling process and tests. In the top a non cohesive powder. In the bottom highly cohesive powder.
Daniel Schiochet Nasato [email protected]|
13
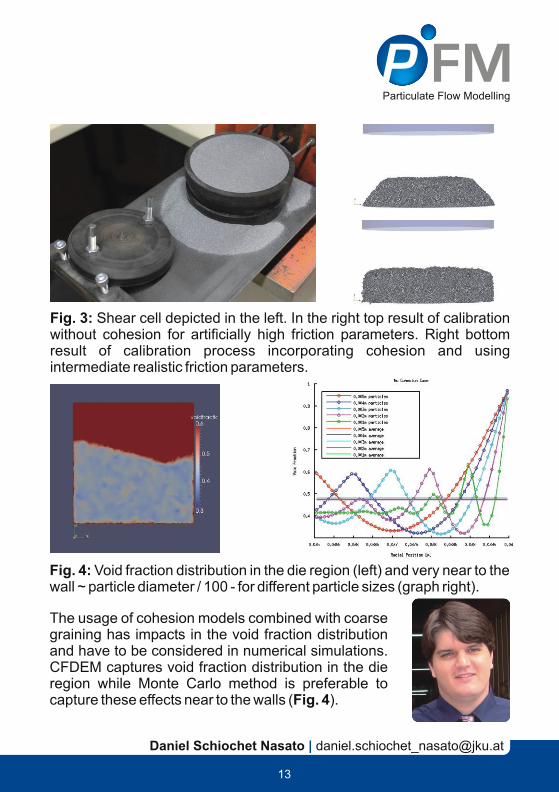
Fig. 3: Shear cell depicted in the left. In the right top result of calibration without cohesion for artificially high friction parameters. Right bottom result of calibration process incorporating cohesion and using intermediate realistic friction parameters.
Fig. 4: Void fraction distribution in the die region (left) and very near to the wall ~ particle diameter / 100 - for different particle sizes (graph right).
The usage of cohesion models combined with coarse graining has impacts in the void fraction distribution and have to be considered in numerical simulations. CFDEM captures void fraction distribution in the die region while Monte Carlo method is preferable to capture these effects near to the walls (Fig. 4).
FMParticulate Flow Modelling

2014 | Particulate Flow Modelling
ROCK ´N´ ROLL | PARTICLE FRAGMENTATION
14
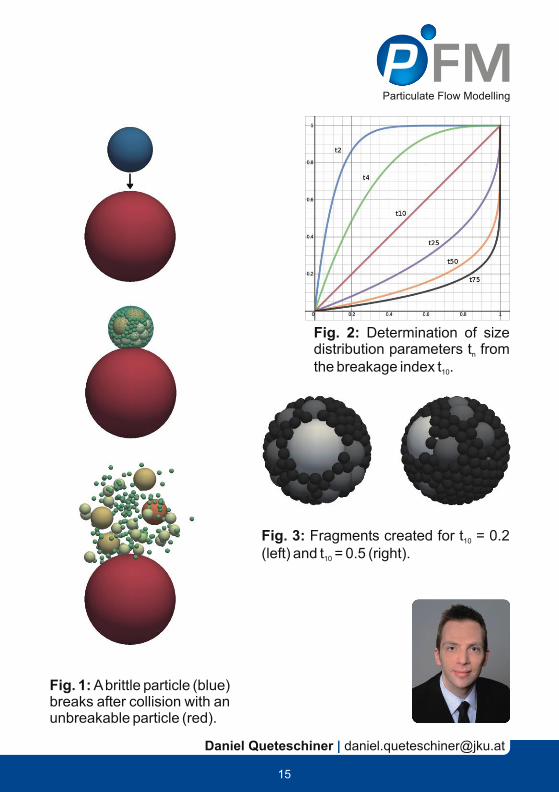
Fragmentation is the fundamental underlying process in many industrial comminution applications (e.g. milling, crushing). To simulate such processes the Discrete Element Method (DEM) has to be expanded to take into account the breakage of particles.
To this end many DEM implementations describing fragmentation adopt an agglomeration framework, where each parent particle is constructed from a number of smaller child particles. In the course of a simulation, child particles can be separated from the parent particle to form a fragment. A major disadvantage of this approach is the large number of particles required to model all fragments.
Alternatively, fragmentation processes may be described according to a probability distribution as a function of impact energy, local pressure or any other suitable breakage criterion. To this effect Weichert introduced the versatile Weibull distribution to the field of comminution.
In this approach the conditions for fragmentation are checked at each simulation time step. In the case of a breakage event the number and size of the progeny is derived from a probability distribution as well. The hereby generated fragments replace the original particle as shown in Fig. 1.
More precisely, the breakage index t - described via the Weibull 10
distribution - denotes the cumulative mass fraction of the progeny that is smaller than 1 10 of the parent particle size. The parameter t is uniquely 10
related to other points on a family of size distribution curves t , defined as n
the cumulative percentage passing a given fraction of the initial size (Fig.2).
In this way the particle size distribution is uniquely defined and the fragments thus obtained are randomly packed into the volume of the original particle (Fig. 3). However, assuming volume conservation, this leads to a compression of the particles and in further consequence to an unphysical repulsive normal force between the fragments. Our model resolves this problem by limiting these forces by the actually available elastic energy of the particles.
/
x/n,
15
Daniel Queteschiner [email protected]|
Fig. 1: A brittle particle (blue) breaks after collision with an unbreakable particle (red).
Fig. 2: Determination of size distribution parameters t from n
the breakage index t .10
Fig. 3: Fragments created for t = 0.2 10
(left) and t = 0.5 (right). 10
FMParticulate Flow Modelling

EDITORIAL | DUST ´N´ DIRT
16
Dear Readers,
to begin with, 2014 was the year of my PhDs. Afsaneh Soleimani made a breakthrough in the modeling of pneumatic conveying using continuum models. In particular, she developed an innovative method to include wall roughness, which depends on the particle diameter as well as the structure of the wall. Her novel model accurately reveals the velocity profiles in a pneumatic conveying line, which are considerably affected by wall roughness and the particle diameter.
Mahdi Saeedipour improved his Lagrangian-Eulerian hybrid approach for the numerical analysis of high-pressure die-casting. His simulations precisely predict the droplet size distribution as well as the correct spreading and disintegration of the droplets. Remarkably, their efforts have been honored by several conference presentation and a Journal paper.
I further want to welcome our new head of the Rock’n’Roll group. I am looking forward to jointly attack new challenging problems and I want to take the opportunity to further strengthen the collaboration between our groups.
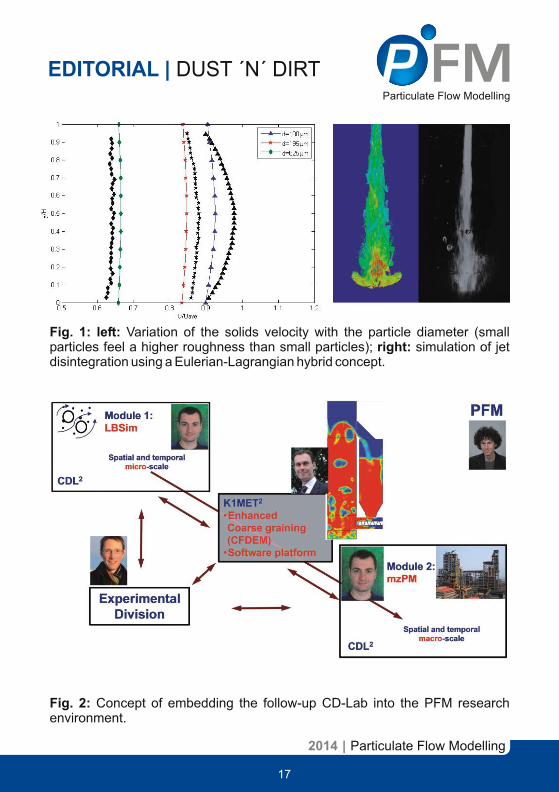
Finally, I want to come back to the application for the follow-up CD-Laboratory on the “Multi-scale modeling of multiphase flows”. This should be smoothly embedded to our current research environment, which has b e e n c o n s i d e r a b l y s t r e n g t h e n e d b y t h e s u c c e s s f u lK1MET hearing. With a positive evaluation of these two basic fundings we are looking into a prosperous future!
Simon Schneiderbauer [email protected]|
17
EDITORIAL | DUST ´N´ DIRT
Fig. 1: left: Variation of the solids velocity with the particle diameter (small particles feel a higher roughness than small particles); right: simulation of jet disintegration using a Eulerian-Lagrangian hybrid concept.
Fig. 2: Concept of embedding the follow-up CD-Lab into the PFM research environment.
2014 | Particulate Flow Modelling
FMParticulate Flow Modelling
2014 | Particulate Flow Modelling
18
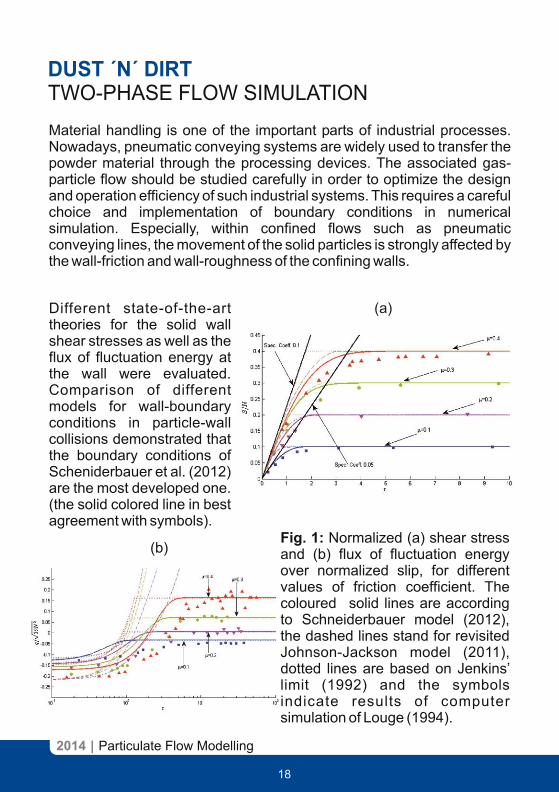
Material handling is one of the important parts of industrial processes. Nowadays, pneumatic conveying systems are widely used to transfer the powder material through the processing devices. The associated gas-particle flow should be studied carefully in order to optimize the design and operation efficiency of such industrial systems. This requires a careful choice and implementation of boundary conditions in numerical simulation. Especially, within confined flows such as pneumatic conveying lines, the movement of the solid particles is strongly affected by the wall-friction and wall-roughness of the confining walls.
DUST ´N´ DIRT TWO-PHASE FLOW SIMULATION
Fig. 1: Normalized (a) shear stress and (b) flux of fluctuation energy over normalized slip, for different values of friction coefficient. The coloured solid lines are according to Schneiderbauer model (2012), the dashed lines stand for revisited Johnson-Jackson model (2011), dotted lines are based on Jenkins’ limit (1992) and the symbols indicate results of computer simulation of Louge (1994).
(a)Different state-of-the-art theories for the solid wall shear stresses as well as the flux of fluctuation energy at the wall were evaluated. Comparison of different models for wall-boundary conditions in particle-wall collisions demonstrated that the boundary conditions of Scheniderbauer et al. (2012) are the most developed one. (the solid colored line in best agreement with symbols).
(b)

A new model for wall-roughness was introduced in the frame of two-fluid model based kinetic theory and implemented in the standard solver of OpenFOAM-2.2.x. This model is based on the virtual wall model of Sommerfeld (1992) implementation in the boundary conditions of Schneiderbauer et. al. (Fig. 2).
A turbulent model, accounting for gas-particle turbulence interaction and particles’ wake effect, was studied and implemented in the standard solver of OpenFOAM-2.2.x.
19
Supervision: Schneiderbauer Afsaneh Soleimani [email protected]|
Fig. 2: The virtual wall model and shadow effect
Fig. 4: Particle’s velocity diagram for different particle’s diameter (black lines: experiment).
Fig. 3: Particle’s velocity diagram for different roughness.
The granular Eulerian solver, delivered with OpenFOAM (twoPhaseEulerFoam), was improved considerably by including wall-friction and wall-roughness effects in boundary conditions as well as gas-particle turbulent model. The new model is able to predict particles velocity in fairly good agreement with the experiment. (Fig. 3 and Fig. 4 ).
FMParticulate Flow Modelling

DUST ´N´ DIRT
High pressure die casting (HPDC) is a novel manufacturing method with capability of mass production with higher accuracy. In this process molten metal is injected into the die at high velocity (30-100 m/s) leading to a less physically understood filling behavior. Due to the turbulent nature of the flow, liquid jet may undergo severe instability, breakup and even atomization each of which could culminate in one or more typical casting defects.
Porosity is one of the challenging defects in the final product and may be affected by jet instability and atomization during injection phase. In case of atomization a large number of droplets with high velocity impinge the colder confining walls of the casting mold and might solidify consecutively. Different time scales of the impingement of the droplets and their solidification may result in heterogeneous structures near the surface of final product.
Accordingly, an appropriate numerical investigation of this process should include liquid jet instability and breakup as well as porosity formation near the surface.
Therefore a numerical framework using an Eulerian-Lagrangian approach is established to simulate the liquid metal jet breakup and droplet formation during the injection phase. First an analytical model for flow instability leading to turbulent breakup is considered to realize the droplet formation near the liquid jet interface, and then a novel idea is used to capture the droplet formation as Lagrangian droplets coupled with numerical simulations of continuum phase by volume of fluid approach (VOF) to model the global spreading and primary breakup of the turbulent liquid jet. This approach helps to reduce computational costs by using the sub-grid model instead of resolving small liquid structures in finer grid resolutions. Afterwards, an analytical model for droplet impact on mold walls and solidification is being studied and implemented in the numerical framework. This approach enables the prediction of porosity formation near the surface of the final product.
20
2014 | Particulate Flow Modelling
TWO-PHASE FLUID DYNAMICS IN HIGH PRESSURE DIE CASTING

21
Supervision: Schneiderbauer m @jku.atMahdi Saeedipour ahdi.saeedipour|
In Figure 1, the numerical simulation of primary breakup of turbulent water jet is presented against experimental study performed in our laboratory. Figure 2 shows the experimental setup and Figure 3 presents the schematic of analytical model used for droplet-wall interaction with the solidification effects.
Fig.1: Numerical simulation of turbulent water jet (Re=69000) using the Eulerian-Lagrangian approach (left) and experiments (right) for two consecutive times.
Fig.2: Experimental study on primary breakup of water jet using high speed camera and back illumination.
Fig.3: Schematic of droplet-wall impact sub-model for porosity prediction.
FMParticulate Flow Modelling

2014 | Particulate Flow Modelling
DUST ´N´ DIRT | AERATED STIRRED TANK
22
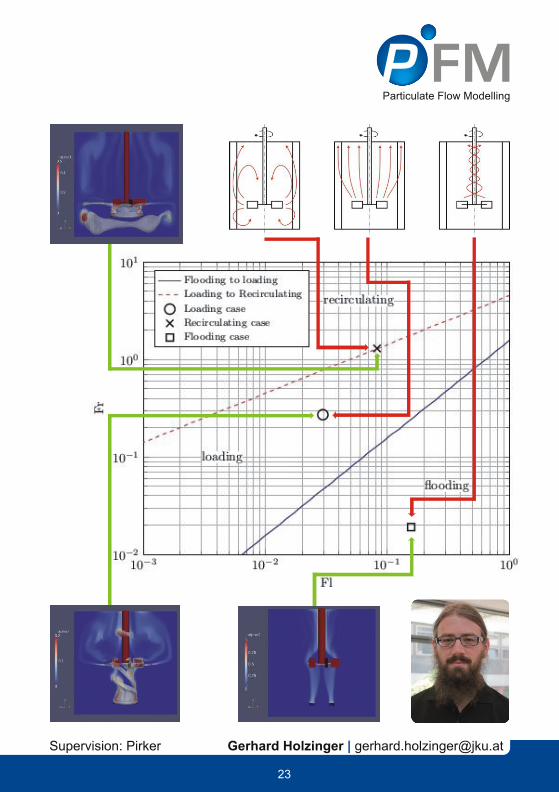
The stirred tank is the workhorse of the chemical industry. Thus the ability to simulate the flow and furthermore to simulate reactions is of importance. In order to deepen our understanding of two-phase Eulerian flow simulation with OpenFOAM we engaged in a validation study of the flow within a stirred tank.
The geometry we used is widely used in research, so there is plenty of literature and published results available for validation. The flow within the stirred tank was investigated with respect to single phase flow (non-aerated tank) and two-phase flow (aerated tank).
On the right: we see the mesh of the stirred tank. The stator has four baffles and the Rushton turbine has six blades.
On the opposite page: we see a regime map based on [LeeDudukovic]. The regime transition can be estimated with the Flow number (Fl) and the Froude number (Fr).
The three general flow regimes of an aerated stirred tank are flooding, loading and recirculating regime. The red arrows in the sketch of the regimes are the bubble trajectories.Our simulations match quite well with the predicted regimes.
[LeeDudukovic] B. W. Lee and M. P. Dudukovic. Determination of flow regime and gas holdup in gas-liquid stirred tanks. Chemical Engineering Science, 109:264–275, 2014.

2014 | Particulate Flow Modelling
24
DUST ´N´ DIRT | FLUIDIZED BEDS
Due to computational limitations a detailed simulation of poly-disperse reactive industrial scale reactors is still unfeasible. It is, therefore, common to use coarse grids and average particle properties to reduce the demand on computational resources. Such a procedure inevitably neglects on the one hand small (unresolved) scales. In the literature, numerous approaches have been put forth to account for these scales. However, these „coarse-grained“ models differ by more than two orders of magnitude. Moreover, they even disagree in their functional dependencies. While all of them depend on the average gas void fraction, some of them take into account the relative velocity between the solid phase and fluid (dashed lines) and others additionally consider the effect of filter width. For example, figure 1a outlines the differences for two different filtered sub-grid drag modifications. The filtered correlations deduced from highly resolved simulations of a bubbling fluidized bed of Geldart B type particles show a completely different behavior to filtered correlations determined from periodic box simulations. Nevertheless, this differences can be avoided by using different markers characterizing the filtered correlations. The figure clearly reveals that using the kinetic energy of the sub-filter scale velocity fluctuations yields nearly indistinguishable filtered correlations, which is in contrast to the filtered slip velocity.
We further applied these next generation sub-grid models to the coarse grid simulation of a poly-disperse industrial fluidized bed in combination with the Lagrangian-Eulerian hybrid model, Here, the local distribution of the different particle diameters, which is required for the gas-solid drag force, is obtained by tracking statistically representative particle trajectories for each particle diameter class. Figure 2 demonstrates that the hybrid model yields fairly good agreement with experimental data of the particle size distribution.
Future modeling efforts will concentrate on the numerical analysis of fluidized bed – cyclone assemblies as well as the numerical prediction of sheeting/chunks.

25
Fig. 1: left: variation of the fractional correction with filtered solids volume fraction for different slip velocities; right: variation of the fractional correction with the kinetic energy of the meso-scale velocity fluctuations for different volume fractions.
Fig. 2: Particle size distribution of the raw gas of the cyclone.
FMParticulate Flow Modelling

2014 | Particulate Flow Modelling
26
DUST ´N´ DIRT | WHY NOT DOUBLE HYBRID?
Thanks to an ambitious team of experienced senior scientists, who forward independent research and also supervision, I found some time for my own research. Developing new numerical models is a pleasing luxury beside all this administrative and organizing stuff that comes along with my position as head of our Department.
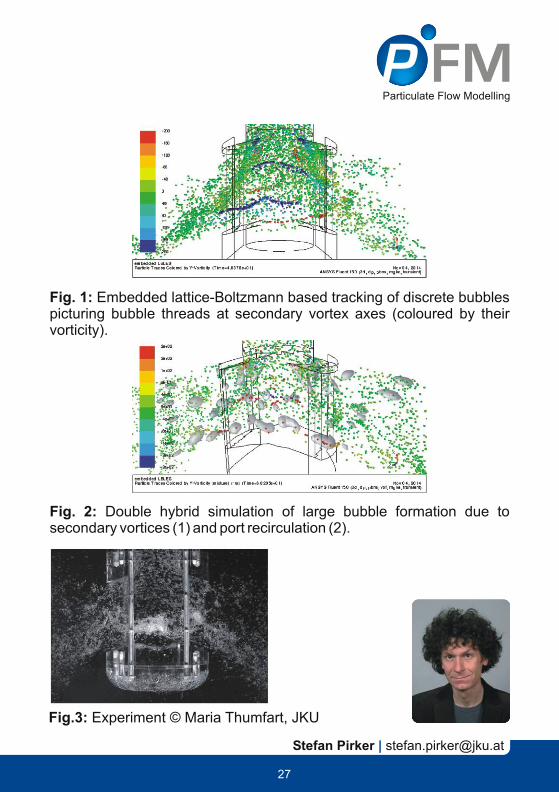
Submerged Entry Nozzle (SEN) flow behaviour is crucial for continuous casting of slab steel since it determines the mould flow pattern. Experiments indicate the existence of highly turbulent secondary vortices in the deflection zone of a bifurcated SEN, which attract gas bubbles at their rotational axes. In addition cyclically detaching gas volumes are formed at the upper port region at higher gas flow-rates.
We addressed this complex multiphase flow by means of hybrid finite volume and lattice-Boltzmann based turbulence models, which, in turn, is coupled to a hybrid discrete and continuous bubble model. In contrast to conventional finite volume based turbulence models on coarse grids, the embedded lattice-Boltzmann simulation is able to capture the highly unsteady dynamics of the secondary vortices. Surprisingly, due to the high efficiency of the lattice-Boltzmann code, this tremendously increased flow resolution comes along with only 9% more computational time.
In our simulations small discrete gas bubbles are traced in a Lagrangian frame of reference. In agreement with experiments bubbles are accumulated in the axes of the secondary vortices, forming characteristic bubble threads. If bubbles coalesce and eventually exceed grid resolution we switch to a continuous representation of large bubble surfaces. The resulting double hybrid simulation model is able to efficiently picture the complex multiphase flow phenomenon occurring in gas stirred SEN operation.
27
Fig. 1: Embedded lattice-Boltzmann based tracking of discrete bubbles picturing bubble threads at secondary vortex axes (coloured by their vorticity).
Fig. 2: Double hybrid simulation of large bubble formation due to secondary vortices (1) and port recirculation (2).
Fig.3: Experiment © Maria Thumfart, JKU
FMParticulate Flow Modelling
2014 | Particulate Flow Modelling
28
DUST ´N´ DIRT | METALLURGICAL FLOWS
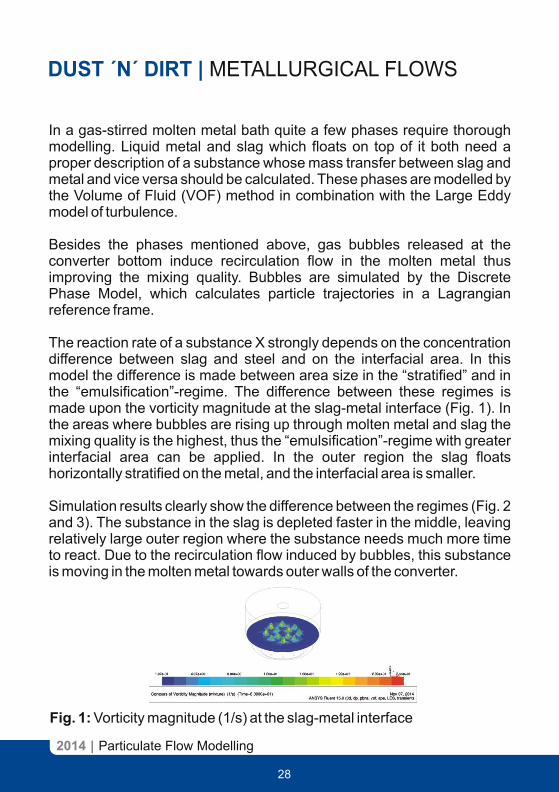
In a gas-stirred molten metal bath quite a few phases require thorough modelling. Liquid metal and slag which floats on top of it both need a proper description of a substance whose mass transfer between slag and metal and vice versa should be calculated. These phases are modelled by the Volume of Fluid (VOF) method in combination with the Large Eddy model of turbulence.
Besides the phases mentioned above, gas bubbles released at the converter bottom induce recirculation flow in the molten metal thus improving the mixing quality. Bubbles are simulated by the Discrete Phase Model, which calculates particle trajectories in a Lagrangian reference frame.
The reaction rate of a substance X strongly depends on the concentration difference between slag and steel and on the interfacial area. In this model the difference is made between area size in the “stratified” and in the “emulsification”-regime. The difference between these regimes is made upon the vorticity magnitude at the slag-metal interface (Fig. 1). In the areas where bubbles are rising up through molten metal and slag the mixing quality is the highest, thus the “emulsification”-regime with greater interfacial area can be applied. In the outer region the slag floats horizontally stratified on the metal, and the interfacial area is smaller.
Simulation results clearly show the difference between the regimes (Fig. 2 and 3). The substance in the slag is depleted faster in the middle, leaving relatively large outer region where the substance needs much more time to react. Due to the recirculation flow induced by bubbles, this substance is moving in the molten metal towards outer walls of the converter.
Fig. 1: Vorticity magnitude (1/s) at the slag-metal interface

29
Damir Kahrimanovic [email protected]|
Fig. 2: Mass fraction of substance X in molten metal after 30 sec. (Planes from left to right: converter bottom, vertical profile, slag-steel interface).
Fig. 3: Mass fraction of substance X in slag after 30 sec. (Planes from left to right: slag-steel interface, vertical profile, slag-air interface)
FMParticulate Flow Modelling

2014 | Particulate Flow Modelling
30
Dear Readers,
concerning our experimental activities the year 2014 was a phase of consolidation. As multiphase experiments in most cases come along with huge amounts of data, there are phases where its time to get back to your desk, concentrate on data processing and recapitulate the extracted results in comparison to literature and CFD results.
Therefore there are not many new experiments to report but a lot of work behind the scenes was done to provide the basis for high quality experimental data.
Bernhard König programed a Matlab based data analysis tool for turbulence analysis of multiphase PIV data and corresponding CFD simulations (Fig. 1 an 2).
EDITORIAL IV | EXPERIMENTS
Fig. 1: Turbulent Analyses tool (TurbAn) for multiphase interdisciplinary data interpretation.
Fig.2: Velocity vectors of the fluid phase in the midplane of a small rectangular bubble column.
The cooperation with the Institute of Electrical Measurement and Measurement Signal Processing at the Technical University Graz resulted in a first prototype of an electrical capacitance tomography system (ECT) which is able to provide real time tomography data of a pneumatic conveying experiment. Currently the hardware design for the final version is under development.
31
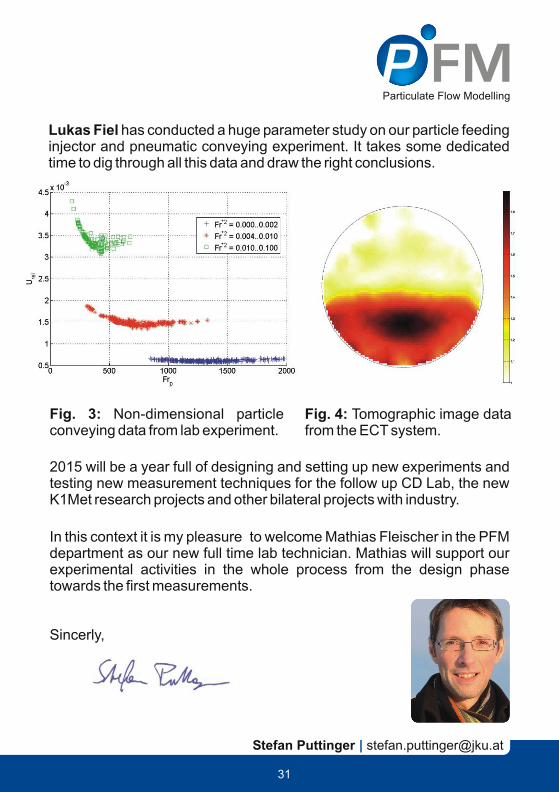
Lukas Fiel has conducted a huge parameter study on our particle feeding injector and pneumatic conveying experiment. It takes some dedicated time to dig through all this data and draw the right conclusions.
Fig. 3: Non-dimensional particle conveying data from lab experiment.
Fig. 4: Tomographic image data from the ECT system.
2015 will be a year full of designing and setting up new experiments and testing new measurement techniques for the follow up CD Lab, the new K1Met research projects and other bilateral projects with industry.
In this context it is my pleasure to welcome Mathias Fleischer in the PFM department as our new full time lab technician. Mathias will support our experimental activities in the whole process from the design phase towards the first measurements.
Sincerly,
FMParticulate Flow Modelling

2014 | Particulate Flow Modelling
EXPERIMENTS | INDUSTRIAL DUST RECYCLING
32
Particle conveying to industrial burners for solid materials in many cases requires a particle feeding injector. In such applications the combustion process often takes place at a higher pressure than at the point of the particle supply. Therefore the injector system must be able to feed particles against an increasing pressure level.
Damir Kahrimanovic has set up an 1D engineering tool to design the whole loop of a dust recycling system including cyclone, particle injector and feeding lines. To validate the 1D tool we have designed a modular lab-scale test rig (Fig. 1). In a first phase particles are fed via a vibrating chute to the injector box. After the conveying line the particles are collected on a weight balance in a box with adjustable pressure level.
Fig. 1: Outline of the lab-scale experiment
Lukas Fiel has done a huge parameter study this summer. On the basis of this data we are able to do comparisons with analytic and empirical calculations and validate the 1D engineering tool (Fig. 2 and 3).
In a final project phase the feeding injector will be included in our pneumatic test rig to form a closed loop system.

33
Stefan Puttinger Damir Kahrimanovic Lukas Fiel| |
Fig. 2: Non-dimensional plugging limit for strand conveying.
Fig. 3: Comparison of analytic and measured p ressu re d rop on conveying l ine for d i f f e r e n t p a r t i c l e diameters.
FMParticulate Flow Modelling

2014 | Particulate Flow Modelling
EXPERIMENTS
34
In many industrial applications fuel is injected into a channel and transported downstream to inlet valves or burning chambers. There are two main goals for such applications from an engineering point of view:
The injected fuel (e.g. methane) should form a homogeneous mixture with the crossflow (typically air).
If the fuel injection is unsteady (like for piston engines) the time scale of the mixture process and gas transport should be as close to the activation time of the injection valve as possible. This ensures that the amount of fuel mass flow keeps synchronized with the cycle times of inlet valves or the ignition pulses.
Within a long term project on pulverized coal injection (PCI) with voestalpine Donawitz we investigated a particle jet in crossflow (see previous annual reports) with steady state boundary conditions. We now adapted our wind tunnel facility for pulsed jet experiments of a gas jet in crossflow. The idea was to implement a similar way of post processing like for the PCI project. This kind of data analysis allows a direct comparison of experimental results and CFD simulations to analyze temporal and spatial distribution of the injected gas. Instead of solid particles we used oil droplets as tracer particles.
The CFD simulations were done in OpenFOAM with the incompressible pimpleFoam solver and a LES turbulence model.
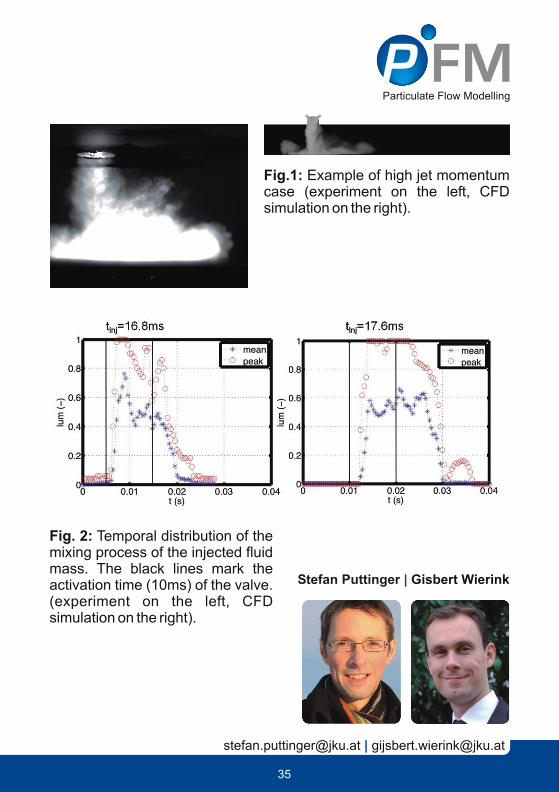
The qualitative agreement of experimental results and CFD simulations is very good (Fig.1). The data processing method is robust enough to handle poor image quality and noise in the experimental results and delivers a very good quantitative agreement of the temporal and spatial gas dispersion (Fig.2).
JET IN CROSSFLOW DISPERSION
35
Stefan Puttinger | Gisbert Wierink
[email protected] [email protected]|
Fig.1: Example of high jet momentum case (experiment on the left, CFD simulation on the right).
Fig. 2: Temporal distribution of the mixing process of the injected fluid mass. The black lines mark the activation time (10ms) of the valve. (experiment on the left, CFD simulation on the right).
FMParticulate Flow Modelling
36
2014 | Particulate Flow Modelling
EXPERIMENTS | BUBBLE STIRRED FLOWS
Bubble stirred flows or bubbling beds are commonly known for several industrial processes in multiple fields for diverse purposes (e.g. thermal and species homogenisation).
However, the research done within this work is based on the steel production, where the hot metal desulfurization represents the main background. This process is a major step in refining hot metal and is executed as part of the converter process or within the ladle. By stirring the liquid metal utilising the upward movement of entrained bubbles the melt is homogenised and impurities are transported and accumulated within a buoyant slag layer. This induced turbulent flow is a key parameter for increasing the effectiveness of mixture while reducing negative effects like wall-erosion.
For experimental analysis the hot metal, the introduced stirring gas, and the overlaying slag are commonly substituted by a ‘cold’ system composed of water, pressurized air and a dedicated slag analogon (for example oil). This enables the usage of optical measurement techniques like Particle Image Velocimetry (PIV). Although the setup depicted in Figure 2 would imply a rather simple measurement environment, two phase flows and especially bubble columns with higher air fraction represent a complex task for global measurements. Frequently occurring problems caused by the rising bubbles are the deformation of the laser plane due to reflection/refraction, intense bubble reflection benefits blooming effects, or shadowing and occlusion phenomena to name just a few.
Since the turbulent flow field plays a significant role and proper analysis of turbulent quantities within their full spectrum is related to a high temporal and spatial resolution a multiscale setup was realised to monitor the global flow field as well as a special area of interest. The global flow field is limited in resolution due to the big dimensions and is used for analysing the overall mixing behaviour while the magnification cam acquires at higher resolution in space and time. This increase is used to depict turbulent parameters in more detail at dedicated locations of interest so these parameters can be compared with CFD results more precisely.

37
Bernhard König [email protected]|
As this project should also provide multiple data-sets for validating novel CFD models a tool for analysing both, experimental- and CFD- generated data, the same way was developed. This turbulent analysis tool (TurbAn see Fig 1) is capable of computing standard turbulent parameters like ensemble means, fluctuating velocities, kinetic energies, turbulent length and time scales, vorticity, etc. Furthermore, built in functions allows the user to check quickly for statistical convergence of the provided data, peak locking errors within PIV calculat ions, or generating visualisations of desired parameters in a static way or for time dependent analysis within a movie.
- Fig.1: Turbulent Analysis tool ( Tu r b A n ) f o r d a ta - s o u r c e independent interpretation of vector fields.
Recent efforts are made for implementing a vortex detection and trackingalgorithm to enhance the functionality even further while maintaining an ‘as simple as possible’ data presentation for fast interpretability.
Fig.2: Experimental setup with optical discrimination of multiscale image acquisition.
FMParticulate Flow Modelling
2014 | Particulate Flow Modelling
38
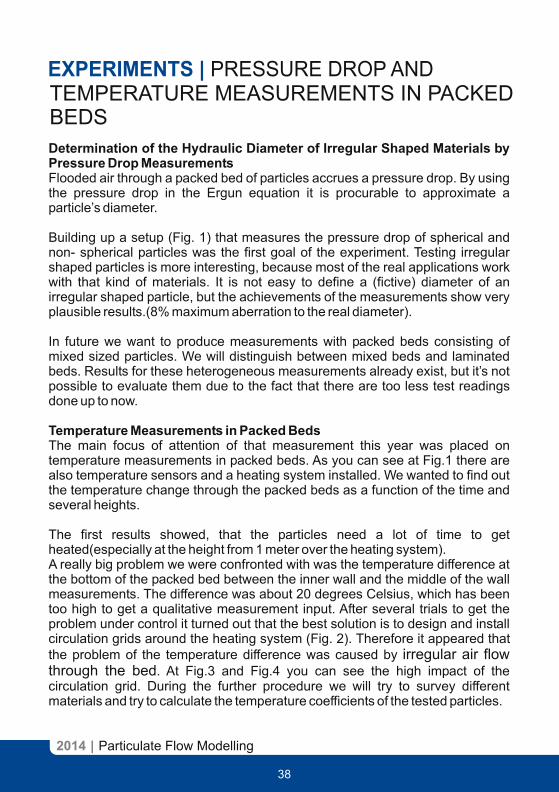
EXPERIMENTS | PRESSURE DROP AND TEMPERATURE MEASUREMENTS IN PACKED BEDS
Determination of the Hydraulic Diameter of Irregular Shaped Materials by Pressure Drop Measurements Flooded air through a packed bed of particles accrues a pressure drop. By using the pressure drop in the Ergun equation it is procurable to approximate a particle’s diameter.
Building up a setup (Fig. 1) that measures the pressure drop of spherical and non- spherical particles was the first goal of the experiment. Testing irregular shaped particles is more interesting, because most of the real applications work with that kind of materials. It is not easy to define a (fictive) diameter of an irregular shaped particle, but the achievements of the measurements show very plausible results.(8% maximum aberration to the real diameter).
In future we want to produce measurements with packed beds consisting of mixed sized particles. We will distinguish between mixed beds and laminated beds. Results for these heterogeneous measurements already exist, but it’s not possible to evaluate them due to the fact that there are too less test readings done up to now. Temperature Measurements in Packed Beds The main focus of attention of that measurement this year was placed on temperature measurements in packed beds. As you can see at Fig.1 there are also temperature sensors and a heating system installed. We wanted to find out the temperature change through the packed beds as a function of the time and several heights.
The first results showed, that the particles need a lot of time to get heated(especially at the height from 1 meter over the heating system). A really big problem we were confronted with was the temperature difference at the bottom of the packed bed between the inner wall and the middle of the wall measurements. The difference was about 20 degrees Celsius, which has been too high to get a qualitative measurement input. After several trials to get the problem under control it turned out that the best solution is to design and install circulation grids around the heating system (Fig. 2). Therefore it appeared that the problem of the temperature difference was caused by irregular air flow through the bed. At Fig.3 and Fig.4 you can see the high impact of the circulation grid. During the further procedure we will try to survey different materials and try to calculate the temperature coefficients of the tested particles.

39
Niklas Hofer [email protected]|
Fig.1: Measurement setup
Fig.3: Heat transfer measurement without circulation grid.
Fig.2: Heating system
Fig.4: Heat transfer measurement with circulation grid.
FMParticulate Flow Modelling

2014| Particulate Flow Modelling
40
EXPERIMENTS | AEROSOL DETECTION
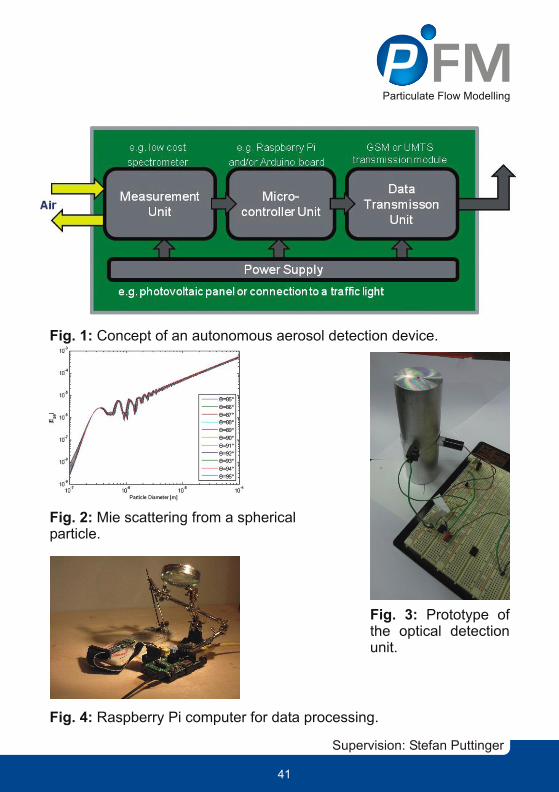
For this years seminar we decided to pick up on a topic which is relevant for society. With our experience in simulation methods and measurement techniques we had the feeling that we are able to contribute some new aspects to the problem of aerosol distribution in the environment. The seminar this year has a focus on experimental activities as we try to set up a prototype for a small autonomous measurement device, which should be able to provide local aerosol measurement data on particles in the PM10 or PM2.5 class.
These devices will be low cost so that one can install a whole swarm (let’s say 10 to 20 boxes) in an urban area with high aerosol pollution (e.g. a traffic tunnel exit or heavy traffic crossroads). This swarm of measurement devices should send their data to a central data server for further processing.
This local measurement data can then serve as an input data to a CFD model which also encounters for wind situation and building topology.
We also took the opportunity of this years topic to get in contact with the local authorities responsible for the topic of immission and emission of aerosols. It’s alwas exciting to look over the rim and get some input from fields of new applications.
41
Fig. 2: Mie scattering from a spherical particle.
Fig. 4: Raspberry Pi computer for data processing.
Supervision: Stefan Puttinger
Fig. 1: Concept of an autonomous aerosol detection device.
Fig. 3: Prototype of the optical detection unit.
FMParticulate Flow Modelling

42
2014 | Particulate Flow Modelling
OSCCAR | AN INTEGRATED SOFTWARE PLATFORM
This year our successful open source projects are taken to the next level. At the Department of Particulate Flow Modelling several open source simulation tools have been developed and are in use today, for example the DEM code LIGGGHTS and the CFD-DEM coupling module CFDEMcoupling. The use and size of our simulation tools has grown rapidly over the years, both in terms of internal use by our students and researchers, as well as external use. To continue this great success we are restructuring our simulation tool kit.
With the approval of the K1MET Competence Center an additional need for an interactive framework to share and develop our models emerged. A key part of the K1MET project is a central Simulation Platform through which up-to-date modeling tools can be exchanged and further developed between the academic and industrial partners. The Simulation Platform is named Open Source CFD Customized for Application and Research (OSCCAR).
OSCCAR is an application oriented platform, where solvers and example cases are structured according to engineering applications. For example, sets of tutorials are offered related to iron making, steel making, as well as environmental flows. In the IronMaking data base one can find example cases of iron tapping, while the SteelMaking directory contains examples on tundish flow, continuous casting and more. These example cases are offered at various levels of complexity, documented and tested for consistence in our test harness.
Fig 1: The K1MET simulation platform OSCCAR will play a central role in bringing together model development and experimental results and making tools available to academic and industrial partners.

43
Gijsbert Wierink [email protected]|
a)
b)
c)
Fig 2: Liquid steel flow in a 3D tundish simulation (a,c) compared to experimental results (a) of Odenthal, Javurek and Kirschen (2009). Steel Research 80(4), 264-274. The colour scale shows turbulence intensity.
The OSCCAR platform will officially be launched by July 2015, with the start of the new K1MET project and Competence Center. With OSCCAR we focus on code quality, consistency, work flow integration and consolidation of our past and ongoing developments. OSCCAR will be a major step forward, a step we look forward to make together with our team and partners.
Fig 3: An OSCCAR example case for three-phase iron tapping through a porous bed in our online repository.
FMParticulate Flow Modelling

2014| Particulate Flow Modelling
44
SCIENTIFIC FRIENDS | DCS COMPUTING
Since its establishment as independent company in 2012, DCS Computing is serving blue chip companies, SMEs, universities, and R&D centers across the globe. Our customers span a wide range from consumer goods, pharmaceutical, chemical, oil and gas, process, minerals and mining industries to agricultural and environmental engineering. We are proud of offering all levels of value creation to our partners which are associated to particle flow, from fundamental research to engineering consultancy.
DCS is part of 2 EU research consortia. We are extending the simulation eco-system of CFDEM®coupling and LIGGGHTS® by developing ParScale, a novel simulator for intra-particle scale transport phenomena.In the past 2 years, DCS Computing successfully completed 13 model/code development projects with 7 customers, all with focus on industrial application.We currently maintain 15 customer versions of LIGGGHTS® and CFDEM®coupling. DCS delivered ~400 hrs of technical simulation support to 9 customers so far.DCS released its first CAE product (see next page): the LIGGGHTS®workbench. In the near future, we plan to develop a CFDEM®coupling workbench. We have been holding 11 customer-specific trainings sessions over the past 3 yearsAs core developers of LIGGGHTS® and CFDEM®coupling engines, we know best about the applicability of the simulation engines. So far, DCS successfully completed 11 engineering consultancy projects with 8 customers.
www.dcs-computing.com | [email protected]

45
Consultancy
DCS has so far completed 11 full-scale industrial consultancy projects in the fields of consumer goods, chemical, agricultural engineering,plant engineering, and consumer appliances
Consultancy stimulates development of new and improvement of existing numerical models.
LIGGGHTS®Workbench
Geometry creation or import (IGES, STEP), Meshing with variety of algorithmsDEM engine LIGGGHTS®: Highly scalable efficient solver, million+ particles, arbitrarily moving meshes, wear prediction, variety of contact modelsPost-processing and data analysis Combined commercial-open source technology, lease or paid-up licenseLinux and Windows® supported, extensive support and customization available
www.dcs-computing.com | [email protected]

2014 | Particulate Flow Modelling
46
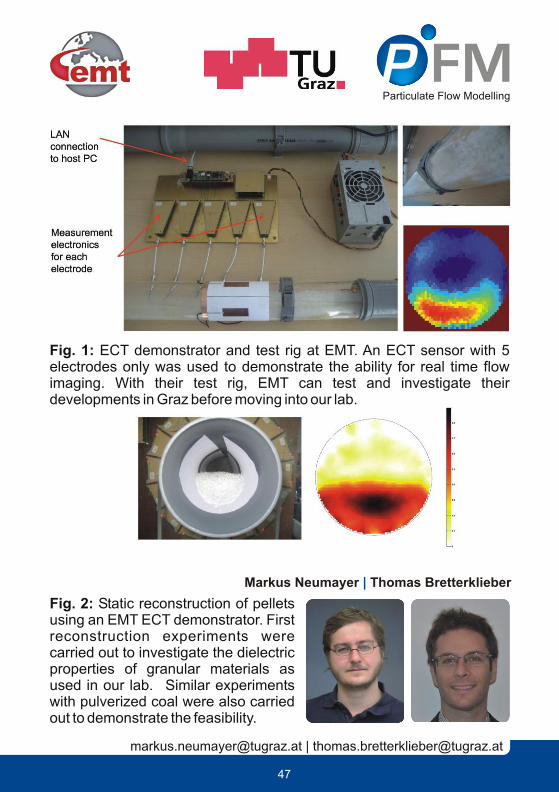
SCIENTIFIC FRIENDS | M.NEUMAYER & T. BRETTERKLIEBER | TU GRAZ
The beginning of 2014 marked also the kick-off for our collaboration with the Institute of Electrical Measurement and Measurement Signal Processing (EMT) at Graz University of Technology. EMT has a long experience in electrical capacitance tomography (ECT) including knowledge on the design of specialized measurement electronics, as well as on dedicated signal processing methods for the solution of inverse problems.
Currently the determination of the flow regime in pneumatic conveying of granular particles is solely based on pressure measurements and long time mass balancing. These methods do not provide instantaneous information about the conveying regime of time dependent mass flows, which is required for process control. ECT is a promising sensing technique that should be able to provide on-line tomographic flow images for flow regime estimation of the conveying process.
Rather than buying a commercial ready to use ECT system (which would be too inflexible for our applications), we decided to start a scientific project with EMT to develop a flexible ECT system, which should bring new 3D measurement possibilities to our lab experiments as well as providing a prototype for industrial applications.
Feasibility tests for tomographic imaging of granular flows with existing EMT hardware were successful and Markus Neumayer and Thomas Bretterklieber of the EMT demonstrated the real time functionality of ECT for flow imaging at a test rig in Graz (Figure 1 and 2).
Currently an optimized signal processing hardware is in its final design phase. The work of EMT also focuses on the development of reconstruction algorithms where a specialized ECT MATLAB toolbox is developed. A first lab prototype should be available within the first half of 2015.
47
[email protected] | [email protected]
Fig. 1: ECT demonstrator and test rig at EMT. An ECT sensor with 5 electrodes only was used to demonstrate the ability for real time flow imaging. With their test rig, EMT can test and investigate their developments in Graz before moving into our lab.
Fig. 2: Static reconstruction of pellets using an EMT ECT demonstrator. First reconstruction experiments were carried out to investigate the dielectric properties of granular materials as used in our lab. Similar experiments with pulverized coal were also carried out to demonstrate the feasibility.
Markus Neumayer Thomas Bretterklieber|
FMParticulate Flow Modelling

2014 | Particulate Flow Modelling
48
SELECTED PUBLICATION
Schneiderbauer S., Pirker S.: Filtered and heterogeneity based sub-grid modifications for gas-solid drag and solids stresses in bubbling fluidized beds, in: AIChE Journal, Volume 60, Number 3, Page(s) 839-854, 2014.
Schneiderbauer S., Pirker S.: A Coarse-Grained Two-Fluid Model for Gas-Solid Fluidized Beds, in: Journal of Computational Multiphase Flows, Volume 6, Number 1, Page(s) 29-47, 2014.
Benvenuti L., Aigner A., Queteschiner D., Pirker S., Kloss C.: Establishing the predictive capabilities of DEM simulations: sliding and rolling friction coefficients of non-spherical particles, in: CFD 2014 Proceedings, Trondheim, Norway, 2014.
Holzinger G., Pirker S., Wierink G.: Towards Simulating Flotation with OpenFOAM, in: CFD 2014 Proceedings, Trondheim, Norway, 2014.Pirker S., Seil P., Thumfart M.: Numerical simulation of secondary flow instabilities in SEN flow, in: Proc. ECCC Conference, Graz, Austria, 2014.
Puttinger S., Schneiderbauer S., von Berg L., Pirker S.: Inhomogeneous Segregation of Binary Mixtures in Fluidized Beds, in: The 7th World Congress on Particle Technology (WCPT7), Beijing, China, 2014.
Saeedipour M., Schneiderbauer S., Pirker S., Bozorgi S.: A Numerical and Experimental Study of Flow Behavior in High Pressure Die Casting, in: Proceedings of TMS, Page(s) 185-190, Orlando, US, 2014.Nasato D., Goniva C., Pirker S., Kloss C.: Coarse Graining for Large-Scale DEM Simulations of Particle Flow – An Investigation on Contact and Cohesion Models, in: Proceeding of The 7th World Congress on Particle Technology (WCPT7), Beijing, China, 2014.Soleimani A., Schneiderbauer S., Pirker S., CFD study of the gas-particle flow in a horizontal duct: the impact of the solids wall boundary conditions, Proceeding of The 7th World Congress on Particle Technology (WCPT7), Beijing, China, 2014.
Seil, P., Pirker, S., Lateral migration of finite-size particles in two-dimensional Poiseuille flow – lattice Boltzmann simulation of particle trajectories, Acta Mechanica, under review

DEPARTMENT OF PARTICULATE FLOW MODELLING