15


Positive net absorption across several office markets
in 2016 (s.f.)
Source: JLL Research
-6,000,000 -3,000,000 0 3,000,000
Calgary
Edmonton
Ottawa-Gatineau
Quebec City
Winnipeg
Halifax
Montreal
Vancouver
GTA
Institutions behind the majority of fourth quarter leasing
activity (>20,000 s.f.)
Source: JLL Research
17%
14%
14%
14%
10%
8%
7%
6%
3%3% 3% Institutions
Technology
Professional andbusiness servicesFIRE
Creative
Retail
Healthcare and LifeSciencesManufacturing
Energy and utilities
Engineering
Other
The national office market has witnessed vast variations across geographies and markets, ending the year much the way it began. The Greater Toronto Area (GTA) and Metro Vancouver markets remained in the drivers’ seat, both posting consistent positive absorption throughout the year, with Toronto in particular finishing off the year with a strong fourth quarter. Montreal’s steady economic and employment growth translated into 550,937 square feet of positive net absorption for the year. At the other end of the spectrum is Calgary which posted negative net absorption in all four quarters for a total of negative 4,004,131 square feet. Edmonton and Ottawa-Gatineau also lagged with negative net absorption in three of the last four quarters. Collectively, the national office market experienced a strong rebound in the fourth quarter with 774,768 square feet of positive net absorption. The performance in the fourth quarter wasn’t enough to offset the first three quarters as the year and the year ended with 297,964 square feet of negative net absorption. However, without Calgary’s absorption the national office market would have posted over four million square feet of net absorption in 2016 bringing it above the long term average of 3.5 million square feet ( 2007-2016).
Canada office market overview
JLL | Canada | Office Market Overview | Fourth Quarter 2016 1
Leasing ActivityDowntown office markets were again the most active, fueled by the urbanization trend and better transit-accessibility. The fight for and retention of talent is a key priority among companies, particularly in the technology sector, and as the millennial generation continues to cluster near central business districts, downtown office markets will remain the hot spot for leasing activity.
Although there were no ‘blockbuster’ deals completed in the fourth quarter, a handful of leases in the 100,000 square foot range were inked in the GTA and Montreal office markets. AMD renewed 108,000 square feet at 1 Commerce Valley Dr. E, YellowPagessecured 150,000 square feet at Le Nordelec in Montreal, and Scotia Bank renewed 139,220 square feet at 1002 SherbrookeW., also in Montreal. Institutions accounted for approximately 17 percent of leasing activity in the fourth quarter followed by Technology companies (14%) and Professional and business services (14%).
Net
abs
orpt
ion
(s.f.
)

Construction peaks in 2016 but can demand keep up?The current construction cycle reached its peak in 2016 with over 8.6 million square feet completed, of which 2.4 million were added in the fourth quarter. Three significant office towers opened their door to tenants in the fourth quarter – One York and the Globe and Mail Centre (Downtown Toronto), and Edmonton Tower (Edmonton) where the City of Edmonton will occupy nearly 400,000 square feet. All three towers were nearly 100 percent leased on completion and as such will not add significant vacant space to the inventory. There is still over 12 million square feet in the construction pipeline across Canada including Brookfield Place East (1.4 m.s.f.) in Calgary, EY Tower (900,848 s.f.) in Toronto and Stantec Tower (578,000 s.f.) in Edmonton.
Cautious and optimistic will define 2017The outlook for 2017 remains optimistic although we will see strong variations across the country. Toronto and Vancouver are expected to remain in the drivers’ seat with demand outpacing supply. Montreal ended the year with improving market conditions, which are expected to flow into 2017, fueled by businesses pursuit for talent, particularly tech talent in urban locations. Conversely, we remain cautious on Calgary and Edmonton and both markets will continue to grapple with a combination of negative economic growth and oversupply. Despite Calgary’s office market sentiment has bottomed, an estimated one million square feet of “ghost space” (unoccupied but not marketed) office space in addition to new inventory will keep any market improvements in check for some time.
Canada total construction completions by year (s.f.)
Source: JLL Research
0
2,000,000
4,000,000
6,000,000
8,000,000
10,000,000
2013 2014 2015 2016 F2017 F2018
Few large blocks in Downtown Vancouver and Toronto In downtown Toronto and Vancouver, robust demand and a limited development pipeline have caused the number of available large blocks to diminish rapidly. In downtown Toronto, the number of large blocks (>100,000 s.f.) available has fallen from seventeen over the last twelve months, to the current seven while in Vancouver only two blocks were available for lease at the end of the quarter. With continued strong demand and no new large office developments announced in 2016, this number is expected to contract further. For the suburban market, the silver lining will lie in properties who can offer large contiguous blocks of space with excellent transit-accessibility and modern amenities. Whether this will create significant activity remains to be seen - but it is highly likely that companies will increasingly consider a dual option and house some of their operations in suburban markets until new product is made available downtown.
Vacancy continues to rise The Canadian office market has seen a consistent rise in vacancy rates and the fourth quarter was no exception. Total vacancy climbed to 12.1 percent, a 20 basis point increase from the previous quarter and a 500 basis point increase from the cyclical low reached in Q3 2012 (7.1%). Nationally, the sustained rise has been driven primarily by a sizeable amount of new supply added during the last phase of the current construction cycle. In addition as the Calgary and Edmonton office markets continue to feel the effects of a weakened economy in Alberta, their vacancy rates have reached 20.9 and 15.2 percent respectively, further contributing to the rise in the national vacancy rate.
JLL | Canada | Office Market Overview | Fourth Quarter 2016 2
Downtown vacancy rates across office markets
Source: JLL Research
6.9%
8.7%
9.8%
17.2%
21.1%
8.3%
GTA
Ottawa
Montreal
Edmonton
Calgary
Vancouver
Tot
al V
acan
cy (%
)
Canada office market overview cont.
Forecast
Squ
are
feet

Demand for office space expected to increase across
service sectors (Jan-Dec +2.6%)
The national labour market posted gains in 2016 as employment increased by 1.2 percent on a yearly basis and the workforce bulked up by 214,100 net new jobs, the strongest results for annual job growth since 2012. Canada beat economists’ expectations in December by adding 53,700 jobs. On a yearly basis, employment increased by 2.0 percent in the service sector, while it declined by 1.6 percent in the goods-producing sector. The goods-producing sector was hardest hit by a decline in the natural resources sector (oil and gas extraction, mining, quarrying and forestry), down 8.3 percent on a yearly basis. The mixed story is expected to produce an annual GDP of 1.8 to 2.0 percent for 2016. Office demand increased across several markets as employment in the information, culture and recreation industry rose by 6.5 percent on a yearly basis. We have noticed an upward trend in this industry and expect it to continue further in 2017.
Employment in public administration increased by 3.9 percent on a yearly basis in Quebec, Alberta and Saskatchewan. With more and more people being employed in finance, insurance, real estate, rental and leasing, up 3.5 percent on a yearly basis, we expect demand for office space to increase in 2017.
0
1,000
2,000
3,000
4,000
5,000
Jan Feb Mar Apr May Jun Jul Aug Sep Oct Nov Dec
Business, building and other support services
Professional, scientific and technical services
Public administration
Information, culture and recreation
Finance, insurance, real estate, rental and leasing
In 2016, British Columbia recorded the fastest employment growth rate among the provinces for a second consecutive year, up 3.1 percent. The gains were across industries and we foresee more demand for office space ahead as employment in the province has been trending upward since spring 2015. Quebec posted employment gains of 2.2 percent followed by Ontario, up 1.2 percent. As expected in Alberta, employment fell by 0.8 percent on a yearly basis due to a slowdown in the economy. Apart from Alberta, we note that the growth in employment is across industries and with unemployment rates decreasing further across provinces, we expect the demand for office space to increase ahead.
Canada posted a trade surplus of $526 million in November, its first in more than two years, as exports jumped and imports posted a modest gain. Exports rose 4.3 percent, mostly due to an increase in sales of metal and non-metallic mineral products and record exports to countries other than the United States. Exports to countries other than the U.S. increased 9.5 percent to hit a record $12 billion, beating the previous record set in December 2011. Imports increased by 0.7 percent in November as Canada brought in more energy products.
Federal measures to tighten mortgage eligibility rules, soft income growth and the upswing in interest rates after the US presidential election suggest that the housing sector might provide less support to the economy in coming quarters. Housing starts in Canada decreased to a seasonally adjusted annualized rate of 183,989 units in November 2016 (compared to 212,271 units in 2015) from a downwardly revised 192,297 units in October and below market expectations of 191,200. Urban starts decreased in Ontario, Quebec and in Atlantic Canada, but increased in British Columbia and in the Prairies.
The Bank of Canada held its overnight rate at 0.5 percent at the end of 2016. The Bank of Canada estimates that the economy is on course to grow a little over 2 percent in 2017. While uncertainty in the economy persists, which the Bank acknowledges, and until a major downside risk materializes, we foresee a healthy demand for office space in 2017 across most markets.
JLL | Canada | Office Market Overview | Fourth Quarter 2016 3
Canada economic overview
Em
ploy
men
t (‘0
00)
Source: Statistics Canada, JLL Research

Toronto
Calgary, Edmonton
Reading the clock
JLL’s office clock demonstrates where each market sits within its real
estate cycle. Markets generally move clockwise around the clock.
Geographies on the left side of the clock are generally landlord-
favourable, while markets on the right side of the clock are typically
tenant-favourable.
In the fourth quarter the majority of office markets found themselves
nearing the bottoming face of the property clock indicating that rents fall
at a slower rate (or remain) below level that supports replacement cost
and approach cyclical lows. Vancouver and Toronto, on the other hand,
are in the rising and peaking market quadrant indicating sustained
strong demand, vacancy below equilibrium levels and rising rents.
Canadian Office property clock
JLL | Canada | Office Market Overview | Fourth Quarter 2016 4
Nationally, the overall asking net rent increased slightly to reach $18.17
per square foot, up 0.4 percent quarter-over-quarter but down 3.0
percent year-over-year. Downtown Toronto saw the largest increase
among the major markets with average Class A rents up 3.0 percent the
fourth quarter to reach $29.41 per square foot. The downtown Toronto
market continues to defy expectations and strong demand is forcing
tenants to act quickly to secure the few quality options left. In turn,
landlords are increasing their asking rents, a trend that is expected to
continue in 2017 as opportunities will only become scarcer.
The dramatic drop in Downtown Calgary’s rents slowed in the fourth
quarter down ‘only’ 1.0 percent from the third quarter to $19.36 per
square foot.
Montreal, Winnipeg
Vancouver
Peaking
phase
Falling
phase
Rising
phase
Bottoming
phase
Halifax
Ottawa
Quebec city

Economic Fundamentals
Toronto’s economy continues to perform, currently being the second fastest
growing metropolitan area in Canada, with real output projected to expand 3.4
percent in 2016, and 2.6 percent in 2017, according to the Conference Board of
Canada. Office-using employment is projected to remain stable in 2017,
declining 0.5 percent, yet expanding 2.7 percent in 2018, driven primarily by the
professional services, finance, and insurance employment groups.
Amid strong absorption and declining availability, rents experience bump
At time of delivery this quarter, One York and the Globe and Mail Centre were
100 percent and 98 percent preleased, respectively. However, although the
downtown Toronto market has seen approximately 2.3 million square feet (3.1%
of market inventory) of office space delivered this past year, putting upward
pressure on the vacancy rate, the availability rate (for existing and under
construction properties) has moved in the opposite direction – currently
approaching five-year lows, at 8.7 percent. The reason is two-fold: firstly, strong
fourth quarter net absorption of 549,110 square feet (as well as strong absorption
in the 12 quarters prior), and, secondly, due to a marginal development pipeline
for 2017-2019. This quarter, landlords have responded to this environment by
increasing rental rates. Having remained largely unchanged for the first three
quarters of 2016, rates have experienced a sizable bump this past quarter, with
Downtown Class A net rents rising 4.0 percent year-over-year and Downtown
Class B net rents rising 6.8 percent year-over-year. We expect this trend to
persist into the next two years, as EY Tower is the last large (>500,000 s.f.)
project awaiting delivery until 2020.
Class B, the star performer of 2016
While the “flight to quality” trend has undoubtedly shaped much of the Downtown
office market over the last few years, Class B properties have resurfaced this
year. Some landlords have been focused on repositioning these assets, keen to
attract rapidly growing tech and various creative firms. A contrasting strategy
pursued by others has been to attract government ministries with large
contiguous space requirements at below market rents. In both cases, Class B
properties have performed well, posting +335,000 square feet of absorption this
year (~2 percent of market stock), their strongest performance in five years.
Meanwhile, Class B vacancy rates are consistently amongst the lowest on the
submarket level, posting an impressive 4.2 percent vacancy rate for Downtown
Toronto overall.
Availability rate falls with no major supply after EY Tower
Source: JLL Research
Overall asking net rent growth across submarkets
Source: JLL Research
Large block availability is limited compared with past years
Source: JLL Research
Tenants face increasing pressure down the road
2417
7
0
5
10
15
20
25
30
2014 Q4 2015 Q4 2016 Q4
# of
blo
cks
>10
0,00
0 s.
f.
Downtown Toronto
74,589,463Total inventory (s.f.)
549,110Q4 2016 net absorption (s.f.)
$29.41Class A asking net rent
2,506,639Total under construction (s.f.)
6.9%Total vacancy
1,053,980YTD net absorption (s.f.)
4.0%Class A net rent growth (y-o-y)
57.0% Total preleased
7.0%8.0%9.0%
10.0%11.0%12.0%13.0%14.0%
Ava
ilab
ility
Rat
e
(Existing and Under Construction Properties)
$28.77
$25.51
$19.70
$29.48
$25.93
$21.36
$18.00
$21.00
$24.00
$27.00
$30.00
Financial Core Downtown West Downtown North
2015 Q4
2016 Q4
JLL | Canada | Office Market Overview | Fourth Quarter 2016 5

Suburban GTA net absorption by class since 2012
Source: JLL Research
Net absorption - Suburban vs. Downtown
Source: JLL Research
Average gross asking rent - Suburban vs. Downtown
Source: JLL Research
-500,000
-250,000
0
250,000
500,000
750,000
1,000,000
2012 2013 2014 2015 2016
Class A Class B Class C
Improving fundamentals lead to pre-recession absorption levels.
The suburban GTA saw 694,383 square feet of positive net absorption in the
fourth quarter and 1,506,013 square feet of positive net absorption for the year.
This is the strongest annual net absorption seen since 2008 and has helped push
vacancy from a cyclical peak of 14.1 percent down to 13.3 percent. The GTA
West which contributed to most of the Q4 absorption saw vacancy drop 140 basis
points to 15.5 percent since last quarter. Major GTA West occupancies this
quarter include Scotiabank that took the BlackBerry vacancy at Tahoe Boulevard,
Technical Standards & Safety Authority at 345 Carlingview Drive and SNC-
Lavalin at 2251 Speakman Drive. Additionally KPMG occupied their tower at
Vaughan Metropolitan Centre.
Are suburban tenants leaving for downtown?
As office tenants are increasingly looking for transit accessible space close to the
millennial population there have been some high profile movers out of the suburbs
to downtown including Apple, YellowPages, Nike and Capitol One. However, as
absorption numbers indicate, most suburban tenants have either been renewing,
moving within the suburbs or even expanding their footprint in the suburban
Toronto office market. This past quarter GM has expanded their commitment to
over 150,000 square feet of net new space at 101 McNabb and Home Depot
renewed and expanded their presence to a total of 128,000 square feet at 1
Concorde Gate. At Vaughan Metropolitan Centre KPMG has opened their
Vaughan office contributing to growth in their overall suburban presence while
PwC will be expanding their current Vaughan presence when they move into
90,000 square feet at VMC phase two in Q4 2019. GFL Environmental, currently
located in an industrial building, signed a lease at the KPMG tower which will also
contribute to positive net absorption within the office market.
Will large corporate tenants increasingly use dual locations?
Low vacancy, rising rents and a limited development pipeline are significant
constraints for downtown tenants looking for additional space. Recent leasing by
KPMG, PwC, Scotiabank and TD all represent large downtown headquartered
companies taking advantage of the lower costs, significant available space and a
shorter cycle for new development in the suburbs. With the major downtown
developments for 2017/2018 largely pre-leased large downtown tenants will likely
continue to look for suburban space to house some of their operations.
$28.75 vs. $50.70
Suburban Toronto
88,715,690Total inventory (s.f.)
694,383Q4 2016 net absorption (s.f.)
$14.80Average asking net rent
1,053,881Total under construction (s.f.)
13.3%Total vacancy
1,506,0132016 net absorption (s.f.)
3.7%12-month gross rent growth
47.0% Total preleased
-500,000
0
500,000
1,000,000
1,500,000
2,000,000
2011 2012 2013 2014 2015 2016
Suburban GTA Downtown Toronto
Suburban Downtown
Suburban office fundamentals improve
JLL | Canada | Office Market Overview | Fourth Quarter 2016 6

Economic Fundamentals
Following a period of lackluster economic growth, Ottawa and Gatineau’s
economy is beginning to show signs of rejuvenation. Preliminary figures by the
Conference Board of Canada indicate output growing 1.6 percent in 2016, and a
projected 1.7 percent in 2017. Meanwhile, much-awaited increases in fiscal
spending and hiring by the federal government are expected to provide an
increase in public administration employment of 1.4 percent in 2017, after a
minor gain of 0.6 percent in 2016 and consecutive decline the three years prior.
Furthermore, office-using employment is expected to rise 1.9 percent which
bodes well for office leasing activity.
Market awaits effects of federal hiring
While Ottawa’s economy is showing signs of awakening, the office market
continues to idle. After an uneventful fourth quarter, downtown Ottawa vacancy
remains relatively unchanged at 10.2 percent, while overall downtown asking
net rents stand at $17.67 per square foot, relatively unchanged over the third
quarter but down 2.9 percent year-over-year. As tenant-favourable conditions
persist, government agencies have been particularly aggressive on their
renewals. They have yet to be aggressive in expanding their footprint, however,
predominantly focusing on reducing their footprint through ‘workplace 2.0’. As
hiring activity picks up in the public sector in the coming year, the market will be
awaiting news of potential relocations.
Downtown Class A market marches to the beat of its own drummer
As Ottawa-Gatineau’s office market has continued to soften, the downtown
Class A market has proven resilient, particularly among the high-end Class A
properties. Renewals and tenants ‘flight-to-quality’ has kept the vacancy rate in
check and in fact decreased slightly from a high of 8.7 percent in Q3 2012, to
the current 7.0 percent. In contrast to Class B and C properties, which have
continued to experience negative absorption, Class A absorption and rents have
remained flat in 2016. Furthermore, there are signs of change at the top end of
the Class A market, as indicated by a reduction in inducements offered by
certain landlords, resulting in a minor rise to the net effective rent on final deals.
-300,000
-200,000
-100,000
0
100,000
200,000
Downtown Gatineau Suburbs
Ann
ual A
bsor
ptio
n (s
f) Class A Class B & C
43,532,305Total inventory (s.f.)
-144,948Q4 2016 net absorption (s.f.)
$15.69Average asking net rent
480,778Total under construction (s.f.)
10.9%Total vacancy rate
-291,7162016 net absorption (s.f.)
-0.8%12-month rent growth
52.9% Total preleased
Downtown Class A vacancy rate
Source: JLL Research, Altus Insite
Annual net absorption figures vary across the board
Source: Altus Insite
Class A average asking net rents by submarket (p.s.f.)
Source: JLL Research
2,257
8.1%
6.5% 6.3% 6.3% 6.4%7.1% 6.8% 6.4% 6.5% 7.0% 7.0%
0.0%
2.0%
4.0%
6.0%
8.0%
10.0%
$24.63Downtown
Ottawa and Gatineau
$17.50Gatineau
$15.72Suburbs
A quiet quarter in Ottawa to end the year
JLL | Canada | Office Market Overview | Fourth Quarter 2016 7

2016 ends with accelerated positive absorption
Available sublease space by tenant industry
Source: JLL Research
Vacant LEED certified space in Downtown Montreal
Source: JLL Research
Percentage change in occupied area through 2016
Source: JLL Research
Unemployment rate hit five year low
The unemployment rate in the GMA has dropped for a third consecutive quarter to
reach 8.1 percent, accelerated by the growth trend seen in the labour market. In
the last year, the unemployment rate has dropped by 230 basis point to fall below
9.0 percent for the first time in five years. The recent sustained positive
momentum in the labour market has helped total available sublease space fall
below 1.0 million square feet for the first time since Q3 2011.
Strong leasing momentum in 2016 slows rising vacancy across the GMA
The office leasing market is beginning to reap the benefits from the improving
labour market with total net absorption in 2016 reaching 550,937 square feet. This
notable increase represents the largest annual office leasing demand gain in the
GMA since the end of 2012. Two large notable transactions this quarter in the
downtown submarket include the relocation of Ernst & Young and the TMX Group.
Both tenants are vacating approximately 190,000 square feet of second
generation class A space to lease 143,000 square feet of brand new LEED
certified AAA space at the Deloitte and Manulife Towers. The moves by these two
large organizations represent nearly a 25 percent space optimization and is a
perfect example of the space utilization trend seen in markets across Canada.
That being said, new construction and building conversion activity remained high
this year with over 1.0 million square feet of space being added to the market
inventory. All the available space added from new construction and building
conversions in 2016 was in the Midtown and Suburban submarkets. The supply
and demand dynamics observed in the GMA for 2016 have significantly tempered
the increase in total vacancy. Following its smallest annual increase since 2011,
the total vacancy rate has inched upwards only 30 basis points year-over-year to
reach 12.9 percent.
Outlook remains favourable for tenants with large office space requirements
Although market conditions have improved in the last 12 months, the total amount
of available space across the GMA remains historically high. In fact, the current
total vacancy rate of 12.9 percent is 320 basis points above the 10 year market
average of 9.7 percent. We anticipate tenant favourable market conditions up to
the end of 2017 or until the market posts at least four quarters of strong
consecutive positive net absorption.
0.1%
1.0%
1.3%
Downtown
Midtown
Suburban
31.9%
13.4%
12.1%
11.8%
11.0%
19.8%Logistics, Aerospace & Transportation
Public Institutions
Professional Services & Consumer Goods
Technology
Engineering & Resources
Others
Montréal
1,035,598 s.f.in a total of 16 buildings / 17% of all vacant space
96,856,268Total inventory (s.f.)
637,324Q4 2016 net absorption (s.f.)
$14.84Average asking net rent
1,534,048Total under construction (s.f.)
12.9%Total vacancy
550,9372016 net absorption (s.f.)
0.7%12-month rent growth
68.7% Total preleased
JLL | Canada | Office Market Overview | Fourth Quarter 2016 8

L’année 2016 prend fin avec une accélération de
l’absorption positive
Espaces disponible en sous-location par secteur d’activité
Source: JLL Recherche
Espaces LEED inoccupés au centre-ville
Source: JLL Recherche
Changement des espaces occupés en 2016
Source: JLL Recherche
Le taux de chômage a atteint son plus bas niveau en cinq ans
Le taux de chômage a chuté pour un troisième trimestre consécutif dans la Grande
région de Montréal (GRM), pour atteindre 8,1 pour cent, en raison de la croissance
tendancielle observée sur le marché du travail. Au cours de la dernière année, le taux de
chômage a chuté de 230 points de base, pour glisser sous le seuil de 9,0 pour cent pour
la première fois en cinq ans. Le dynamisme soutenu du marché du travail que l’on
constate depuis peu a également entrainé une diminution de l'espace disponible en sous-
location, qui a chuté sous le million de pieds carrés pour la première fois depuis le
troisième trimestre de 2011.
En 2016, le dynamisme de l’activité de location a freiné l'augmentation du taux
d’inoccupation dans l'ensemble de la GRM
Le marché de la location des espaces de bureaux commence à bénéficier de
l'amélioration du marché du travail. De fait, en 2016, l’absorption nette totale a atteint 550
937 pieds carrés. Cette hausse substantielle représente la plus importante augmentation
annuelle de la demande pour les espaces de bureaux dans la GRM depuis la fin de 2012.
Deux transactions se sont démarquées, au cours du dernier trimestre, dans le sous-
marché du Centre-Ville : celles d’Ernst & Young et du Groupe TMX, qui ont choisi de
nouveaux locaux. En effet, ces deux locataires libèreront environ 190 000 pieds carrés
d'espace de catégorie A de deuxième génération pour louer 143 000 pieds carrés
d'espace neuf de catégorie AAA, certifié LEED, dans les tours Deloitte et Manuvie. Pour
ces deux grandes entreprises, emménager dans de nouveaux locaux représente une
optimisation d'espace de près de 25,0 pour cent, ce qui constitue un parfait exemple des
tendances observées dans les marchés canadiens, en matière d’utilisation d’espace.
Ceci étant dit, les activités de construction neuve et de conversion d’immeubles sont
demeurées vigoureuses cette année. En effet, plus d’un million de pieds carrés d’espace
a été ajouté à l’inventaire du marché. La totalité de l'espace disponible ajouté en 2016 par
les nouvelles constructions et les conversions d’immeubles se trouve dans les sous-
marchés du Centre-de-l’île et de la banlieue. La dynamique de l'offre et de la demande
observée en 2016 dans la GRM a sensiblement ralenti l'augmentation de la quantité
d’espace inoccupé. Suite à sa plus faible augmentation annuelle depuis 2011, le taux
d'inoccupation total n'a progressé que de 30 points de base par rapport à l'année
précédente, pour atteindre 12,9 pour cent.
Les perspectives demeurent favorables pour les locataires ayant d’importants
besoins d’espace de bureaux
Bien que les conditions du marché se soient améliorées au cours des 12 derniers mois,
la quantité totale d'espace disponible dans l'ensemble de la GRM demeure
historiquement élevée. En fait, le taux d’inoccupation total actuel de 12,9 pour cent
surpasse de 3,2 pour cent la moyenne des dix dernières années, qui est de 9,7 pour
cent. Nous prévoyons que les conditions du marché demeureront favorables aux
locataires jusqu'à la fin de 2017, ou jusqu'à ce que le marché affiche au moins quatre
trimestres consécutifs de forte absorption nette positive.
0,1 %
1,0 %
1,3 %
Centre-ville
Centre-de-l'île
Banlieue
31,9%
13,4%
12,1%
11,8%
11,0%
19,8%Logistique, eéroespace et transport
Institutions publiques
Services professionnels
Technologie de l'information
Ingénieurie et ressources
Autres
Montréal
1 035 598 pi2
dans 16 immeubles / 17 % des espace inoccupés
96 856 268Inventaire total (pi²)
637 324Absorption nette T4 2016 (pi²)
14,84 $Loyer net moyen demandé
1 534 048En construction (pi²)
12,9 %Taux d’innocupation global
550 937Absorption nette 2016 (pi²)
0,7 %Changement en %
des loyers globaux sur 12 mois
68,7 % Pré-loué
JLL | Canada | Office Market Overview | Fourth Quarter 2016 9
25,129854Total inventory (s.f.)
-391,379YTD 2016 net absorption (s.f.)
$19.50Direct average asking net rent
802,306Total under construction (s.f.)
15.2%Total vacancy
37,365Q4 2016 net absorption (s.f.)
-8.3%12-month net rent growth
88.7% Total preleased
4.7%4.6%
8.7%
9.3%7.4%
7.7%6.1%
6.7%
9.9%9.6%
4%
6%
8%
10%
12%
Edmonton
6.9% 7.0%7.7% 7.4%7.1%
7.9%8.5% 8.5%
7.1% 6.8% 7.0% 6.9%
0.00%
5.00%
10.00%
Q1 2016 Q2 2016 Q3 2016 Q4 2016
Edmonton Alberta Canada
10.2%
10.7%
12.5%
15.2%
4% 6% 8% 10% 12% 14% 16%
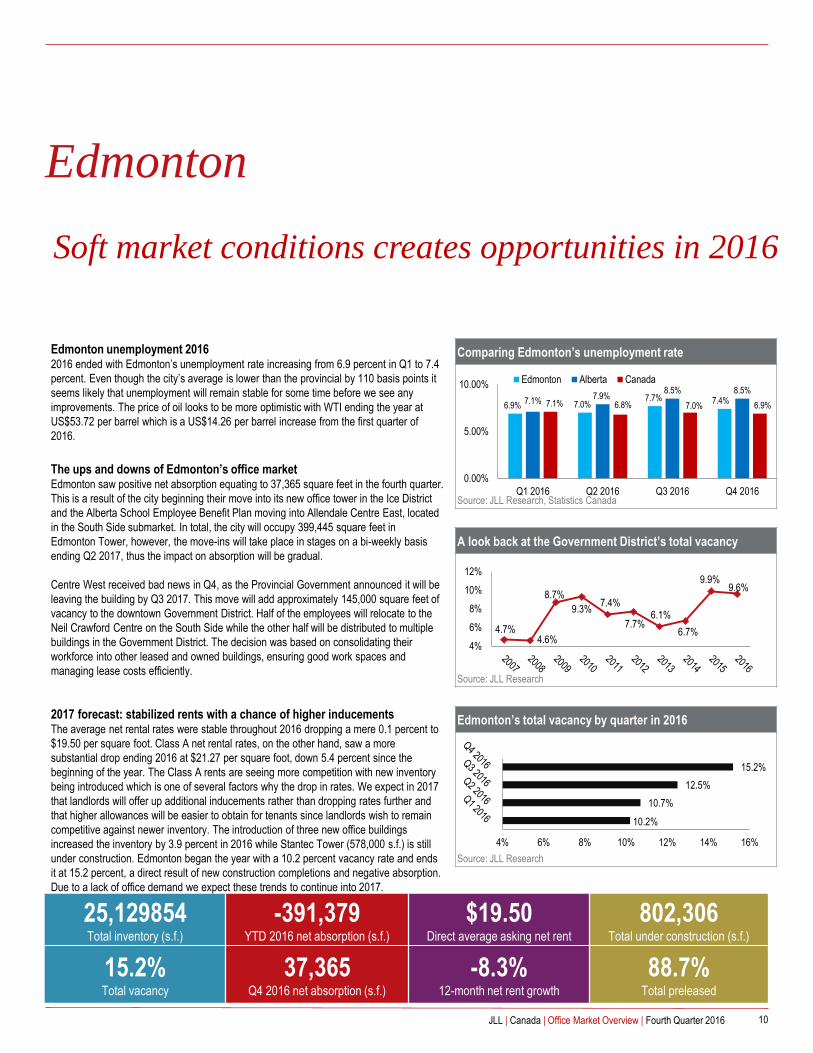
Comparing Edmonton’s unemployment rate
Source: JLL Research, Statistics Canada
A look back at the Government District’s total vacancy
Source: JLL Research
Edmonton’s total vacancy by quarter in 2016
Source: JLL Research
Edmonton unemployment 20162016 ended with Edmonton’s unemployment rate increasing from 6.9 percent in Q1 to 7.4
percent. Even though the city’s average is lower than the provincial by 110 basis points it
seems likely that unemployment will remain stable for some time before we see any
improvements. The price of oil looks to be more optimistic with WTI ending the year at
US$53.72 per barrel which is a US$14.26 per barrel increase from the first quarter of
2016.
The ups and downs of Edmonton’s office marketEdmonton saw positive net absorption equating to 37,365 square feet in the fourth quarter.
This is a result of the city beginning their move into its new office tower in the Ice District
and the Alberta School Employee Benefit Plan moving into Allendale Centre East, located
in the South Side submarket. In total, the city will occupy 399,445 square feet in
Edmonton Tower, however, the move-ins will take place in stages on a bi-weekly basis
ending Q2 2017, thus the impact on absorption will be gradual.
Centre West received bad news in Q4, as the Provincial Government announced it will be
leaving the building by Q3 2017. This move will add approximately 145,000 square feet of
vacancy to the downtown Government District. Half of the employees will relocate to the
Neil Crawford Centre on the South Side while the other half will be distributed to multiple
buildings in the Government District. The decision was based on consolidating their
workforce into other leased and owned buildings, ensuring good work spaces and
managing lease costs efficiently.
2017 forecast: stabilized rents with a chance of higher inducementsThe average net rental rates were stable throughout 2016 dropping a mere 0.1 percent to
$19.50 per square foot. Class A net rental rates, on the other hand, saw a more
substantial drop ending 2016 at $21.27 per square foot, down 5.4 percent since the
beginning of the year. The Class A rents are seeing more competition with new inventory
being introduced which is one of several factors why the drop in rates. We expect in 2017
that landlords will offer up additional inducements rather than dropping rates further and
that higher allowances will be easier to obtain for tenants since landlords wish to remain
competitive against newer inventory. The introduction of three new office buildings
increased the inventory by 3.9 percent in 2016 while Stantec Tower (578,000 s.f.) is still
under construction. Edmonton began the year with a 10.2 percent vacancy rate and ends
it at 15.2 percent, a direct result of new construction completions and negative absorption.
Due to a lack of office demand we expect these trends to continue into 2017.
Soft market conditions creates opportunities in 2016
JLL | Canada | Office Market Overview | Fourth Quarter 2016 10

Status quo for downtown Calgary in Q4 2016
As 2016 draws to a close, the downward trend continued for Calgary’s office
market. Over the last year, vacancy has increased quarter over quarter, with Q4 no
exception. Vacancy increased 80 basis points to 21.1 percent while the availability
rate reached a new high of 25.1 percent, an increase of 160 basis points from Q3
(vacancy is office space that can be occupied immediately, while availability is
space that can be occupied within the next 6 months). Now, one in every four floors
sits vacant in downtown Calgary, with most industry pundits estimating total
vacancy to be upwards of 30 percent due to “ghost space” that has not been placed
onto the market. Net rental rates declined 11.4 percent through 2016 with the
average net rental rates declining to $16.70 per square foot across the market. New
subleases added by Cenovus Energy Inc., Canadian Natural Resources Limited
and Keywest Projects Ltd. propelled another quarter of negative net absorption
despite a recent uptick in leasing activity. Downtown Calgary has now seen ten
consecutive quarters of negative net absorption and market sentiment from tenants
and landlords is that the market has now reached bottom, or, at the very least any
new addition to current market supply is simply “piling on” the already high vacant
office space that exists.9
More of the bottom to come in 2017
Market sentiment has bottomed with no expected rebound to occur for quite some
time. The current level of high vacancy coupled with an estimated 1 million square
feet of “ghost space”, space that is unoccupied but not being marketed, plus new
inventory will delay any movement in vacancy. This effect will further prevent
bottoming net rental rates from climbing upward any time soon. The result will be a
sustained tenant-favourable market. On the flip side, it’s not all bad news of high
vacancy and low rental rates for landlords. Recently the market has been active
across both downtown and suburban markets, due to a “flight to quality” by tenants.
M&A activity on the watch for 2017
Although the energy industry is forecasted to stabilize in 2017, the downtown
Calgary office market remains unpredictable. The potential always exists for a large
downtown tenant to add several hundred thousand square feet to the market at any
given time, whether through M&A activity or other means. Only time will tell when
the market conditions truly begin to change course.
Total availability rate increases
Source: JLL Research
Average Class AA/A & Class B asking gross rents
Source: JLL Research
New Supply, Absorption and Vacancy
25.1%Availability rate Q4 2016
42,261,629Total inventory (s.f.)
-891,328Q4 2016 net absorption (s.f.)
$19.36Average Class A asking net rent
2,361,753Total under construction (s.f.)
21.1%Total vacancy
-3,080,311YTD net absorption (s.f.)
-11.4%12-month overall net rent growth
66.1% Total preleased (excl. option space)
$29.53
$30.21
$32.18
$42.19
$38.16
$37.29
Centre Core
East Core
West Core
Class AA/A
Class B
Downtown Calgary
0.00%
10.00%
20.00%
30.00%
(4,000,000)
(2,000,000)
-
2,000,000
4,000,000
2010 2012 2014 2016
New Supply Net Absorption Vacancy
2016, The Year of the Bottom?
JLL | Canada | Office Market Overview | Fourth Quarter 2016 11

56,706,356 Total inventory (s.f.)
255,854Q4 2016 net absorption (s.f.)
$25.25Average asking net rent
1,710,229Total under construction (s.f.)
10.5%Total vacancy
1,255,9562016 net absorption (s.f.)
3.6%12-month rent growth
42.3% Total preleased
Downtown Core Class A/AAA vacancy rate
Source: JLL Research
Sublease availabilities by square footage in Downtown Core
Source: JLL Research
Suburban office vacancy
Source: JLL Research
Steady demand for sublease and headlease space in Downtown Vancouver
Downtown Vancouver had a strong finish to 2016, as vacancy continued to fall,
ending the year at 8.3 percent. The only two buildings to be delivered in 2016 were
completed in the fourth quarter, with the TELUS Podium and 510 Seymour both
ready for tenant fixturing. Once previously spoken for, 510 Seymour Street and 89
West Georgia now have multiple floors back available for lease. Downtown
absorption in the fourth quarter was 83,219 square feet, and substantial sublease
activity was a contributing factor in the dropping vacancy rate. Lululemon took
occupancy of 23,000 square feet at 855 Homer Street, Lumerical Computational
Solutions secured a 10,000 square foot sublease at 1095 West Pender and
ONEPLUS International Corp secured a 10,000 square foot sublease at 1055
West Georgia Street.
Other activity includes Sophos securing three floors (46,000 square feet) in 777
Dunsmuir, relocating from 580 Granville Street and Trez Capital securing the
majority of the final remaining floor in 745 Thurlow Street.
Many sizeable deals occur in the Vancouver Periphery area
The Vancouver Periphery region experienced substantial leasing activity in the
fourth quarter, however delayed occupancy and two new deliveries to the market
has caused a temporary increase in the vacancy rate from 11.1 percent to 12.1
percent. Columbia College will expand by 19,000 square feet into 333 Terminal
Avenue and the Pacific News Group will be relocating from 200 Granville Street to
Broadway Tech Centre in Q2 2017. BC Safety Authority is Renfrew Centre’s first
tenant, and will be occupying floors six and seven (52,000 square feet) in the
second quarter of 2017.
Strong performances among all suburbs in fourth quarter
The suburban market experienced strong tenant growth during the fourth quarter,
with the overall vacancy rate falling 320 basis points to 12.3 percent. The largest
drop in vacancy occurred in the Tri-Cities market, as a result of occupancy in the
new Suter Brook Village. Notable deals include PCL Construction expanding by
11,000 square feet at Crestwood Corporate Centre in Richmond, Peter Kiewit
expanding by 9,200 square feet at Willingdon Park, Phase 8 and Travelers
Insurance expanding by 15,000 square feet at 4180 Lougheed Highway.
2,257
9.0%Sublease activity pushes down
vacancy rate from 9.6%
Metro Vancouver
17.2%
20.1%
17.6%
13.3%
12.1%
7.5%
5.2%
Tri Cities
Surrey
New Westminster
Langley
Burnaby
Richmond
North Vancouver
3411
111
1 - 5,000 s.f.
5,001 - 10,000 s.f.
10,001 - 20,000 s.f..
20,001 + s.f.
Strong tenant activity continues to fuel absorption
JLL | Canada | Office Market Overview | Fourth Quarter 2016 12

Market Inventory (s.f.) Quarterly total
net absorption
(s.f., including
subleases)
YTD total net
absorption
(s.f., including
subleases)
YTD total net
absorption
(% of inventory)
Total vacancy
(%)
Average gross
marketed rent
($ PSF)*
Under
construction
(s.f.)
Quebec City 19,075,423 -36,309 -99,002 -0.5% 8.6% $22.44 -
Downtown 'A' 2,336,212 25,445 27,046 1.2% 7.9% $26.90 -
Ottawa-Gatineau 43,532,305 -144,948 -291,716 -0.7% 10.9% $31.97 480,778
Downtown 'A' 9,734,718 -2,971 -24,496 -0.3% 7.0% $47.75 65,000
Calgary 68,384,205 -1,262,324 -4,004,131 -5.9% 20.9% $33.33 2,841,883
Downtown 'A' 31,134,0681 -91,018 -1,990,891 -6.4% 18.6% $41.19 2,361,753
Edmonton 25,129,854 37,365 -391,379 -1.6% 15.2% $35.87 802,306
Downtown ‘A’ 12,238,382 87,381 -237,512 -1.9% 18.2% $40.85 578,000
Vancouver 56,612,667 255,854 1,255,956 2.2% 10.5% $40.50 1,710,229
Downtown 'A' 15,198,924 78,722 418,913 2.8% 8.8% $56.07 510,597
Toronto 179,336,499 1,249,173 2,660,623 1.5% 9.9% $33.49 3,560,520
Downtown 'A' 49,000,489 489,828 779,673 1.6% 8.2% $56.16 2,386,639
Winnipeg 11,424,820 54,786 173,188 1.5% 8.8% $24.99 381,709
Downtown 'A' 3,692,147 13,725 54,046 1.5% 5.4% $31.49 350,134
Montreal 96,856,268 637,324 550,937 0.6% 12.9% $29.42 1,534,048
Downtown 'A' 24,593,773 257,551 246,927 1.0% 6.7% $44.32 1,102,200
Halifax 10,972,652 -16,153 213,720 1.9% 14.5% $27.22 374,000
Downtown ‘A’ 1,654,856 -2,716 -1,552 -0.1% 18.8% $35.17 255,000
Canadian office market statisticsKey office markets
*Weighted Average
Source: JLL Research, Altus InSite
13JLL | Canada | Office Market Overview | Fourth Quarter 2016

TORONTO
22 Adelaide St. W, Suite 2600
Toronto, ON M5H 4E3
Tel: +1 416 304 6000
Fax: +1 416 304 6001
About JLL
JLL (NYSE: JLL) is a professional services and investment management firm offering specialized real estate services to clients seeking increased
value by owning, occupying and investing in real estate. JLL is a Fortune 500 company with, as of December 31, 2015, revenue of $6.0 billion and fee
revenue of $5.2 billion, more than 280 corporate offices, operations in over 80 countries and a global workforce of more than 70,000. On behalf of its
clients, the company provides management and real estate outsourcing services for a property portfolio of 4.0 billion square feet, or 372 million square
meters, and completed $138 billion in sales, acquisitions and finance transactions in 2015. As of September 30, 2016, its investment management
business, LaSalle Investment Management, has $59.7 billion of real estate assets under management. JLL is the brand name, and a registered
trademark, of Jones Lang LaSalle Incorporated. For further information, visit www.jll.com.
About JLL Research
JLL’s research team delivers intelligence, analysis and insight through market-leading reports and services that illuminate today’s commercial real
estate dynamics and identify tomorrow’s challenges and opportunities. Our more than 400 global research professionals track and analyze economic
and property trends and forecast future conditions in over 60 countries, producing unrivalled local and global perspectives. Our research and expertise,
fueled by real-time information and innovative thinking around the world, creates a competitive advantage for our clients and drives successful
strategies and optimal real estate decisions.
©2017 Jones Lang LaSalle IP, Inc. All rights reserved. No part of this publication may be reproduced by any means, whether graphically, electronically, mechanically or otherwise howsoever, including without
limitation photocopying and recording on magnetic tape, or included in any information store and/or retrieval system without prior written permission of Jones Lang LaSalle. The information contained in this
document has been compiled from sources believed to be reliable. Jones Lang LaSalle or any of their affiliates accept no liability or responsibility for the accuracy or completeness of the information contained
herein and no reliance should be placed on the information contained in this document.
For more information, please contact:
Thomas Forr
Research Manager
+1 416 304 6047
www.jll.ca/research
TORONTO NORTH
251 Consumers Road, Suite 900
Toronto, ON M2J 4R3
Tel: +1 674 728 0457
Fax: +1 674 642 0195
MISSISSAUGA
110 Matheson Blvd. W, Suite 107
Mississauga, ON L5R 4G7
Tel +1 905 502 6116
Fax +1 905 502 5466
MONTRÉAL
1, Place Ville Marie, Suite 3838
Montréal, QC H3B 4M6
Tel +1 514 849 8849
Fax +1 514 849 6919
EDMONTON
10235 - 101 Street NW, Suite 502
Edmonton, AB T5J 3G1
Tel +1 780 328 2550
Fax +1 780 328 5486
CALGARY
301-8th Avenue SW, Suite 500
Calgary, AB T2P 1C5
Tel +1 403 456 2104
Fax +1 587 880 9966
VANCOUVER
355 Burrard Street, 14th Floor
Vancouver, BC V6C 2G6
Tel +1 604 998 6001
Fax +1 604 998 6018
Office locations:
OTTAWA
275 Slater Street, Suite 1004
Ottawa, ON K1P 5H9
Tel +1 613 656 0145
Fax +1 613 288 0109


