23
Joanna Syroka, Addis Ababa, Ethiopia 21 January 2008 Triggering Early LP Costs for Drought using LEAP
| Date post: | 18-Dec-2015 |
| Category: |
Documents |
| Upload: | darren-claud-mitchell |
| View: | 221 times |
| Download: | 1 times |
Joanna Syroka, Addis Ababa, Ethiopia21 January 2008
Triggering Early LP Costs for Drought using
LEAP

Challenge
• Input Data: – LEAP water balance model calculations– Objective estimates of crop yield deviations due
to water stress (and therefore rainfall)• Calculations:
– A methodology that relates water balance calculations to beneficiary numbers per region
– Fixed at the beginning of the season• Output Data:
– LP Costs per region, varying only due to rainfall
CALCULATIONS(in LEAP)INPUT OUTPUT
• To create an objective index that can be used to trigger early Livelihood Protection costs to regions for PSNP and non-PSNP drought needs

Approach• It must be simple, transparent and robust• To establish the calculation methodology we must
compare LEAP water balance output to historical beneficiary numbers
• The final index should be able to target both PSNP and non-PSNP weredas, therefore wereda-level data needed:
1. LEAP water balance output specified for locally grown, dominant crops, WBIwereda
• E.g. adjusted for local varieties, soil type etc.• Take into account Belg and Meher yields where appropriate• 1995-2007
2. Historical DPPA data• 1994-2004: Total Emergency Beneficiary Numbers• 2005-2007: PSNP + Emergency Beneficiary Numbers
Output data is only as good as inputs used!!

Calculation Methodology• A simple linear regression to relate a historical
Regional Drought Index (Y, independent variable) to a Regional Total Beneficiary Estimate (N, dependent variable), i.e.
N = a * Y + b
– The intercept and slope, b and a, are estimated by the intercept and slope of the least-squares regression line
• Historical Y values against historical DPPA data per region (adjusted for population growth), for 1995-2006 rainfall seasons
– N gives the estimated total number of beneficiaries (chronic + transient) in the region
• Benefits: Confidence bands can be statistically calculated; least amount of assumptions about underlying data

N = a * Y + b
Y
N

Regional Drought Index, Y
• LEAP water balance output for each wereda is weighted by relative wererda vulnerability and aggregates over the region– “Yield” variations in most vulnerable weredas
contribute most to the regional drought index– Vulnerability defined in terms of the wereda’s
relative vulnerable population of the region
• Y = (Σwereda WBIwereda *ARPwereda )/ARPregion
– WBIwereda : • Water balance output specified crop(s) in wereda
– ARPwereda : • At-Risk Population in Wereda = Historical Maximum Ever Population
in Need in Wereda (i.e. PSNP + Emergency for 2005-2007)– ARPregion :
• At-Risk Population in Region = Σwereda (ARPwereda)
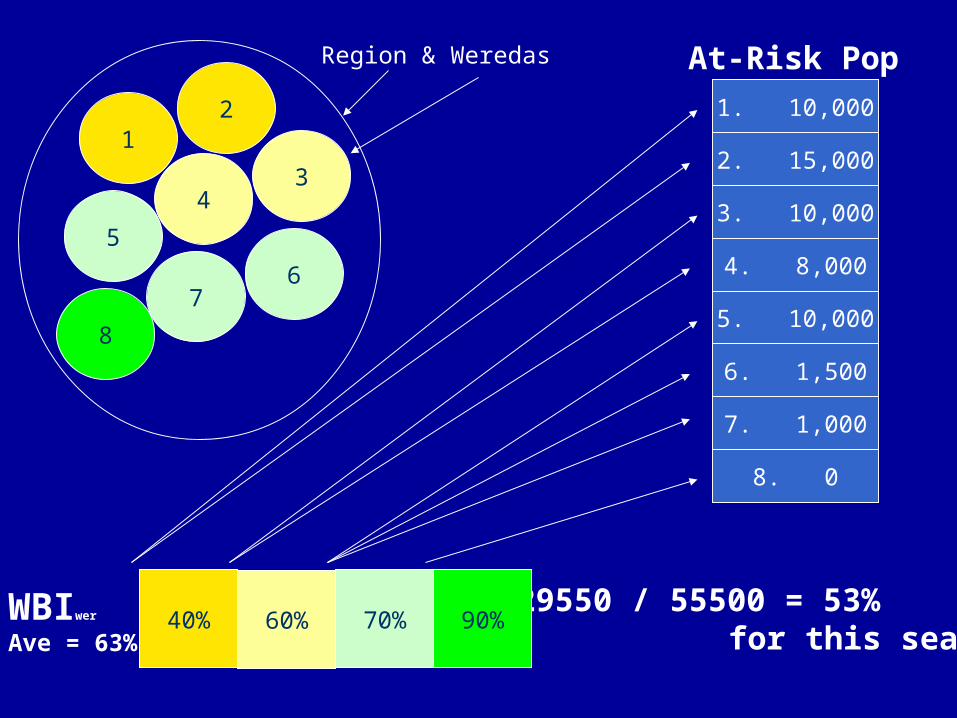
Y = 29550 / 55500 = 53% for this season
40% 60% 70% 90%WBIwer
Ave = 63%
1. 10,000
2. 15,000
3. 10,000
4. 8,000
5. 10,000
6. 1,500
7. 1,000
8. 0
At-Risk Pop
12
4
5
7
8
3
6
Region & Weredas

Regional LP Cost Estimate• If the Regional Total Beneficiary Estimate, N for a
given Y input value is > Total Number of PSNP Beneficiaries, PSNP, in the region:
– It is assumed that additional assistance is needed by the region to deal with the increased number of beneficiaries and needs
– Reg LP Cost Estimate = max(0, N - PSNP)*C• C is the Cost per Additional Beneficiary (e.g. $34) to estimate the additional
funding costs needed by the region in such as scenario
– Confidence Bands can be calculated by using the Standard Error (SE) in N, i.e.
• i.e. N –/+ *SE• Where specifies the desired confidence level
• If not, the PSNP is assumed to be able to take care of all drought-related needs within the region.

Limitations of Approach
• As for all methods, only as good as the input data used:– “GIGO: Garbage in garbage out”
• Assumes a linear response between drought stress on yields and early LP costs– Transparent, but the most “accurate”?
• Uses data from 1995-2007 to establish the calculation parameters a and b– How will extreme drought events, like 2002, look
like in a PSNP world?– Will the response (a and b) be the same?– Ongoing process, needs to be continuously
refined and improved
• Focuses on drought risk only– Not flood, price, pest, “green famine”, civil unrest
etc.

Triggering Early LP Costs for Drought using
LEAP:Preliminary Results for
1996-2007
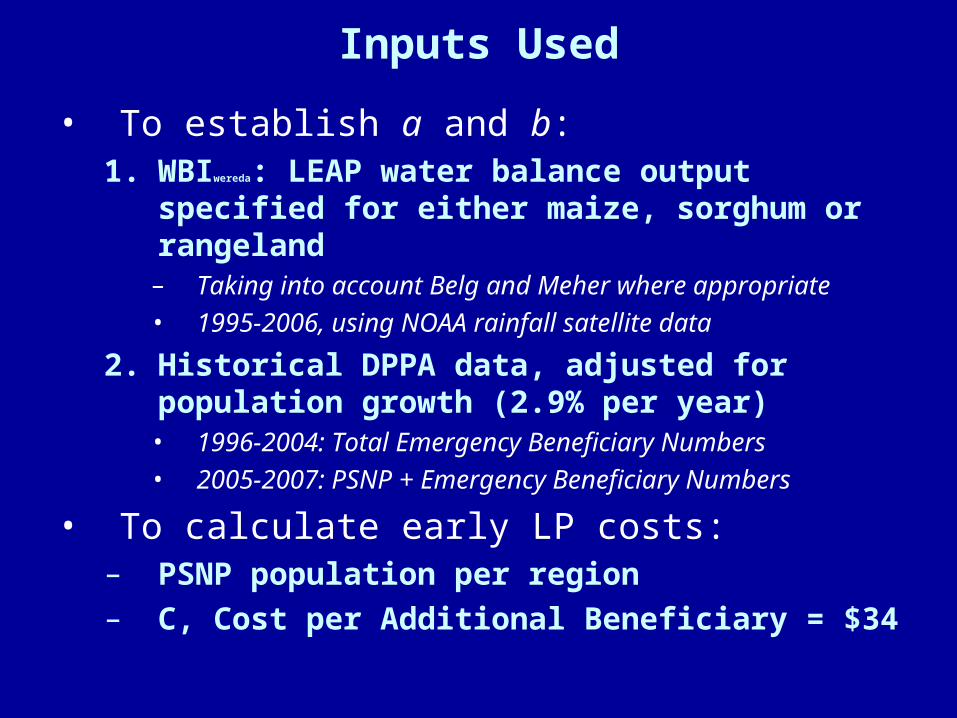
Inputs Used
• To establish a and b:1. WBIwereda: LEAP water balance output
specified for either maize, sorghum or rangeland– Taking into account Belg and Meher where appropriate• 1995-2006, using NOAA rainfall satellite data
2. Historical DPPA data, adjusted for population growth (2.9% per year)
• 1996-2004: Total Emergency Beneficiary Numbers• 2005-2007: PSNP + Emergency Beneficiary Numbers
• To calculate early LP costs:– PSNP population per region– C, Cost per Additional Beneficiary = $34

Tigray Region
2004
2002
Correlation: 57%
PSNP
< 55
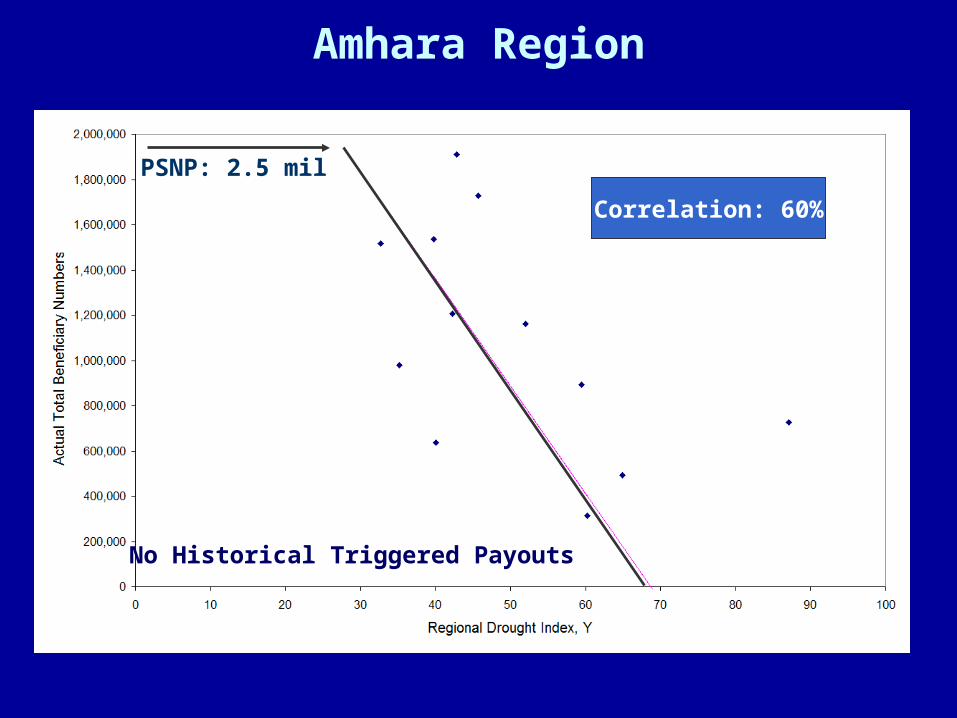
Amhara Region
PSNP: 2.5 mil
No Historical Triggered Payouts
Correlation: 60%

Oromia Region
PSNP
< 73
2002
2003
Correlation: 56%

SNNPR Region
PSNP
1999Correlation: 64%
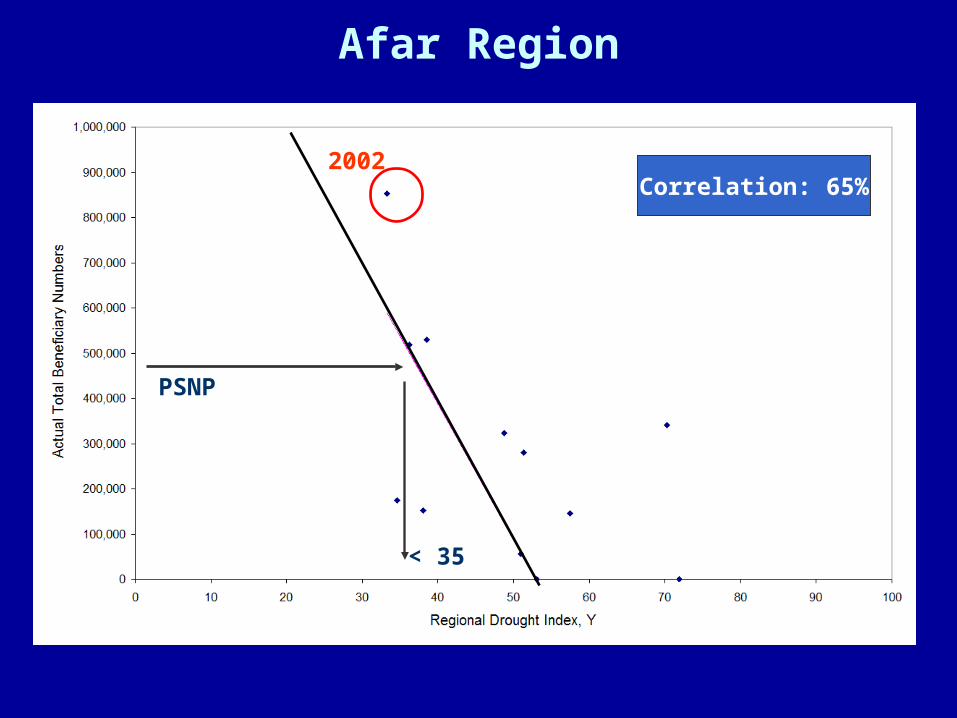
Afar Region
PSNP
< 35
2002Correlation: 65%
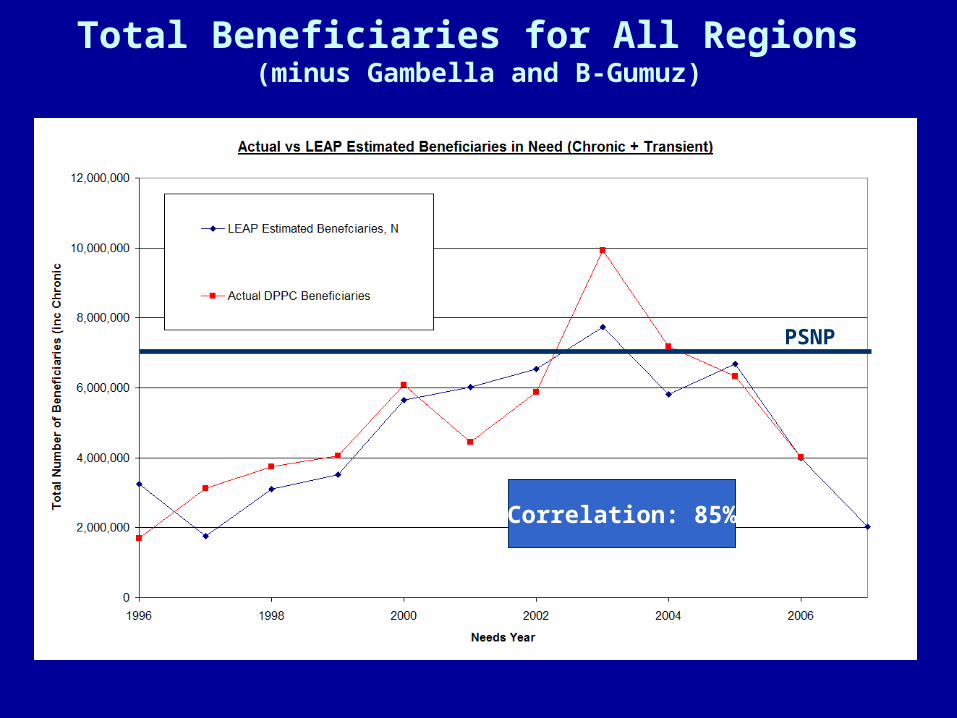
Total Beneficiaries for All Regions (minus Gambella and B-Gumuz)
Correlation: 85%
PSNP

Historical Early LP Costs for PSNP Regions
i.e. N > PSNP per Region
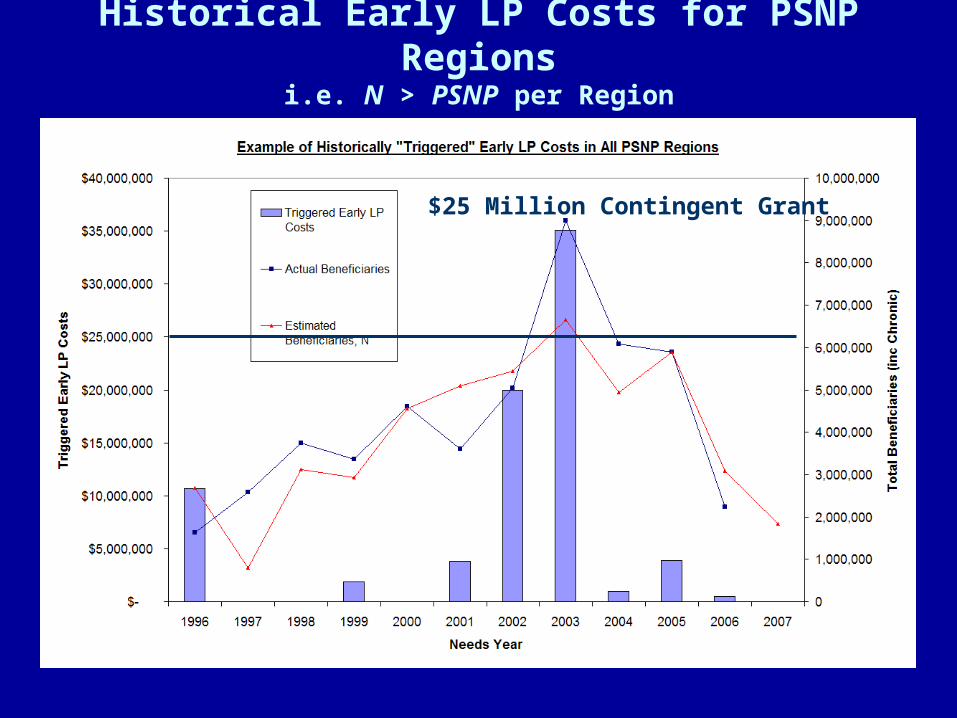
Historical Early LP Costs for PSNP Regions
i.e. N > PSNP per Region
$25 Million Contingent Grant

Historical Early LP Costs for All Regions (minus Gambella and B-Gumuz)

Historical Early LP Costs for All Regions Assuming 20% PSNP Contingency
$25 Million Contingent Grant

Historical Early LP Costs for All Regions Assuming Increasing PSNP Levels from 1996 to
Capture Increasing Vulnerability

Recommendations
• LEAP can be used to index beneficiary numbers and therefore should be!
• Works needed to improve the input data as much as possible:– Input LEAP water balance calculations– DPPA data
• Model must be continually improved and refined as more data post 2005 becomes available and more verification work is done


