Page 1
JOB SATISFACTION AND THE INTENTION TO QUIT BY
EMPLOYEES IN A STEEL MANUFACTURING COMPANY
IN GAUTENG
STEVEN MGIBA
Student number: 210056142
Dissertation submitted in fulfilment of the requirements for the degree
MAGISTER TECHNOLOGIAE
in the discipline
HUMAN RESOURCE MANAGEMENT
in the
FACULTY OF MANAGEMENT SCIENCES
at the
VAAL UNIVERSITY OF TECHNOLOGY
SUPERVISOR: DR. P. A. JOUBERT
September 2015
Page 2
ii
DECLARATION
This work has not previously been accepted in substance for any degree and is not being
concurrently submitted in candidature for any degree.
Signed…………………………
Date……………………………
STATEMENT 1
This dissertation is being submitted in fulfilment of the requirements for the degree of Doctor
Technologiae: Marketing
STATEMEMENT 2
The dissertation is the result of my own independent work/ investigation, except otherwise
stated. Other sources are acknowledged by giving explicit references. A bibliography is
appended.
Signed………………………
Date…………………………
STATEMENT 3
I hereby give consent for my dissertation, if accepted, to be available for photocopying and
for interlibrary loans, and for the title and summary to be made to outside organisations.
Signed…………………………………..
Date…………………………………….
Page 3
iii
LETTER FROM EDITOR
8 Belle Ombre Road
Tamboerskloof
Cape Town 8001.
Faculty of Management Sciences
Vaal University of Technology
Vanderbijlpark.
9 September 2015
COPY-EDITING
This is to certify that I copy-edited the dissertation “Job Satisfaction and the Intention to Quit
by Employees in a Steel Manufacturing Company in Gauteng”, by Steven Mgiba, for the
degree of M. Tech in Human Resource Management.
Elizabeth Trew
[email protected]
021 424 6136
073 235 1147
Page 4
iv
DEDICATION
The dissertation is dedicated to my late parents Mr. and Mrs. Mgiba, my family and siblings
who believed in my capabilities throughout my academic journey.
Page 5
v
ACKNOWLEDGEMENTS
I would like to express my gratitude to my supervisor, Dr Pierre A. Joubert for his patience,
advice, support, and guidance from the premature stage of this research journey to the very
end. He persistently inspired in me the value of excellence in research, which greatly
motivated me to complete this study. I attribute a large portion of this work to him because
without his guidance and persistence in helping me, this dissertation would not have been
possible.
I would like to express my gratitude to my deceased parents, Mr. Jack Mgiba and Mrs. Nancy
Mgiba for believing in me. Their support, love, motivation and inspiration while they were
still alive, made me believe that everything is possible.
I would like to express my appreciation to my lovely sisters, Thulisile Mgiba and Duduzile
Mgiba and my brothers, Hector Mgiba and Sbusiso Mgiba for their unconditional love that
contributed to the completion of this dissertation.
I would also like to express my thanks to my wife, Palesa Mgiba for her sacrifices in order
for me to complete the dissertation.
Finally but not the least, to the Almighty God, my fortress, without Him none of this would
have been possible.
Page 6
vi
ABSTRACT
Keywords: Job satisfaction, retention, turnover and intention to quit.
The main purpose of the study was to examine the level of job satisfaction and intention to
quit, by employees in a steel manufacturing company. The research methodology used to
conduct the study was a combination of a literature review and an empirical study. Due to the
small size of the population, no sampling was done although a census had been drawn. The
primary data were collected using a structured questionnaire. The measuring instrument
contained 25 items. For the main survey, data from 181 respondents were collected and
analysed. Participants in the study involved engineers, operators, technicians, artisans,
administrative staff and safety, health and environmental specialists in the steel
manufacturing company.
Data were analysed with the Statistical Package for Social Sciences (SPSS) version 20.0. The
Cronbach’s alpha coefficients of the measuring instrument were computed to establish
construct validity. Content validity of the scale was ascertained by pre-testing the
questionnaire with employees in the steel manufacturing company. Factor analysis was
conducted for variables in Section B of the research instrument. Analysis was done using
descriptive statistics on the demographic information of respondents. The results were also
interpreted through the factor analysis and correlation analysis.
The findings regarding employee’s perceptions or feelings about job satisfaction and
employees’ intentions to quit their current organisation revealed that the supervison variable
is positively correlated with job variable while it is negatively correlated with intention to
quit. In addition, job variable is also negatively correlated with intention to quit. This means
that effective supervisors are likely to improve employees’ job satisfaction hence decrease
their intentions to quit their current organisation and vise versa. In addition, when employees
are satisfied with their job environment, this will decrease their intentions to quit their current
organisation and vise versa.
Judging from the results from respondents, it is clear that when employees are provided with
a job that rewards them for their effort and provides opportunities for advancement, they will
be satisfied and therefore more likely to stay in the organisation. Hence, the employees at
Babcock Ntuthuko Generations are satisfied and they are not intending to leave the
Page 7
vii
organisation. The research information collected through this study can be used to encourage
Babcock Ntuthuko management to continue providing employees with a condusive working
enviroment to ensure that current and new employees are retained.
Page 8
viii
TABLE OF CONTENTS
DECLARATION .............................................................................................................................................ii
LETTER FROM EDITOR............................................................................................................................ iii
DEDICATION ................................................................................................................................................ iv
ACKNOWLEDGEMENTS ............................................................................................................................. v
ABSTRACT vi
TABLE OF CONTENTS .............................................................................................................................viii
LIST OF TABLES........................................................................................................................................ xiv
LIST OF FIGURES ....................................................................................................................................... xv
CHAPTER 1 INTRODUCTION AND BACKGROUND OF THE STUDY .................................................. 1
1.1 INTRODUCTION ............................................................................................ 1
1.2 LITERATURE REVIEW ................................................................................. 3
1.3 PROBLEM STATEMENT ............................................................................... 4
1.4 OBJECTIVES OF THE STUDY ..................................................................... 5
1.4.1 Primary objectives ....................................................................................................... 5
1.4.2 Theoretical objectives .................................................................................................. 5
1.4.3 Empirical objectives .................................................................................................... 6
1.5 RESEARCH DESIGN ...................................................................................... 6
1.6 CHAPTER CLASSIFICATION ...................................................................... 6
CHAPTER 2 JOB SATISFACTION AND INTENTION TO QUIT ............................................................. 8
2.1 INTRODUCTION AND BACKGROUND ...................................................... 8
2.2 JOB SATISFACTION DEFINED .................................................................... 8
Page 9
ix
2.3 THEORIES OF JOB SATISFACTION ......................................................... 10
2.3.1 Classification of the theories...................................................................................... 11
2.3.1.1 Maslow’s hierarchy of needs ....................................................................................... 11
2.3.1.2 Alderfer’s theory ......................................................................................................... 13
2.3.1.3 McClelland’s theory .................................................................................................... 14
2.3.1.4 Herzberg’s two-factor theory ....................................................................................... 16
2.3.1.5 Locke’s goal setting theory .......................................................................................... 19
2.3.1.6 Adam’s equity theory .................................................................................................. 19
2.3.1.6 Self-determination theory ............................................................................................ 20
2.4 FACTORS INFLUENCING JOB SATISFACTION .................................... 20
2.4.1 Work conditions ........................................................................................................ 21
2.4.2 Supervision ................................................................................................................ 21
2.4.3 Co-Worker/Work groups .......................................................................................... 22
2.4.4 Promotion opportunities............................................................................................ 22
2.4.5 Compensation/Pay ..................................................................................................... 23
2.4.6 Job or the work itself ................................................................................................. 24
2.4.7 Fairness ...................................................................................................................... 24
2.5 CONSEQUENCES OF JOB SATISFACTION ............................................. 24
2.5.1 Productivity ............................................................................................................... 25
2.5.2 Organisational citizenship behaviour ....................................................................... 25
2.5.3 Customer satisfaction ................................................................................................ 26
2.5.4 Absenteeism ............................................................................................................... 26
2.5.5 Turnover .................................................................................................................... 27
2.5.6 Workplace deviance................................................................................................... 27
2.6 DEMOGRAPHIC DETERMINANTS OF JOB SATISFACTION .............. 28
Page 10
x
2.6.1 Job satisfaction and age ............................................................................................. 28
2.6.2 Job satisfaction and gender ....................................................................................... 29
2.6.3 Job satisfaction and occupational level ..................................................................... 30
2.6.4 Job satisfaction and tenure ........................................................................................ 30
2.6.5 Job satisfaction and educational level ....................................................................... 31
2.7 INTENTION TO QUIT .................................................................................. 32
2.7.1 Intention to quit defined .................................................. Error! Bookmark not defined.
2.7.2 Theories of intention to quit ...................................................................................... 34
2.7.3 Factors influencing employees’ intentions to quit .................................................... 42
2.7.3.1 Psychological factors ................................................................................................... 42
2.7.3.2 Economic factors ......................................................................................................... 45
2.7.3.3 Demographic factors.................................................................................................... 46
2.8 RELATIONSHIP BETWEEN JOB SATISFACTION AND
INTENTION TO QUIT .................................................................................. 47
2.9 CONCLUSION ............................................................................................... 48
CHAPTER 3 RESEARCH DESIGN AND METHODOLOGY ................................................................... 50
3.1 INTRODUCTION .......................................................................................... 50
3.2 RESEARCH DESIGN .................................................................................... 50
3.3 SAMPLING DESIGN PROCEDURE ........................................................... 51
3.3.1 Target population ...................................................................................................... 51
3.3.2 Sampling frame.......................................................................................................... 51
3.3.3 Sampling method ....................................................................................................... 51
3.3.4 Sample size ................................................................................................................. 52
3.3.5 Sampling inclusion criteria........................................................................................ 52
3.3.6 Data collection method and the questionnaire .......................................................... 52
Page 11
xi
3.3.6.1 Questionnaire design ................................................................................................... 52
3.4 PILOT TESTING THE QUESTIONNAIRE ................................................ 54
3.5 DATA PREPARATION ................................................................................. 54
3.5.1 Editing ........................................................................................................................ 54
3.5.2 Coding ........................................................................................................................ 55
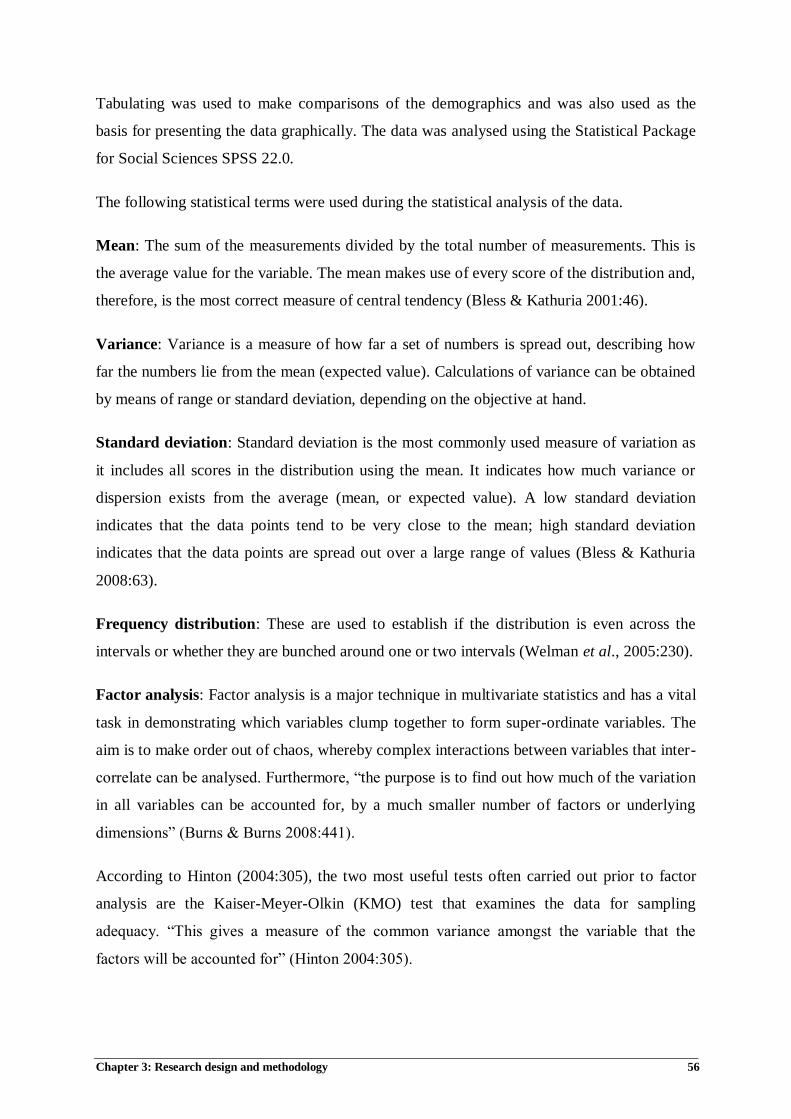
3.6 STATISTICAL ANALYSIS ........................................................................... 55
3.7 RELIABILITY AND VALIDITY .................................................................. 57
3.7.1 Reliability ................................................................................................................... 57
3.7.2 Validity....................................................................................................................... 57
3.7.2.1 Content validity ........................................................................................................... 58
3.7.2.2 Construct validity ........................................................................................................ 58
3.7.2.3 Face validity ................................................................................................................ 58
3.8 ETHICAL CONSIDERATIONS ................................................................... 59
3.9 SUMMARY ..................................................................................................... 59
CHAPTER 4 DATA ANALYSIS AND RESULTS ....................................................................................... 61
4.1 INTRODUCTION .......................................................................................... 61
4.2 PRE-TEST RESULTS .................................................................................... 62
4.3 DESCRIPTIVE STATISTICS ....................................................................... 62
4.3.1 Age ............................................................................................................................. 62
4.3.2 Gender ....................................................................................................................... 63
4.3.3 Race ............................................................................................................................ 64
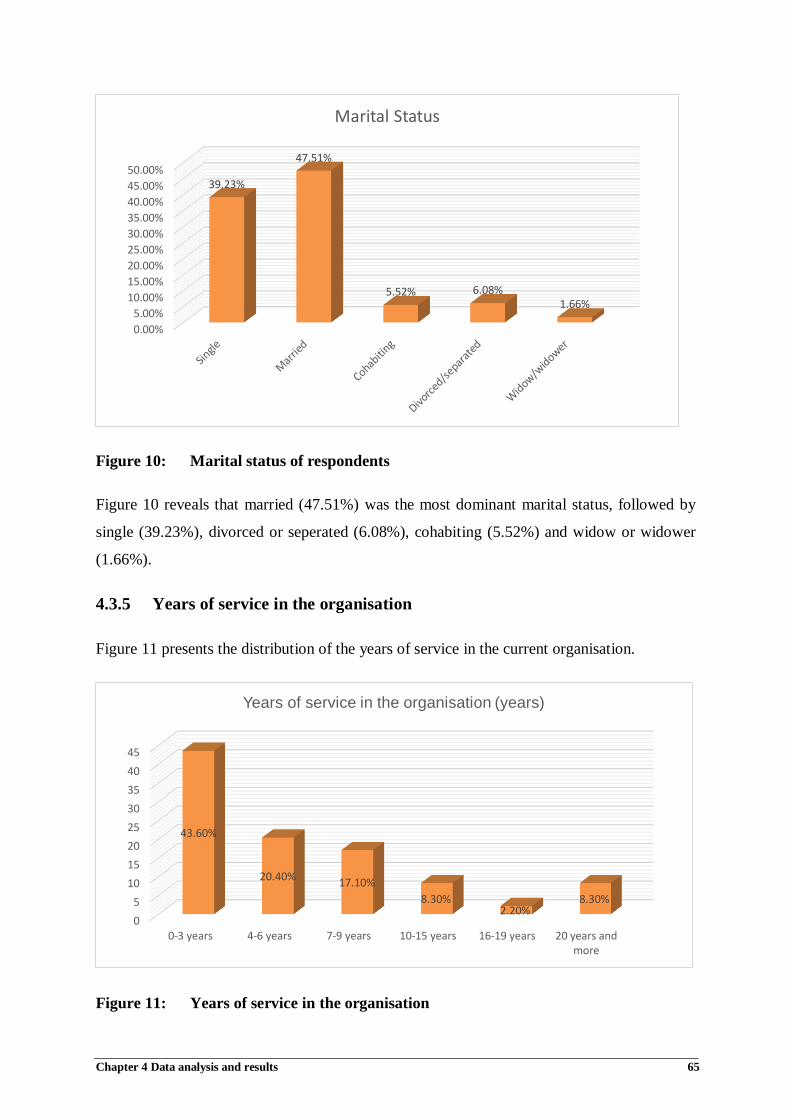
4.3.4 Marital status ............................................................................................................. 64
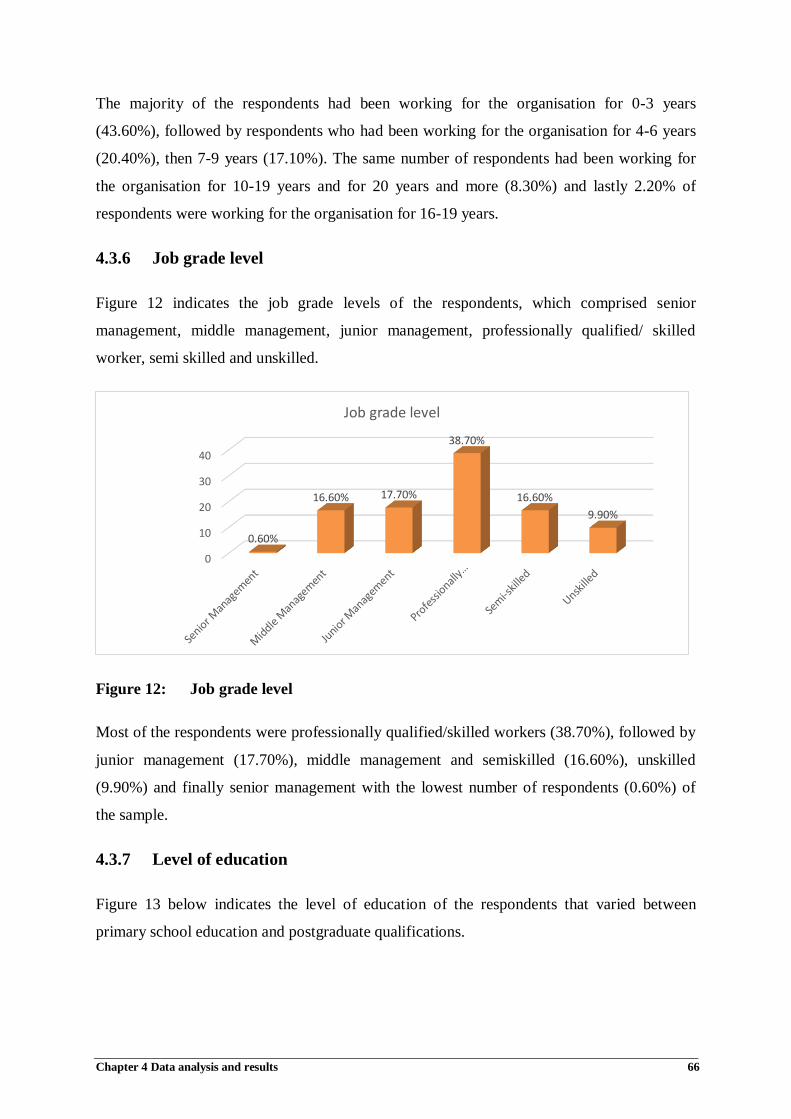
4.3.5 Years of service in the organisation .......................................................................... 65
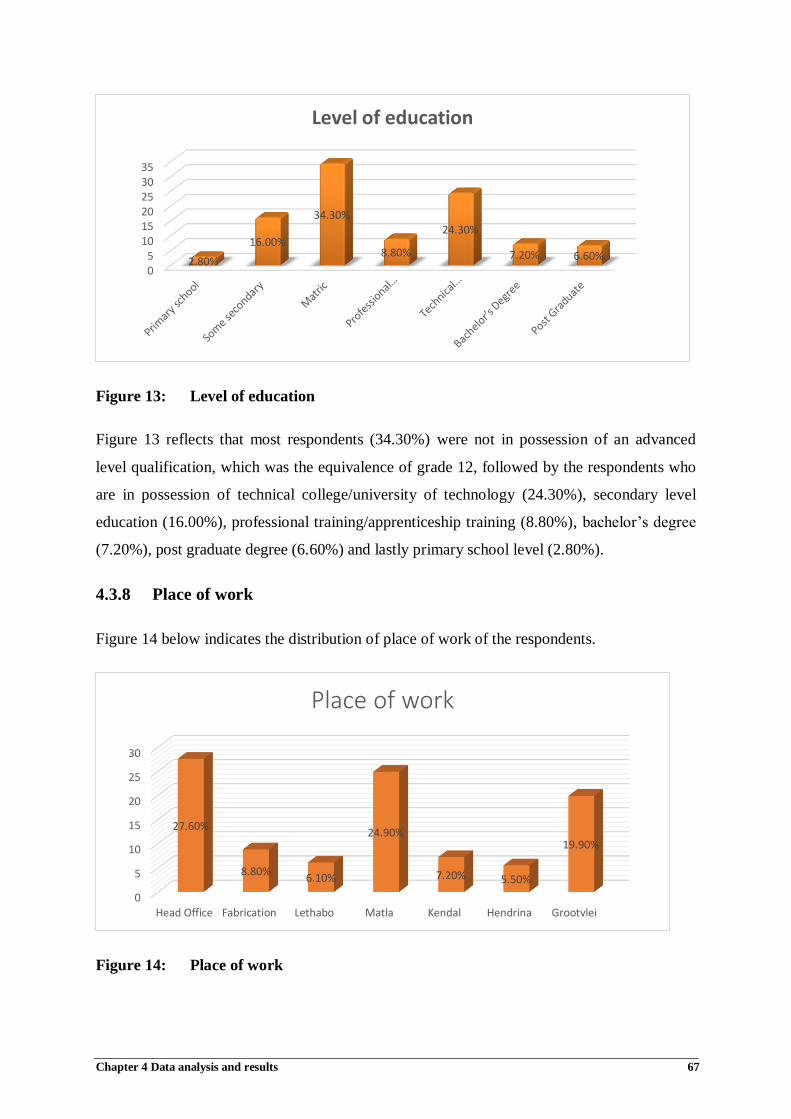
4.3.6 Job grade level ........................................................................................................... 66
Page 12
xii
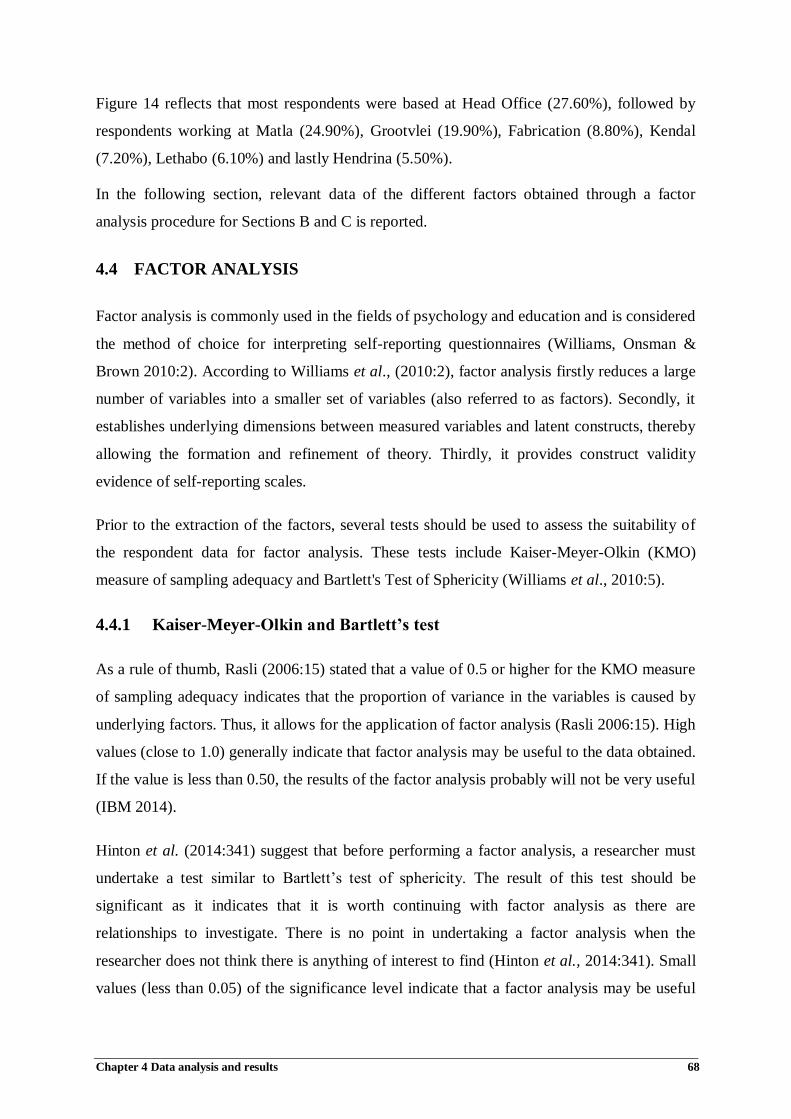
4.3.7 Level of education ...................................................................................................... 66
4.3.8 Place of work ............................................................................................................. 67
4.4 FACTOR ANALYSIS ..................................................................................... 68
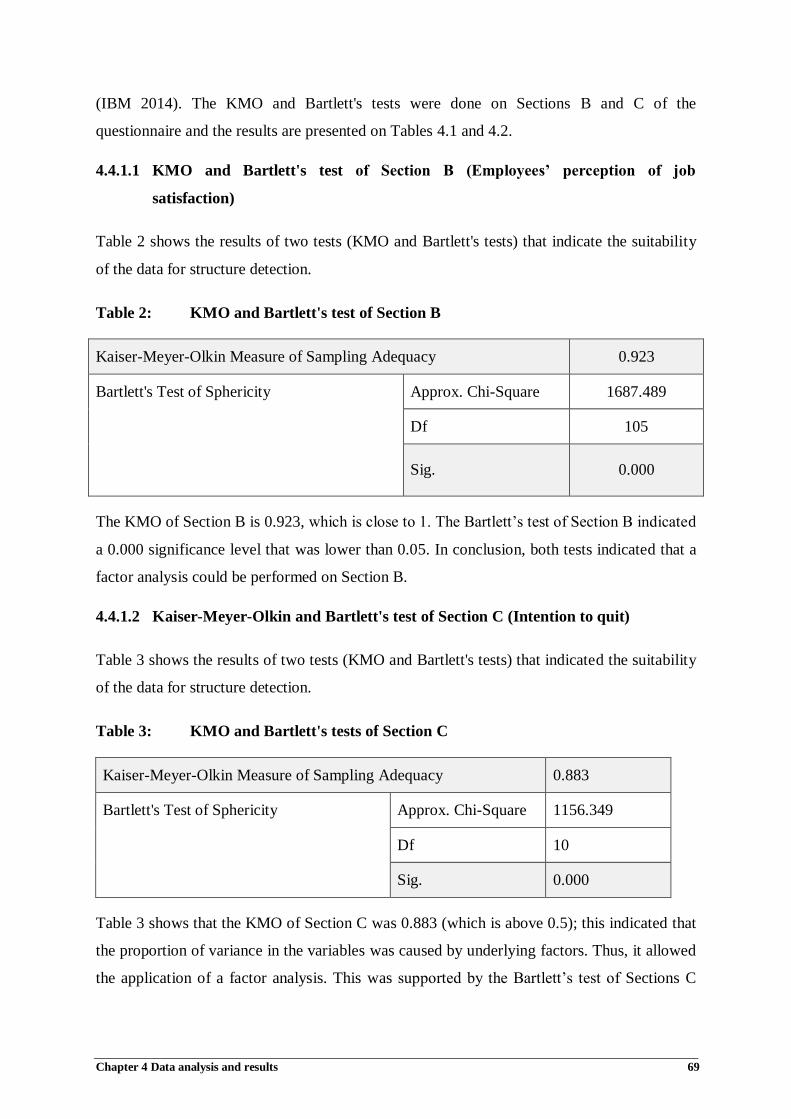
4.4.1 Kaiser-Meyer-Olkin and Bartlett’s test .................................................................... 68
4.4.1.1 KMO and Bartlett's test of Section B (Employees’ perception of job satisfaction) ........ 69
4.4.1.2 Kaiser-Meyer-Olkin and Bartlett's test of Section C (Intention to quit) ......................... 69
4.4.2 Section B: Employee’s perceptions or feelings about job satisfaction ...................... 70
4.4.2.1 Mean rating of demensions of employees’percerptions or feelings about job
satisfaction .................................................................................................................. 70
4.4.3 Section C: Employees’ intentions to quit their current organisation ....................... 73
4.5 CORRELATION ANALYSIS ........................................................................ 74
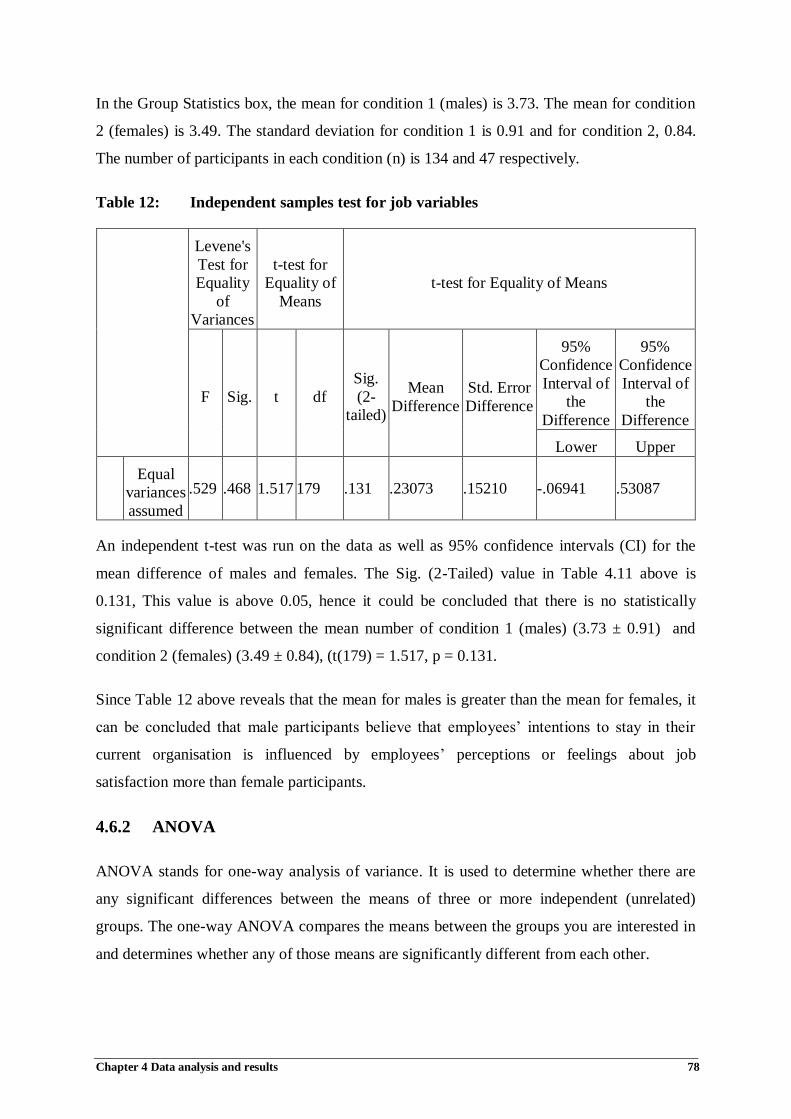
4.6 T-TEST AND ANOVA ................................................................................... 75
4.6.1 T-Test ......................................................................................................................... 76
4.6.2 ANOVA ...................................................................................................................... 78
4.7 RELIABILITY ................................................................................................ 87
4.8 VALIDITY ...................................................................................................... 87
4.8.1 Content validity ......................................................................................................... 87
4.8.2 Construct validity ...................................................................................................... 88
4.8.3 Face validity ............................................................................................................... 88
4.9 SUMMARY ..................................................................................................... 88
CHAPTER 5 CONCLUSIONS, RECOMMENDATIONS AND LIMITATIONS....................................... 90
5.1 INTRODUCTION .......................................................................................... 90
5.2 SUMMARY OF THE RESEARCH ............................................................... 90
5.3 CONCLUSIONS ............................................................................................. 91
5.3.1 Theoretical objectives ................................................................................................ 91
Page 13
xiii
5.3.1.1 To conduct a literature study on job satisfaction ........................................................... 91
5.3.1.2 To conduct a literature study on intention to quit .......................................................... 92
5.3.1.3 To carry out a literature review on employees’ retention and turnover .......................... 93
5.3.2 Empirical objectives .................................................................................................. 93
5.3.2.1 To examine the level of job satisfaction of employees in the steel manufacturing
company ...................................................................................................................... 93
5.3.2.2 To determine the level of intention to quit, by employees in the steel
manufacturing company .............................................................................................. 94
5.3.2.3 To establish the relationship between job satisfaction and intention to quit of
employees in a steel manufacturing company ............................................................... 95
5.3.2.4 T-Test and ANOVA .................................................................................................... 95
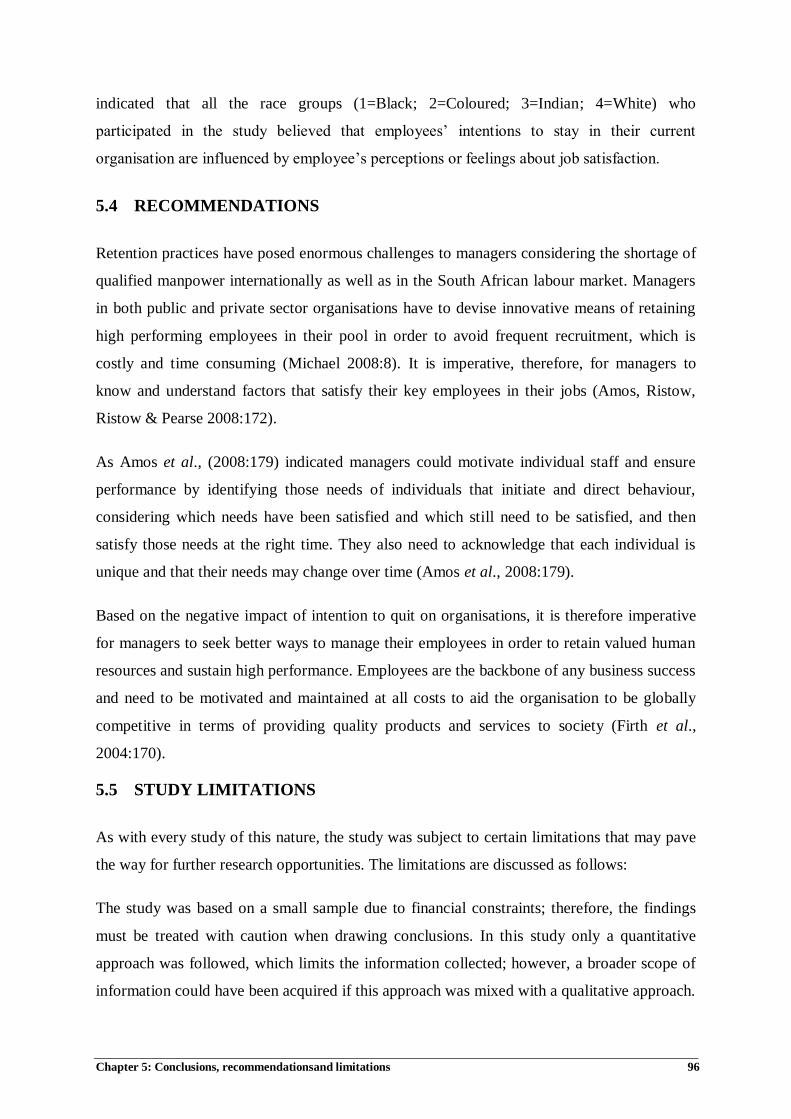
5.4 RECOMMENDATIONS ................................................................................. 96
5.5 STUDY LIMITATIONS .................................................................................. 96
5.6 IMPLICATIONS FOR FUTURE RESEARCH ............................................. 97
5.7 CONCLUDING REMARKS ........................................................................... 97
LIST OF REFERENCES .............................................................................................................................. 99
ANNEXURE A- QUESTIONNAIRE .......................................................................................................... 120
ANNEXURE B- APPROVED LETTER FROM ORGANISATION............................................................125
Page 14
xiv
LIST OF TABLES
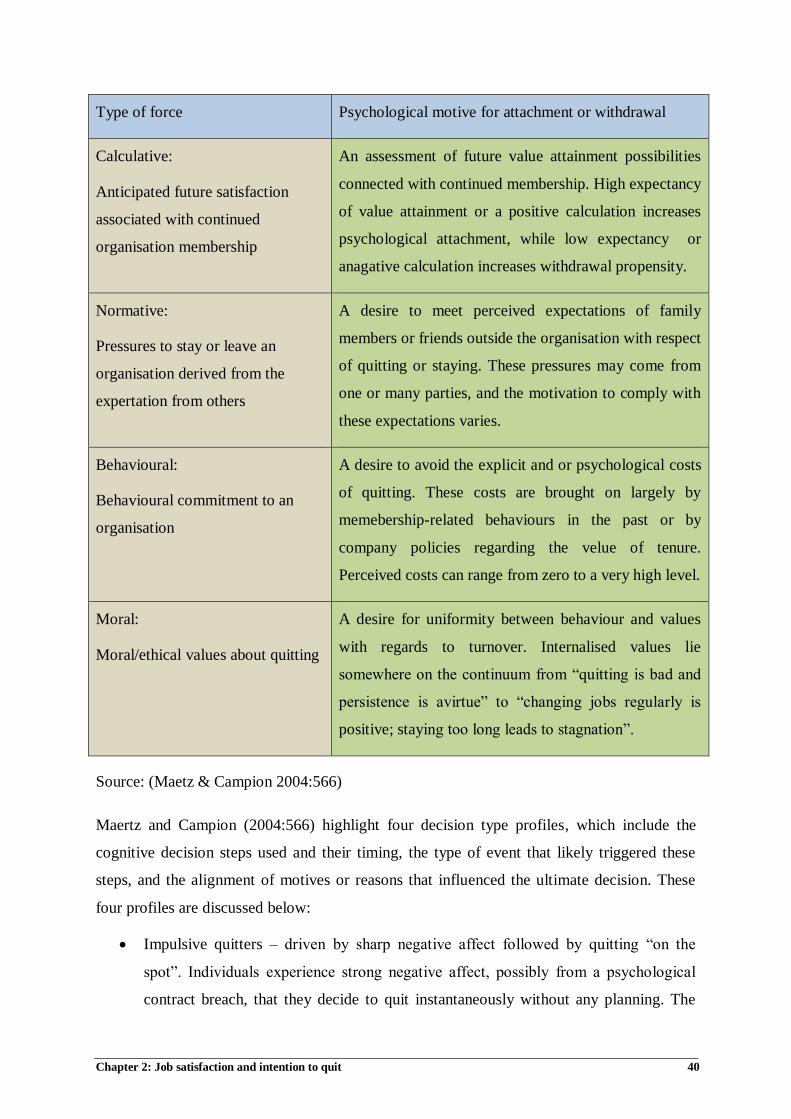
Table 1: Motivational forces of attachment and withdrawal ......................................... 39
Table 2: KMO and Bartlett's test of Section B ............................................................. 69
Table 3: KMO and Bartlett's tests of Section C ............................................................ 69
Table 4: Eigenvalues, percentage of variance explained and cumulative percentage
of Section B................................................................................................... 70
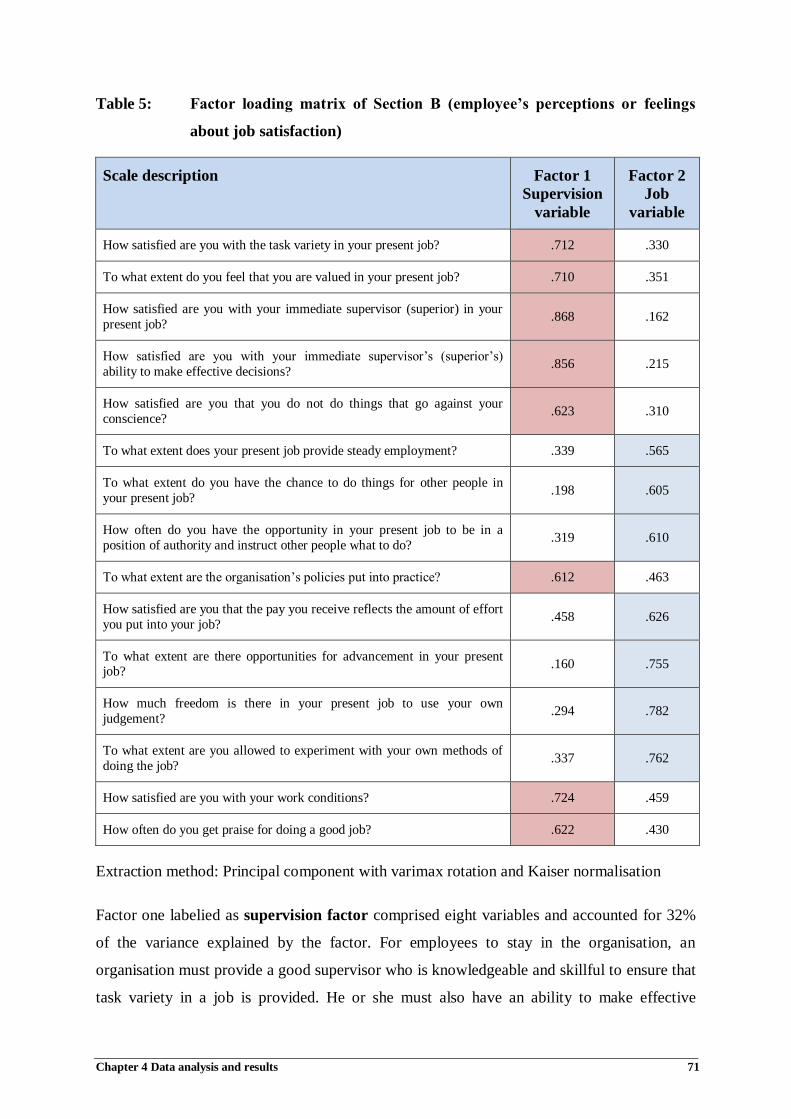
Table 5: Factor loading matrix of Section B (employee’s perceptions or feelings
about job satisfaction) .................................................................................... 71
Table 6: Mean rating of dimensions of employee’s perceptions or feelings about job
satisfaction .................................................................................................... 73
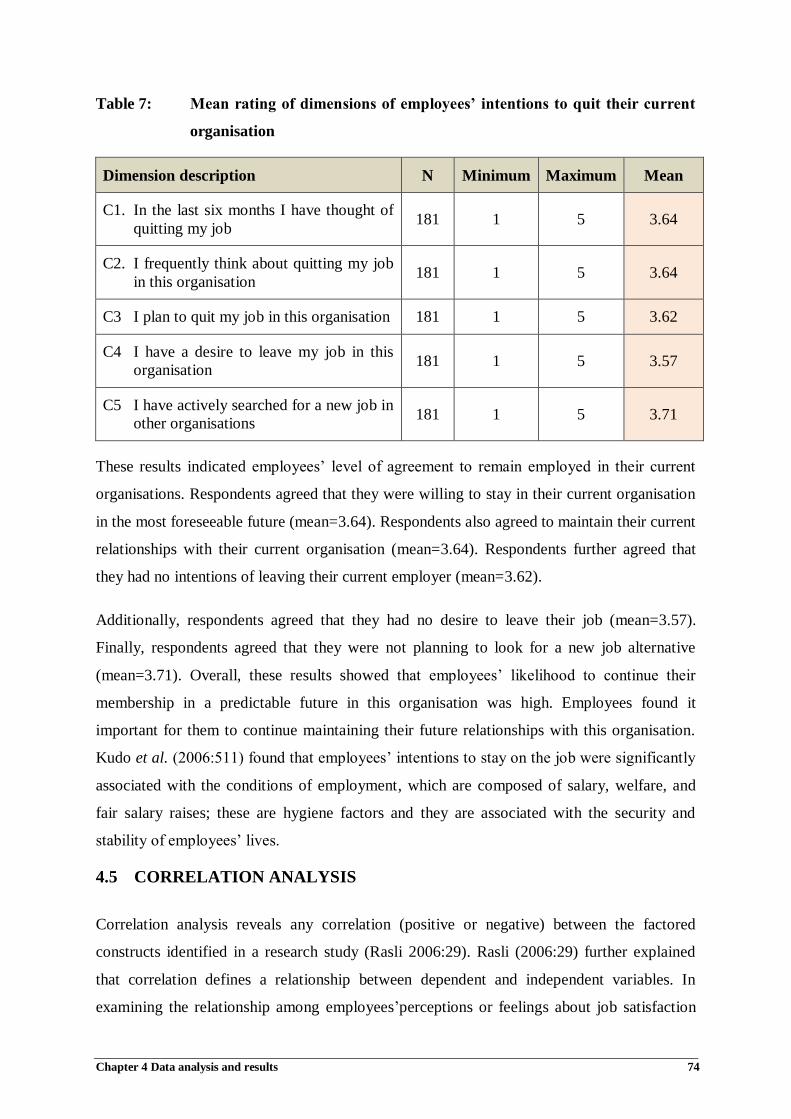
Table 7: Mean rating of dimensions of employees’ intentions to quit their current
organisation ................................................................................................... 74
Table 8: Correlations ................................................................................................... 75
Table 9: Group statistics for supervision variables ....................................................... 76
Table 10: Independent samples test for supervision variables ........................................ 77
Table 11: Group statistics for job variables .................................................................... 77
Table 12: Independent samples test for job variables ..................................................... 78
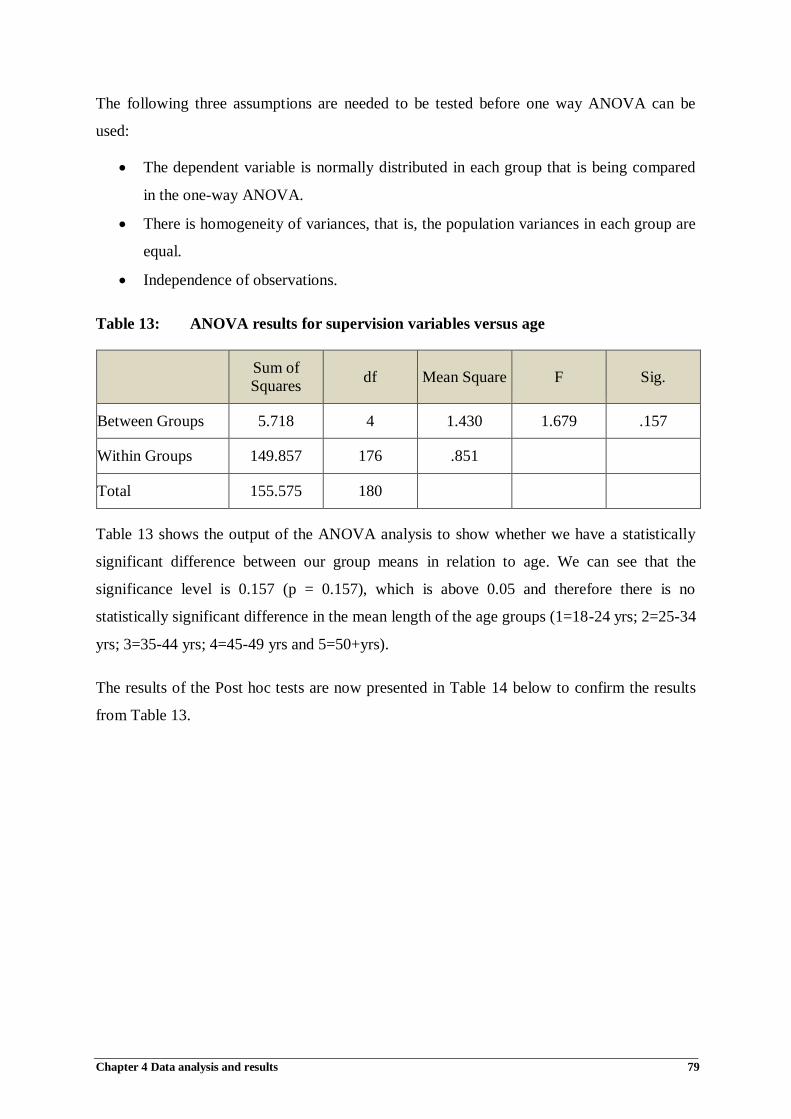
Table 13: ANOVA results for supervision variables vs. age .......................................... 79
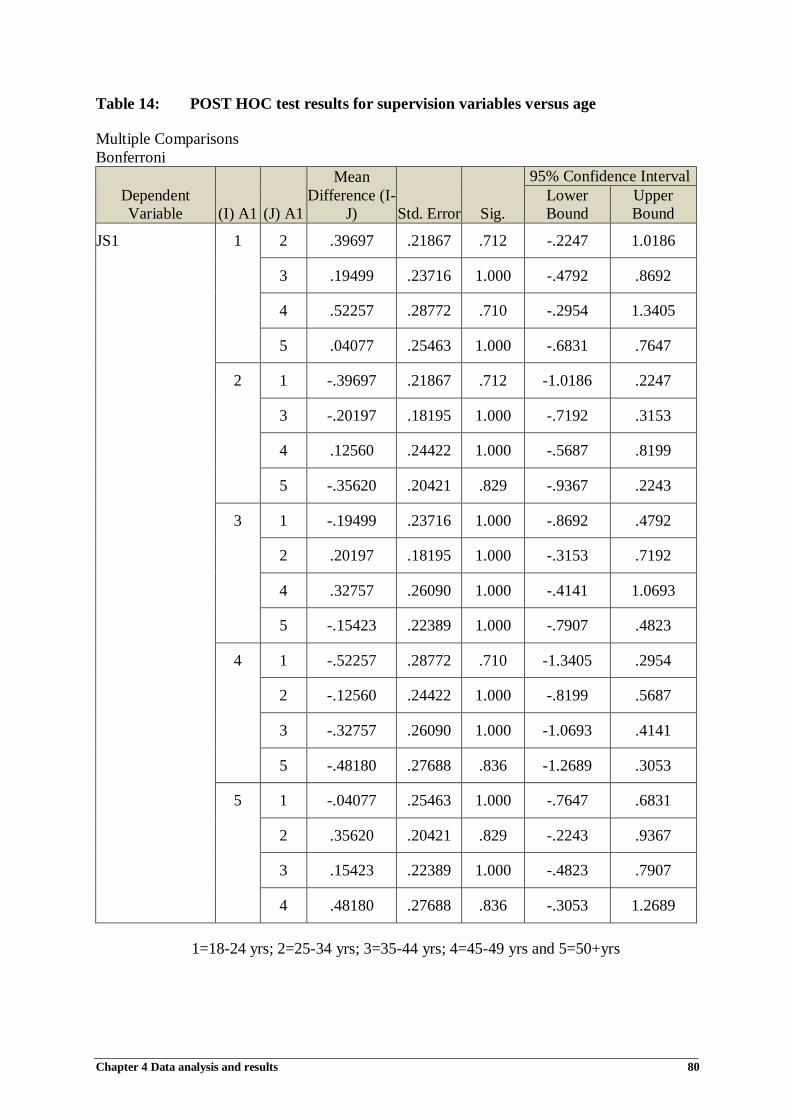
Table 14: POST HOC test results for supervision variables vs. age ............................... 80
Table 15: ANOVA results for job variables vs. age ....................................................... 81
Table 16: POST HOC test results for job variables vs. age ............................................ 82
Table 17: ANOVA results for supervision variables vs. race ......................................... 83
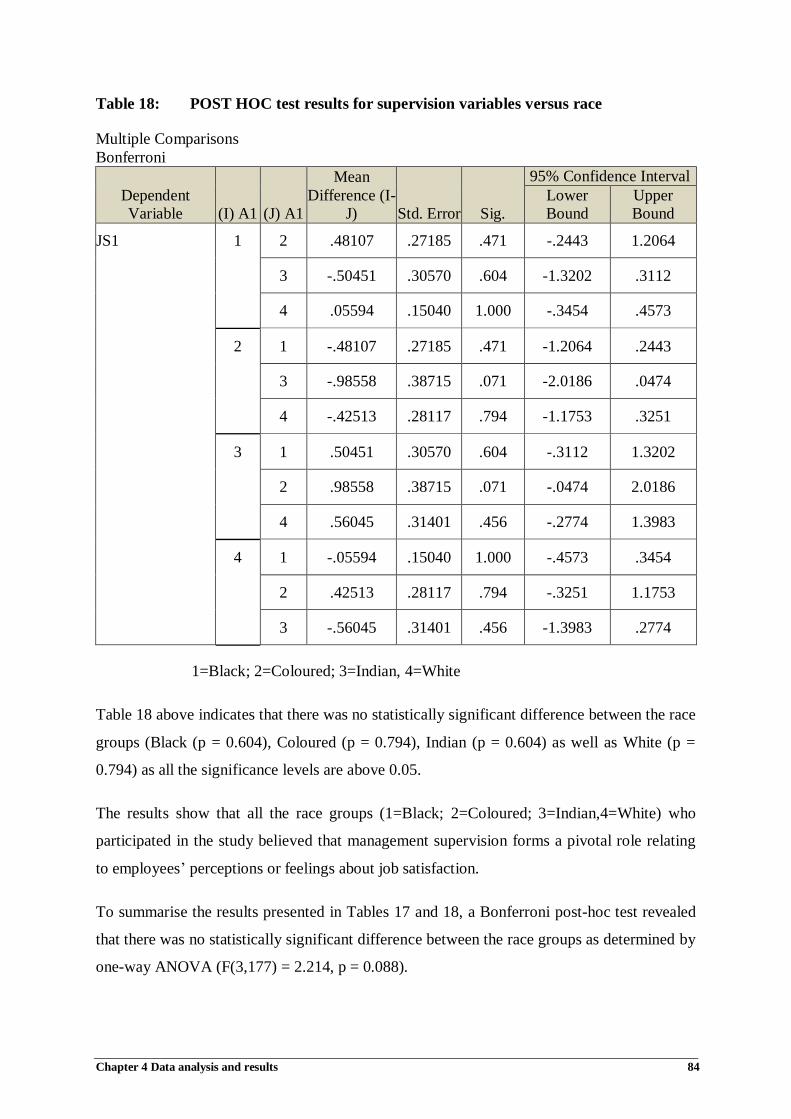
Table 18: POST HOC test results for supervision variables vs. race .............................. 84
Table 19: ANOVA results for job variables vs. race ...................................................... 85
Table 20: POST HOC test results for job variables vs. race ........................................... 86
Table 21: Overall reliability of the instrument ............................................................... 87
Page 15
xv
LIST OF FIGURES
Figure 1: Responses to Job Dissatisfaction ................................................................... 10
Figure 2: Maslow’s hierarchy of needs ......................................................................... 12
Figure 3: Alderfer’s ERG theory................................................................................... 14
Figure 4: McClelland’s Theory of Needs ...................................................................... 15
Figure 5: Herzberg’s Two-Factor theory ....................................................................... 17
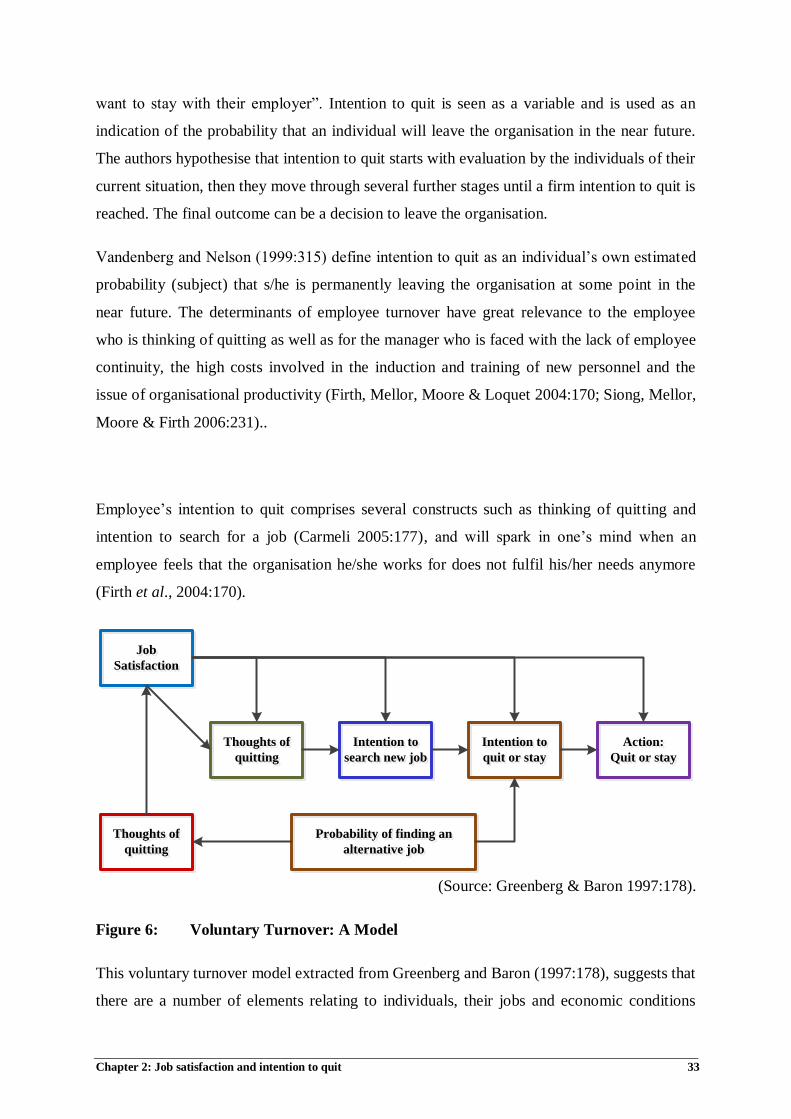
Figure 6: Voluntary Turnover: A Model ....................................................................... 33
Figure 7: Age of respondents ........................................................................................ 63
Figure 8: Gender of respondents ................................................................................... 63
Figure 9: Race of respondents ....................................................................................... 64
Figure 10: Marital status of respondents ......................................................................... 65
Figure 11: Years of service in the organisation ............................................................... 65
Figure 12: Job grade level .............................................................................................. 66
Figure 13: Level of education ......................................................................................... 67
Figure 14: Place of work ................................................................................................ 67
Page 16
Chapter 1: Introduction and background of the study 1
CHAPTER 1
INTRODUCTION AND BACKGROUND OF THE STUDY
1
1.1 INTRODUCTION
Worldwide, the retention of skilled employees has been of serious concern to managers in the
face of the ever-increasing, high rate of employee turnover. Today’s business environment
has become very competitive, which makes skilled employees the major differentiating factor
for most organisations. Organisations, both public and private, rely on the expertise of their
employees in order to compete favourably and indeed gain competitive advantage in the
international market (Samuel & Chipunza 2009:410).
Business leaders often assert that skilled and committed employees are the only sustainable
source of competitive advantage of an organisation (Perryer, Jordan, Firns & Travaglione
2010:911). Sutherland and Jordaan (2004:55) emphasise that a critical component in
determining an organisation’s present and future success is its ability to retain knowledge
workers. It is critical, therefore, for all organisations to retain valuable and skilled employees
(Lee & Way 2010:344), since they have invested huge amounts of time and money to
develop these employees (Kevin, Joan & Adrian 2004:161).
Organisations in South Africa are failing to retain skilled workers (Horwitz 2008:1).
According to Gillingham (2008:17), skilled employees are migrating abroad daily, for better
job opportunities. This phenomenon is having an adverse effect on investment, as emigrating
employees are moving client’s investments offshore (Samuel & Chipunza 2009:410), which
costs companies millions of rands per year (Grobler, Wärnich, Carrell, Elbert & Hatfield
2006:125). Employee turnover in South Africa is not only exacerbated by employee
emigration but also by ‘war for talent’ (Kotzé & Roodt 2005:48).
Organisations in South Africa will continue to lose valuable employees to competitor
organisations until managers are able to identify and apply appropriate retention strategies
that will help reduce the frequent turnover of key employees (Samuel & Chipunza 2010:410).
Research findings by Sherman, Alper and Wolfson (2006:22) confirm this trend. According
to the authors, employee turnover has been on the increase in South Africa with the turnover
rate surging by more than 25 percent in the last five years.
Page 17
Chapter 1: Introduction and background of the study 2
Employee turnover costs an organisation more than one and a half times the employee’s
annual salary when considering the overall costs, which include re-assigning tasks, recruiting
and training a replacement (Cascio 2006:12). This phenomenon, according to Litheko
(2008:26), is making recruitment an onerous task in South Africa, because the majority of job
candidates are perceived to be unsuitable for the majority of vacancies at professional and
technical levels. It is, therefore, imperative for any organisation to ensure that its employees
are satisfied in their jobs in order to curb employee turnover.
Numerous researchers have attempted to answer the question of turnover and what
determines an employee’s intention to quit, by investigating the possible antecedents.
According to Moore (2002:141), lack of job satisfaction is among the factors that contribute
to the employees’ intention to quit their jobs. Research findings by Park and Kim (2009:20)
show that job satisfaction is a key precursor of voluntary turnover. Testa (2001), cited by Lee
and Way (2010:345), supports the above authors by stating that job satisfaction has a
significant relationship with organisational commitment and employee turnover.
Job satisfaction has also been found by Yousef (2000:6) to be inversely related to withdrawal
behaviours such as tardiness, absenteeism and turnover. It has also been linked to increased
productivity and organisational effectiveness (Buitendach & De Witte 2005:27). According
to Braham (2005:11), employee turnover, or intention to leave, in many cases is not a sudden
or instant decision, but a process of disengagement that can take days, months, or even years
before the decision to quit is reached. Tseane (2009:1) found that the traditional quitting
process occurs when an employee is dissatisfied with his or her job, and he or she initiates a
job search, and quits when a suitable job is found.
Riggio (2003:215) describes job satisfaction as consisting of the feelings and attitudes one
has about one’s job, including all aspects of a particular job, good and bad, positive and
negative, which are likely to contribute to the development of feelings of satisfaction or
dissatisfaction or turnover intentions. However, in the context of this study, job satisfaction is
defined as an attitude that individuals have about their jobs. It is the extent to which one feels
positively or negatively about the intrinsic and/or extrinsic aspects of one’s job (Masroor &
Fakir 2010:125).
Page 18
Chapter 1: Introduction and background of the study 3
1.2 LITERATURE REVIEW
Existing literature (Abassi & Hollman 2000:303; Hewitt associates 2006; Sherman et al.,
2006:8) highlights reasons for employee turnover in the organisation as: (1) hiring practices;
(2) managerial style; (3) lack of recognition; (4) lack of competitive compensation system;
and (5) toxic workplace environment. Hence, management has a direct control over many of
the most important drivers of employee turnover (Enz 2010:736). According to Brown
(2006:2), a lack of proper employee retention strategies has an adverse effect on the
organisations, as replacing key employees is disruptive, expensive, time consuming and may
even threaten the sustainability of these organisations.
Kim, Leong and Lee (2005:175) found that companies that exhibited high commitment to
improving their employees’ job satisfaction, motivation, and morale, may realise long-term
benefits of corporate success, loyalty, productivity, and employee retention. In support, Al-
Hussami (2008:286) affirmed that satisfied employees tend to be more productive and
committed to their jobs than dissatisfied employees. Dawal, Taha and Ismail (2009:1) opine
that employees generally work harder and perform better when they are satisfied with their
jobs. However, if the job satisfaction is low, it will deter the individual’s work commitment
and increase the intention to withdraw oneself, either from the job, or organisation (Cohen &
Golan 2007:416).
Payne and Morrison (2002:415), Sagie (2002:156), Santhapparaj, Srini and Ling
(2005:1553), Redfern (2005:512), Gellatly (2005:468) and Denizer (2008:712) found that
when an employee sees that his expectations are not met in the job environment, job
dissatisfaction emerges, which eventually leads to the decrease in productivity, organisational
commitment, commitment to the job, and an increase in the rates of the optional
discontinuation of the job. Yiing and Bin Ahmad (2009:58) also found that when employees
are dissatisfied at work, they tended to be less committed and will look for other
opportunities to quit, and when opportunities are unavailable they may emotionally or
mentally “withdraw” from the organisation.
Retention practices have posed enormous challenges to managers considering the shortage of
qualified manpower in the South African labour market. Managers in both public and private
sector organisations have to devise innovative means of retaining high performing employees
in their pool in order to avoid frequent recruitment, which is costly and time consuming
Page 19
Chapter 1: Introduction and background of the study 4
(Michael 2008:8). It is imperative, therefore, for managers to know and understand factors
that satisfy their key employees in their jobs (Amos, Ristow, Ristow & Pearse 2008:172), as
holding on to their jobs is no longer their priority (Hay 2002:52).
1.3 PROBLEM STATEMENT
In the global market place, organisations worldwide rely on their employees in order to
compete favourably and gain competitive advantage. According to Lee and Way (2010:344),
employees are an organisation’s foundation. It is crucial, therefore, for all organisations,
particularly those in developing countries with limited skills such as South Africa, to ensure
that they consistently develop and retain a loyal, committed and able workforce (Roos & van
Eeden 2008:54), since their value is essentially intangible and not easily replicated (Stokvel
& Bontis 2002:303). According to Abassi and Hollman (2000:333), employees are major
contributors to the efficient achievement of the organisation’s success. Managers, at all cost,
must minimise employee’s turnover (Ongori 2007:49).
However, organisations in South Africa are failing to retain skilled workers (Horwitz,
2008:1), although this trend is not a challenge unique to South African employers (Kotzé &
Roodt 2005:1), but an international phenomenon (Hay 2001:52). Skilled employees are
migrating abroad daily, for better job conditions (Gillingham 2008:17). According to Hay
(2001:52), employee turnover has increased by 25 percent in the last five years, and one-third
of employees currently in employment, plan to quit within the next three years. Empirical
studies by Stovel and Bontis (2002:303) found that employees on average switch employers
every six years.
Babcock Africa Limited is a leading engineering support services organisation with a
turnover of approximately R3bn. It was established in South Africa in 1890 and employs
more than 2 750 employees. However, the organisation is not immune to employee turnover.
According to the Human Resource Annual Report of Babcock (2011:4), the company had a
turnover of 167 employees in the fiscal year of 2010/11. Key employees have been lost to
competitors, which has been costly to the organisation. According to Hebenstreit (2008:4),
employee turnover is a significant concern and is expensive for every organisation, with the
expense of recruiting and retaining a new worker costing anywhere from 50 percent to 200
percent of the departing employee’s annual salary. Depending on the employment level, the
Page 20
Chapter 1: Introduction and background of the study 5
many costs associated with employee turnover are co-worker burden, recruitment and
training costs, lost productivity, loss of clients and loss of intellectual capital (Rion 2009:8).
According to (Ongori 2007:49), employee turnover can be curbed provided appropriate
understanding of employees’ expectations and what satisfy them in their workplaces are
identified. Kevin et al. (2004:161) emphasise that managers must at all costs minimise
employees’ turnover by ensuring that they fully understand the sources that determine
employee turnover, and put strategies in place to minimise it. Managers should understand
employees’ concerns regarding their work environments and what satisfies them, as they
(employees) play an important role in sustaining a successful business (Ford & Heaton
2001:30).
Hebenstreit (2008:5) emphasises that it is essential to create a variety of options and
alternatives for a total employee retention programme, to address areas that matter to
employees. This study is thus an attempt to examine the level of job satisfaction and intention
to quit by employees in a steel manufacturing company, and therefore, recommend to
management the best possible strategies of employees’ retention so that employees can
commit to stay with the organisation.
1.4 OBJECTIVES OF THE STUDY
The following objectives were formulated for this study:
1.4.1 Primary objectives
The main purpose of the study will be to determine the level of job satisfaction and the
intention to quit of employees in a steel manufacturing company and also to establish the
relationship between the constructs (JS and ITQ).
1.4.2 Theoretical objectives
In order to achieve the primary objective, the following theoretical objectives were
formulated for the study, namely:
to conduct a literature study on job satisfaction;
to conduct a literature study on intention to quit; and
to carry out a literature review on employees’ retention and turnover.
Page 21
Chapter 1: Introduction and background of the study 6
1.4.3 Empirical objectives
In accordance with the primary objective and theoretical objectives of the study, the
following empirical objectives were formulated:
to examine the level of job satisfaction of employees in a steel manufacturing
company;
to determine the intention to quit of employees in a steel manufacturing company; and
to determine the existence of any significant differences in terms of demographics of
participants.
1.5 RESEARCH DESIGN AND RESEARCH METHODOLOGY
Literature review, empirical research design (which encompasses target population, sample
frame, sample method, sample size, measuring instrument and data collection method),
statistical analyses, reliability and validity are discussed in detail in chapter three.
1.6 CHAPTER CLASSIFICATION
This study comprises the following chapters:
Chapter 1: Introduction and background of the study
The introduction and background of the study, the problem statement, the research objective,
and the research methodology are discussed in this chapter.
Chapter 2: Literature review
This chapter provides an outline of the literature review conducted on motivation, the
relevant motivation theories, factors influencing job satisfaction, intention to quit and the
retention strategies of employees as a source of knowledge.
Chapter 3: Research design and methodology
Research design and methodology are outlined within this chapter, including sampling
techniques, methods of data collection and data analysis.
Page 22
Chapter 1: Introduction and background of the study 7
Chapter 4: Results and findings
In this chapter, the focus is on the analysis, interpretation and evaluation of the findings of the
study.
Chapter 5: Conclusions, Limitations and Recommendations
In this chapter, the findings and limitations are summarised, conclusions reached, and
recommendations are made for future research.
Page 23
Chapter 2: Job satisfaction and intention to quit 8
CHAPTER 2
JOB SATISFACTION AND INTENTION TO QUIT
2
2.1 INTRODUCTION AND BACKGROUND
According to Lee and Way (2010:244), employees are important assets for the organisations.
Creating a good atmosphere of the work environment and pay more attantion to
employees’satisfaction is critical for any organisation to succed. Employees who are satisfied
with their jobs will be motivated to work harder and those that are not will consider to leave.
Robbins (2005:2) postulates that managers have a humanistic responsibility to provide
employees with jobs that are challenging, rewarding and satisfying. According to Alavi and
Askaripur (2003:591), there are at least three reasons why managers must focus on the job
satisfaction of its employees: (1) evidence suggests that dissatisfied individuals leave
organisations; (2) satisfied employees are in better health and have longer life expectancy;
and (3) job satisfaction in the workplace also affects individuals’ private lives which in turn
has an effect on absenteeism and other important work-related attitudes and behaviour.
2.2 JOB SATISFACTION DEFINED
While definitions can provide a broad understanding of what job satisfaction entails, it
remains a complex concept, with a plethora of various definitions described by many
researchers. According to Daneshfard and Ekvaniyan (2012:168), researchers most
commonly refer to the following three definitions.
Hoppock (1935:47) defined job satisfaction as “…any combination of psychological,
physiological, and environmental circumstances that causes a person to be satisfied with
his/her job”. Locke (1976: 1300) defined job satisfaction as “…a pleasurable or positive
emotional state resulting from the appraisal of one’s job or job experiences”. According to
Luthans (2002:230), job satisfaction is an attitude or emotional response to one’s tasks as
well as to the physical and social conditions of the workplace. Riggio (2003:215) describes
job satisfaction as consisting of the feelings and attitudes one has about one’s job including
all aspects of a particular job, good and bad, positive and negative, which are likely to
contribute to the development of feelings of satisfaction or dissatisfaction or turnover
intentions.
Page 24
Chapter 2: Job satisfaction and intention to quit 9
It can also be defined as “the phenomenon ascertaining the contentment of the employee and
appears when the qualifications of the job and the demands of the employees match”
(Reichers 2006:465). Masroor and Fakir (2010:125) defined job satisfaction as “…an attitude
that individuals have about their jobs”. Adenike (2011:154) defines job satisfaction as
“…one’s feeling or state of mind regarding the nature of the job”.
Job satisfaction positively affects employee behaviour, which provides additional
contribution to a company’s performance. Employees with high job satisfaction are devoted
to that organisation and can obtain a high‐level productivity in their work (Ozdemir
2009:103). According to Nelson and Quick (2006:120), job satisfaction is generally seen as
general attitude as well as satisfaction with particular dimensions of job, pay, the work itself,
supervision, promotion, the group and work conditions. In the context of this study, job
satisfaction is defined as an attitude that individuals have about their jobs. One feels
positively or negatively about the intrinsic and/or extrinsic aspects of one’s job (Masroor &
Fakir 2010:125) to an extent.
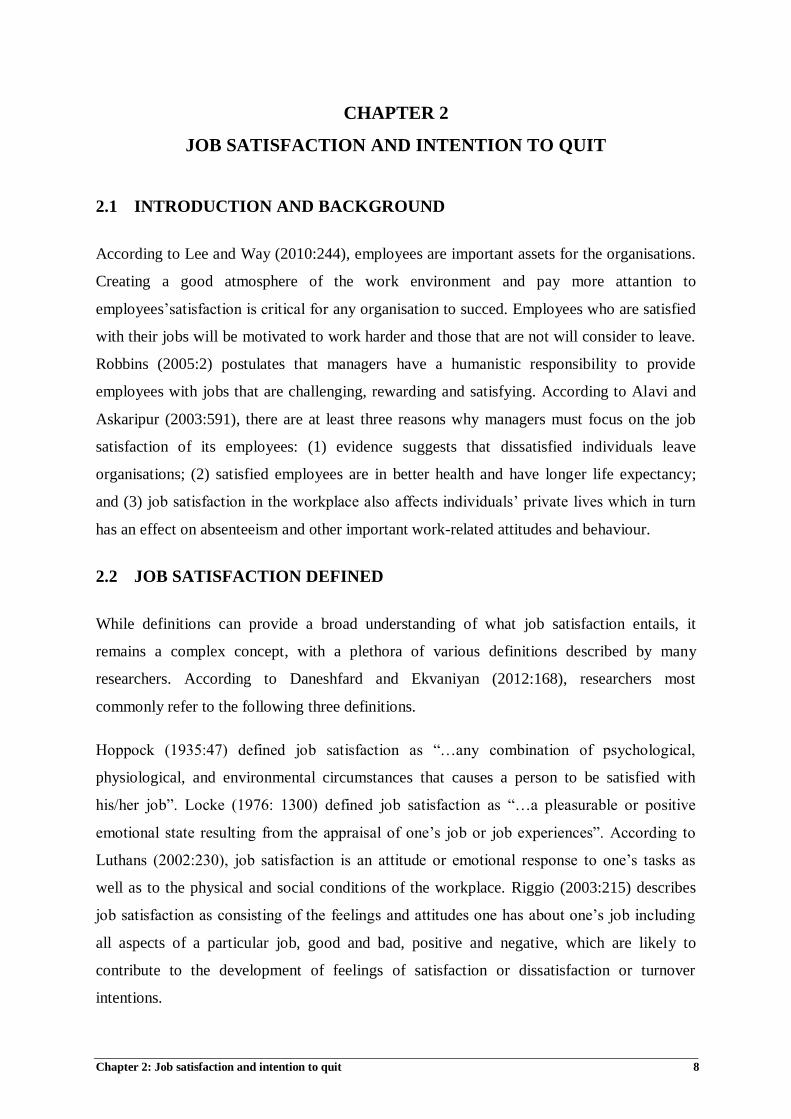
Robbins (1998:156 – 157) advocates that employee dissatisfaction can be anticipated in many
diverse ways and summarises these as follows:
Exit – Behaviour directed towards leaving the organisation, including looking for a
new position as well as resigning;
Voice – Actively and constructively attempting to improve conditions, including
suggesting improvements, discussing problems with supervisors and some forms of
union activity;
Loyalty – Passively but optimistically waiting for conditions to improve, including
speaking up for the organisation in the face of external criticism and trusting the
organisation and its management to do the right thing; and
Neglect – Passively allowing conditions to worsen, including chronic absenteeism or
lateness, reduced effort and increased error rate.
Page 25
Chapter 2: Job satisfaction and intention to quit 10
Responses to Job Dissatisfaction
Active
Exit
Voice
Destructive
Constructive
Neglect
Loyalty
Passive
(Source: Robbins 1998:157)
Figure 1: Responses to Job Dissatisfaction
2.3 THEORIES OF JOB SATISFACTION
Luthans (1995:13) notes that “there is nothing as practical as a good theory”. Theory is a
systematic grouping of interdependent concepts and principles resulting into a framework
that ties together a significant area of knowledge (Weihrich & Koontz 1999:13). On the other
hand, more precisely, a theory identifies important variables and links them to form ‘tentative
propositions’ (or hypotheses) that can be tested through research (Newstrom 2007:6).
Most of the debates about theories of job satisfaction start with Maslow’s theory of
‘Hierarchy of Needs’ (1943). However, the theory begins with the idea of ‘scientific
movement’ or ‘Taylorism’ by Taylor (1911), which treats the human being as ‘economic-
man’ where ‘money’ is the biggest motivator for job-satisfaction. This view was criticised by
Elton Mayo & Associates (1924-33) during ‘hawthorne Studies’ about the nature of a human
being. They found that multiple factors contribute to the motivation and satisfaction of
workers, including personal morale, positive interrelationships, management founded on the
Page 26
Chapter 2: Job satisfaction and intention to quit 11
understanding of individual and group behaviour through interpersonal skills such as
motivating, counselling, leading and communicating (Weihrich & Koontz 1999:42).
2.3.1 Classification of the theories
A survey of literature about the theories of motivation suggests that theories are commonly
grouped according to either their nature or their chronological appearance. Shajahan and
Shajahan (2004:90-99) classified them into content-theories (Maslow’s Needs Hierarchy,
Herzberg’s Two Factor theory, Theory X and Theory Y, Alderfer’s ERG theory, and
McClelland’s Theory of Needs) and process-theories (Behaviour Modification, Cognitive
Evaluation Theory, Goal Setting theory, Reinforcement theory, Expectancy theory, and
Equity theory).
Luthans (2005:240-256) suggests that there are content (Needs Hierarchy, Two-Factors, and
ERG theories), process (Expectancy theory and the Porter & Lawler model) and
contemporary (Equity, Control and Agency) theories. Robbins, (2005:48-61) on the other
hand, uses chronology and categorises the theories into early-theories (Hierarchy of needs,
Theory X & Y, Two-Factor theory) and contemporary theories (McClelland’s theory of
needs, Goal Setting theory, Reinforcement theory, Job Design Theory , Equity theory and
Expectancy theory).
In this section, the following six theories that underpin job satisfaction are presented. These
are the most widely discussed theories of motivation:
Maslow’s hierarchy of needs theory;
Alderfer’s theory;
McClelland’s learned needs theory;
Herzberg’s two-factor theory;
Locke’s goal setting theory;
Adams’ equity theory; and
Self-determination theory.
2.3.1.1 Maslow’s hierarchy of needs
Maslow’s hierarchy of needs (1943) is possibly the best known of all motivation theories. It
calls attention to human needs as the drivers of behaviour. Needs are aspects of people’s lives
that need fulfilment, and which in turn initiate, direct and sustain behaviour towards
Page 27
Chapter 2: Job satisfaction and intention to quit 12
satisfaction (Amos et al. 2008:176). Maslow’s hierarchy of needs theory consists of five
levels generally depicted as a pyramid. The levels of needs as seen in figure 2.2 are: (1)
physical needs (food, clothing, shelter, sex); (2) safety needs (physical protection); (3) social
needs (develop close associations with others); (4) esteem/achievement needs (prestige given
by others); and (5) self-actualisation (self-fulfilment and accomplishment through personal
growth).
Hig
her
ord
er n
eed
s
Low
er o
rder
nee
ds
(Source: Amos et al., 2008:177)
Figure 2: Maslow’s hierarchy of needs
The theory is based on a satisfaction-progression assumption. According to Maslow,
individuals first seek to satisfy lower order needs before higher order needs are satisfied
(Amos et al., 2008:177). Once a given level of needs is satisfied, it no longer helps to
motivate. Thus the next higher level of need has to be activated in order to motivate and
thereby satisfy the individual (Luthans 2005:240).
Studies by Maslow (1970) regarded the first two need levels (physiological and safety) as
lower-order needs. These needs are also called deficiency needs because if these needs are
not met, people may not have the opportunity to develop themselves both physically and
Self -actualisation
Esteem Needs
Social Needs
Safety Needs
Physiological Needs
Page 28
Chapter 2: Job satisfaction and intention to quit 13
physiologically. In order to survive people need air, water, food and protection from physical
danger. Many people work in order to survive, to guarantee themselves and their families
sufficient nourishment and protection from harm. These survival needs are very powerful
motivators for people to go to work; people whose survival is threatened will work in almost
any kind of job so they can earn enough money to meet their lower-order needs.
Using Maslow’s theory, managers can motivate individual staff and ensure performance by
identifying those needs of individuals that initiate and direct behaviour, considering which
needs have been satisfied and which still need to be satisfied, and then satisfy those needs at
the right time. They also need to acknowledge that each individual is unique and that their
needs may change over time (Amos et al., 2008:179).
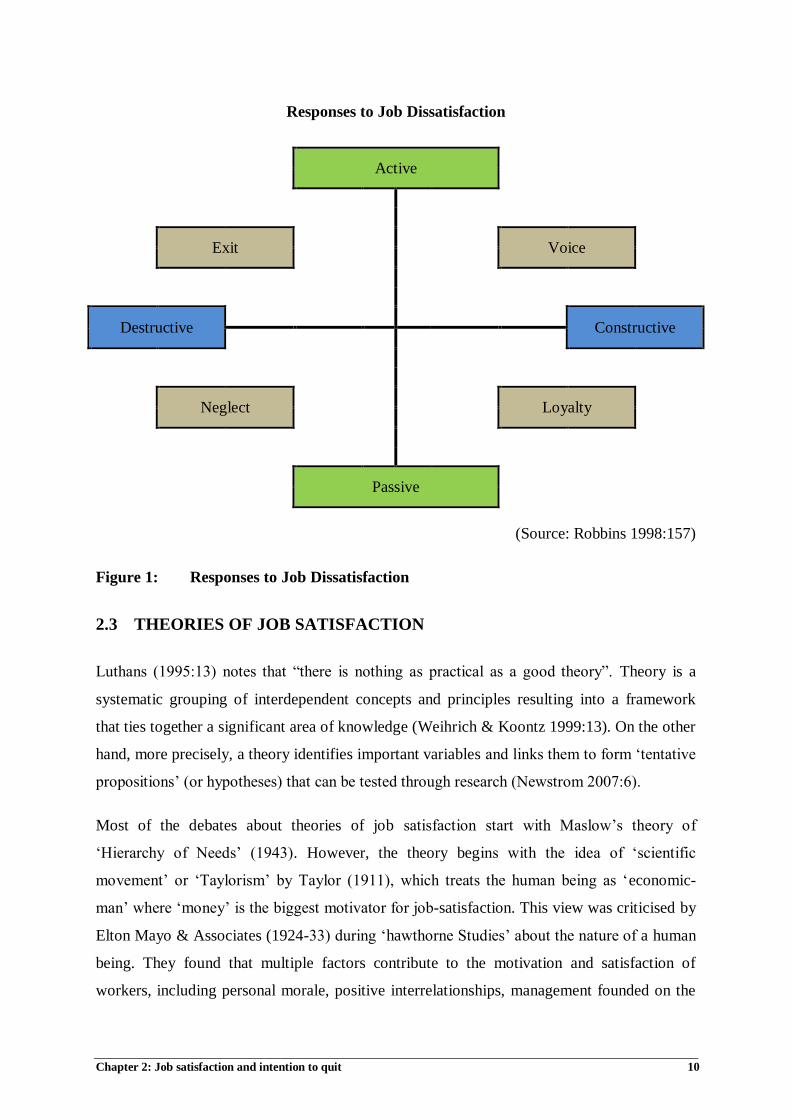
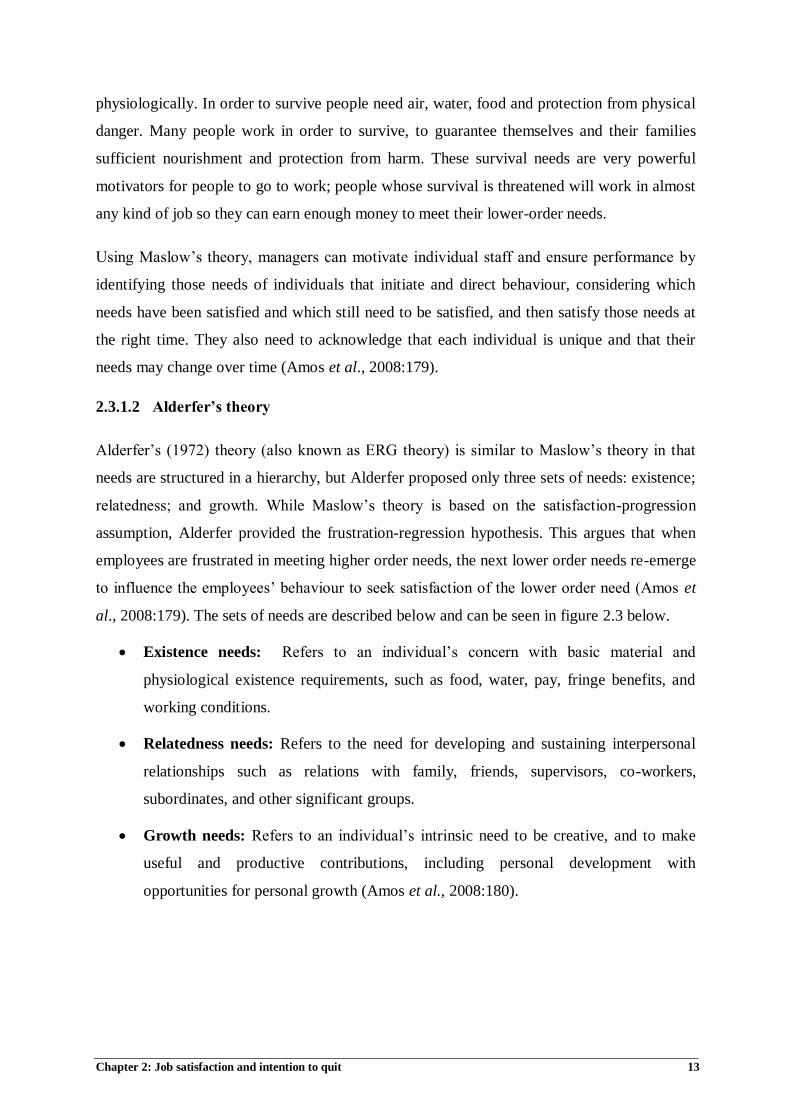
2.3.1.2 Alderfer’s theory
Alderfer’s (1972) theory (also known as ERG theory) is similar to Maslow’s theory in that
needs are structured in a hierarchy, but Alderfer proposed only three sets of needs: existence;
relatedness; and growth. While Maslow’s theory is based on the satisfaction-progression
assumption, Alderfer provided the frustration-regression hypothesis. This argues that when
employees are frustrated in meeting higher order needs, the next lower order needs re-emerge
to influence the employees’ behaviour to seek satisfaction of the lower order need (Amos et
al., 2008:179). The sets of needs are described below and can be seen in figure 2.3 below.
Existence needs: Refers to an individual’s concern with basic material and
physiological existence requirements, such as food, water, pay, fringe benefits, and
working conditions.
Relatedness needs: Refers to the need for developing and sustaining interpersonal
relationships such as relations with family, friends, supervisors, co-workers,
subordinates, and other significant groups.
Growth needs: Refers to an individual’s intrinsic need to be creative, and to make
useful and productive contributions, including personal development with
opportunities for personal growth (Amos et al., 2008:180).
Page 29
Chapter 2: Job satisfaction and intention to quit 14
Sati
sfact
ion
-pro
gre
ss
Fru
stra
tion
-reg
ress
ion
(Source: Amos et al., 2008:180)
Figure 3: Alderfer’s ERG theory
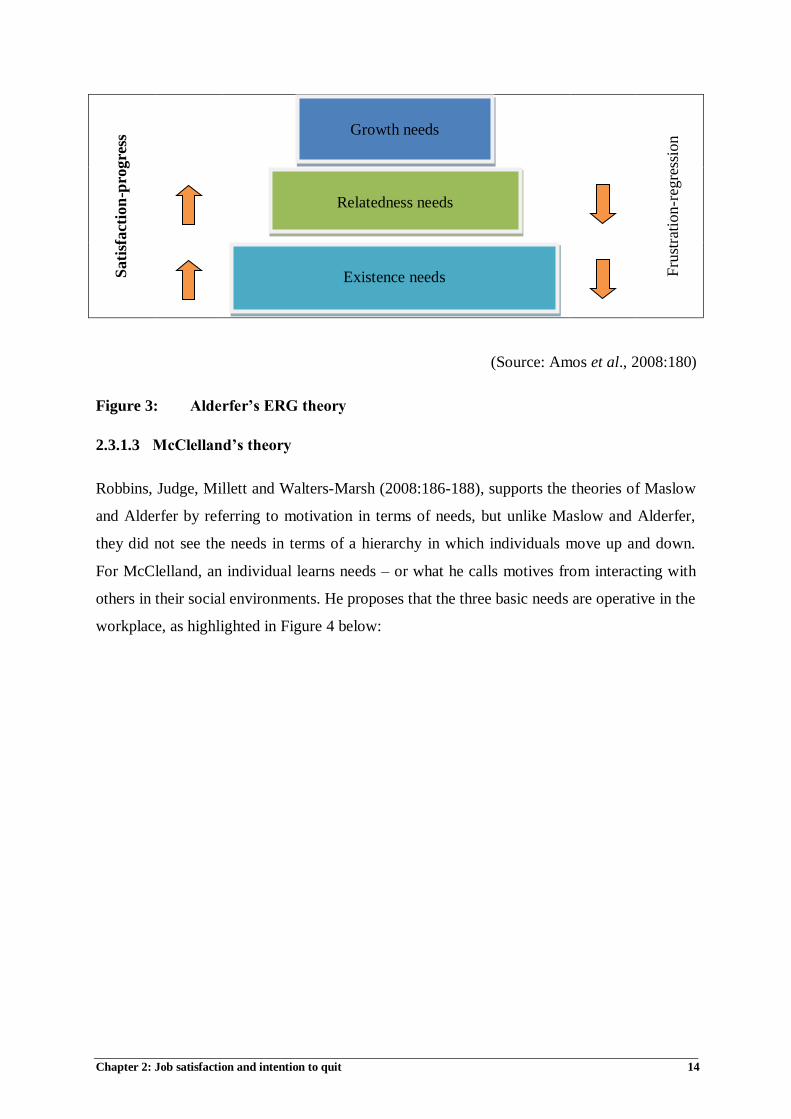
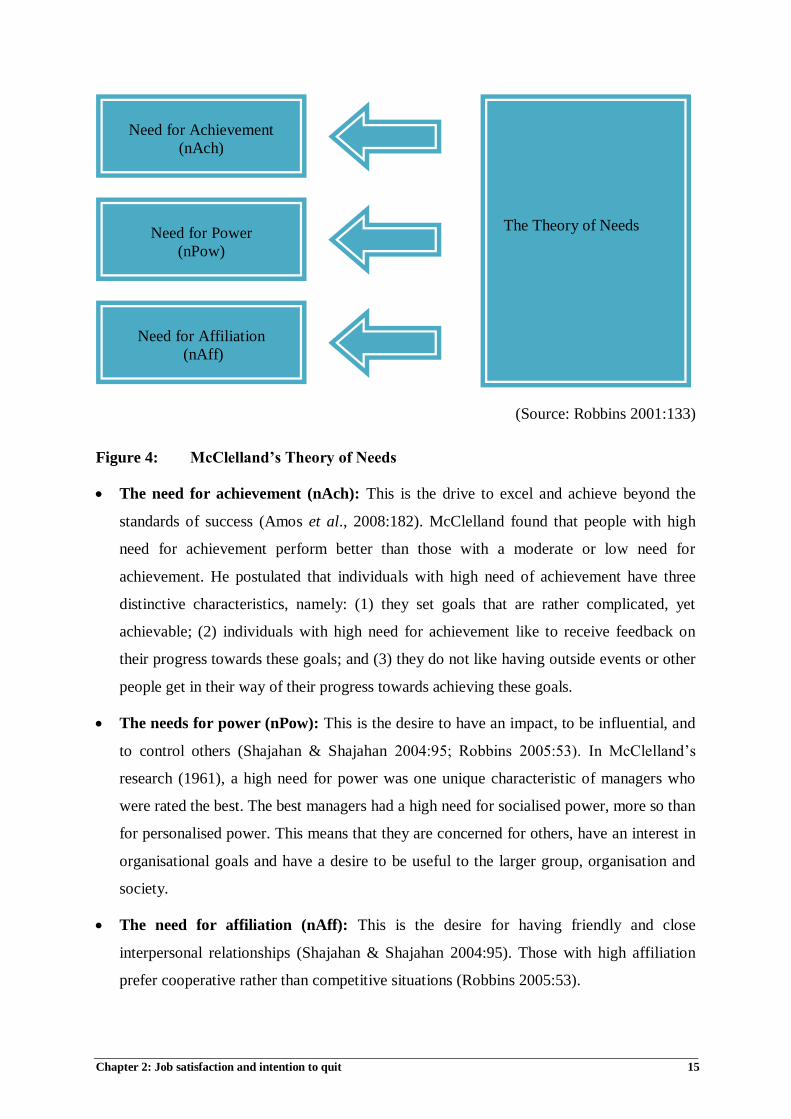
2.3.1.3 McClelland’s theory
Robbins, Judge, Millett and Walters-Marsh (2008:186-188), supports the theories of Maslow
and Alderfer by referring to motivation in terms of needs, but unlike Maslow and Alderfer,
they did not see the needs in terms of a hierarchy in which individuals move up and down.
For McClelland, an individual learns needs – or what he calls motives from interacting with
others in their social environments. He proposes that the three basic needs are operative in the
workplace, as highlighted in Figure 4 below:
Existence needs
Relatedness needs
Growth needs
Page 30
Chapter 2: Job satisfaction and intention to quit 15
(Source: Robbins 2001:133)
Figure 4: McClelland’s Theory of Needs
The need for achievement (nAch): This is the drive to excel and achieve beyond the
standards of success (Amos et al., 2008:182). McClelland found that people with high
need for achievement perform better than those with a moderate or low need for
achievement. He postulated that individuals with high need of achievement have three
distinctive characteristics, namely: (1) they set goals that are rather complicated, yet
achievable; (2) individuals with high need for achievement like to receive feedback on
their progress towards these goals; and (3) they do not like having outside events or other
people get in their way of their progress towards achieving these goals.
The needs for power (nPow): This is the desire to have an impact, to be influential, and
to control others (Shajahan & Shajahan 2004:95; Robbins 2005:53). In McClelland’s
research (1961), a high need for power was one unique characteristic of managers who
were rated the best. The best managers had a high need for socialised power, more so than
for personalised power. This means that they are concerned for others, have an interest in
organisational goals and have a desire to be useful to the larger group, organisation and
society.
The need for affiliation (nAff): This is the desire for having friendly and close
interpersonal relationships (Shajahan & Shajahan 2004:95). Those with high affiliation
prefer cooperative rather than competitive situations (Robbins 2005:53).
Need for Affiliation
(nAff)
Need for Power
(nPow)
The Theory of Needs
Need for Achievement
(nAch)
Page 31
Chapter 2: Job satisfaction and intention to quit 16
According to McClelland, the above-listed needs constitute the totality of needs. Therefore it
is critically important for a manager to determine his/her subordinates’ dominant need and to
offer opportunities whereby the individual’s needs and organisation’s goals can
simultaneously be met (Swanepoel, Erasmus & Schenk 2008:329).
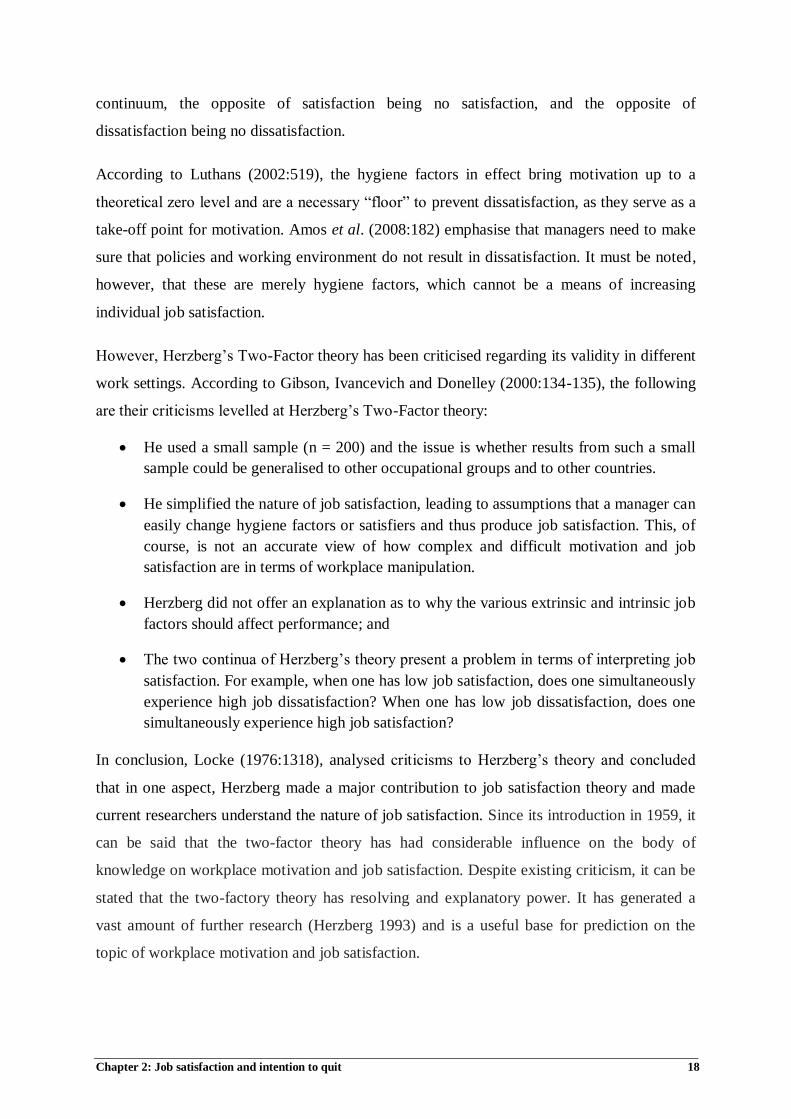
2.3.1.4 Herzberg’s two-factor theory
Herzberg's motivation-hygiene theory, also known as the Two-Factor theory, has received
widespread attention as having a practical approach toward motivating employees. Herzberg
(1959) did a motivational study in which he interviewed 200 accountants and engineers from
more than nine companies in the United States. These professionals were asked to describe
experiences in which they felt either extremely bad or exceptionally good about their jobs and
to rate their feelings on these experiences.
Tabulating these good and bad feelings, Herzberg argued that there are job-satisfiers
(motivators) related to the job contents (achievement, recognition, work itself, responsibility
and advancement) and job-dissatisfiers (hygiene factors) which are concerned with the job
context. The hygiene factors include: (1) company policy; (2) administration; (3) supervision;
(4) salary; (5) interpersonal relations with supervisor; and (6) working conditions (Amos et
al., 2008:180). Figure 5 illustrates Herzberg’s theory and provides examples of motivators
and hygiene factors. Motivators relate to the job itself while hygiene factors relate to the job
context.
Page 32
Chapter 2: Job satisfaction and intention to quit 17
Traditional view
Dissatisfaction
Satisfaction
Herzberg’s view
No satisfaction
Satisfaction
Dissatisfaction
Satisfaction
(Source: Amos et al., 2008:187)
Figure 5: Herzberg’s Two-Factor theory
In terms of this theory, as shown in figure 5, job satisfaction and dissatisfaction are not
opposite ends of the same continuum. Hygiene factors are independent from motivators.
Hygiene factors, if neglected, can make an employee dissatisfied, but, if addressed through
good pay, pleasant working conditions, and so forth, they do not contribute significantly to
job satisfaction and performance. Equally, if motivator factors are present, they will cause
satisfaction, but their absence will not cause dissatisfaction. The theory proposes a dual
Hygiene factors Company policy
Supervision Interpersonal
relationships
Working
conditions Status
Job security
Salary
Motivators Work itself Recognition
Achievement
Growth Advancement
Responsibility
Page 33
Chapter 2: Job satisfaction and intention to quit 18
continuum, the opposite of satisfaction being no satisfaction, and the opposite of
dissatisfaction being no dissatisfaction.
According to Luthans (2002:519), the hygiene factors in effect bring motivation up to a
theoretical zero level and are a necessary “floor” to prevent dissatisfaction, as they serve as a
take-off point for motivation. Amos et al. (2008:182) emphasise that managers need to make
sure that policies and working environment do not result in dissatisfaction. It must be noted,
however, that these are merely hygiene factors, which cannot be a means of increasing
individual job satisfaction.
However, Herzberg’s Two-Factor theory has been criticised regarding its validity in different
work settings. According to Gibson, Ivancevich and Donelley (2000:134-135), the following
are their criticisms levelled at Herzberg’s Two-Factor theory:
He used a small sample (n = 200) and the issue is whether results from such a small
sample could be generalised to other occupational groups and to other countries.
He simplified the nature of job satisfaction, leading to assumptions that a manager can
easily change hygiene factors or satisfiers and thus produce job satisfaction. This, of
course, is not an accurate view of how complex and difficult motivation and job
satisfaction are in terms of workplace manipulation.
Herzberg did not offer an explanation as to why the various extrinsic and intrinsic job
factors should affect performance; and
The two continua of Herzberg’s theory present a problem in terms of interpreting job
satisfaction. For example, when one has low job satisfaction, does one simultaneously
experience high job dissatisfaction? When one has low job dissatisfaction, does one
simultaneously experience high job satisfaction?
In conclusion, Locke (1976:1318), analysed criticisms to Herzberg’s theory and concluded
that in one aspect, Herzberg made a major contribution to job satisfaction theory and made
current researchers understand the nature of job satisfaction. Since its introduction in 1959, it
can be said that the two-factor theory has had considerable influence on the body of
knowledge on workplace motivation and job satisfaction. Despite existing criticism, it can be
stated that the two-factory theory has resolving and explanatory power. It has generated a
vast amount of further research (Herzberg 1993) and is a useful base for prediction on the
topic of workplace motivation and job satisfaction.
Page 34
Chapter 2: Job satisfaction and intention to quit 19
2.3.1.5 Locke’s goal setting theory
Locke (1968) asserted that intentions people have play an important role in formulating their
behavioural patterns. The basic idea of goal-setting is that people’s behaviour is motivated by
intentions, objectives and goals. According to Spector (2000:189), goals can be specific or
general, difficult or easy. Some specific goals lead to increased performance and difficult
goals (when accepted) lead to higher performance and increased satisfaction than easier goals
(Shajahan & Shajahan 2004:95). Therefore, goal-setting theory demonstrates that challenging
goals serve as motivating forces (Robbins 2005:54).
It is, however, difficult for specific goals to direct an employees’ behaviour unless these goals
were set in collaboration with each individual, understood and accepted by these individuals
(Amos et al., 2008:186). It is also difficult for specific goals to direct employees’ behaviour
unless they receive feedback (Spector 2000:190). Feedback regarding goals will result in
better performance than when the feedback is absent. People do better when they get
feedback on how well they are progressing toward their goals, as feedback identifies
discrepancies between what they have done and what they want to do (Robbins 2005:54).
2.3.1.6 Adam’s equity theory
Adam’s theory is particularly relevant in South Africa with its huge inequities and skewed
distribution of wealth (Swanepoel et al., 2008:330). According to Adam’s theory, people do
not work in a vacuum, they work alongside others and they make comparisons between their
perceived efforts and concomitant rewards, and the exertions of others and their rewards.
Equity theory suggests that individuals evaluate the ratio of their inputs to outcomes for a
given job in relation to other, referent employees. Inequity is perceived to exist if the ratios
are not equal. As a result of the tension thus created by this inequity, employees are
motivated to restore equity. Outcomes or inputs may be altered (both objectively and
psychologically); comparative referents (employees being compared) may be changed; or the
employee may withdraw from the situation (Swanepoel et al., 2008:331).
Adams’ equity theory calls for a fair balance to be struck between an employee’s inputs (hard
work, skill level, tolerance, enthusiasm, etc.) and an employee’s outputs (salary, benefits,
intangibles such as recognition, etc.). According to the theory, finding this fair balance serves
Page 35
Chapter 2: Job satisfaction and intention to quit 20
to ensure a strong and productive relationship is achieved with the employee, with the overall
result being contented, motivated and satisfied employees (Amos et al., 2008:184).
2.3.1.7 Self-determination theory
Employees’ self-determination is an integral part within an organisation as it predicts job
outcomes such as job satisfaction (Gagne & Deci 2005:331). According to Richer, Blanchard
and Vallerand (2002:2089), self-determied employees feel more committed to their
organisations and report fewer turn over intentions. Central to self-determination theory
(SDT) is the distinction between autonomous motivation and controlled motivation.
According to Gagne and Deci (2005:331-334), autonomy involves acting with a sense of
volition and having the experience of choice. It means endorsing one’s actions at the highest
level of reflection. The authors posit that intrinsic motivation is an example of automous
motivation. When people aengage in an activity because they find it interesting, they are
doing the activity wholly volitionally (e.g., I work because it is fun). In contrast, being
controlled invoves acting with a sense of pressure, a sense of having to engage in the actions.
SDT postulates that autonomous and controlled motivations differ in terms of both their
underlying regulatory processes and their accompanying experiences, and it further suggests
that behaviours can be characterised in terms of the degree to which they are autonomous
versus controlled. Autonomous motivation and controlled motivation are both intertional, and
together they stand in contrast to amotivation which involves a lack of intention and
motivation (Gagne & Deci 2005:334).
2.4 FACTORS INFLUENCING JOB SATISFACTION
According to researchers (Locke 1976; Luthans 1995; Spector 1996; Meudell & Rodham
1998; Pergamit & Veum 1999; Luthans 2002; Alavi & Askaripur 2003; Friday & Friday
2003; Bajpai & Srivastava 2004; George & Jones 2005; Choo & Bowley 2007; Blau &
DeVaro 2007; Kosteas 2009), the following factors: work conditions, supervision, co-worker,
promotion opportunities, compensation/pay, work itself and fairness influence job
satisfaction.
Page 36
Chapter 2: Job satisfaction and intention to quit 21
2.4.1 Work conditions
Condusive work conditions allow employees to do their job properly (Ozdemir 2009:103-
104). Arnolds and Boshoff (2001:39) postulate that factors such as temperature, lighting,
ventilation, hygiene, noise, working hours, and resources are all part of working conditions.
The absence of such working conditions, amongst other things, can impact poorly on the
worker’s mental and physical well-being (Baron & Greenberg 2003:177).
In a work place where there are no sufficient conditions, employee motivation level decreases
and such a situation affects employee job satisfaction negatively (Ozdemir 2009:103-104).
According to Spector (1997), employees who perceive high levels of constraints in terms of
their work environment, tend to be dissatisfied with their jobs. Contradictory literature,
however, indicates that “most people do not give working conditions a great deal of thought
unless they are extremely bad (Luthans 1995:128)”.
2.4.2 Supervision
Supervision forms a pivotal role relating to job satisfaction in terms of the ability of the
supervisor to provide emotional and technical support and guidance with work-related tasks
(Robbins et al., 2003:80). Robbins (2005:2) postulates that managers have a humanistic
responsibility to provide employees with jobs that are challenging, rewarding and satisfying.
Ozdemir (2009:103), however, found that supervisors who are interested in employees’ work,
assisting them in solving their work-related and personal life problems and developing
informal relations together with the formal ones are likely to increase employees’ job
satisfaction.
According to Alavi and Askaripur (2003: 591), managers must focus on the job satisfaction
of their employees because: (1) evidence suggests that dissatisfied individuals leave
organisations; (2) satisfied employees are in better health and have longer life expectancy;
and (3) job satisfaction in the workplace also affects individuals’ private lives, which in turn
has an effect on absenteeism and other important work-related attitudes and behaviour.
However, in Luthans’ view (2002:232), two aspects of supervision affect job satisfaction: (1)
employee-centredness, which is measured by the degree to which a supervisor takes a
personal interest in the employee’s welfare. This can be manifested in ways such as checking
to see how well the subordinate is doing, providing advice and assistance to the individual
Page 37
Chapter 2: Job satisfaction and intention to quit 22
and communicating with the worker on a personal as well as an official level; and (2)
participation or influence, whereby managers allow their subordinates to participate in
decisions that affect their own jobs. In most cases, this approach leads to higher job
satisfaction. A participative environment created by the supervisor has a more substantial
effect on worker’s satisfaction.
2.4.3 Co-Worker/Work groups
Another dimension which influences job satisfaction is the extent to which co-workers are
friendly, competent and supportive (Robbins et al., 2003:113). Research indicates that
employees who have supportive co-workers will be more satisfied with their jobs than those
who do not have supportive co-workers (Aamodt 2004:189; Robbins 2005:122). According
to Ozdemir (2009:103-104), when an employee feels like a stranger inside a group, he/she
loses motivation and morale and eventually shows low performance at work. This is mainly
because the work group normally serves as a source of support, comfort, advice and
assistance to the individual worker (Luthans 1995:127).
2.4.4 Promotion opportunities
Bull (2005:89) postulates that many people experience satisfaction when they believe that
their future prospects are good. This may translate into opportunities for advancement and
growth in their current workplace, or enhance the chance of finding alternative employment.
He maintains that if people feel they have limited opportunities for career advancement, their
job satisfaction may decrease.
Choo and Bowley (2007:315) argue that providing employees with internal job opportunities
is a means of demonstrating that they can realise their career goals inside rather than outside
the organisation. Choo and Bowley (2007:315) further argue that career growth help
employees to plan for the future and to be better equipped with the right skills in order to
remain competitive. When employees have the opportunity to be promoted, they tend to build
their career lives around the organisation because they know that they can achieve their
career goals within the organisation.
Bajpai and Srivastava (2004:90) postulate that promotion provides employees with
opportunities for personal growth, more responsibilities and also increased social status.
Promotions constitute an important aspect of employee’s labour mobility, most often carrying
Page 38
Chapter 2: Job satisfaction and intention to quit 23
substantial wage increases (Blau & DeVaro 2007:511; Kosteas 2009:269,) which also have a
significant impact on other job characteristics such as responsibilities, satisfaction and
subsequent job attachment (Pergamit & Veum 1999:581).
Locke (1976) advocates that the wish to be promoted stems from the desire for psychological
growth, the desire for justice and the desire for social status. Promotional opportunities
therefore have differential effects on job satisfaction, and it is essential that this be taken into
account in cases where promotion policies are designed to enhance employee satisfaction.
Management should therefore bear in mind that promotion can serve as a very positive
motivating tool in ensuring that the employee attains goals.
2.4.5 Compensation/Pay
Compensation, which is the pay an employee receives for a job (George & Jones 2005:84), is
very significant, but is a complex multidimensional predictor of job satisfaction
(Luthans1995:127). It is one of the most extrinsic indicators of job satisfaction, which
determines the level of job satisfaction of employees (Masroor & Fakir 2009:26). It meets
luxury needs and wants of people, along with their fundamental needs. According to Ozdemir
(2009:103), employees accept salary or compensation as the supervisors’ reward for the work
they have performed. Meudell and Rodham (1998:128) suggest that money can be considered
to act as both a “scorecard”, which enables employees to assess the value the organisation
places on them in comparison to others, and as a medium of exchange in that an individual
can purchase whatever he/she needs.
However, many controversies have surrounded the use of money as the utmost variable in
employee job satisfaction and retention. Chew and Chan (2008:507) argue that although pay
is acknowledged as a potential precursor of organisational commitment, job satisfaction and
the intention to stay, pay alone is not sufficient. They postulate that there are other
considerations besides the absolute value of one’s earnings that influence attitudes toward
satisfaction with pay.
Spector (1996:226) suggests that it is the fairness of pay that determines pay satisfaction
rather than the actual level of pay itself. If an employee’s compensation is therefore perceived
to be equitable when compared to another person in a similar position, satisfaction might be
the likely result. Atchison (1999) points out that an increase in pay only acts as a short-term
motivator and management therefore has to look at other ways to increase the levels of job
Page 39
Chapter 2: Job satisfaction and intention to quit 24
satisfaction. Birt, Wallis and Winternitz (2004:29) postulate that challenging and meaningful
work, advancement opportunities, high manager integrity, and new opportunities/challenges
rank among the highest variables that are considered important to job satisfaction.
2.4.6 Job or the work itself
Robbins et al. (2003:77) refer to the work itself as “the extent to which the job provides the
individual with stimulating tasks, opportunities for learning and personal growth, and the
chance to be responsible and accountable for results.” Robbins et al. (2003:80) posit that jobs
that are unchallenging lead to boredom and frustration. “It is fairly clear that employees who
find their work interesting, are more satisfied and motivated than employees who do not
enjoy their jobs” (Aamodt 2004: 326).
If a job is highly motivating, employees are likely to be satisfied with the job content and
deliver higher quality work (Friday & Friday 2003:429). According to Robbins (2005:180),
employees tend to prefer jobs which afford them the opportunity to apply their skills and
abilities, offer them variety and freedom as well as jobs where they get constant feedback on
how well they are doing. Hence, it is important for managers to take innovative steps to make
work more interesting in order to increase the levels of job satisfaction of employees.
2.4.7 Fairness
One factor related to job satisfaction is the extent to which employees perceive that they are
being treated fairly (Aamodt 2004:132). Accorrding to Kehinde (2011: 35), employees seek
policies and systems that they perceive to be fair as this will result in an increase in job
satisfaction. Distributive fairnes is perceived fairness of the actual decisions made in an
organisation. If employees perceive that decisions are made in a fair manner, they are likely
to express satisfaction with their jobs (Robbins 2005:181).
2.5 CONSEQUENCES OF JOB SATISFACTION
The gerneral concern for management is what the outcome will be should the employee be
satisfied or dissatisfied with a job and how this will have an overall effect on the
organisation. There is sufficient evidence to warrant that job satisfaction or dissatisfaction
can have positive or negative consequences for employees. The potential effects of job
satisfaction on different variables are explained in the follow section:
Page 40
Chapter 2: Job satisfaction and intention to quit 25
2.5.1 Productivity
According to Robbins and Judge (2009:122), happy or satisfied workers are more likely to be
productive workers. Coomber and Barriball (2007:297) support the above authors by stating
that job satisfaction leads to higher productivity, organisational responsibility, physical and
mental health. According to Coomber and Barriball (2007:297), a person who is satisfied
with his or her work, will work with a better mood, learn more skills and finally his/her
performance will increase.
Satisfied workers will be more productive and stay with the organisation longer, while
dissatisfied workers will be less productive and will have more tendency to quit jobs (Sarker,
Crossman & Chinmeteepituck 2003:745). In support, Al-Hussami (2008:286) affirmed that
satisfied employees tend to be more productive and committed to their jobs than dissatisfied
employees. Dawal, Taha and Ismail (2009:1) opine that employees generally work harder and
perform better when they are satisfied with their jobs.
Robbins (2005:133) concluded that productivity is more likely to lead to satisfaction than the
other way around. Hence, if employees do a good job (productivity), they intrinsically feel
good about it. In addition, higher productivity could lead to an increase in reward, pay level
and promotion, which are all sources of job satisfaction. However, the best conclusion about
job satisfaction and productivity is that there is a definite relationship, probably higher than
well known, but also not as high as conventional wisdom assumed, concerning happy
workers being productive workers (Luthans 2002:233). Although the large body of research
suggests that job satisfaction has a positive effect on productivity, this correlation is rather
modest (Robbins & Judge 2009:123).
2.5.2 Organisational citizenship behaviour
Job satisfaction is a determinant of organisational citizenship behaviour (OCB). Satisfied
employees are more likely to talk positively about the organisation, help others and go
beyond the normal expectations in their job. Moreover, satisfied employees are more prone to
go beyond the call of duty because they want to reciprocate their positive experiences and
contibute more (Robbins & Judge 2009:122).
According to Robbins and Judge (2009:123), more recent evidence suggests that job
satisfaction influences OCB through perceptions of fairness. Basically, job satisfaction comes
Page 41
Chapter 2: Job satisfaction and intention to quit 26
down to conceptions of fair outcomes, treatment and procedures. If employees feel that the
supervisor, organisational procedures, or pay policies are not fair, their job satisfaction is
more likely to suffer significantly. When they percieve organisational processes and
outcomes to be fair, they develop trust in the organisation and are eventually willing to
voluntarily engage in behaviours that go beyond their formal job requirements (Robbins &
Judge 2009:123).
2.5.3 Customer satisfaction
Evidence indicates that job satisfaction is a determinant factor of customer satisfaction. When
employees are satisfied, they are more likely to satisfy their customers. Satisfied employees
are more likely to be friendly, upbeat and responsive, which customers appreciate (Robbins
& Judge 2009:123). Customer retention and defection are highly dependent on how
employees deal with their customers. According to Robbins and Judge (2009:123), because
satisfied employees are less prone to turnover, customers are more likely to encounter
familiar faces and receive better services. These qualities build customer satisfaction and
loyalty.
2.5.4 Absenteeism
Absenteeism in the workplace is receiving increasing attention as organisations consider it
their most serious discipline problem. Cascio (2003:45) defines absenteeism as “any failure
of an employee to report for or to remain at work as scheduled, regardless of the reason”.
According to Luthans (1995), research has generally revealed a consistent inverse
relationship between job satisfaction and absenteeism. He found that when satisfaction is
high, absenteeism tends to be low and when satisfaction is low, absenteeism tends to be high.
Even though this correlation has been found to be rather moderate, the underlying assumption
is that its absence is at least in part the result of dissatisfaction on the job (Anderson
2004:25). Robbins and Judge (2009:123), support Anderson by stating that there is a
consistent negative relationship between job satisfaction and absenteeism, but the correlation
is moderate to weak.
Kihende (2011:27) states that absenteeism is caused by employees avoiding a painful or
dissatisfying work situation. He states that when employees find their jobs more challenging,
more interesting, or more pleasurable, they will be less absent than employees who find their
Page 42
Chapter 2: Job satisfaction and intention to quit 27
jobs less pleasurable. Although it is recognised that absenteeism may be caused by the
employee’s inability to report for work, job satisfaction is assumed to be a major factor
determining how often an employee is absent (Kihende 2011:27).
2.5.5 Turnover
Numerous researchers have attempted to answer the question of turnover and what
determines an employee’s intention to quit by investigating the possible antecedents.
According to Moore (2002:141), lack of job satisfaction is among the factors that contribute
to employee turnover. Research findings by Park and Kim (2009:20) show that job
satisfaction is a key precursor of voluntary turnover. Testa (2001), cited by Lee and Way
(2010:345), supports the above authors, by stating that job satisfaction has a significant
relationship with organisational commitment and employee turnover.
Job satisfaction has also been found by Yousef (2000:6) to be inversely related to withdrawal
behaviours such as tardiness, absenteeism and turnover. It has also been linked to increased
productivity and organisational effectiveness (Buitendach & De Witte 2005:27).
Tseane (2009:1) found that traditionally, quiting processes occur when an employee is
dissatisfied with his or her job, and he or she initiates a job search, and quits when a suitable
job is found. Braham (2005:11) supports Tseane by stating that employee turnover in many
cases is not a sudden or instant decision but a process of disengagement that can take days,
months, or even years before the decision to quit is reached.
2.5.6 Workplace deviance
According to Robbins and Judge (2009:124-125), job satisfaction predicts a lot of specific
behaviours, including unionisation attempts, substance abuse, stealing at work, undue
socialising and tardiness. These behaviours are indicators of a broader syndrome that could
be termed as “deviant behaviour in the workplace”. If employees do not like their working
environment, they will respond somehow and it is not always easy to forecast exactly how
they will respond. However, in most cases their behaviours will be abnormal (Robbins &
Judge 2009:125).
Page 43
Chapter 2: Job satisfaction and intention to quit 28
2.6 DEMOGRAPHIC DETERMINANTS OF JOB SATISFACTION
Studies investigating job satisfaction indicate that demographic determinants such as age,
gender, occupational level, tenure and educational level impact on job satisfaction.
2.6.1 Job satisfaction and age
Research on job satisfaction and age appears to be equivocal and has consistently found that
age exerts an influence on job satisfaction (Chambers 1999:75). While studies have yielded
mixed evidence in certain cases, the overwhelming body of research suggests a positive
association, that is, older employees tend to experience higher levels of job satisfaction
(Loscocco, 1990:152; Jones Johnson & Johnson 2000:155). The positive relationship
between age and satisfaction was also reported in a study by Oshagbemi (1997:511)
involving 554 university teachers. Academics below the age of 35 years reported the lowest
levels of satisfaction, followed by academics between the ages of 35 and 44 years. Academics
above 55 years reported as being the most satisfied with their jobs.
Siu, Spector, Cooper and Donald (2001:707) also found that age was positively related to job
satisfaction and mental well-being in a sample of managers Blood, Ridenour, Thomas,
Qualls, and Hammer (2002:283) argue that job satisfaction increases with age and work
experience. Older workers are more comfortable and tolerant of authority and may learn to
lower expectations for their jobs (Spector, 1996). Blood et al., (2002:283) postulate that older
workers may have jobs that use their skills better, work under better job conditions, benefit
from advancements and promotions, and appreciate fringe benefits more than younger, less
experienced workers.
Based on a review of literature on age, Rhodes (1983:328) concluded that overall job
satisfaction is related to age. Older workers appear to have greater satisfaction with their
employment than younger workers do, although this relationship is not clear. While Weiner
(1980:417) suggests a linear relationship, other studies such as Kacmar, Carlson and Brymer
(1989:976) and Staw (1995) report a U-shaped relationship. Clark and Oswald (1996:359)
ascribe this to the fact that younger employees may feel satisfied because they have little
experience about the labour market against which to judge their own work. Alternatively,
older employees may have reduced aspirations as they realise that they face limited
alternatives as they get older.
Page 44
Chapter 2: Job satisfaction and intention to quit 29
While the majority of researchers are in agreement regarding a positive relationship between
job satisfaction and age, certain studies have suggested a curvilinear relationship between
these two variables, that is, high satisfaction among young and old employees and low
satisfaction among middle-aged employees (Staw 1995). Robbins (2001:38) suggests that this
inconsistency may be due to the fact that studies have been intermixing professional and non-
professional employees. When the two types are separated, satisfaction tends to continuously
increase among professionals as they age, while it drops among non-professionals during
middle age and then rises again in the later years.
2.6.2 Job satisfaction and gender
The literature with respect to the relationship between gender and job satisfaction is
inconsistent. Some studies report that women have higher job satisfaction (Riggs & Beus
1993:32; Nestor & Leary 2000:38), whereas numerous studies across a variety of
occupational settings have, however, found no significant gender differences in job
satisfaction, despite the fact that women on average have inferior jobs in terms of pay, status,
level of authority, and opportunities for promotion (Hull 1999:687; Rout 1999:345; Jones
Johnson & Johnson 2000).
According to Jinnett and Alexander (1999:176), female employees demonstrate higher levels
of job satisfaction than their male counterparts across most work settings. Al-Mashaan
(2003:17), however, indicates that male employees in comparison to female employees report
higher levels of job satisfaction. He attributes this to the better chances for employment that
men are argued to have, and opportunities to advance in their jobs at a more rapid pace than
females.
Souza-Poza (2003:517) found that women’s satisfaction has declined substantially in the past
decade, whereas men’s job satisfaction has remained constant. Lim, Teo and Thayer
(1998:334) support Souza-Poza (2003:517) by maintaining that women are inclined to be
less satisfied in their jobs because they tend to hold positions at lower levels in the
organisational hierarchy where pay and promotion prospects are less attractive.
However, research conducted by Scandura and Lankau (1997:377) indicate that gender
differences in job satisfaction disappear when differences in perceived job characteristics,
age, tenure, education, income, and occupational level are controlled.
Page 45
Chapter 2: Job satisfaction and intention to quit 30
2.6.3 Job satisfaction and occupational level
Miles, Patrick and King (1996:277) found occupational level or job level to be a significant
predictor of job satisfaction. The above researchers examined job level or occupational level
as a structural determinant of role behaviour and suggest that job level moderates the
communication-job satisfaction relationship. Results from a study by Robbie, Ryan,
Schmieder, Parra, and Smith (1998:470) revealed a consistent and significant positive
relationship between these two variables. The authors maintain that the positive correlation
between rank and satisfaction may be attributed to the fact that higher-level jobs tend to be
more complex and have better working conditions, pay, promotion prospects, supervision,
autonomy and responsibility.
Gazioglu and Tanzel (2002) found that managers, professionals and clerical employees were
more satisfied with the influence of their job, although this was less apparent in clerical grade
staff. However, they were less satisfied with the amount of their pay as compared to the sales
employees. Clark and Oswald (1996:359) also found that those at the higher end of the
occupational scale reported higher satisfaction with various aspects of their work, but were
less satisfied with their pay. Oshagbemi (1997:511) as well found that the job satisfaction of
academics increases progressively with each higher rank. Therefore, the evidence from the
literature seems to suggest that job level is a reliable predictor of job satisfaction with
employees at higher ranks being generally more satisfied with their jobs than employees at
lower levels are.
2.6.4 Job satisfaction and tenure
Literature indicates that a positive correlation exists between tenure and job satisfaction
(Lambert, Hogan, Barton & Lubbock 2001:233). Tenure refers to the length of time for
which the individual has worked for the organisation (Lim et al., 1998:134). Employees with
longer tenure are more likely to be satisfied with their jobs than employees with shorter
tenure (Jinnett & Alexander 1999:176; Jones Johnson & Johnson 2000). Robbins (2001:36)
shares this view, but states, “when age and tenure are treated separately, tenure appears to be
a more consistent and stable predictor of job satisfaction than is chronological age.”
Kamarul, Sharifah, Zetty, Suzana, and Siti (2003:1) also found a statistically significant but
weak positive relationship between job tenure and job satisfaction. Moreover, a study by
Page 46
Chapter 2: Job satisfaction and intention to quit 31
Chambers (1999:69) established that employees with longer tenure were more satisfied with
their work itself as well as their level of pay. From this, it might be concluded that
satisfaction increases with time and that those benefits that increase in time, such as security
and experience, are likely to have an important influence on employee satisfaction.
However, the literature is both inconsistent and inconclusive in this regard. It may be because
the relationship between these variables depends on the specific organisations and how tenure
is viewed. In some organisations, senior employees are highly respected, while high tenure is
viewed as a liability in other organisations (Lambert et al., 2001:234).
2.6.5 Job satisfaction and educational level
Studies investigating the relationship between job satisfaction and educational level have
produced mixed results (Vorster 1992:133; Ting 1997:313; Clark & Oswald 1996:359).
Vorster (1992:133) maintains that the relationship between education and job satisfaction is
positive in nature. He found this association to be largely indirect, that is, the higher an
individual’s qualifications, the higher that individual’s job level and consequently so too, the
employee’s degree of satisfaction.
Lambert et al. (2001:234) found education to have no significant effect on job satisfaction.
Similarly, Clark and Oswald (1996:359) uncovered a negative relationship between
educational levels and job satisfaction, although other studies have supported the idea that no
significant relationship exists between job satisfaction and education. Ting (1997:313)
discovered education to have no effect on the satisfaction of federal government employees.
Rogers (1991:123) also failed to find support for a link between the satisfaction and
educational level of correctional service employees.
In a study by Loscocco (1990:152), education was found to exert a significant negative
impact on the job satisfaction of women, but not on that of men. This could be explained by
the fact that the educational experience is different for women than it is for men, thereby
raising the job expectations of women to a greater extent. If these job expectations are not
fulfilled, job satisfaction will be impacted on negatively.
Page 47
Chapter 2: Job satisfaction and intention to quit 32
2.7 INTENTION TO QUIT
Voluntary employee turnover is one of the most studied behaviours in management research
(Griffeth, Hom & Gaertner 2000:463). Many multivariate models and empirical tests within
this research stream have greatly enhanced knowledge about intention to quit. Process models
focus on how individuals arrive at their final decisions to quit, while content models focus on
why individuals quit organisations (Maertz & Campion 2004:566). While actual quitting
behaviour is the primary focus of interest to employers and researchers, intention to quit is
argued to be a strong substitute indicator for such behaviour (Kalliath & Beck 2001:72) and
has generated a number of studies that examine why employees leave or intend to leave their
organisations (Griffith & Hom 2001:1; Noe, Hollenbeck, Gerhart & Wright 2006:434).
The impact of employees’ intention to quit (ITQ) on organisational effectiveness and
employee morale has remained the focus of organisational researchers in recent times (Chen,
Polyhart, Thomas, Anderson & Bliese 2011:159), hence by identifying the determinants of
employees’ intention to quit, turnover behaviours could be predicted more accurately and
measures to prevent turnover could be taken in advance (Van Schalkwyk, Du Toit, Bothma &
Rothmann 2010:1).
2.7.1 Intention to quit described
Intention to quit refers to the degree of likelihood that the employee will terminate his/her
membership in a work organisation (Spreiter & Mishr 2002:17). Sousa-Poza and
Henneberger (2002:1) define intention to quit as “the reflection of the probability that an
individual will change his/her job within a certain time period”. It is also referred to as a
worker’s intention to leave the present organisation (Cho, Johanson & Guchait 2009:374).
The authors postulate that intention to quit is considered as a conscious and deliberate desire
to leave an organisation within the near future and it is also considered as the last part of a
sequence in the withdrawal cognition process.
Three elements exist in the withdrawal cognition process, namely, thoughts of quitting,
intention to search for job somewhere else, and the intention to quit (Cho, Johanson &
Guchait 2009:374). Blau (2000:115) hypothesises that intention to quit from an occupation is
a much more difficult decision than to quit the job. Boshoff, Van Wyk, Hoole and Owen
(2002:25) define intention to quit as “the strength of an individual’s view that they do not
Page 48
Chapter 2: Job satisfaction and intention to quit 33
want to stay with their employer”. Intention to quit is seen as a variable and is used as an
indication of the probability that an individual will leave the organisation in the near future.
The authors hypothesise that intention to quit starts with evaluation by the individuals of their
current situation, then they move through several further stages until a firm intention to quit is
reached. The final outcome can be a decision to leave the organisation.
Vandenberg and Nelson (1999:315) define intention to quit as an individual’s own estimated
probability (subject) that s/he is permanently leaving the organisation at some point in the
near future. The determinants of employee turnover have great relevance to the employee
who is thinking of quitting as well as for the manager who is faced with the lack of employee
continuity, the high costs involved in the induction and training of new personnel and the
issue of organisational productivity (Firth, Mellor, Moore & Loquet 2004:170; Siong, Mellor,
Moore & Firth 2006:231)..
Employee’s intention to quit comprises several constructs such as thinking of quitting and
intention to search for a job (Carmeli 2005:177), and will spark in one’s mind when an
employee feels that the organisation he/she works for does not fulfil his/her needs anymore
(Firth et al., 2004:170).
Job
Satisfaction
Job
Satisfaction
Thoughts of
quitting
Thoughts of
quittingIntention to
search new job
Intention to
search new jobIntention to
quit or stay
Intention to
quit or stayAction:
Quit or stay
Action:
Quit or stay
Probability of finding an
alternative job
Probability of finding an
alternative jobThoughts of
quitting
Thoughts of
quitting
(Source: Greenberg & Baron 1997:178).
Figure 6: Voluntary Turnover: A Model
This voluntary turnover model extracted from Greenberg and Baron (1997:178), suggests that
there are a number of elements relating to individuals, their jobs and economic conditions
Page 49
Chapter 2: Job satisfaction and intention to quit 34
that influence a decision to change jobs and organisations. There are many more variables
that are involved in making this decision, many of which are illustrated in the above model.
This model suggests that dissatisfaction with the job may lead to thoughts about quitting,
which results in an employee starting to explore other job opportunities. If this proves to be
successful, the employee may start developing serious intentions around whether to leave or
stay on the job, resulting in a particular action (Greenberg & Baron 1997).
Based on the negative impact of intention to quit on organisations, it is therefore imperative
for managers to seek better ways to manage their employees in order to retain valued human
resources and sustain high performance. Employees are the backbone of any business
success, and therefore need to be motivated and maintained at all costs to aid the organisation
to be globally competitive in terms of providing quality products and services to society
(Firth et al., 2004:170).
2.7.2 Theories of intention to quit
Turnover has become a significant challenge facing organisations today. The level of
turnover can be seen as an important indicator of the effectiveness and efficiency of an
organisation, both in the public and private sector (Park, Ofari-Dankwa, & Bishop 1994:353).
According to Abassi and Hollman (2000:333), cited in Ongori (2007:49), employee turnover
refers to the rotation of workers around the labour market, between organisations, jobs and
occupations, and between states of employment and unemployment. Lambert (2001:61)
defines turnover as the cessation of employment ties between an employee and an employer,
which has three main types, including quits, layoffs, and discharges.
Bluedorn (1978:678) suggests that these three types can be understood better by categorising
them as voluntary and involuntary turnover, of which voluntary turnover has become the
most frequently studied form of employee separation. Based on this approach, voluntary
turnover occurs when an employee initiates the termination or cessation of the employee-
organisation relationship. Various reasons for the focus on voluntary turnover exist. Firstly,
voluntary turnover accounts for the majority of turnovers. Secondly, a single theory is
unlikely to address the various antecedents of both voluntary and involuntary turnover.
Thirdly, the organisation’s management can control voluntary turnover more easily (Price &
Mueller 1981:543).
Page 50
Chapter 2: Job satisfaction and intention to quit 35
Voluntary turnover certainly represents one of the most important and recognised issues of
critical concern to both managers and organisations. Therefore, determining the causes of
employee turnover seems to have attracted the attention of behavioural scientists and
management practitioners for several decades. There are several important challenges that
can be identified among the consequences of employees’ voluntary turnover. These include,
but are not limited to, the lack of employee continuity and organisational stability, the high
costs associated with the recruitment of new staff (replacements), induction and training, and
organisational productivity (Feeley & Barnett 1997:370; Bertelli 2007:235).
Importunate staffing problems also occur in many organisations as a result of turnover
behaviours in their workforce. The loss of intellectual capital adds to the cost, since not only
do organisations lose the human capital and relational capital of the departing employee, but
also competitors are potentially gaining these assets (Ongori 2007:49). Staff turnover has
adverse effects on the quality of work, administrative costs, and staff morale due to increased
workload and resentment among remaining employees who must assume additional duties
(Byrd, Cochran, Silverman, & Blount 2000:69; Larrabee, Janney, Ostrow, Withrow, Hobbs,
& Burant 2003:271; Simons 2005:196).
According to Lambert (2001:61), high voluntary turnover can also become a public image
nightmare as it conveys a negative impression of work conditions. In addition, a latent effect
is that it could lead to a relatively large proportion of new employees hired, typically with
less training and experience, which can result into insufficient and overworked staff and even
impact on the quality of service rendered by the organisation. In all certainty, turnover
behaviour represents a critical concern because the money and time invested in recruiting,
hiring, training and development of individuals who then leave the organisation is lost
forever. Such costs are significant and increase as one moves up the organisational hierarchy
(Richer, Blanchard, & Vallerand, 2002:2089).
Over the years this has resulted in practitioners, managers and researchers making concerted
efforts to identify the antecedent factors that can be related to employee turnover. However,
the question facing the organisation is whether dealing with actual turnover is addressing the
cause of the problem or the effect thereof. This view resulted in a paradigm shift towards the
predictors of turnover behaviour. As a result, behavioural intentions have rapidly come into
vogue in the field of turnover research (Steel & Ovalle 1984:673), and turnover intention has
Page 51
Chapter 2: Job satisfaction and intention to quit 36
been shown to be among the best predictors of turnover (Griffeth et al., 2000:463; Podsakoff,
LePine & Lepine 2007:438).
As a corroboration to this view, several studies (e.g. Jaros, Jermier, Koehler & Sincich
1993:951; Lambert 2001:61; Armitage & Connor 2001:471; Benson 2006:173;) have used
turnover intentions as a precursor and indicative of actual turnover behaviour on the basis of
evidence that intentions are the most immediate determinants of actual turnover behaviour.
An employee’s intention to leave the organisation includes mere thoughts of quitting the
organisation and statements by the worker that he/she actually wants to leave the
organisation. It is only after proceeding through these stages that the employee actually
leaves the organisation (Jaros et al., 1993:591).
The use of turnover intention also has practical merit from a research perspective, as once
individuals have implemented the turnover behaviours, there is little likelihood of gaining
access to them to understand their prior situation (Siong et al., 2006:231), and it is less
expensive to collect data on turnover intentions than actual turnover (Bluedorn 1982:75).
Furthermore, the validity of studying turnover intentions in the workplace rather than the
actual turnover behaviour can be drawn from Sager’s (1991:25) longitudinal study, in which
turnover intention was found to discriminate effectively between leavers and stayers.
Alexander, Lichtenstein, Oh, and Ullman (1998:415) reported that turnover intentions were
significant predictors of actual turnover, and that the majority of variables in their model
impacted on turnover through turnover intentions. Turnover behaviour is seen as a multistage
process that includes attitudinal, decisional, and behavioural components (Martin & Roodt
2008:23; Lum, Clark, Reid & Serola 1998:305). The theory of planned behaviour (Ajzen
2001:27; Armitage & Connor 2001:471) suggest that behavioural intentions constitute the
most immediate determinant of actual behavioural acts, in this case turnover intention and
actual turnover.
Murrells, Robinson and Griffiths (2008:1) further suggest that the theory of planned
behaviour postulates that attitudes towards behaviour, subjective norms and perceptions of
behavioural control have a direct effect on intentions but an indirect effect, mediated through
intentions, on actual behaviour (i.e. attitudes affect intentions which then impact on
behaviour). They also assert that the theory identifies three independent determinants of
intention: (1) attitude towards behaviour, (2) subjective norm, and (3) perceived behavioural
Page 52
Chapter 2: Job satisfaction and intention to quit 37
control. The theory begins with the determinants of these antecedents and proposes that
behaviour is a function of salient information, or beliefs relevant to the behaviour. Since
people act in accordance with their intentions and perceptions of control over behaviour,
behaviours can be predicted from intentions with considerable accuracy when control is not
overly constrained (Richer et al., 2002:2089).
Tett and Meyer (1993:259) have successfully demonstrated that behavioural turnover
intentions consistently show moderate to strong correlations with turnover, therefore
substantiating Ajzen’s theory. Based on this notion, Ladebo (2005:355) concludes that an
individual who nurtures the thought of leaving his/her present employing organisation is
more likely to do so if the right conditions (such as an alternative job) exist, or if the adverse
condition that warrants the thought of intent persists.
In the study conducted by Shields and Ward (2001:692), quitting intentions were found to be
the strongest predictor of actual turnover. Carmeli (2005:330) and McCharthy, Tyrrel and
Lehane (2007:248), also found that intention to quit is a strong predictor of an employee’s
actual turnover across industries. They are precise indicators of ensuing behaviour, although
the reasons for these intentions are often unidentified (Firth et al., 2004:170). Van Dick,
Christ, Stellmacher, Wagner, Ahlswede, Grubba, Hauptmeier, Hohfeld, Moltzen and
Tissington (2004:351) agree that the observable fact is far from being fully understood,
especially because some of the psychological processes underlying the withdrawal from the
organisation are still unclear.
Mobley (1977:237) suggests that there are several other possible turnover cognition types of
interest to add in the withdrawal decision (the decision to quit a job), highlighting notions
such as thinking of quitting, followed by the intention to search for alternatives. Furthermore,
many studies have been based on the belief that turnover is an individual choice behavioural
pattern based on the conceptualisation that it is a psychological response (Mobley, Griffeth,
Hand & Meglino 1979:414; Lum, Kervin, Clark, Reid & Sirola 1998:305). Chronic stress,
inadequate pay, lack of recognition, increased job demand and other negative job
characteristics are identified as reasons relating to worker’s turnover intentions (Ellett 2001;
Scannapieco & Connell-Carrick 2007:31).
In previous literature, it is reported that a negative connection exists between positive
organisational support (POS) and intention to leave an organisation. Employees who feel
Page 53
Chapter 2: Job satisfaction and intention to quit 38
supported by their employers are less likely to look for outside work opportunities and lack
diligence in the workplace. The assumption thus is that an organisation encourages an
employee to remain in its employ when it shows concern for their material and psychological
well-being by seeking to establish a serene social context and a positive working climate
(Paillé, Bourdeau & Galois 2010:41).
Firth et al. (2004:170) highlight the following variables found to be related to intention to
quit:
the experience of job-related stress;
the range of factors that lead to job-related stress;
lack of commitment to the organisation; and
job satisfaction.
These variables can be mediated by personal or dispositional factors and by environmental or
organisational factors. Generally, the focus will be on the personal factors that mediate
between stressors and intention to quit, namely, aspects of personal agency, self-esteem and
social support. Personal agency refers to concepts such as a sense of powerlessness, locus of
control and personal control. Research findings strongly suggest that a greater sense of
personal agency is associated with a reduced risk of negative outcomes following major
negative life events and role-related stress (Firth et al., 2004:170).
Firth et al. (2004:170) hypothesise that social support has played an important role in
mitigating intention to quit, although findings are unequivocal. A study conducted with
nurses indicated that social support from supervisors reduced the level of nurses’ burnout and
indirectly, through reduced levels of burnout, reduced nurses’ intention to quit.
Birt et al. (2004:25) highlight that with continuance commitment, an employee bases his/her
choice to remain with the organisation on perceptions of other existing opportunities as well
as the cost of leaving the organisation rather than on a more emotional attachment to the
organisation as is found in affective commitment. Furthermore, Jaros et al., (1993:951)
postulate that continuance commitment reflects the extent to which an individual experiences
a sense of being locked in place because of the high costs of leaving. This idea stems from
the fact that the employee invests in an organisation, such as time, job effort, and the
development of work friendships, organisation-specific skills, and political deals, all which
constitute sunk costs that reduce the magnetism of outside employment alternatives.
Page 54
Chapter 2: Job satisfaction and intention to quit 39
Maetz and Campion (2004:566) identify the following eight motivational forces of
attachment and withdrawal, as depicted in Table 1 below:
Table 1: Motivational forces of attachment and withdrawal
Type of force Psychological motive for attachment or withdrawal
Affective:
Current affective response to an
organisation
This occurs when an individual is more attached
because membership currently provides employment
and positive emotions. Negative emotions responses to
job or organisational membership cause a withdrawal
response.
Contractual:
Psychological contract obligation
to an organisation and violation of
contract
A desire to perform professed obligations in the current
psychological contract through staying. On the other
hand, the desire to disband apsychological contract or to
respond to violations through quitting. This desire
depends on an employee’s holding a standard of
reciprocity to some extent.
Constituent:
Commitment to people or groups in
an organisation
A desire to preserve, or on the contrary, to end
relationship with constituents by staying or quitting.
This desire can stem from a number of motive forces.
The net force (for staying or leaving) may depend on
relationships with one or many constituents themselves
leave the organisation.
Alternative:
Perceived alternatives to a current
job
An employee’s self-efficacy beliefs regarding
competence to obtain alternatives, combining the
perceived confidence and quality of alternative options.
Page 55
Chapter 2: Job satisfaction and intention to quit 40
Type of force Psychological motive for attachment or withdrawal
Calculative:
Anticipated future satisfaction
associated with continued
organisation membership
An assessment of future value attainment possibilities
connected with continued membership. High expectancy
of value attainment or a positive calculation increases
psychological attachment, while low expectancy or
anagative calculation increases withdrawal propensity.
Normative:
Pressures to stay or leave an
organisation derived from the
expertation from others
A desire to meet perceived expectations of family
members or friends outside the organisation with respect
of quitting or staying. These pressures may come from
one or many parties, and the motivation to comply with
these expectations varies.
Behavioural:
Behavioural commitment to an
organisation
A desire to avoid the explicit and or psychological costs
of quitting. These costs are brought on largely by
memebership-related behaviours in the past or by
company policies regarding the velue of tenure.
Perceived costs can range from zero to a very high level.
Moral:
Moral/ethical values about quitting
A desire for uniformity between behaviour and values
with regards to turnover. Internalised values lie
somewhere on the continuum from “quitting is bad and
persistence is avirtue” to “changing jobs regularly is
positive; staying too long leads to stagnation”.
Source: (Maetz & Campion 2004:566)
Maertz and Campion (2004:566) highlight four decision type profiles, which include the
cognitive decision steps used and their timing, the type of event that likely triggered these
steps, and the alignment of motives or reasons that influenced the ultimate decision. These
four profiles are discussed below:
Impulsive quitters – driven by sharp negative affect followed by quitting “on the
spot”. Individuals experience strong negative affect, possibly from a psychological
contract breach, that they decide to quit instantaneously without any planning. The
Page 56
Chapter 2: Job satisfaction and intention to quit 41
impulsiveness of these decisions makes them hard to foresee and manage; therefore
management interventions ought to focus on increasing good feelings toward
organisations and minimising policies that extract strong negative effect among
employees.
Comparison quitters – attracted away from organisations by another job and are
moderately free of strong negative affect toward their current employers. The
employees feel more positive toward their organisations and may foresee good future
prospects for themselves.
Preplanned quitters – plan in advance to quit at a specific time in the future.
Individuals who preplan are less likely to be highly dissatisfied with their
organisations than impulsive quitters.
Conditional quitters – plan to quit if some uncertain event or shock occurs, as
perceived by the employees. Individuals experience different forces to withdraw. The
condition to be fulfilled does not automatically involve getting another job offer.
Management should consider instituting career advising, clarifying criteria for
promotion, and adhering to principles of procedural development opportunities.
Helping employees see futures for themselves with organisations may tempt them to
avoid making – or to rethink – conditional plans to quit.
In recent decades the environments in which organisations operate are largely characterised
by constant dynamic changes. As a result, organisations are experiencing continuous
development and modernisation of their technologies, and many of them are still labour-
intensive and largely dependent on human capital. This unpredictable environmental
dynamism forces organisations to invest a lot of resources in their employees in terms of
induction and training, developing, maintaining and retaining their skills and experience in
the organisation in order to be able to function optimally. Although one may argue that
organisations are becoming leaner, nevertheless voluntary turnover continues to affect them,
because they must be able to maintain a core of people who will serve as the source of
organisational life and represent the ‘heart, brain and muscle’ of the organisation (Meyer &
Allen 1991:133).
In addition, with globalisation heightening competition, organisations must continue to
develop tangible products and provide services which are based on strategies created by
Page 57
Chapter 2: Job satisfaction and intention to quit 42
employees. These employees are extremely crucial to the organisation since their value is
essentially intangible and not easily replicated (Ongori 2007:49). The ability of an
organisation to reach its goals depends in part on the skills, experience and effort of its
workforce. Employees can therefore be said to be primarily responsible for providing a
sustainable competitive advantage for their organisation, and the success of the organisation
depends on managing and retaining these employees (Lee 1988:263). If employee turnover
behaviour is not managed properly, it would affect the organisation adversely in terms of
personnel costs and in the long run it could affect its liquidity (Ongori 2007:49; Dess & Shaw
2001:446).
2.7.3 Factors influencing employees’ intentions to quit
Retention of skilled and experienced personnel is a priority for any organisation.
Organisations, both public and private, rely on the expertise of their employees in order to
compete favourably and indeed gain competitive advantage in the international market
(Samuel & Chipunza 2009:410). Sutherland and Jordaan (2004:55) emphasise that a critical
component in determining an organisation’s present and future success, is its ability to retain
knowledge workers. Therefore, knowing and understanding the factors influencing
employees’ turnover intentions is paramount as it will help practitioners, managers and
organisations develop strategies on how to prevent actual turnover (Ongori 2007:49).
A study by Pitts, Marvel and Fernandez (2011:60) suggest that there are three clusters of
factors influencing employees’ turnover intentions. These are:
psychological factors;
economical factors; and
demographic factors.
2.7.3.1 Psychological factors
Psychological factors refer to the employee’s mental process and behaviour. These factors are
psychological contract, job satisfaction, organisational commitment and job insecurity.
Psychological factors deal with factors that influence employee’s emotions, attitude and
perception (Muller & Price 1990:322).
Page 58
Chapter 2: Job satisfaction and intention to quit 43
Psychological contract
Psychological contract refers to an individual beliefs regarding the terms and conditions of a
reciprocal exchange agreement between that person and another party (Farmer & Fedor
1999:350). The concept of psychological contract is based on the insight that the employees’s
motivation and the level of their performance have to be maintained by the organisation
through incentives and rewards (Brinkmann & Stapf 2005:21-22). This give and take relation
between the employee and the organisation is a complicated process about exchange and
judgement, and is made up of manifold and reciprocal expectations. The psychological
contract contains all reciprocal yet unexpressed expectations, hopes and wishes of employees
or employers (Brinkmann & Stapf 2005:21-22).
According to Brinkmann and Stapf (2005:23), each lopsided accomplishment leads to
disequilibrium of the psychological contract. Lopsidedness occurs when the company
considers the employee only under the aspect of the organisational purpose and solely fulfils
the obligation on the formal contract such as wage payment. It signifies a negligence and
contempt of individual motives of the employees and leads to insufficient dedication.
Employees then tend to level their interest only on their wages. If the fulfilment of an
employee’s expectations, wishes and hopes fail to appear in the long run and the
disadvantages are not equilibrate by advantages, then the employee’s inner conflict will get
worse. If an employee is not able to bring about any changes, then work dissatisfaction will
occur and the employee will feel the break of the psychological contract (Brinkmann & Stapf
2005:23).
The foundation of the psychological contract is based on the social exchange theory, which
assumes that human behaviour is controlled by individual utility maximisation. Humans
strive to maximise benefits and minimise costs. Contract violations can trigger negative
responses such as low employee’s contributions, reduced satisfaction and eventually turnover
intentions (Farmer & Fedor 1999:352).
Job satisfaction
Research has implied that intention to quit is a strong surrogate indicator for actually quitting
behaviour (Firth, Mellor, Moore & Loquet 2004:170). The authors postulate that job stressors
and lack of job satisfaction are two of the factors that contribute to employees’ intention to
quit their jobs. Price (2001:624) also found that job satisfaction is one of the factors or
Page 59
Chapter 2: Job satisfaction and intention to quit 44
reasons for employees to develop intentions to leave the organisation. Intention to quit is
largely influenced by job dissatisfaction, lack of commitment to the organisation and feelings
of stress.
According to Pitts et al., (2011:60), employees with a lower level of job satisfaction are most
likely to leave their organisations. Therefore, managers need to monitor both the extrinsic and
intrinsic sources of job satisfaction available to employees (Firth et al., 2004:170).
Organisational commitment
Mowday, Steers and Porter (1978:226) defined commitment “as the relative strength of an
individual’s identification with and involvement in a particular organisation”. It is
characterised by three factors, namely:
a strong belief in and an acceptance of the organisation’s goals and values;
willingness to exert considerable effort on behalf of the organisation; and
strong desire to maintain membership in the organisation.
Commitment can be seen as the loyalty to a social unit such as an organisation, the subsystem
of an organisation or an occupation (Price 1997:335). Organisational commitment is defined
“as a psychological bond individuals have toward their organisation, characterised by a
strong identification with the organisation and desire to contribute towards attainment of
organisational goals” (Meyer & Allen 1991:61). Meyer and Allen (1991:61) conceptualised
commitment in terms of three distinct psychological states, which influence whether the
employees remain or leave the organisation:
Affective commitment – emotional attachment to the organisation;
Continuance commitment – recognition of the cost associated with leaving the
organisation; and
Normative commitment – perceived obligation to remain with the organisation.
Job insecurity
Hesselink and Vuuren Van (1999:275) define job insecurity as a “personal concern about the
continuity of the job”. Employees can feel insecure even though there are no reasons to feel
so. Job insecurity is more known concerning the future-uncertainty about future job
development and its possible discontinuity. Hesselink and Vuuren Van (1999:275) argued
Page 60
Chapter 2: Job satisfaction and intention to quit 45
that there are two dimensions that can cause job insecurity, which are: (1) perceived
probability; and (2) perceived severity.
The authors stated that “the more likely it is that an employee will lose his or her job and/or
the more severe the consequences of the loss are, the stronger his or her feelings of job
insecurity will be”. Job insecurity decreases work effort, resistance to change and intention to
job mobility, hence adversely impacting organisational effectiveness (Greenhalgh &
Rosenblatt 1984:438). The positive correlation between job insecurity and turnover intention
is to be expected. Employees who are worried about continuity of their employment are
likely to seek more secure jobs (Greenhalgh & Rosenblatt 1984:438).
2.7.3.2 Economic factors
Economists view the employee’s decision, whether the employee wants to leave or stay as a
result of a rational cost-benefit assessment (Muller & Price 1990:321). When rewards to costs
ratio of staying with an organisation are equal to the ration at another place of employment,
the employee will decide not to leave the current organisation. A study by Muller and Price
(1990:321) found that the following are economic factors influencing employee turnover
intention:
Remuneration - Employees’ satisfaction with remuneration/pay is regarded as one of
the critical determinates of turnover intetion. According to Muller and Price
(1990:321), pay is considered as a part of the sanctions system used by the
organisation to motivate employees to be in compliance with its regulations and rules.
It was also found that motivation has some link with job choice and that pay will not
be the sole criterion used when people decide to choose the job, or when they decide
to continue within an existing job (McGregor 1957).
External opportunity - External opportunity refers to the availability of alternative,
attractiveness and attainability of employment in the environment. The interaction of
supply and demand forces in the economy must be taken into consideration in
measuring external opportunity. The availability is mainly about the number of
opportunities outside the organisation. The attractiveness refers to the pay levels of
such opportunities. Attainability refers to the possession of the skills required on the
job. Thus numerous higher paid jobs for which a worker is qualified should produce a
greater turnover intention (Muller & Price 1990:321).
Page 61
Chapter 2: Job satisfaction and intention to quit 46
Advancement or promotion - Both meta-analysis studies by Cotton and Tuttle
(1986:55) and Griffeth et al., (2000:88) uncovered that most empirical studies regard
satisfaction with advancement or promotion as one of the critical determinants of
employees’ turnover intentions. Suggesting the importance of considering internal
movement (or promotion) within an organisation in terms of an organisational
turnover trend, Johnston, Griffeth, Burton and Carson (1993:33) suggest a compelling
explanation of a negative relationship between promotion and turnover intention.
2.7.3.3 Demographic factors
In their meta-analysis study on employees’ turnover, Cotton and Tuttle (1986:55) suggest that
age is negatively related to employees’ turnover intention. Another recent study by Pitts et
al., (2011:751) empirically suggests that there is a difference in turnover intention among
federal employees in different age groups. Using the federal employee viewpoint survey data,
they measure federal employees’ turnover intention in two dimensions: intention to leave
agency, and intention to leave the federal government. While their results show all federal
employees are less likely to leave the federal government as they are getting older, younger
federal employees between 30 to 49 years old are more likely to leave their agency and find
new jobs within the federal government (Pitts et al., 2011:751).
Tenure is defined as employee’s time spent at his or her workplace and is negatively related
to employee’s turnover. An employee could build a strong interpersonal attachment in the
workplace when spending more time with other employees. The stronger interpersonal
attachment an employee has, the lower intention to leave the job. Empirical findings (Cotton
& Tuttle 1986:55; Griffeth et al., 2000:88) support this statement.
For example, in their study on antecedents and correlates of employee turnover, Griffeth et
al. (2000:88) discovered a negative relationship between an individual employee’s tenure
status and his or her turnover intention. Pitts et al. (2011:756) also suggest supportive
findings of a negative relationship between job tenure and federal employees’ turnover
intention. Pitts et al. (2011:756) suggest that “longer agency tenure makes an individual less
likely to intend to leave his or her agency and less likely to intend to leave the federal
government entirely”.
Page 62
Chapter 2: Job satisfaction and intention to quit 47
2.8 RELATIONSHIP BETWEEN JOB SATISFACTION AND INTENTION TO
QUIT
Many studies conducted in different settings had consistently discovered a negative and
significant relationship between job satisfaction and turnover intentions (Griffeth, Hom &
Gaertner 2000:463; McCulloch & Turban 2007:63; Duraisingam, Pidd & Roche 2009:31).
Rahman, Raza and Ramay (2008:45) found that job satisfaction had a negative effect on
turnover intentions of IT professional. Khatri and Fern (2001:54) concluded that there was a
modest relationship between job satisfaction and turnover intentions. According to Brough
and Frame (2004:8), job satisfaction is a strong predictor of turnover intentions.
Similarly, studies conducted by Yang (2008:43); Jiang, Baker and Frazier (2009:84) and
Lam, Baum and Pine (2001:35) discovered that there is a negative association between job
satisfaction and turnover intentions among employees. Price (2001:624) also found that job
satisfaction is one of the factors or reasons for employees to develop intentions to leave the
organisation. Meta-analytical studies show a consistently modest correlation between job
satisfaction and turnover intentions (Griffeth et al., 2000:463).
Research has implied that intention to quit is a strong surrogate indicator for actually quitting
behaviour (Firth et al., 2004:170). The authors postulate that job stressors and lack of job
satisfaction are two of the factors that contribute to employees’ intention to quit their jobs.
Intention to quit is largely influenced by job dissatisfaction, lack of commitment to the
organisation and feelings of stress. Given their importance in quitting intentions, managers
need to monitor both the extrinsic and intrinsic sources of job satisfaction available to
employees (Firth et al., 2004:170).
Mobly et al. (1979:493) proposed that the relationship between job satisfaction and turnover
is moderated by intentions, and most researchers accept the premise that intention to stay or
leave a job with a particular employer is the final cognitive step in decision making process
of voluntary turnover. As a result, turnover intention has been integrated in most employee
turnover models. At the centre of most turnover theories is the proposal that job satisfaction
directly and negatively relates to employees’ intention to quit their jobs, which in turn
positively relates to actual turnover (Chen et al., 2011:159).
Mobley, Horner and Hollingsworth (1978:414) proposed a theoretical casual process of
turnover intention that included job satisfaction. According to Mobley et al. (1978:414) and
Page 63
Chapter 2: Job satisfaction and intention to quit 48
colleagues, job satisfaction impacts a cognitive withdrawal process that stresses turnover
intention. Lee and Mitchell (1994:51) in their model of voluntary turnover argue that turnover
is influenced by variety of variables, including lack of job satisfaction. According to Moore
(2002:490), job satisfaction is one of the factors that contribute to employees’ intention to
quit.
Martin (2007:45) determined in the meta-analysis a relationship between the three forms of
commitment (affective, continuance and normative) as well as their subsequent variables
identified as antecedents, correlates and consequences. Their results indicated a significant
relationship between job satisfaction and turnover intention. Furthermore, research has found
significant correlations in the meta-analysis, yielding correlation values contributing to
turnover intention, for organisational commitment (- 0.38) and job satisfaction (- 0.28). Other
research has also found job satisfaction and commitment to contribute independently to the
prediction process of turnover intentions or withdrawal cognitions. However, job satisfaction
is seen to be the stronger predictor of turnover intention or withdrawal cognitions than
commitment (Martin 2007:45).
While certain researchers maintain that a direct relationship exists between job satisfaction
and turnover intentions (Clugston 2000:477; Lambert, Hogan & Barton 2001:250), a growing
body of literature suggests that the relationship is neither simple nor direct (Saal & Knight
1988). According to McCarthy et al., (2007:248), intentions are the most direct determinants
of actual behaviour. They are direct indicators of a consequent behaviour, although the
reasons for these intentions are often unidentified (Firth et al., 2004:170).
2.9 CONCLUSION
The chapter has focused on the two main variables of the current study, namely, job
satisfaction and intention to quit. In this chapter, a brief overview of theories of job
satisfaction (JS) and intention to quit (ITQ) were discussed, as well as consequences
(productivity, organisational citizenship behaviour, absenteeism, turnover and workplace
deviance) and demographic determinants (age, gender, occupational level, tenure and
educational level) respectively. Factors influencing job satisfaction (work conditions,
supervisor, co-workers, promotion opportunity, compensation and work itself) and intention
to quit (psychological factors, economical factors and demographic factors), which were
Page 64
Chapter 2: Job satisfaction and intention to quit 49
identified from the literature were also discussed. And lastly, the relationship between job
satisfaction and intention to quit was also explained.
Page 65
Chapter 3: Research design and methodology 50
CHAPTER 3
RESEARCH DESIGN AND METHODOLOGY
3
3.1 INTRODUCTION
The previous chapter presented the literature review on employees’ perceptions of CSR,
organisational commitment and intentions to stay. This chapter describes the research
methodology used in this study. The geographical area where the study is conducted, the
study design, the population and sample are also described. The instrument used to collect the
data, including methods implemented to maintain validity and reliability of the questionnaire
are described as well as ethical considerations and data analysis are also discussed.
3.2 RESEARCH DESIGN
In order to meet the objectives of this study a survey design was adopted. Beukman
(2005:221) defines a survey design as a design that puts questions to a sample of respondents
by means of a questionnaire. An empirical investigation using a quantitative research
approach was applied in this study to obtain a deeper understanding of job satisfaction and
employee intention to quit. Muijs (2004:1) defines quantitative research as the collection and
analysing of numerical data using mathematically based methods. The rationale for selecting
a quantitative research approach is that it classifies the features of collected data, counts
them, and constructs statistical models through the questionnaire feedback (Punch 2002:3).
A quantitative approach also eliminates or minimises subjectivity of judgement (Kealey &
Protheroe 1996:141). The data collected when utilising quantitative research is usually
objective, numerically, and statistically based (Westerman 2006:263). This approach has
been chosen because it provides “quick, inexpensive, efficient and accurate means of
assessing information” (Zikmund, Babin, Carr & Griffin 2010:187).
Research designs vary depending upon the type of research; research can be grouped into
exploratory, descriptive and hypothesis testing types (Sahu 2013:26-27). A descriptive design
aims to explain phenomena such as human behaviour in the business, and administrative
sciences, by indicating how variables are related to one another, and in what manner one
variable affects the other (Churchill & Iacobucci 2005:74). Burns and Grove (2004:201) are
Page 66
Chapter 3: Research design and methodology 51
of the view that descriptive research is designed to provide a picture of a situation as it
naturally happens. This method is selected because it provides an accurate portrayal or
account of the characteristics (behaviours, opinions, abilities, beliefs, and knowledge of a
particular individual, situation or group). In addition, it also allows researchers to study larger
groups of individuals more easily (Jackson 2012:17). Therefore, a descriptive approach was
followed in this study.
3.3 SAMPLING DESIGN PROCEDURE
3.3.1 Target population
Welman, Kruger and Mitchell (2005:52) define the target population as the population which
encompasses “the total collection of all units of analysis about which the researcher wishes to
make specific conclusions.” The population for this study includes both males and females of
all races (blacks, whites, coloureds and Indians), experienced and inexperienced employees,
who are currently permanently employed at Babcock Africa company situated in
Bedfordview, in the Gauteng province of South Africa. The population consists of the
following occupations: engineers, operators, technicians, artisans, administrative staff, and
safety, health and environmental specialists. The total number of the population equals to 181
employees (N = 181).
3.3.2 Sampling frame
A sampling frame is the list or quasi list of units, composing a population from which a
sample is selected (Babbie 2008:222). According to McCormack and Hill (1997:51), any
business or organisation which holds a database of employees, faces a relatively simple task
of compiling a sample frame for any research. Babcock has a database of all employees in the
HR department. Therefore, the sampling frame is drawn from the database.
3.3.3 Sampling method
Sampling is the process of selecting a few (a sample) number of respondent from a bigger
group (the sampling population) to become the basis for estimating or predicting the
prevalence of a piece of information, situation or outcome regarding the bigger group (Gupta
& Gupta 2011:41). A sample in research terms refers to a finite part of a statistical population
whose properties are used to make estimates about the population as a whole (Singh
Page 67
Chapter 3: Research design and methodology 52
2007:88). Andrew, Pedersen and McEvoy (2011:49) stated that researchers’ goal should be to
collect a sample that is large enough to be representative of the population but not too large
as to incur unnecessary cost. Due to the small size of the population, no sampling was done,
but a census was drawn (N =181).
3.3.4 Sample size
According to Hayes (2008:84), when the target population is small, a census sampling
approach should be administered to gather data. Hayes (2008:84) defines census sampling as
“an approach to gather data from the whole target population.” Therefore, a sample size of
the study was the whole target population (N = 181).
3.3.5 Sampling inclusion criteria
Subjects included in the sample were selected to meet the following specific criteria:
They should have worked in the organisation for more than six (6) months. Trainees,
contractors and interns were not included in this study.
They were willing to participate.
3.3.6 Data collection method and the questionnaire
A survey method using a questionnaire was used in this study to collect appropriate
information. Gravetter and Forzano (2011:640) define a survey as a “way to gather large
amounts of information using a questionnaire.” The rationale for using a survey method was
that it is a quick, flexible, inexpensive, effective and accurate means of assessing information
about the population (Zikmund 2003:175). This survey was conducted by means of a fully
structured questionnaire comprising a compilation of close-ended questions with multiple
options for respondents to choose from.
3.3.6.1 Questionnaire design
Questionnaires normally consist of a list of questions or statements that respondents are
requested to answer or indicate the extent to which they agree or disagree with a given
statement (Goddard & Malville 2001:47). According to Welman et al., (2005:188) the
purpose of a questionnaire is to investigate attitudes, feelings, beliefs, behaviour, knowledge
and demographics characteristics. Questionnaires can consist of open- or closed-ended
Page 68
Chapter 3: Research design and methodology 53
questions. Closed-ended questions offer the respondent a range of possible answers from
which the respondent must then select his/her appropriate choice (Welman et al., 2005:174).
Goddard and Malville (2001:47) suggest that a good questionnaire should have the following
qualities:
provide clear instructions;
be short and complete;
start with general questions;
only ask relevant but appropriate questions;
ask objective questions that are precise, explicit and understandable
ask sensitive questions at the end; and
consist mostly of closed-ended questions.
The questionnaire consisted of three sections. Section A contained questions requesting the
following personal information of the participants: gender; age; years of service; marital
status; place of work, highest level and current position/job level.
Section B focused on job satisfaction and the Minnesota Satisfaction Questionnaire (MSQ)
was used to gather data about job satisfaction of the participants. The MSQ consists of 20
items (Spector 1997) and uses a 5-point Likert-type response scale anchored at the extreme
poles (e.g. “never” 1-low intensity, to “always” 5-high intensity. The MSQ comprises of two
distinct components: Intrinsic job satisfaction measures feelings about the nature of the job
tasks. For example, question 15 covers: “The freedom to use my own judgement”. Extrinsic
job satisfaction measures feelings about situational job aspects, external to the job. For
example, question 13 covers: “My pay and the amount of work I do”.
Section C focused on intention to quit and questionnaire developed by Roodt (2004b:1) was
used. The questionnaire consists of fourteen items. However, only five questions were used
for this study. A 5-point Likert scale was used ranging from “Very dissatisfied” on one end to
“Very Satisfied” on the other end. The five-point scale allowed for the possibility of a neutral
answer. Examples of items included in this questionnaire were: “How often have you
recently considered leaving your job?” and “How frequently have you been scanning
newspapers for new job opportunities?”
Page 69
Chapter 3: Research design and methodology 54
3.4 PILOT TESTING THE QUESTIONNAIRE
A pilot study is defined by Monette, Sullivan, Dejong and Hilton (2013:9) as a small-scale
trial run of all the procedures planned for use in the main study that might include a test of
procedures for selecting the sample and an application of the statistical procedures to be used
in the data-analysis stage. Due to the fact that an existing validated questionnaire was utilised
for this study, no pilot study was performed on the questionnaire, but it was pre-tested. A
questionnare must be pre-tested to uncover any problems it may have and address them
before the main study is carried out (Mackey & Gass 2005:36),.
According to Mackey and Gass (2005:36), these problems may include: (1) questions that
respondents do not understand; (2) ambiguous questions; (3) questions that combine two or
more issues in a single question (double-barrelled questions); and (4) questions that make
respondents uncomfortable. From a sample of 306, Sutherland and Jordaan (2004:58)
selected 30 respondents to pre-test their questionnaire. Therefore, in this study, 30
respondents were selected for pre-testing it. Subsequently, changes were made to the
questionnaire, where some items were deleted or rephrased.
3.5 DATA PREPARATION
Kothari (2004:122) stated once data has been collected, it has to be processed and analysed in
accordance with the outline procedure for the purpose of developing the research plan. This is
essential for a scientific study and for ensuring that all relevant data for making contemplated
comparisons and analysis are available. Processing implies editing, coding, classification and
tabulation of the collected data so that it is suitable for analysis (Kothari 2004:122). In this
section, editing and coding are addressed.
3.5.1 Editing
According to Neuman (2006:130), the first step in data preparation is to edit raw data
collected through questionnaires. Editing is a process of checking to detect and or correct
errors and omissions. Editing consists of scrutinising the completed research instruments to
identify and minimise, as far as possible, errors, incompleteness, misclassification and gaps in
the information obtained from the respondents (Neuman 2006:130). Therefore, completed
questionnaires were scrutinised to ensure that data generated is: accurate; consistent with
Page 70
Chapter 3: Research design and methodology 55
intent of question and other information in the survey; uniformly entered; and arranged to
simplify coding and tabulation.
3.5.2 Coding
According to Welman et al. (2005:214), the purpose of coding is to analyse and make sense
of the data that have been collected. Codes are tags or labels that attach meaning to the raw
data or notes collected during fieldwork. Coding errors were eliminated with the use of both
pre-coding and hand coding. The questionnaire was hand coded in the margin with a coloured
pencil from 1 to 181 by allocating a code number to each respondent for identification.
Section A (biographical information) of the questionnaire was also hand coded from question
A1 to A8 by allowing numbers to each response, for example, gender was coded (1=male and
2=female). The pre-coding procedure was used throughout the questionnaire by providing a
set of response options to the respondents and by assigning a code number to each respective
question and response of Sections B and C of the questionnaire.
3.6 STATISTICAL ANALYSIS
According to Welman et al. (2005:210), the main objective of data analysis is to transform
information (data) into a meaningful form in order to answer the original research
question(s).
The description of quantitative data can be done using two descriptive measures, namely, the
measure of the central tendency and the measure of variance, of which the most common
value calculated for the units of analysis is the central tendency. During this study, data were
analysed using descriptive and inferential statistics. Descriptive statistics are concerned with
the description and/or summarisation of the data obtained for a group of individual units of
analysis (Welman et al., 2005:231).
Inferential statistics are concerned with inferences made about population indices based on
the corresponding indices obtained from samples drawn randomly from the population
(Welman et al., 2005:236). Creswell et al. (2007:198) define inferential analysis as the
process of deducing properties of an underlying distribution by analysis of data.
Page 71
Chapter 3: Research design and methodology 56
Tabulating was used to make comparisons of the demographics and was also used as the
basis for presenting the data graphically. The data was analysed using the Statistical Package
for Social Sciences SPSS 22.0.
The following statistical terms were used during the statistical analysis of the data.
Mean: The sum of the measurements divided by the total number of measurements. This is
the average value for the variable. The mean makes use of every score of the distribution and,
therefore, is the most correct measure of central tendency (Bless & Kathuria 2001:46).
Variance: Variance is a measure of how far a set of numbers is spread out, describing how
far the numbers lie from the mean (expected value). Calculations of variance can be obtained
by means of range or standard deviation, depending on the objective at hand.
Standard deviation: Standard deviation is the most commonly used measure of variation as
it includes all scores in the distribution using the mean. It indicates how much variance or
dispersion exists from the average (mean, or expected value). A low standard deviation
indicates that the data points tend to be very close to the mean; high standard deviation
indicates that the data points are spread out over a large range of values (Bless & Kathuria
2008:63).
Frequency distribution: These are used to establish if the distribution is even across the
intervals or whether they are bunched around one or two intervals (Welman et al., 2005:230).
Factor analysis: Factor analysis is a major technique in multivariate statistics and has a vital
task in demonstrating which variables clump together to form super-ordinate variables. The
aim is to make order out of chaos, whereby complex interactions between variables that inter-
correlate can be analysed. Furthermore, “the purpose is to find out how much of the variation
in all variables can be accounted for, by a much smaller number of factors or underlying
dimensions” (Burns & Burns 2008:441).
According to Hinton (2004:305), the two most useful tests often carried out prior to factor
analysis are the Kaiser-Meyer-Olkin (KMO) test that examines the data for sampling
adequacy. “This gives a measure of the common variance amongst the variable that the
factors will be accounted for” (Hinton 2004:305).
Page 72
Chapter 3: Research design and methodology 57
The second test is the Bartlett’s test of sphericity, which tests if there is a variable that does
not correlate with other variables as expected and are worth investigating (Hinton 2004:305).
T-test: The t-test or the student’s t-test, also known as the independent t-test, is an inferential
statistical test that determines whether there is a statistically significant difference between
the means in two unrelated groups. The objective of T-test is to test whether the means for
unrelated groups are equal or that the means are not equal (Leedy & Ormrod 2010:182).
ANOVA: ANOVA stands for one-way analysis of variance. It is also used to determine
whether there are any significant differences between the means of three or more independent
groups (Leedy & Ormrod 2010:182).
3.7 RELIABILITY AND VALIDITY
It is important to ensure that factors that could affect the results of the research are controlled.
If not, it is impossible to come to a reliable and valid conclusion. Therefore, it is critical that
measurement instruments are valid and reliable.
3.7.1 Reliability
In explaining the concept of reliability, Punch (2003:52) defines reliability as “consistency or
dependability of a measure”. This concerns whether the same respondents would answer the
same questions in the same way if they were to be asked again. Cohen et al., (2007:506)
argue that reliability in quantitative analysis takes two main forms, both of which are
measures of internal consistency: the split-half technique and the alpha coefficient, when both
calculate a coefficient of reliability that can lie between 0 and 1. To assure the accuracy or
precision of the questionnaire, the Cronbach alpha coefficient technique was used in this
study to enhance the reliability of the survey instrument. Sekaran (2005:185) states that if the
Cronbach’s alpha is less than 0.6, this means that the instrument used has a low reliability
(and thus opens for some errors). However, if the alpha value is within 0.7, it is therefore
acceptable.
3.7.2 Validity
Drost (2011:114) explains that validity is concerned with the meaningfulness of research
components and describes the extent to which an instrument accurately measures the target it
Page 73
Chapter 3: Research design and methodology 58
was designed to measure. In quantitative data, validity might be improved through careful
sampling, appropriate instrumentation and appropriate statistical treatments of data (Cohen et
al., 2007:133). Validity of the questionnaire was yielded in this study through content,
construct and face validities. Below are brief explanation of these types of validity.
3.7.2.1 Content validity
Content validity refers to the extent to which a measure thoroughly and appropriately
assesses the skills or characteristics it is intended to measure (Fink 2010:116). Wynd,
Schmidt and Schaefer (2003:509) identified two interrelated steps in this process. It starts by
identifying the entire domain of content related to the phenomena of interest with a thorough
review of literature; it then follows with a development of the instrument (items content)
associated with the identified domain of content (Wynd et al., 2003:509). Cohen et al.,
(2007:137) added that to demonstrate this form of validity the instrument must show that it
fairly and comprehensively covers the domain or items that it purports to cover. Fox and
Bayat (2007:97) state that the validity of a question should not be taken for granted and
should be scrutinised by experts before the questionnaire is implemented. To ensure content
validity in this study, the researcher submitted the instrument to the subject matter experts for
comments and recommendations prior to the implementation and then aligned the instrument
accordingly.
3.7.2.2 Construct validity
Construct validity of a measuring instrument refers to the degree to which it measures the
intended construct rather than irrelevant construct or measurement error (Welman et al.,
2005:142). Construct validity is a type of validity neither purely judgmental nor absolutely
empirical that aimed at determining the extent to which the constructed tool is able to
measure a construct (hypothesised idea to describe or explain the behaviour under
measurement) (Mangal & Mangal 2013:586). Thomas, Nelson and Silverman (2011:197) are
of the view that correlation can be used in establishing construct validity. Thus, construct
validity were ascertained in this study through correlation, factor analysis and Cronbach
alpha coefficients of the main study.
3.7.2.3 Face validity
Face validity is the extent to which, on the surface, an instrument looks as if it is measuring a
particular characteristic (Leeddy & Ormrod 2010:92). It is often useful for ensuring the co-
Page 74
Chapter 3: Research design and methodology 59
operation of people who are participating in the research study. However, because it relies
entirely on subjective judgement, it is not, in and of itself, extremely convincing evidence
that an instrument is truly measuring what the researcher wants to measure (Leeddy &
Ormrod 2010:92). Face validity was ascertained through pre-testing of the questionnaire and
reviewing it prior to the main survey.
In summary, in order to ascertain validity in this study, the researcher made use of three
methods of validity, namely: content, construct and face. Content validity was assured by
careful sampling all the items to ensure their representativeness. Construct validity was
yielded by factor and correlation analyses, while face validity was ascertained through pre-
testing of the questionnaire and reviewing it prior to the main survey. Many other precautions
were taken into account to ensure and enhance validity in this study such as: choosing an
appropriate time scale, selecting appropriate instrumentation (questionnaire) for gathering the
type of data required (quantitative), using an appropriate sample size (181 subjects), which is
a good representative of the population (not too small or too large).
3.8 ETHICAL CONSIDERATIONS
Permission to conduct the research was granted in writing by the Group Human Resource
Director of Babcock International Group. Employees were made aware that participation
would be voluntary, through a covering letter attached to the questionnaire. Further, the
personal responses from individuals were not ascribed to an individual and the questionnaire
did not bear the names of respondents, ensuring anonymity and confidentiality of responses.
Ethical principles were adhered to in this study and respondents were assured that their
identity would not be revealed. The completed questionnaires were kept in a residential place
to ensure confidentiality. These ethical considerations adhered to those advocated by Bless
and Higson-Smith (2000:97), who advised that scientists not forget their obligations to
research participants from who they sought information and their rights.
3.9 SUMMARY
In this chapter, the research design and methodology utilised in the study, including the
sampling method, questionnaire development and data collection are explained, as well as the
rationale behind choices of methods and techniques. The next chapter focuses on the
statistical analysis of the raw data and the discussion of the findings.
Page 75
Chapter 3: Research design and methodology 60
Page 76
Chapter 4 Data analysis and results 61
CHAPTER 4
DATA ANALYSIS AND RESULTS
4
4.1 INTRODUCTION
The previous chapter outlined the research design and methodology used in this study. It
provided details regarding the measuring instrument and the procedure used to collect data,
population size, sampling, as well as a description of statistical techniques that were applied
in the current chapter.
To complete this study properly, it is necessary to analyse the data collected in order to
answer the research questions (Welman et al., 2005:210). This chapter discusses the data
analysis and interpretation. The researcher analysed, presented and interpreted the findings
resulting from this study into meaningful and applicable units (Welman et al., 2005:231).
The analysis is presented in frequencies and percentages. The analysis and interpretation is
arranged according to three sections, namely, (1) biographical questionnaire; (2) job
satisfaction questionnaire and (3) intention to quit questionnaire.
The study set out to achieve the following objectives, namely:
to determine the level of job satisfaction and the intention to quit of employees in a
steel manufacturing company; and
to determine the relationship between job satisfaction and intention to quit of
employees in a steel manufacturing company.
In order to meet the above-mentioned objectives, the Statistical Package for Social Sciences
(SPSS version 22.0 for Windows) was used to analyse the data. The sample is first described
using descriptive statistics to indicate the representivity of the sample to the population, and
then inferential statistical procedures is utilised to analyse the data further.
Prior to the final study, a pre-test was conducted and the following section presents the results
of the test.
Page 77
Chapter 4 Data analysis and results 62
4.2 PRE-TEST RESULTS
An existing validated questionnaire was utilised for this study, hence, there was no pilot study
performed on the questionnaire. However, the questionnaire was pre-tested on a sample of 30
employees in order to ascertain its validity by refining the measurement instrument
(questionnaire) in terms of wording, clarity, layout, relevance of the questions and ambiguity
of items content. Subsequently, changes were made to the questionnaire, where some items
were deleted and rephrased.
To test for reliability, a diagnostic test was conducted after the data collection for closed-
ended questions (Sections B and C) by calculating Cronbach’s alpha. The internal
consistency of the Sections B and C was examined by calculating the reliability values for the
two sections of the scale.
4.3 DESCRIPTIVE STATISTICS
Descriptive analysis is done to provide insight into the nature of the respondents and is
normally depicted well through the use of tables and charts. According to IBM (2014), a
researcher can show descriptive statistics by comparing averages such as the mean or median;
obtaining information such as the mean for groups of interest that need to interpret other
statistical tests; finally by providing graphical representations of data, such as histograms and
boxplots.
There were eight items asking respondents to provide certain biographic and demographic
information, which will serve as the independent variables in this research. The variables
included age, gender, race, years of service, marital status, place of work, highest level of
education and current position/job level.
In this study, the researcher chose to make use of graphical representations (pie charts and bar
charts) and statistical commentary (a discussion of the results) on biographic questions
(Section A). An analysis of the general employees’ profile is discussed in the forthcoming
sections.
4.3.1 Age
Figure 4.1 below provides a picture of age groups for the employees in the steel
manufacturing company.
Page 78
Chapter 4 Data analysis and results 63
Figure 7: Age of respondents
Figure 7 indicates that the majority of the sample falls in the 25-34 year age group (31.10%),
which was then followed by respondents who are between 35 and 44 years old (22.70%),
then respondents above 50 years old (16.00%), thereafter respondents between 18-24 years
old (13.30%), while age category 45-49 years had the least number of respondents (9.90%).
4.3.2 Gender
Figure 8 below provides a picture of gender distribution for the respondents, which
comprised 74.00% males and 26.00% females of the total respondents of 181.
Figure 8: Gender of respondents
13.30%
31.10%
22.70%
9.90%
16.00%
0.00%
5.00%
10.00%
15.00%
20.00%
25.00%
30.00%
35.00%
18-24 years 25-34 years 35-44 years 45-49 years 50 years and
over
AGE (years)
Males (74.00%)
Females (26.00%)
GENDER
Page 79
Chapter 4 Data analysis and results 64
4.3.3 Race
Figure 9 below provides a picture of race distribution of the respondents, which comprised
Blacks, Whites, Coloured and Indians.
Figure 9: Race of respondents
The figure indicates that the number of Black respondents was higher than any of the other
races.
4.3.4 Marital status
Figure 10 below provides a picture of the marital status distribution of the respondents, which
comprised single, married, cohabiting, divorced/separated and widow/widower.
Blacks (53.60%)
Coloured (7.20%)
Indians (5.50%)
Whites (33.70%)
RACE
Page 80
Chapter 4 Data analysis and results 65
Figure 10: Marital status of respondents
Figure 10 reveals that married (47.51%) was the most dominant marital status, followed by
single (39.23%), divorced or seperated (6.08%), cohabiting (5.52%) and widow or widower
(1.66%).
4.3.5 Years of service in the organisation
Figure 11 presents the distribution of the years of service in the current organisation.
Figure 11: Years of service in the organisation
0.00%
5.00%
10.00%
15.00%
20.00%
25.00%
30.00%
35.00%
40.00%
45.00%
50.00%39.23%
47.51%
5.52% 6.08%1.66%
Marital Status
0
5
10
15
20
25
30
35
40
45
0-3 years 4-6 years 7-9 years 10-15 years 16-19 years 20 years andmore
43.60%
20.40%17.10%
8.30%2.20%
8.30%
Years of service in the organisation (years)
Page 81
Chapter 4 Data analysis and results 66
The majority of the respondents had been working for the organisation for 0-3 years
(43.60%), followed by respondents who had been working for the organisation for 4-6 years
(20.40%), then 7-9 years (17.10%). The same number of respondents had been working for
the organisation for 10-19 years and for 20 years and more (8.30%) and lastly 2.20% of
respondents were working for the organisation for 16-19 years.
4.3.6 Job grade level
Figure 12 indicates the job grade levels of the respondents, which comprised senior
management, middle management, junior management, professionally qualified/ skilled
worker, semi skilled and unskilled.
Figure 12: Job grade level
Most of the respondents were professionally qualified/skilled workers (38.70%), followed by
junior management (17.70%), middle management and semiskilled (16.60%), unskilled
(9.90%) and finally senior management with the lowest number of respondents (0.60%) of
the sample.
4.3.7 Level of education
Figure 13 below indicates the level of education of the respondents that varied between
primary school education and postgraduate qualifications.
0
10
20
30
40
0.60%
16.60% 17.70%
38.70%
16.60%
9.90%
Job grade level
Page 82
Chapter 4 Data analysis and results 67
Figure 13: Level of education
Figure 13 reflects that most respondents (34.30%) were not in possession of an advanced
level qualification, which was the equivalence of grade 12, followed by the respondents who
are in possession of technical college/university of technology (24.30%), secondary level
education (16.00%), professional training/apprenticeship training (8.80%), bachelor’s degree
(7.20%), post graduate degree (6.60%) and lastly primary school level (2.80%).
4.3.8 Place of work
Figure 14 below indicates the distribution of place of work of the respondents.
Figure 14: Place of work
05
101520253035
2.80%
16.00%
34.30%
8.80%
24.30%
7.20% 6.60%
Level of education
0
5
10
15
20
25
30
Head Office Fabrication Lethabo Matla Kendal Hendrina Grootvlei
27.60%
8.80%6.10%
24.90%
7.20% 5.50%
19.90%
Place of work
Page 83
Chapter 4 Data analysis and results 68
Figure 14 reflects that most respondents were based at Head Office (27.60%), followed by
respondents working at Matla (24.90%), Grootvlei (19.90%), Fabrication (8.80%), Kendal
(7.20%), Lethabo (6.10%) and lastly Hendrina (5.50%).
In the following section, relevant data of the different factors obtained through a factor
analysis procedure for Sections B and C is reported.
4.4 FACTOR ANALYSIS
Factor analysis is commonly used in the fields of psychology and education and is considered
the method of choice for interpreting self-reporting questionnaires (Williams, Onsman &
Brown 2010:2). According to Williams et al., (2010:2), factor analysis firstly reduces a large
number of variables into a smaller set of variables (also referred to as factors). Secondly, it
establishes underlying dimensions between measured variables and latent constructs, thereby
allowing the formation and refinement of theory. Thirdly, it provides construct validity
evidence of self-reporting scales.
Prior to the extraction of the factors, several tests should be used to assess the suitability of
the respondent data for factor analysis. These tests include Kaiser-Meyer-Olkin (KMO)
measure of sampling adequacy and Bartlett's Test of Sphericity (Williams et al., 2010:5).
4.4.1 Kaiser-Meyer-Olkin and Bartlett’s test
As a rule of thumb, Rasli (2006:15) stated that a value of 0.5 or higher for the KMO measure
of sampling adequacy indicates that the proportion of variance in the variables is caused by
underlying factors. Thus, it allows for the application of factor analysis (Rasli 2006:15). High
values (close to 1.0) generally indicate that factor analysis may be useful to the data obtained.
If the value is less than 0.50, the results of the factor analysis probably will not be very useful
(IBM 2014).
Hinton et al. (2014:341) suggest that before performing a factor analysis, a researcher must
undertake a test similar to Bartlett’s test of sphericity. The result of this test should be
significant as it indicates that it is worth continuing with factor analysis as there are
relationships to investigate. There is no point in undertaking a factor analysis when the
researcher does not think there is anything of interest to find (Hinton et al., 2014:341). Small
values (less than 0.05) of the significance level indicate that a factor analysis may be useful
Page 84
Chapter 4 Data analysis and results 69
(IBM 2014). The KMO and Bartlett's tests were done on Sections B and C of the
questionnaire and the results are presented on Tables 4.1 and 4.2.
4.4.1.1 KMO and Bartlett's test of Section B (Employees’ perception of job
satisfaction)
Table 2 shows the results of two tests (KMO and Bartlett's tests) that indicate the suitability
of the data for structure detection.
Table 2: KMO and Bartlett's test of Section B
Kaiser-Meyer-Olkin Measure of Sampling Adequacy 0.923
Bartlett's Test of Sphericity Approx. Chi-Square 1687.489
Df 105
Sig. 0.000
The KMO of Section B is 0.923, which is close to 1. The Bartlett’s test of Section B indicated
a 0.000 significance level that was lower than 0.05. In conclusion, both tests indicated that a
factor analysis could be performed on Section B.
4.4.1.2 Kaiser-Meyer-Olkin and Bartlett's test of Section C (Intention to quit)
Table 3 shows the results of two tests (KMO and Bartlett's tests) that indicated the suitability
of the data for structure detection.
Table 3: KMO and Bartlett's tests of Section C
Kaiser-Meyer-Olkin Measure of Sampling Adequacy 0.883
Bartlett's Test of Sphericity Approx. Chi-Square 1156.349
Df 10
Sig. 0.000
Table 3 shows that the KMO of Section C was 0.883 (which is above 0.5); this indicated that
the proportion of variance in the variables was caused by underlying factors. Thus, it allowed
the application of a factor analysis. This was supported by the Bartlett’s test of Sections C
Page 85
Chapter 4 Data analysis and results 70
which had a 0.000 significance level that was less than 0.05. Thus, it provided evidence that
the data is suitable for factor analysis.
In summary, the results of the KMO and Barlett’s tests of both sections indicated the
suitability of the data in sections B and C for factor analysis. Based on the above results,
factor analysis was used to find factors among employees’ perceptions of their job
satisfaction and intention to quit sections. In other words, since these two sections contain
many components, factor analysis is used to reduce the number of variables.
4.4.2 Section B: Employees’ perceptions or feelings about job satisfaction
To examine employees’ perceptions or feelings about job satisfaction, different components
were identified through principal component analysis using varimax rotation. The criteria for
the number of factors to be extracted were based on eigenvalues, percentage of variance,
significance of factor loading and an assessment of the factor structure (Dhurup & Mofoka
2011:161).
Only factors with eigenvalues equal to or greater than 1 were considered significant. A
rotated solution that accounted for at least 60 per cent of the total variance was considered as
a satisfactory solution using an exploratory factor analysis procedure (Lorenzo-Seva 2013:4).
The eigenvalues, the percentage of variance explained by each factor and the cumulative
percentage of variance of the two factors are reported in Table 4 below.
Table 4: Eigenvalues, percentage of variance explained and cumulative percentage
of Section B
Dimension description No of items eigenvalues % of variance Cumulative %
Supervision variables 8 4.861 32.406 32.406
Job variables 7 4.221 28.141 60.547
A variable was considered of significance and included in a factor when its factor loading
was equal to or greater than 0.5. In addition, items that loaded heavily on more than one
factor were eliminated from further scale development. Hence, cross-loading was also
examined in the factor structure. Items were eliminated either because of cross loading or low
factor loading (<0.50). Table 5 below summarises the factor structure evaluation of Section B
of the questionnaire.
Page 86
Chapter 4 Data analysis and results 71
Table 5: Factor loading matrix of Section B (employee’s perceptions or feelings
about job satisfaction)
Scale description Factor 1
Supervision
variable
Factor 2
Job
variable
How satisfied are you with the task variety in your present job? .712 .330
To what extent do you feel that you are valued in your present job? .710 .351
How satisfied are you with your immediate supervisor (superior) in your
present job? .868 .162
How satisfied are you with your immediate supervisor’s (superior’s)
ability to make effective decisions? .856 .215
How satisfied are you that you do not do things that go against your
conscience? .623 .310
To what extent does your present job provide steady employment? .339 .565
To what extent do you have the chance to do things for other people in
your present job? .198 .605
How often do you have the opportunity in your present job to be in a
position of authority and instruct other people what to do? .319 .610
To what extent are the organisation’s policies put into practice? .612 .463
How satisfied are you that the pay you receive reflects the amount of effort
you put into your job? .458 .626
To what extent are there opportunities for advancement in your present job?
.160 .755
How much freedom is there in your present job to use your own
judgement? .294 .782
To what extent are you allowed to experiment with your own methods of
doing the job? .337 .762
How satisfied are you with your work conditions? .724 .459
How often do you get praise for doing a good job? .622 .430
Extraction method: Principal component with varimax rotation and Kaiser normalisation
Factor one labelied as supervision factor comprised eight variables and accounted for 32%
of the variance explained by the factor. For employees to stay in the organisation, an
organisation must provide a good supervisor who is knowledgeable and skillful to ensure that
task variety in a job is provided. He or she must also have an ability to make effective
Page 87
Chapter 4 Data analysis and results 72
decisions. He or she must value employees for the effort they put in their jobs and who does
not force employees to do things that are against their conscience. The incumbert must ensure
that organisation’s policies are put into practice. The incumbert must also ensures that work
conditions of employees are satisfactory and must praise his or her employees for doing a
good job. Robbins et al., (2003:80) concur with the above. The authors state that supervision
forms a pivotal role to job satisfaction. In order for for employees to be satisfied with their
jobs, a good supervisor must provide emotional and technical support and guidance with
work-related tasks (Robbins et al., 2003:80).
Factor two was labelled job variable and comprised of seven variables. It accounted for 28%
of the variance explained by the factor. The results indicate that if employees are provided
with jobs that provide the following opportunities, they will feel satisfied and motivated and
will stay in the organisation:
to do things for other people;
to be in a position of authority and instruct other people what to do;
to reward employees for their efforts;
for career advancement; and
to use their own judgement and freedom to experiment with their own methods.
Friday & Friday (2003:429) concur with the above. The authors established that if a job is
highly motivating, employees are likely to be satisfied with the job content and deliver higher
quality work and are likely to stay in the organisation.
In summary, these two factors accounted for 60% of the total variance explained; they
appeared as important determinants in establishing employee’s perceptions or feelings about
job satisfaction. Different people perceive a situation differently, both in terms of what they
selectively perceive and how they organise and interpret events perceived. These aspects of
employee’s perceptions or feelings about job satisfaction activities may provide some
indication of how employees perceive their organisation which may ultimately influence their
future behaviours in the workplace such as the type of attachments they have towards their
organisation and their intentions to stay.
Page 88
Chapter 4 Data analysis and results 73
4.4.2.1 Mean rating of dimensions of employees’ perceptions or feelings about
job satisfaction
The mean rating in terms of importance of job satisfaction factors are reported in Table 6.
The minimum and maximum values are based on the lowest and highest values on a 5-point
Likert scale. The means were calculated by summating the response values of variables that
comprised each dimension of employees’ perceptions or feelings about job satisfaction scale,
divided by the number of variables in each dimension.
Table 6: Mean rating of dimensions of employee’s perceptions or feelings about job
satisfaction
Dimension description N Minimum Maximum Mean
Supervision factor 181 1 5 3.90
Job factor 181 1 5 3.66
Scale item rating: 1=Strongly not satisfied; 2= Not satisfied; 3=Neither disagree nor
agree; 4=Satisfied; 5=Strongly satisfied
Respondents agreed that the supervision factor was essential to them (mean=3.90) as well as
the job factor (mean=3.66). The results indicated that in order for employees to feel satisfied
with the organisation and the job, the incumbent who occupies the supervision position must
have experience, knowledge and skill to execute the job. It also indicates that the job itself
must be challenging and motivating to the employees (Robbins et al., 2003:80).
The results of Section C of the questionnaire are shown in the next section and a discussion
of these results is also provided.
4.4.3 Section C: Employees’ intentions to quit their current organisation
The mean rating in terms of importance of employees’ intentions to quit factors are reported
in Table 7.
Page 89
Chapter 4 Data analysis and results 74
Table 7: Mean rating of dimensions of employees’ intentions to quit their current
organisation
Dimension description N Minimum Maximum Mean
C1. In the last six months I have thought of
quitting my job 181 1 5 3.64
C2. I frequently think about quitting my job
in this organisation 181 1 5 3.64
C3 I plan to quit my job in this organisation 181 1 5 3.62
C4 I have a desire to leave my job in this
organisation 181 1 5 3.57
C5 I have actively searched for a new job in
other organisations 181 1 5 3.71
These results indicated employees’ level of agreement to remain employed in their current
organisations. Respondents agreed that they were willing to stay in their current organisation
in the most foreseeable future (mean=3.64). Respondents also agreed to maintain their current
relationships with their current organisation (mean=3.64). Respondents further agreed that
they had no intentions of leaving their current employer (mean=3.62).
Additionally, respondents agreed that they had no desire to leave their job (mean=3.57).
Finally, respondents agreed that they were not planning to look for a new job alternative
(mean=3.71). Overall, these results showed that employees’ likelihood to continue their
membership in a predictable future in this organisation was high. Employees found it
important for them to continue maintaining their future relationships with this organisation.
Kudo et al. (2006:511) found that employees’ intentions to stay on the job were significantly
associated with the conditions of employment, which are composed of salary, welfare, and
fair salary raises; these are hygiene factors and they are associated with the security and
stability of employees’ lives.
4.5 CORRELATION ANALYSIS
Correlation analysis reveals any correlation (positive or negative) between the factored
constructs identified in a research study (Rasli 2006:29). Rasli (2006:29) further explained
that correlation defines a relationship between dependent and independent variables. In
examining the relationship among employees’perceptions or feelings about job satisfaction
Page 90
Chapter 4 Data analysis and results 75
and employees’ intentions to quit their current organisation, correlations were computed
using Pearson product moment correlation coefficient to establish the strength and direction
of the relationships. Scores for each of the variables included in employee’s perceptions or
feelings about job satisfaction as well as employees’ intentions to quit their current
organisation scales were combined to create a single index of steel manufacturing company
activities. The results of the analysis are reported in Table 8.
Table 8: Correlations
Supervision
variables Job variables Intention to quit
Supervision
variables
Pearson Correlation 1
Sig. (2-tailed)
N 181
Job variables
Pearson Correlation .747** 1
Sig. (2-tailed) .000
N 181 181
Intention to
quit
Pearson Correlation -.487** -.539** 1
Sig. (2-tailed) .000 .000
N 181 181 181
**. Correlation is significant at the 0.01 level (2-tailed).
Table 8 summarises the relationships among employee’s perceptions or feelings about job
satisfaction and employees’ intentions to quit their current organisation by means of linear
correlations. The results indicated that the supervison variable is positively correlated with
job variable while it is negatively correlated with intention to quit and the correlations were
significant at p< 0.000. In addition, job variable is also negatively correlated with intention to
quit and the correlations were significant at p< 0.000.
4.6 T-TEST AND ANOVA
In order to quantify the relationships that exist among factors that best describe the job
satisfaction and employees’ intentions to quit their current organisation, t-test and ANOVA
Page 91
Chapter 4 Data analysis and results 76
were conducted. It helps establish predictive relationships among the constructs and the
following sections present the results of the analysis.
4.6.1 T-Test
The t-test or the student’s t-test, also known as the independent t-test, is an inferential
statistical test that determines whether there is a statistically significant difference between
the means in two unrelated groups (Laerd statistics).
The objective of this section is to test whether the means for unrelated groups are equal or
that the means are not equal. The three key variables are job satisfaction variable 1
(supervision variable), job satisfaction variable 2 (job variable) and employees’ intention to
quit, that are used as the basis for testing whether the means are equal or not.
To test whether or not the two independent populations have different mean values on some
measure, a test statistics is calculated. The t test statistics is used to determine a p-value that
indicates how likely it is that there is no difference in the population.
If p value is less than 0.05, there is enough evidence to show that there is a statistically
significant difference between the two groups; however, if p value is greater that 0.05, there
is no statistically significant difference between the two groups.
Table 9: Group statistics for supervision variables
Gender n Mean Std. Deviation Std. Error Mean
Male 134 3.9841 .91579 .07911
Female 47 3.6888 .94404 .13770
From the Group Statistics box, the mean for males is 3.98. The mean for females is 3.69. The
standard deviation for males is 0.92 and for females, 0.94. The number of participants in each
gender (n) is 134 and 47 respectively.
Page 92
Chapter 4 Data analysis and results 77
Table 10: Independent samples test for supervision variables
Levene's
Test for
Equality
of
Variances
t-test for
Equality of
Means
t-test for Equality of Means
F Sig. t df
Sig.
(2-
tailed)
Mean
Difference
Std. Error
Difference
95%
Confidence
Interval of
the
Difference
95%
Confidence
Interval of
the
Difference
Lower Upper
Equal
variances
assumed
.091 .763 1.887 179 .061 .29531 .15650 -.01350 .60413
Equal
variances
not
assumed
1.860 78.423 .067 .29531 .15881 -.02083 .61145
An independent t-test was run on the data as well as 95% confidence intervals (CI) for the
mean difference of males and females. The Sig. (2-Tailed) value from the Table above is
0.061. This value is above 0.05, hence it can be concluded that there is no statistically
significant difference between the mean number of males (3.98 ± 0.92) and females (3.69 ±
0.94), (t(179) = 1.887, p = 0.061.
Since Table 10 above reveals that the mean for males is greater than the mean for females, it
can be concluded that male participants believe that management supervision forms more of a
pivotal role relating to employees’ perceptions or feelings about job satisfaction than female
participants.
Table 11: Group statistics for job variables
Gender n Mean Std. Deviation Std. Error Mean
Male 134 3.7292 .91486 .07903
Female 47 3.4985 .84404 .12312
Page 93
Chapter 4 Data analysis and results 78
In the Group Statistics box, the mean for condition 1 (males) is 3.73. The mean for condition
2 (females) is 3.49. The standard deviation for condition 1 is 0.91 and for condition 2, 0.84.
The number of participants in each condition (n) is 134 and 47 respectively.
Table 12: Independent samples test for job variables
Levene's
Test for
Equality
of
Variances
t-test for
Equality of
Means
t-test for Equality of Means
F Sig. t df
Sig.
(2-
tailed)
Mean
Difference
Std. Error
Difference
95%
Confidence
Interval of
the
Difference
95%
Confidence
Interval of
the
Difference
Lower Upper
Equal
variances
assumed
.529 .468 1.517 179 .131 .23073 .15210 -.06941 .53087
An independent t-test was run on the data as well as 95% confidence intervals (CI) for the
mean difference of males and females. The Sig. (2-Tailed) value in Table 4.11 above is
0.131, This value is above 0.05, hence it could be concluded that there is no statistically
significant difference between the mean number of condition 1 (males) (3.73 ± 0.91) and
condition 2 (females) (3.49 ± 0.84), (t(179) = 1.517, p = 0.131.
Since Table 12 above reveals that the mean for males is greater than the mean for females, it
can be concluded that male participants believe that employees’ intentions to stay in their
current organisation is influenced by employees’ perceptions or feelings about job
satisfaction more than female participants.
4.6.2 ANOVA
ANOVA stands for one-way analysis of variance. It is used to determine whether there are
any significant differences between the means of three or more independent (unrelated)
groups. The one-way ANOVA compares the means between the groups you are interested in
and determines whether any of those means are significantly different from each other.
Page 94
Chapter 4 Data analysis and results 79
The following three assumptions are needed to be tested before one way ANOVA can be
used:
The dependent variable is normally distributed in each group that is being compared
in the one-way ANOVA.
There is homogeneity of variances, that is, the population variances in each group are
equal.
Independence of observations.
Table 13: ANOVA results for supervision variables versus age
Sum of
Squares df Mean Square F Sig.
Between Groups 5.718 4 1.430 1.679 .157
Within Groups 149.857 176 .851
Total 155.575 180
Table 13 shows the output of the ANOVA analysis to show whether we have a statistically
significant difference between our group means in relation to age. We can see that the
significance level is 0.157 (p = 0.157), which is above 0.05 and therefore there is no
statistically significant difference in the mean length of the age groups (1=18-24 yrs; 2=25-34
yrs; 3=35-44 yrs; 4=45-49 yrs and 5=50+yrs).
The results of the Post hoc tests are now presented in Table 14 below to confirm the results
from Table 13.
Page 95
Chapter 4 Data analysis and results 80
Table 14: POST HOC test results for supervision variables versus age
Multiple Comparisons
Bonferroni
Dependent
Variable (I) A1 (J) A1
Mean
Difference (I-
J) Std. Error Sig.
95% Confidence Interval
Lower
Bound
Upper
Bound
JS1 1 2 .39697 .21867 .712 -.2247 1.0186
3 .19499 .23716 1.000 -.4792 .8692
4 .52257 .28772 .710 -.2954 1.3405
5 .04077 .25463 1.000 -.6831 .7647
2 1 -.39697 .21867 .712 -1.0186 .2247
3 -.20197 .18195 1.000 -.7192 .3153
4 .12560 .24422 1.000 -.5687 .8199
5 -.35620 .20421 .829 -.9367 .2243
3 1 -.19499 .23716 1.000 -.8692 .4792
2 .20197 .18195 1.000 -.3153 .7192
4 .32757 .26090 1.000 -.4141 1.0693
5 -.15423 .22389 1.000 -.7907 .4823
4 1 -.52257 .28772 .710 -1.3405 .2954
2 -.12560 .24422 1.000 -.8199 .5687
3 -.32757 .26090 1.000 -1.0693 .4141
5 -.48180 .27688 .836 -1.2689 .3053
5 1 -.04077 .25463 1.000 -.7647 .6831
2 .35620 .20421 .829 -.2243 .9367
3 .15423 .22389 1.000 -.4823 .7907
4 .48180 .27688 .836 -.3053 1.2689
1=18-24 yrs; 2=25-34 yrs; 3=35-44 yrs; 4=45-49 yrs and 5=50+yrs
Page 96
Chapter 4 Data analysis and results 81
The results of Table 14 above showed that there was no statistically significant difference
between the age groups (18-24 age bucket (p = 0.712), 25-34 age bucket (p = 0.829), 35-44
age bucket (p = 0.836) as well as 45-49 and 50+ age buckets (p = 0.836) as all the
significance levels are above 0.05.
The results indicated that all the age groups (18-24 yrs; 25-34 yrs; 35-44 yrs; 45-49 yrs and
50+yrs) who participated in the study believed that management supervision forms a pivotal
role relating to employees’ perceptions or feelings about job satisfaction.
To summarise the results presented in Tables 13 and 14, a Bonferroni post-hoc test revealed
that there is no statistically significant difference between the age groups as determined by
one-way ANOVA (F(4,176) = 1.679, p = 0.157).
Table 15: ANOVA results for job variables versus age
Sum of
Squares df Mean Square F Sig.
Between Groups 8.904 4 2.226 2.859 .025
Within Groups 137.036 176 .779
Total 145.940 180
Table 15 showed the output of the ANOVA analysis to indicate whether there was a
statistically significant difference between the group means in relation to age. The
significance level is 0.025 (p = 0.025), which is below 0.05 and therefore there was a
statistically significant difference in the mean length of the age groups (1=18-24 yrs; 2=25-34
yrs; 3=35-44 yrs; 4=45-49 yrs and 5=50+yrs).
The one-way ANOVA could not specify which specific groups were significantly different
from each other. To determine which specific groups differed from each other, a post hoc test
was used. The results of the Post hoc tests are presented in Table 16 below.
Page 97
Chapter 4 Data analysis and results 82
Table 16: POST HOC test results for job variables versus age
Multiple Comparisons
Bonferroni
Dependent
Variable (I) A1 (J) A1
Mean
Difference (I-
J) Std. Error Sig.
95% Confidence Interval
Lower
Bound
Upper
Bound
JS1 1 2 .58851 .20911 .054 -.0060 1.1830
3 .42944 .22679 .599 -.2153 1.0742
4 .28175 .27513 1.000 -.5004 1.0639
5 .10468 .24350 1.000 -.5875 .7969
2 1 -.58851 .20911 .054 -1.1830 .0060
3 -.15907 .17400 1.000 -.6537 .3356
4 -.30676 .23354 1.000 -.9707 .3572
5 -.48383 .19528 .142 -1.0390 .0713
3 1 -.42944 .22679 .599 -1.0742 .2153
2 .15907 .17400 1.000 -.3356 .6537
4 -.14770 .24949 1.000 -.8570 .5616
5 -.32476 .21410 1.000 -.9334 .2839
4 1 -.28175 .27513 1.000 -1.0639 .5004
2 .30676 .23354 1.000 -.3572 .9707
3 .14770 .24949 1.000 -.5616 .8570
5 -.17707 .26477 1.000 -.9298 .5756
5 1 -.10468 .24350 1.000 -.7969 .5875
2 .48383 .19528 .142 -.0713 1.0390
3 .32476 .21410 1.000 -.2839 .9334
4 .17707 .26477 1.000 -.5756 .9298
1=18-24 yrs; 2=25-34 yrs; 3=35-44 yrs; 4=45-49 yrs and 5=50+yrs
Page 98
Chapter 4 Data analysis and results 83
The results of Table 16 above showed that there was no statistically significant difference
between the age groups (18-24 age bucket (p = 0.599), 25-34 age bucket (p = 0.142), 35-44
age bucket (p = 0.599), 45-49 age bucket (p = 1.000) as well as 50+ age bucket (p = 0.142))
as all the significance levels are above 0.05.
The results showed that all the age groups (18-24 yrs; 25-34 yrs; 35-44 yrs; 45-49 yrs and
50+yrs) who participated in the study believed that employees’ intentions to stay in their
current organisation are influenced by employee’s perceptions or feelings about job
satisfaction.
To summarise results presented in Tables 15 and 16, a Bonferroni post-hoc test revealed that
there is no statistically significant difference between the age groups.
Table 17: ANOVA results for supervision variables versus race
Sum of
Squares df Mean Square F Sig.
Between Groups 5.627 3 1.876 2.214 .088
Within Groups 149.948 177 .847
Total 155.575 180
Table 17 shows the output of the ANOVA analysis to show whether there was a statistically
significant difference between the group means. The significance level is 0.088 (p = 0.088),
which is above 0.05 and therefore, there was no statistically significant difference in the mean
length of the race groups (1=Black;2=Coloured; 3=Indian,4=White).
The results of the post-hoc tests are now presented in Table 18 below to confirm the results
from Table 17.
Page 99
Chapter 4 Data analysis and results 84
Table 18: POST HOC test results for supervision variables versus race
Multiple Comparisons
Bonferroni
Dependent
Variable (I) A1 (J) A1
Mean
Difference (I-
J) Std. Error Sig.
95% Confidence Interval
Lower
Bound
Upper
Bound
JS1 1 2 .48107 .27185 .471 -.2443 1.2064
3 -.50451 .30570 .604 -1.3202 .3112
4 .05594 .15040 1.000 -.3454 .4573
2 1 -.48107 .27185 .471 -1.2064 .2443
3 -.98558 .38715 .071 -2.0186 .0474
4 -.42513 .28117 .794 -1.1753 .3251
3 1 .50451 .30570 .604 -.3112 1.3202
2 .98558 .38715 .071 -.0474 2.0186
4 .56045 .31401 .456 -.2774 1.3983
4 1 -.05594 .15040 1.000 -.4573 .3454
2 .42513 .28117 .794 -.3251 1.1753
3 -.56045 .31401 .456 -1.3983 .2774
1=Black; 2=Coloured; 3=Indian, 4=White
Table 18 above indicates that there was no statistically significant difference between the race
groups (Black (p = 0.604), Coloured (p = 0.794), Indian (p = 0.604) as well as White (p =
0.794) as all the significance levels are above 0.05.
The results show that all the race groups (1=Black; 2=Coloured; 3=Indian,4=White) who
participated in the study believed that management supervision forms a pivotal role relating
to employees’ perceptions or feelings about job satisfaction.
To summarise the results presented in Tables 17 and 18, a Bonferroni post-hoc test revealed
that there was no statistically significant difference between the race groups as determined by
one-way ANOVA (F(3,177) = 2.214, p = 0.088).
Page 100
Chapter 4 Data analysis and results 85
Table 19: ANOVA results for job variables versus race
Sum of
Squares df Mean Square F Sig.
Between Groups 1.663 3 .554 .680 .565
Within Groups 144.277 177 .815
Total 145.940 180
Table 19 shows the output of the ANOVA analysis to show whether there was a statistically
significant difference between our group means. As the significance level is 0.565 (p =
0.565), which is above 0.05 and therefore there was no statistically significant difference in
the mean length of the race groups (1=Black;2=Coloured; 3=Indian,4=White).
The results of the Post hoc tests are now presented in Table 20 below to confirm the results
from Table 19.
Page 101
Chapter 4 Data analysis and results 86
Table 20: POST HOC test results for job variables versus race
Multiple Comparisons
Bonferroni
Dependent
Variable (I) A1 (J) A1
Mean
Difference (I-
J) Std. Error Sig.
95% Confidence Interval
Lower
Bound
Upper
Bound
JS1 1 2 .31132 .26666 1.000 -.4002 1.0228
3 -.17879 .29986 1.000 -.9789 .6213
4 .07460 .14753 1.000 -.3190 .4683
2 1 -.31132 .26666 1.000 -1.0228 .4002
3 -.49011 .37976 1.000 -1.5034 .5232
4 -.23671 .27580 1.000 -.9726 .4992
3 1 .17879 .29986 1.000 -.6213 .9789
2 .49011 .37976 1.000 -.5232 1.5034
4 .25340 .30802 1.000 -.5685 1.0753
4 1 -.07460 .14753 1.000 -.4683 .3190
2 .23671 .27580 1.000 -.4992 .9726
3 -.25340 .30802 1.000 -1.0753 .5685
1=Black; 2=Coloured; 3=Indian, 4=White
Table 20 above shows that there was no statistically significant difference between group 1
(Black), group 2 (Coloured), group 3 (Indian,) as well as groups 4 (White) as all the
significance levels are above 0.05. The results indicated that all the race groups
(1=Black;2=Coloured; 3=Indian,4=White) who participated in the study believed that
employees’ intentions to stay in their current organisation are influenced by employee’s
perceptions or feelings about job satisfaction.
To summarise the results presented in Tables 19 and 20, a Bonferroni post-hoc test revealed
that there was no statistically significant difference between the race groups as determined by
one-way ANOVA (F(3,177) = 0.680, p = 0.565).
Page 102
Chapter 4 Data analysis and results 87
4.7 RELIABILITY
To test for reliability, a diagnostic test was conducted after the data collection for closed-
ended questions (Sections B and C) by calculating Cronbach’s alpha. The internal
consistency of Sections B and C was examined by calculating the reliability values for the
two sections of the scale. The results obtained are shown in Table 21.
Table 21: Overall reliability of the instrument
Sections Number of items Cronbach’s Alpha
Job satisfaction (Section B) 20 0.933
Intention to quit (Section C) 5 0.963
The resultant coefficient alphas indicated that the scale items performed adequately in
capturing the elements of employee satisfaction regarding their job as well as their intentions
to quit their current organisation. Cronbach’s alpha values for the individual scales ranged
from 0.823 to 0.964, which were all above the acceptable benchmark levels of 0.70 explained
by Sekaran (2005:185) and there was no need to further remove any other items from the
scale. The next section presents the results of the descriptive statistics.
In the following section, the various forms of validity established for this study are discussed.
4.8 VALIDITY
Validity refers to getting results that accurately reflect the concept being measured (Babbie
2010:158). According to Kumar (2005:137), in terms of measurement procedures, validity is
the ability of an instrument to measure what it is designed to measure. This means that an
instrument measures what it is intended to measure, and does so correctly and accurately. The
following measures of validity, namely, content, construct, and face validity methods are
discussed in the next sub-sections.
4.8.1 Content validity
To ensure content validity of the instrument, the researcher usually presents the provisional
version to the experts in the field for their comments before finalising the instrument
(Creswell et al., 2007:217). Therefore content validity was ascertained through pre-testing of
Page 103
Chapter 4 Data analysis and results 88
the questionnaire prior to the main survey. It was pre-tested and reviewed by a panel of
experts to check for suitability of questions, and whether the questions measure the relevant
constructs in the study.
4.8.2 Construct validity
Construct validity of a measuring instrument refers to the degree to which it measures the
intended construct rather than irrelevant construct or measurement error (Welman et al.,
2005:142). Thomas et al., (2011:197), however, are of the view that correlation can be used
in establishing construct validity. Thus, construct validity was ascertained in this study
through correlation, factor analysis and Cronbach alpha coefficients of the main study.
4.8.3 Face validity
Face validity is the extent to which, on the surface, an instrument looks as if it is measuring a
particular characteristic (Leeddy & Ormrod 2010:92). It is often useful for ensuring the co-
operation of people who are participating in the research study. However, because it relies
entirely on subjective judgement, it is not, in and of itself, terribly convincing evidence that
an instrument is truly measuring what the researcher wants to measure (Leeddy & Ormrod
2010:92). Face validity was ascertained through pre-testing of the questionnaire and
reviewing it prior to the main survey.
4.9 SUMMARY
In this chapter, the researcher analysed, presented and interpreted the findings resulting from
this study into meaningful and applicable units. This was done by firstly pre-testing a
questionnaire on a sample of employees in order to ascertain its validity by refining the
measurement instrument (questionnaire) in terms of wording, clarity, layout, relevance of the
questions and ambiguity of items content as well as translation biases.
Then an analysis of the general employees’ profile was discussed by presenting the
biographic and demographic information. The variables included (1) age; (2) gender; (3)
race; (4) years of service; (5) marital status; (6) place of work, (7) highest level and (8)
current position/job level.
Page 104
Chapter 4 Data analysis and results 89
The researcher then performed Kaiser-Meyer-Olkin (KMO) measure of sampling adequacy
and Bartlett's Test of Sphericity to assess the suitability of the respondent data for factor
analysis. The next section was correlation analysis in order to examine the relationship
among employee’s perceptions or feelings about job satisfaction and employees’ intentions to
quit their current organisation.
The last section was to quantify the relationships that exist among factors that best describe
the job satisfaction and employees’ intentions to quit their current organisation by conducting
T Test and ANOVA. The next chapter focuses on carrying out the statistical analysis of raw
data and discussion of the findings.
Page 105
Chapter 5: Conclusions, recommendationsand limitations 90
CHAPTER 5
CONCLUSIONS, RECOMMENDATIONS AND LIMITATIONS
5
5.1 INTRODUCTION
The previous chapter presented and interpreted the findings resulting from this study into
meaningful and applicable units. This chapter provides the conclusions drawn from the
findings. The chapter also discusses the recommendations forthcoming from the findings and
then the limitations and implications for future research.
5.2 SUMMARY OF THE RESEARCH
The main purpose of this study was to determine the level of job satisfaction and intention to
quit of employees in a steel manufacturing company. In chapter one, an introduction and
background of the study, the problem statement, the research objectives and the research
methodology were discussed.
In this chapter, a brief overview of theories of JS and ITQ were subsequently discussed, as
well as consequences (productivity, organisational citizenship behaviour, absenteeism,
turnover and workplace deviance) and personal determinants (age, gender, occupational
level, tenure and educational level) respectively. Factors influencing job satisfaction (work
conditions, supervisor, co-workers, promotion opportunity, compensation and work itself)
and intention to quit (psychological factors, economical factors and demographic factors)
identified from the literature were also discussed.
Chapter three presented an in-depth analysis of the research design and methodology utilised
for the study. This included the sampling method, questionnaire development and data
collection. In addition the rationale behind choices of methods and techniques were
discussed.
Chapter four presented and interpreted the findings resulting from this study. This was done
by pre-testing the questionnaire on a sample of employees, and an analysis of the general
employees’ profile. In addition, the researcher performed Kaiser-Meyer-Olkin (KMO)
measure of sampling adequacy and Bartlett's Test of Sphericity to assess the suitability of the
respondent data for factor analysis. Factor analysis was also used to reduce the number of
Page 106
Chapter 5: Conclusions, recommendationsand limitations 91
variables. Correlation analysis between employees’ perceptions or feelings about job
satisfaction and employees’ intentions to quit their current organisation were also discussed.
Lastly, t-test and ANOVA were discussed to quantify the relationships that exist among
factors that best describe the job satisfaction and employees’ intentions to quit their current
organisation.
Chapter five summarised the work that has been done throughout the study. This included
important findings of the study and the recommendations based on the findings of the report.
In addition, the limitations and implications for future research was discussed.
5.3 CONCLUSIONS
The findings regarding employees’ perceptions or feelings about job satisfaction and
employees’ intentions to quit their current organisation revealed that the supervison variable
was positively correlated with job variable while it was negatively correlated with intention
to quit. In addition, job variable is also negatively correlated with intention to quit, (refer to
section 4.5). This meant that effective supervisors were likely to improve employees’ job
satisfaction hence decreasing employees’ intentions to quit their current organisation. In
addition, when employees are satisfied with their job environment, this decreases employees’
intentions to quit their current organisation.
Section 4.6 quantifies the relationships that existed among factors that best described the job
satisfaction and employees’ intentions to quit their current organisation. The results indicated
that when employees are provided with a job that rewards them for their effort and that
provides opportunities for advancement, they will be satisfied and hence more likely to stay
in the organisation. The conclusions made were based on both theoretical and empirical
objectives coming from the findings of the study. These objectives are discussed below.
5.3.1 Theoretical objectives
The following theoretical objectives were formulated for this study:
5.3.1.1 To conduct a literature study on job satisfaction
While definitions can provide a broad understanding of what job satisfaction entails, it
remains a complex concept, as there are many different definitions of job satisfaction. The
literature review on job satisfaction revealed some of them as discussed in section 2.2 of
Page 107
Chapter 5: Conclusions, recommendationsand limitations 92
Chapter 2. However, in the context of this study, job satisfaction is defined as an attitude that
individuals have about their jobs. One feels positive or negative about the intrinsic and/or
extrinsic aspects of one’s job (Masroor & Fakir 2010:125).
The three widely used definitions as identified by the literature review of this study are: (1)
Hoppock (1935:47), who defined job satisfaction as “…any combination of psychological,
physiological, and environmental circumstances that causes a person to be satisfied with
his/her job”. (2) Locke (1976:1300), however, defined job satisfaction as “…a pleasurable or
positive emotional state resulting from the appraisal of one’s job or job experiences”.
The research also revealed that work conditions, supervision, co-worker/work groups,
promotion opportunities, compensation/pay as well as fairness are the factors influencing job
satisfaction. The impact of these factors on job satisfaction lead to the following
consequences: productivity, organisational citizenship behaviour (OCB), customer
satisfaction, absenteeism, turnover, workplace deviance.
5.3.1.2 To conduct a literature study on intention to quit
Intention to quit refers to the degree of likelihood that the employee will terminate his/her
membership in a work organisation (Spreiter & Mishr 2002:17). Sousa-Poza and
Henneberger (2002:1) define intention to quit as the reflection of the probability that an
individual will change his/her job within a certain time period. It is also referred to as a
worker’s intention to leave the present organisation (Cho, Johanson & Guchait 2009:374).
Boshoff, Van Wyk, Hoole and Owen (2002:25), however, define intention to quit as the
strength of an individual’s view that he/she does not want to stay with this/her employer.
Vandenberg and Nelson (1999:315) define intention to quit as an individual’s own estimated
probability (subject) that s/he is permanently leaving the organisation at some point in the
near future.
Intention to quit is seen as a variable and is used as an indication of the probability that an
individual will leave the organisation in the near future. Tseane (2009:1) and Braham
(2005:11) hypothesised that intention to quit starts with evaluation by the individuals of their
current situation, then they move through several further stages until a firm intention to quit is
reached. The final outcome can be a decision to leave the organisation.
Page 108
Chapter 5: Conclusions, recommendationsand limitations 93
The research revealed the variables that are found to be relating to intention to quit. These
include the experience of job-related stress, the range of factors that lead to job-related stress,
lack of commitment to the organisation and job satisfaction.
5.3.1.3 To carry out a literature review on employees’ retention and turnover
Retention of skilled and experienced personnel is a priority for any organisation.
Organisations, both public and private, rely on the expertise of their employees in order to
compete favourably and indeed gain competitive advantage in the international market
(Samuel & Chipunza 2009:410). Sutherland and Jordaan (2004:55) emphasise that a critical
component in determining an organisation’s present and future success, is its ability to retain
knowledge workers. Therefore, knowing and understanding the factors influencing
employees’ turnover intentions is paramount as it will help practitioners, managers and
organisations to develop strategies on how to prevent actual turnover (Ongori 2007:49).
However, research suggests that there are three clusters of factors influencing employees’
turnover intentions. These are psychological factors, economical factors and demographic
factors. Pyschological factors include psychological contract, job satisfaction, organisational
commitment and job insecurity. Economic factors include remuneration, external
opportunity, advancement or promotion, while demographic factors are age, tenure status,
race or ethnicity.
5.3.2 Empirical objectives
The following empirical objectives were fully addressed in this study:
5.3.2.1 To examine the level of job satisfaction of employees in the steel manufacturing
company
In order to examine employees’ perceptions or feelings about job satisfaction in the steel
manufacturing company, different components were identified through principal component
analysis using varimax rotation. The criteria for the number of factors to be extracted was
based on eigenvalues, percentage of variance, significance of factor loading and an
assessment of the factor structure (Dhurup & Mofoka 2011:161).
Page 109
Chapter 5: Conclusions, recommendationsand limitations 94
Two variables, supervision factor comprising eight variables and job variable comprising
seven variables, were used. Supervsion variable accounted for 32% and job variable
accounted for 28% of the variance explained by the factor.
These two factors accounted for 60% of the total variance. According to Lorenzo-Seva
(2013:4), this total variance is considered as a satisfactory solution using an exploratory
factor analysis procedure. The two factors appeared as important determinants in establishing
employees’ perceptions or feelings about job satisfaction. These aspects of employees’
perceptions or feelings about job satisfaction activities may provide some indications of how
employees perceive their organisation, which may ultimately influence their future
behaviours in the workplace such as the type of attachments they have towards their
organisation and their intentions to stay”.
In addition, the results indicated that in order for employees to stay in the organisation, the
incumbent who occupies the supervisor position must have experience, knowledge and skill
to execute the job. It also indicates that the job itself must be challenging and motivating to
the employees.
5.3.2.2 To determine the level of intention to quit by employees in the steel
manufacturing company
Section C of the questionnaire measured the extent to which employeed agree to quit their
current organisation with the aid of a 5-point Likert scale. Respondents were asked to answer
five questions measuring the extent to which they are willing to quit their current
organisation. The results of Section C of the questionnaire demonstrated that employees’
likelihood to continue their membership in a predictable future in this organisation was high.
The results also showed that employees found it important for them to continue maintaining
their future relationships with their current organisation. Employees’ intentions to stay on the
job are significantly associated with the conditions of employment, which are composed of
salary, welfare, and fair salary raise; these are hygiene factors associated with the security
and stability of employees’ lives.
Page 110
Chapter 5: Conclusions, recommendationsand limitations 95
5.3.2.3 To establish the relationship between job satisfaction and intention to quit of
employees in a steel manufacturing company
The study has shown that when employees are satisfied with their jobs, their intentions to stay
in that organisation are literally strengthened. This result was obtained through a correlation
analysis as shown in section 4.5 of the previous chapter. The results showed that the
supervison variable is positively correlated with job variable while it is negatively correlated
with intention to quit and the correlations were significant at p< 0.000. In addition, job
variable was also negatively correlated with intention to quit and the correlations were
significant at p< 0.000. The results indicated that when there are supervisors who are
interested in employees’ work, assisting them in solving their work-related and personal life
problems and developing informal relations together with the formal ones they are likely to
improve employees’ job satisfaction, hence decreasing employees’ intentions to quit their
current organisation and vice versa.
5.3.2.4 T-Test and ANOVA
An independent samples test for supervision variables (Table 10) revealed that the mean for
males was greater than the mean for females, it was therefore concluded that male
participants believe that management supervision forms more of a pivotal role relating to
employees’ perceptions or feelings about job satisfaction than female participants. An
independent samples test for job variables (Table 12) revealed that the mean for males was
greater than the mean for females, it was therefore concluded that male participants believe
that employees’ intentions to stay in their current organisation is influenced by employees’
perceptions or feelings about job satisfaction more than female participants.
The POST HOC test results for supervision variables versus race (Table 18) indicated that
there was no statistically significant difference between the race groups (Black (p = 0.604),
Coloured (p = 0.794), Indian (p = 0.604) as well as White (p = 0.794) as all the significance
levels are above 0.05. The results showed that all the race groups (1=Black; 2=Coloured;
3=Indian; 4=White) who participated in the study believed that management supervision
forms a pivotal role relating to employees’ perceptions or feelings about job satisfaction.
The POST HOC test results for job variables versus race (Table 20) revealed that there was
no statistically significant difference between group 1 (Black), group 2 (Coloured), group 3
(Indian,) as well as groups 4 (White) as all the significance levels are above 0.05. The results
Page 111
Chapter 5: Conclusions, recommendationsand limitations 96
indicated that all the race groups (1=Black; 2=Coloured; 3=Indian; 4=White) who
participated in the study believed that employees’ intentions to stay in their current
organisation are influenced by employee’s perceptions or feelings about job satisfaction.
5.4 RECOMMENDATIONS
Retention practices have posed enormous challenges to managers considering the shortage of
qualified manpower internationally as well as in the South African labour market. Managers
in both public and private sector organisations have to devise innovative means of retaining
high performing employees in their pool in order to avoid frequent recruitment, which is
costly and time consuming (Michael 2008:8). It is imperative, therefore, for managers to
know and understand factors that satisfy their key employees in their jobs (Amos, Ristow,
Ristow & Pearse 2008:172).
As Amos et al., (2008:179) indicated managers could motivate individual staff and ensure
performance by identifying those needs of individuals that initiate and direct behaviour,
considering which needs have been satisfied and which still need to be satisfied, and then
satisfy those needs at the right time. They also need to acknowledge that each individual is
unique and that their needs may change over time (Amos et al., 2008:179).
Based on the negative impact of intention to quit on organisations, it is therefore imperative
for managers to seek better ways to manage their employees in order to retain valued human
resources and sustain high performance. Employees are the backbone of any business success
and need to be motivated and maintained at all costs to aid the organisation to be globally
competitive in terms of providing quality products and services to society (Firth et al.,
2004:170).
5.5 STUDY LIMITATIONS
As with every study of this nature, the study was subject to certain limitations that may pave
the way for further research opportunities. The limitations are discussed as follows:
The study was based on a small sample due to financial constraints; therefore, the findings
must be treated with caution when drawing conclusions. In this study only a quantitative
approach was followed, which limits the information collected; however, a broader scope of
information could have been acquired if this approach was mixed with a qualitative approach.
Page 112
Chapter 5: Conclusions, recommendationsand limitations 97
The respondents, of their own accord, completed the questionnaire and the researcher had no
control over the responses; therefore, the researcher had to rely on information supplied by
the respondents.
The participants were not randomly selected and were chosen from the same geographic area,
among a limited number of respondents and constrained to only one organisation of the steel
manufacturing industry in South Africa. The researcher is not in a position to generalise the
result. A large sample from other steel companies in other provinces across South Africa
would have been more representative.
5.6 IMPLICATIONS FOR FUTURE RESEARCH
The study only focused on Babcock’s employees in South Africa. Future research could
target all employees across all countries where the organisation operates as the organisation
also operates in Southern Africa.
The study was restricted to examining the relationship between job satisfaction and intentions
to quit. Therefore future studies could embark on investigating the job satisfaction
relationship with other attributes that influence employees’ perceptions such as motivation,
commitment, succession planning, career development and talent management.
5.7 CONCLUDING REMARKS
Today’s business environment has become very competitive, thus making skilled employees
the major differentiating factor for most organisations. Organisations, both public and private,
rely on the expertise of their employees in order to compete favourably and indeed gain
competitive advantage in the international market (Samuel & Chipunza 2009:410).
According to Brown (2006:2), a lack of proper employee retention strategies has an adverse
effect on organisations as replacing key employees is disruptive, expensive, time consuming
and may even threaten the sustainability of these organisations. It is crucial for all
organisations, particularly those in developing countries with limited skills such as South
Africa, to ensure that they consistently develop and retain a loyal, committed and able
workforce.
Page 113
Chapter 5: Conclusions, recommendationsand limitations 98
From this study it is observed that factors influencing employees’ turnover intentions are the
psychological contract, job satisfaction, organisational commitment, job insecurity,
remuneration, external opportunity, advancement or promotion, age, tenure status, race or
ethnicity. In addtion, the research revealed the variables that are found to be relating to
intention to quit, which includes the experience of job-related stress, the range of factors that
lead to job-related stress, lack of commitment to the organisation and job satisfaction.
Every organisation needs to implement these tools as a drive for employees’ satisfaction and
motivation. These can be implemented with the help of the human resource as it is the most
valuable asset of every organisation. The intervention will help employees to be fully
involved, committed and happy in the organisation.
Page 114
List of references 99
LIST OF REFERENCES
AAMODT, M.G. 2004. Applied industrial/organisational psychology. 4th ed. United States of
America: Thomson/Wadsworth.
ABASSI, S. M. & HOLLMAN, K. W. 2000. Turnover: the real bottom line. Public
Personnel Management, 2(3): 333-342.
ADENIKE, A. 2011. Organisational climate as a predictot of employee job satisfaction.
Journal of Business Intelligence, 4(1): 152–165.
AJZEN, I. 1997. The theory of planned behaviour. Organisational Behaviour and Human
Decision Process, 50(2): 179-211.
AJZEN, I. 2001. Nature and operation of attitudes. Annual Review of Psychology, 52: 27–58.
ALAVI, H. R. & AKARIPUR, M. R. 2003. The relationship between self-esteem and job
satisfaction of personnel in government organisations. Journal of Public Personnel
Management, 32(4): 591-599.
ALEXANDER, J. A., LICHTENSTEIN, R., OH, H. J., & ULLMAN, E. 1998. A causal
model of voluntary turnover among nursing personnel in long-term psychiatric settings.
Research in Nursing and Health, 21: 415 – 427.
Al-HUSSAMI, M. 2008. A study of nurses’ job satisfaction: the relationship to
organizational commitment, perceived organizational support, transactional leadership,
transformational leadership and level of education. European Journal of Scientific Research,
22(2): 276-285.
AL-MASHAAN, O. 2003. Associations among job satisfaction, pessimism and
psychosomatic symptoms of employees in the government sector. Psychological Reports, 93:
17-25.
AMOS, T. L., RISTOW, A., RISTOW, L. & PEARSE, N. J. 2008. Human resource
management. 3rd ed. Cape Town: Juta.
ANDERSON, A.E. 2004. What is absent in absence management. Employee Benefits
Journal, 29(1): 25-30.
Page 115
List of references 100
ANDREW, D.P.S., PEDERSEN, P.M. & McEVOY, C.D. 2011. Research methods and
design in sport management. Michigan: Sheridan Books.
ARMITAGE, C. J. & CONNOR, M. 2001. Efficacy of the theory of planned behaviour: A
meta analytic review. British Journal of Social Psychology, 40: 471–499.
ARNOLDS, C.A., & BOSHOFF, C. 2001. The challenge of motivating top management: A
need satisfaction perspective [Electronic version]. Journal of Industrial Psychology, 27(1),
39-42.
BABBIE, E. R. 2008. The basics of social research. 4th ed. USA: Thomson Learning.
BABBIE, E. R. 2010. The practice of social research. 12th ed. USA: Cengage Learning.
BABCOCK AFRICA. 2011. Human Resource Annual Report.
BAJPAI, N., & SRIVASTAVA, D. 2004. Sectorial comparison of factors influencing job
satisfaction in Indian banking sector. Singapore Management Review, 26 (2): 89-99.
BARON, A. R & GREENBERG. 2003. Organizational behavior in organization:
Understanding and managing the human side of work. Canada: Prentice Hall.
BENSON, G. S. 2006. Employee development, commitment and intention to turnover: a test
of employability policies in action. Journal of Human Resource Management, 16 (2): 173-
192.
BERTELLI, A. M. 2007. Determinants of bureaucratic turnover intention: Evidence from the
Department of Treasury. Journal of Public Administration Research and Theory, 17 (2): 235–
259.
BEUKMAN, T. L. 2005. Research methodology and design. Pretoria: University of Pretoria.
BIRT, M; WALLIS, T. & WINTERNITZ, G. 2004. Talent retention in a challenging
Workplace: an investigation of variables considered important to South African talent. South
African Journal of Management, 35(2): 25 – 31.
BLAU, F. D. & DEVARO, J. (2007). New evidence on gender differences in promotion
rates: An empirical analysis of a sample of new hires. Industrial Relations, 46 (3): 511-550.
Page 116
List of references 101
BLESS, C., HIGSON-SMITH, C. & KAGEE, A. 2006. Fundamentals of social research
methods: an African perspective. 4th ed. Cape Town: Juta & Co. Ltd.
BLOOD, G., RIDENOUR, J., THOMAS, E., QUALLS, C. & HAMMER, C. 2002.
Predicting job satisfaction among speech-language pathologists working in public schools.
Language, Speech and Hearing Services in Schools, 33, 282-290.
BLUEDORN, A. C. 1982. The theories of turnover: Causes, effects and meaning. Research
in the Sociology of Organisations, 1 (75): 75-153.
BOSHOFF, A.B., VAN WYK, R., HOOLE, C. & OWEN, J.H. 2002. The prediction of
intention to quit by means of biographic variables, work commitment, role strain and
psychological climate. Management Dynamics, 11 (4): 14 – 28.
BRAHAM, 2005. The 7 hidden reasons employees leave: how to recognise the subtle signs
and act before its too late. New York: Amacon.
BROWN, H. 2006. Lack of proper retention strategies can hurt you. [Online]. Available at:
<http://www.hrfuture.net >. Accessed: 10/07/2007.
BUITENDACH, J. H. & De WITTE, H. 2005. Job insecurity, extrinsic and intrinsic job
satisfaction and affective organisation commitment of maintenance workers in a parastatal.
South African Journal of Business Management, 36 (2): 27-33.
BURNS, R.P. & BURNS, R. 2008. Business research methods and statistics using SPSS.
London: Sage.
BURNS, N., & GROVE, S. K. 2004. The practice of nursing research. 5th ed. Philadelphia:
W.B. Saunders Company.
BYRD, T., COCHRAN, J., SILVERMAN, I. J., & BLOUNT, W. R. 2000. Behind bars: an
assessment of the effects of job satisfaction, job-related stress, and anxiety of jail employees
inclinations to quit. Journal of Crime and Criminal Justice, 23: 69 – 89.
CARMELI, A. 2005. Job, organisational, professional context antecedents as predictors of
intent for inter role work transactions. Journal of Vocational Behaviour, 56(3): 330-445).
Page 117
List of references 102
CASCIO, W.F. 2003. Managing human resources: productivity, quality of work life, profits.
6th ed. New York: MacGraw-Hill Irwin.
CASCIO, W. F. 2006. Managing human resource: productivity, quality of work life, profit.
7th ed. New York: McGraw-Hill Irwin.
CHAMBERS, J.M. 1999. The job satisfaction of managerial and executive women:
Revisiting the assumptions. Journal of Education for Business,75(2):69-75.
CHEN, G., POLYHART, R. E., THOMAS, H. C., ANDERSON, N. & BLIESE, P. D. 2011.
The power of momentum: a new model of dynamic relationships between job satisfaction
change and turnover intentions. Journal Academy of Management, 54(1): 159-181.
CHEW, J. & CHAN, C.C.A. 2008. Human resource practices, organisational commitment
and intention to stay. International Journal of Manpower, 29(6): 503-522.
CHO, S., JOHANSON, M.M. & GUCHAIT, P. 2009. Employees’ intent to leave: a
comparison of determinants of intent to leave versus intent to stay. International Journal of
Hospitality Management, 28: 374 – 381.
CHOO, S. & BOWLEY, C. 2007. Using training and development to affect job satisfaction
within franchise, Journal of Small Business & Enterprise Development, 14(2): 339-352.
CHURCHILL, G. & IACOBUCCI, D. 2005. Marketing research: methodological
foundations. 9th ed. Mason: Thomson South-Western.
CLARK, A. & OSWALD, A. 1996. Satisfaction and comparison income. Journal of Public
Economics, 61,359-381.
CLUGSTON, M. 2000. The mediating effects of multidimensional commitment on job
satisfaction and intent to leave. Journal of Organisational Behaviour, 21(4): 477-486.
COHEN, A. & GOLAN, R. 2007. Predicting absenteeism and turnover intentions by past
absenteeism and work attitudes: an empirical examination of female employees in the long
term nursing care facilities. International Journal of Career Development, 12(5): 416-432.
Page 118
List of references 103
COOMBER, B. & BARRIBALL, K.L. 2007. Impact of job satisfaction on intention to leave
and turnover for hospital based nurses: a review of the research literature. Internal Journal of
Nursing Studies, 44(1): 297–314.
COTTON, J. & TUTTLE, J. 1986. Employee turnover. A meta-analysis and review with
implications for research. Academy of Management Review, 11: 55-77.
DANESHFARD, C. & EKVANIYAN, K. E. 2012. Organisational commitment and job
satisfaction in Izlamic Azad University. Interdisciplinary Journal of contemporary research
in business, 3(9): 168 – 181.
DAWAL, S. Z., TAHA, Z. & ISMAIL, Z. 2009. Effect of job organisation on job satisfaction
among shop floor employees in automotive industries in Malaysia. International Journal of
Industrial Ergonomics, 39(1): 1-6.
DENIZER, D. 2008. Accidents at work and work related health problems by sex, status, age
and severity. Journal of Health Management, 26(2): 721-760.
DHURUP, M. & MOFOKA, M.A. 2011. A factor analytical study of the dimensions of
sportscapes in selected soccer stadia in Gauteng, South Africa. African Journal for Physical,
Health Education, Recreation and Dance (AJPHERD), 1 (17): 156-171, March.
DROST, E.A. 2011. Validity and reliability in social science research. Education Research
and Perspectives, 38(1):105-123.
DURAISINGAM, V., PIDD, K. & ROCHE, A.M. 2009. The impact of work stress and job
satisfaction on turnover intentions: a study of Australian specialist alcohol and other drug
workers. Drugs, Education, Prevention and Policy, 16(3): 31-217.
ELLETT, A.J. 2001. Human caring, self-efficacy beliefs and professional organizational
culture correlates of employee retention in child welfare. Dissertation Abstracts International,
61, 3350A – 3351A. (UMI No. 9984330).
ENZ, C. A. 2010. The Cornell school of hotel administration handbook of applied hospital.
UK: Sage Publication.
Page 119
List of references 104
FARMER, S. & FEDOR, D. 1999. Volunteer participation and withdrawal: a pscychological
contract perspective on the role of expectations and organisational support. Nonprofit
Management & Leadership, 9: 349-367.
FEELEY, T. H. & BARNETT, G. A. 1997. Predicting employee turnover from
communication networks. Human Comminication Research, 23 (3): 370-387.
FINK, A. 2010. Conducting research literature reviews: from the internet to paper. 3rd ed.
California: Sage Publications, INC.
FIRTH, L., MELLOR, D.J., MOORE, K.A. & LOQUET, C. 2004. How can managers reduce
employee intention to quit? Journal of Managerial Psychology, 19 (2): 170 – 187.
FORD, R. C. & HEATON, C. P. 2001. Lessons from hospitality that can serve anyone.
Organisational Dynamics, 30(1): 30-48.
FOX, S.R. & FALLON, B.J. 2003. Modelling the effect of work/life balance on job
satisfaction and turnover intentions. Symposia paper presented at the 5th Australian Industrial
and Organisational Psychology Conference, Melbourne, Australia.
FRIDAY, S. & FRIDAY, E. 2003. Racio-ethnic perceptions of job characteristics and job
satisfaction. Journal of Management Development, 22 (5) : 426-442.
GAGNE, M. & DECI, E.L. 2005. Self-determination theory and work motivation. Journal of
Organisational Behaviour, 26:331-362.
GAZIOGLU, S. & TANSEL, A. 2002. Job satisfaction: work environment and relations with
managers in Great Britain. D.Ed. Dissertation. Ankara: Middle-East Technical University.
GELLATLY, I. R. 2005. Individual and group determinants of employee absenteeism: a test
of a causal model. Journal of Organisational Behaviour, 16(1): 469-485.
GILLINGHAM, A. 2008. Skills and clientele vanish. Sunday Times, p. 17, 28 September.
GEORGE, J.M. & JONES, G.R. 2005. Understanding and managing organizational
behaviour. 4th ed. New Jersey: Pearson.
GIBSON, J. L., INVANCEVICH, J. M. & DONELLEY, J. H. 2000. Organisations
behaviour.10th ed. Boston: McGraw-Hill.
Page 120
List of references 105
GODDARD, W. & MELVILLE, S. 2001. Research Methodology: An introduction. 2nd ed.
Landsdowne: Juta.
GRAHAM, A. & FITZGERALD, R. 2010. Children’s participation in research: some
possibilities and constraints in the current Australian research environment. Journal of
Sociology, 46(1): 133-147.
GRAVETTER, F. J. & FORZANO, L. B. 2011. Research methods for the behavioral
sciences. 4th ed. USA: Cengage Learning.
GREENBERG, J., & BARON, R.A. 1997. Behavior in organizations. 6th ed. Upper Saddle
River: New Jersey: Pearson Prentice Hall.
GREENHALGH, L. & ROSENBLATT, Z. 1984. Job insecurity. Toward conceptual clarity.
The Academy of Management Review, 9: 438-448.
GRIFFETH, R.W. & HOM, P.W. 2001. Retaining valued employees. California: Sage
Publications, Inc.
GRIFFETH, R.W., HOM, P.W. & GAERTNER, S. 2000. A meta analysis of antecedents and
correlates of employee turnover: update, moderator tests and research implications for the
next millennium. Journal of Management, 26(3): 463-488.
GROBLER, P. A., WÄRNICH, S., CARRELL, M. R., ELBERT, N. F. & HATFIELD, R. D.
2006. Human resource management in South Africa. 2nd ed. South Africa: Thompson
Learning.
GUPTA, M. & GUPTA, G. 2011. Research methodology. New Delhi: PHI Learning Private
Limited.
HAY, M. 2002. Strategies for survival in the war for talent. International Journal of Career
Development, 6(1): 52-55.
HAYES, B. E. 2008. Measuring customer satisfaction and loyalty: survey design, use, and
statiscal analysis methods. 3rd ed. USA: American Society for Quality Press.
Page 121
List of references 106
HEBENSTREIT, R. K. 2008. A call to apply the principles of the enneagram in organisations
to attract, retain and motivate employees. [Online]. Available at:
<http://researchpro.seals.ac.za>. Accessed: 12 /11/2010.
HERZBERG, F., MAUSNER, B., & SNYDERMAN, B.B. 1959. The motivation of work. 2nd
ed: New York, U.S: John Wiley & Sons.
HERZBERG, F 1993. New introduction to the motivation to work. Library of Congress.
HESSELINK, D. & VUUREN VAN, T. 1999. Job flexibility and job insecurity: the Dutch
Case. European Journal of Work and Organisational Psychology, 8: 273-293.
HEWITT ASSOCIATES. 2006. Asia countries to battle rising attrition rates. [Online].
Available at: <http://www.hewittassociates.com/mtl/ap>. Accessed: 27/11/2007.
HINTON, P.R. 2004. Statistics explained. 2nd ed. New York: Taylor & Francis.
HINTON, P.R., MCMURRAY, I. & BROWNLOW, C. 2014. SPSS explained. 2nd ed. New
York: Routledge.
HOPPOCK, R. 1935. Job satisfaction. New York: Harper & Brothers Publishers.
HORWITZ, F. 2008. Retention strategies critical in a global market skills shortage. [Online].
Available at: <http://www.gsb.uct.ac.za/hrm>. Accessed: 21/09/2010.
HULL, K.E. 1999. The paradox of the contented female lawyer. Law & Society Review,
33(3): 687-703.
IBM. 2014. Using IBM SPSS statistics. [Online]. Available at: <http://www-03.ibm.com/>.
Accessed: 28/05/2014.
JACKSON, S.L. 2012. Research methods and statistics: a critical thinking approach. 4th ed.
Wadsworth: Cengage Learning.
JAROS, S.J., JERMIER, J.M., KOEHLER, J.W., & SINCICH, T. 1993. Effects of
continuance, affective, and moral commitment on the withdrawal process: An evaluation of
eight structural equation models. Journal of Management Academy, 36 (5): 951 – 995.
Page 122
List of references 107
JIANG, B., BAKER, R.C. & FRAIZIER, G.V. 2009. An analysis of job dissatisfaction and
turnover to reduce global supply chain risk: Evidence from China. Journal of Operations
Management, 27(2): 84-168.
JINNETT, K. & ALEXANDER, J.A. 1999. The influence of organisational context on
quitting intention. Research on Aging, 21(2): 176-205.
JOHNSTON, M. W., GRIFFETH, R. W., BURTON, S. & CARSON, P. P. 1993. An
exploratory investigation into relationships between promotion and turnover. A quasi-
experimental longitudinal study. Journal of Management, 19(1): 33-49.
JONES, G. & JOHNSON, W.R. 2000. Perceived over qualification and dimensions of job
satisfaction: A longitudinal analysis. Journal of Psychology, 34(5): 537-556.
KACMAR, K.M., CARLSON, D.S. & BRYMER, R.A. 1999. Antecedents and consequences
of organisational commitment: a comparison of two scales. Educational & Psychological
Measurement, 59(6): 976-995.
KALLIATH, T. & BECK, A. 2001. Is the path to burnout and turnover paved by lack of
supervisory support? A structural equations test. Journal of New Zealand Psychology, 30(2):
72-78.
KAMARUL, Z. A., SHARIFAH, H. S. A., ZETTY, Z. M. Y., SUZANA, I. W. O. & SITI, N.
A. 2003. The association between ethical decision making, job satisfaction, Noor H.A.K
organizational commitment and selected demographic variables. Malaysian Management
Journal, 7 (2): 1-11.
KEALEY, D. J. & PROTHEROE, D. R. 1996. The effectiveness of cross-cultural training for
expatriates: an assessment of the literature on the issue. International Journal of Intercultural
Relations, 20(2): 141-165.
KEHINDE, O. 2011. Impact of job satisfaction on absenteeism: a correlative study.
European Journal of Humanities and Social Sciences. 1(1): 25-49.
KEVIN, M. M., JOAN, L. C. & ADRIAN, J. W. 2004. Organizational change and employee
turnover. Personnel Review, 33 (2): 161-166.
Page 123
List of references 108
KHATRI, N. & FERN, C. T. 2001. Explaining employee turnover in an Asian context.
Journal of Human Resource Management, 11(1): 54-74.
KIM, W., LEONG, J. K. & LEE, Y. 2005. Effect of service orienttation on job satisfaction,
organisational commitment, and intention of leaving in a casual dining chain restaurant.
International Journal of Hospitality, 24(1): 171-193.
KOSTEAS, V.D. 2009. Job level changes and wage growth. International Journal of
Manpower, 30 (3): 269-284.
KOTHARI, C.R. 2004. Research methodology: methods and techniques. 2nd ed. Las Vegas:
New Age International.
KOTZÉ, K. & ROODT, G. 2005. Factors that affect the retention of managerial and
speciality staff: an exploratory study of an employee commitment model. South African
Journal of Human Resource Management, 3(2): 48-55.
KUMAR, R. 2005. Research methodology: a step-by-step guide for beginners. 2nd ed. UK:
Sage Publications.
LADEBO, O. J. 2005. Effects of work-related attitudes on the intention to leave the
profession. Educational Management Administration and Leadership, 33 (3): 355–369.
LAM, T., BAUM, T. & PINE, R. 2001. Study of managerial job satisfaction in Hong Kong’s
Chines restaurants. International Journal of Contemporary hospitality Management, 13(1):
35-42.
LAMBERT, E.G., HOGAN, N.L., BARTON, A., & LUBBOCK, S.M. 2001. The impact of
job satisfaction on turnover intent: A test of a structural measurement model using a national
sample of workers. Journal of Social Science, 38(2): 233-251.
LARRABEE, J. H., JANNEY, M. A., OSTROW, C. L., WITHROW, M. L., HOBBS, G. R.
& BURANT, C. 2003. Predicting registered nurse job satisfaction and intent to leave. Journal
of Nursing Administration, 33 (5): 271 – 283.
LEE, T.W. 1988. How job dissatisfaction leads to employee turnover. Journal of Business
and Psychology, 2(3): 263.
Page 124
List of references 109
LEE, T. W. & MITCHELL, T. R. 1994. An alternative approach the unfolding model of
employee turnover. Academy of Management Review, 19: 51–89.
LEE, C. & WAY, K. 2010. Individual employment characteristics of hotel employees that
play a role in employee satisfaction and work retention. Internal Journal of Hospitality
Management, 29(1): 344-353.
LEEDY, P.D. & ORMROD, J.E. 2010. Practical research: planning and design. 9th ed. New
York: Person Education International.
LIM, V.K.G., TEO, T.S.H. & THAYER, J. 1998. Effects of individual characteristics on
police officers’ work-related attitudes. Journal of Managerial Psychology, 13(5): 334-343.
LITHEKO, E. 2008. Training them young is the way to up the skills base, Sunday/Business
Times, p. 26, 29 June.
LOCKE, E. A. 1976. The nature and causes of job satisfaction: handbook of industrial and
organisational psychology. Chicago: Rand McNally.
LORENZO-SEVA, U.2013. How to report the percentage of explained common variance in
exploratory factor analysis. Tarragona: Department of Psychology.
LUM, L., KERVIN, J., CLARK, K., REID, F. & SIROLA, W. 1998. Explaining nursing
turnover intent: job satisfaction, pay satisfaction, or organizational commitment. Journal of
Organizational Behaviour, 19 (3): 305 – 320.
LUTHANS, F. 1995. Organizational behavior. 7th ed. New York: McGraw-Hill.
LUTHANS, F. 2002. Organisational behavior. 9th ed. New York: McGraw Hill.
LUTHANS, F. 2005. Organizational behavior. 10th ed. New York: McGraw-Hill.
MACKEY, A. & GASS, S. M. 2005. Second language research: methodology and design.
USA: Laurence Erlbaum Associates.
MAERTZ, C.P. & CAMPION, M.A. 2004. Profiles in quitting: integrating process and
content turnover theory. Journal of Academic Management, 47 (4): 566 – 582.
Page 125
List of references 110
MANGAL, S.K & MANGAL, S. 2013. Research methodology in behavioural sciences. New
Delhi: PHI Learning Private Limited.
MARTIN, A. 2007. Perceptions of organisational commitment, job satisfaction and turnover
intentions in a post-merger South African tertiary institution. Group & Organisation
Management, 21(1): 84-105. 147
MARTIN, A. & ROODT, G. 2008. Perceptions of organizational commitment, job
satisfaction and turnover intentions in a post-merger South African tertiary institution. South
African Journal of Industrial Psychology, 34 (1): 23 – 31.
MASROOR, A. M. & FAKIR, M. J. 2010. Level of job satisfaction and intent to leave
among Malaysian nurses. Journal of Business Intelligence, 3(1):123-137.
McCARTHY, G., TYRRELL, M.P. & LEHANE, E. 2007. Intention to ‘leave’ or ‘stay’ in
nursing. Journal of Nursing Management, 15 (3): 248 – 255.
McCLELLAND, D. C. 1961. The achieving society. Princeton: Van Nostrand.
McCORMACK, B. & HILL, E. 1997. Conducting a survey: The SPSS workbook. UK:
International Thomson Business Press.
McCULLOCH, M.C. & TURBAN, D.B. 2007. Using person-organisation fit to select
employees for high-turnover jobs. International Journal of Selection and Assessment, 15(1):
63-71.
MEUDELL, K. & RODHAM, K. 1998. Money isn’t everything – or is it? A preliminary
research study into money as a motivator in the licensed house sector. International Journal
of Contemporary Hospitality Management, 10(4): 128-132.
MEYER, J.P. & ALLEN, N.J. 1991. A three component conceptualization of organizational
commitment. Human Resource Management Review, 1 (1): 61– 89.
MICHAEL, S. O. 2008. Using motivational strategy as a panacea for employee retention and
turnover in selected public and private sector organisations. M.Sc. Dissertation. South Africa:
University of Fort Hare.
Page 126
List of references 111
MILES, E.W., PATRICK, S.L. & KING, W.C. 1996. Job level as a systemic variable in
predicting the relationship between supervisory communication and job satisfaction. Journal
of Occupational & Organisational Psychology, 69(3): 277-293.
MOBLEY, W.H. 1977. Intermediate linkages in the relationship between job satisfaction and
employee turnover. Journal of Applied Psychology, 62 (2): 237–240.
MOBLEY, W.H., HORNER, S.O. & HOLLINGSWORTH. A.T. 1978. Review and
conceptual analysis of the employee turnover process. Psychological Bulletin, 86:493-522.
MOBLEY, W.H., GRIFFETH, R.W., HAND, H.H. & MEGLINO. B.M. 1979. An
evaluation of precursors of hospital employee turnover. Journal of Applied Psychology,
63:414-408.
MONETTE, D., SULLIVAN, T., DEJONG, C. & HILTON, T.P. 2013. Applied social
research: a tool for the human services. 9th ed. Connecticut: Cengage Learning.
MOORE, K. E. 2002. One road to turnover: an examination of work exhaustion in
technology professionals. MIS Quarterly, 24(1): 141-168.
MOWDAY, R. T., STEERS, R. M. & PORTER, L. M. 1978. The measure of Organisational
Commitment. University of Oregon: Oregon.
MUIJS, D. 2004. Doing quantitative research in education with SPSS. UK: Sage.
MUELLER, C. W. & PRICE, J.L. 1990. Economic psychological and sociological
determinants of voluntary turnover. The Journal of Behavioural Economic, 1990 (3): 321-
335.
MURRELLS, T., ROBINSON, S. & GRIFFITHS, P. 2008. Is satisfaction a direct predictor
of nursing turnover? Modelling the relationship between satisfaction, expressed intention and
behaviour in a longitudinal cohort study. Human Resources for Health, 6 (22): 1-12.
NELSON, D. L. & QUICK, J.C. 2006. Organizational behaviour. Foundations, realities &
challenges. 5th ed. Thomson South-Western: United States of America.
NESTER, P.I. & LEARY, P. 200. The relationship between tenure and non-tenure track
status of extension faculty and job satisfaction. Journal of Extension, 38(4).
Page 127
List of references 112
NEUMAN, W. L. 2006. Social research methods: quantitative and qualitative approaches. 6th
ed. Boston: MA: Pearson Education Inc.
NEWSTROM, J. W. 2007. Organizational behaviour: human behaviour at work. New York:
Tata McGraw-Hill Publications.
NOE, R.A., HOLLENBECK, J.R., GERHART, B. & WRIGHT, P.M. 2006. Human resource
management. Gaining a competitive advantage. 5th ed. Boston: McGraw-Hill.
ONGORI, H. 2007. A review of the literature on employee turnover. African Journal of
Business Management, 49-54, June.
OSHAGBEMI, T. 1997. The influence of rank on the job satisfaction of organisational
members. Journal of Managerial Psychology, 12(7): 511-520.
OZDEMIR, S. 2009. Factors Influencing Job Satisfaction in Azerbaijan Companies. Journal
of Qafqaz, 1(26): 102-108
PAILLÉ, P., BOURDEAU, L., & GALOIS, I. 2010. Support, trust, satisfaction, intent to
leave and citizenship at organizational level. A social exchange approach. International
Journal of Organizational Analysis, 18 (1): 41 – 58.
PARK, H. Y., OFARI-DANKWA, J. & BISHOP, D. R. 1994. Organizational and
environmental determinants of functional and dysfunctional turnover: Practical and research
implications. Human Relations, 47: 353 – 366.
PARK, J. S. & KIM, T. H. 2009. Do types of organisational culture matter in nurse job
satisfaction and turnover intentions? Leaders in Health Services, 22(1): 20-38.
PAYNE, R. L. & MORRISON, D. 2002. The differential effects of negative affectivity on
measures of well-being versus job satisfaction and organisational commitment. Journal of
Organisational Behaviour, 24(3): 415-432.
PERGAMIT, M. R. & VEUM, J. R. 1999. What is a promotion? Industrial and Labour
Relations Review, 52 (4): 581-601.
Page 128
List of references 113
PERRYER, C., JORDAN, C., FIRNS, I. & TRAVAGLIONE, A. 2010. Predicting turnover
intentions: The interactive effects of organisational commitment and perceived organisational
support. Journal of Management Research Review, 33(9): 911-923.
PITTS, D., MARVEL, J. & FERNANDEZ, S. 2011. So hard to say goodbye? Turnover
intention among US federal employees. Administration Review, 71(5): 751-760,
PODSAKOFF, N. P., LEPINE, J. A., & LEPINE, M. A. 2007. Differential challenge stressor
– hindrance stressor relationships with job attitudes, turnover intentions, turnover, and
withdrawal behaviour: A meta-analysis. Journal of Applied Psychology, 92 (2): 438 – 454.
PRICE, J. 1997. Handbook of Organisational Measurement. International Journal of
Manpower, 34: 543 – 565.
PRICE, J. & MUELLER, C. 1981. A causal model of turnover for nurses. Academy of
Management Journal, 34: 543 – 565.
PRICE, J. L. 2001. Reflections on the determinants of voluntary turnover. International
Journal of Manpower, 22(7): 660-624.
PUNCH, K. F. 2002. Developing effective research proposals. UK: Sage Publications.
PUNCH, K. F. 2003. Survey research: the basics. Thousand Oaks: Sage Publications.
RAHMAN, A., RAZA, S.S.M & RAMAY, M. 2008. Measuring turnover intention: A study
of it professionals in Pakistan. International Review of Business Research Papers, 4 (3): 45-
55.
RASLI, A. 2006. Data analysis and interpretation - a handbook for postgraduate social
scientists. Johor: Penerbit UTM Press.
REDFERN, S. H. 2005. Work satisfaction, stress, quality of care and morale of older people
in a nursing home. Health and Social Care in the Community, 10(6): 512-517.
REICHERS, A. E. 2006. Work satisfaction, stress, quality of care and morale of older people
in a nursing home. Health and Social Care in the Community, 10(3): 465 – 476.
RHODES, S. 1983. Age-related differences in work attitudes and behaviours: A review and
conceptual analysis. Psychological Bulletin, 93(2):328-367.
Page 129
List of references 114
RICHER, S. F., BLANCHARD, C. & VALLERAND, R. J. 2002. A motivational model of
work turnover. Journal of Applied Social Psychology, 32 (10): 2089 – 2113.
RIGGIO, R. E. 2003. Introduction to Industrial/Organisational Psychology. New Jersey:
Pearson Education.
RION, J. 2009. Professional development: The key to retention. [Online]. Available at:
<http://researchpro.seals.ac.za>. Accessed: 12 /11/2010.
ROBBIE, C., RYAN, A.M, SCHMIEDER, R.A., PARRA, L.F. & SMITH, P.C. 1998. The
relation between job level and job satisfaction. Group & Organisation Management, 23(4):
470-496.
ROBBINS, S.P. 2001. Organisational behavior. 9th ed. New Jersey: Prentice Hall
ROBBINS, S.P. 1998. Organisational behaviour. 8th ed. New Jersey: Prentice Hall.
ROBBINS, S.P., ODENDAAL, A. & ROODT, G. 2003. Organisational behaviour. Global
and Southern African perspectives. Cape Town: Pearson Education.
ROBBINS, S. P. 2005. Organisational behaviour. 11th ed. Beijing: Pearson Education
Company.
ROBBINS, S. P., JUDGE, T. A., MILLET, B. & WATERS-MARSH, T. 2008.
Organisational behaviour. 5th ed. Frenchs Forest: Pearson Education Company.
ROBBINS, S. P. & JUDGE, T. A. 2009. Organisational behaviour. 13th ed. New Jersey:
Pearson Education Company.
ROGERS, R. 1991. The effects of educational level on correctional officer job satisfaction.
Journal of Criminal Justice, 19(2): 123-137.
ROODT, G. 2004. Turnover intentions. Unpublished Thesis, University of the Johannesburg,
Johannesburg, South Africa.
ROOS, W. & VAN EEDEN, R. 2008. The relationship between employee motivation, job
satisfaction and corporate culture. South African Journal of Industrial Psychology, 34(1): 54-
63.
Page 130
List of references 115
ROUT, U. 1999. Gender differences in the stress, satisfaction and mental wellbeing among
general practitioners in England. Psychology, Health & Medicine, 4(4): 345-355.
SAAL, F.E. & KNIGHT, P.A. 1988. Industrial/organisational psychology: science &
practice. Belmont: Wadsworth.
SAGER, J. K. 1991. The longitudinal assessment of change in sales force turnover. Journal
of the Academy of Marketing Science, 19: 25 – 36.
SAGIE, A. 2002. Employee absenteeism, organisational commitment and job satisfaction:
another look. Journal of Vocational Behaviour, 52(2):156-171.
SAHU, P.K. 2013. Research methodology: a guide for researchers in agricultural science,
social science and other related fields. New Delhi: Springer.
SAMUEL, M. O. & CHIPUNZA, C. 2009. Employee retention and turnover: using
motivational variables as a panacea. African Journal of Business Management, 3(8): 410-415,
September.
SANTHAPPARAJ, A. S., SRINI, V. J. & LING, K. L. 2005. Job satisfaction among women
managers in Malaysia automobile manufacturing sector. Journal of Applied Science,
5(1):1553-1578.
SARKER, A.H., CROSSMAN, A. & CHINMETEEPITUCK, P. 2003. The relationship of
age and length of service with job satisfaction: an examination of hotel employees in
Thailand. Journal of Managerial Psychology, 18(1): 745-758.
SCANDURA, T.A. & LANKAU, M.J. 1997. Relationships of gender, family responsibility
and flexible work hours to organisational commitment and job satisfaction. Journal of
Organisational Behavior, 18(4): 377- 391.
SCANNAPIECO, M. & CONNELL-CARRICK, K. 2007. Child welfare workforce: The state
of the workforce and strategies to improve retention. Child Welfare, 86: 31–52.
SEKARAN, U. 2005. Rearch methods for business: a skill-building approach. 4th ed. New
York: John Wiley & Sons.
SINGH, K. 2007. Quantitative social research methods. New Delhi: Sage publications.
Page 131
List of references 116
SHAJAHAN, D. S. & SHAJAHAN, L. 2004. Organisational behaviour. New Age
International.
SHERMAN, D., ALPER, W. & WOLFSON, A. 2006. Seven things companies can do to
reduce attrition. South African Journal of Personnal Management, 24(3): 8-11.
SHIELD, M.A. & WARD, M. 2001. Improving nurse retention in the National Health
Service in England: The impact of job satisfaction on intention to quit. Journal of Health
Economics, 20(5):677-701.
SIMMONS, E. S. 2005. Predictors of organizational commitment among staff in assisted
living. The Gerontologist, 45 (2): 196-205.
SIONG, Z.M.B., MELLOR, D., MOORE, K.A. & FIRTH, L. 2006. Predicting intention to
quit in the call centre industry: Does the retail model fit? Journal of Managerial Psychology,
21: 231 – 243.
SIU, O., SPECTOR, P., COOPER, C., & DONALD, I. 2001. Age differences in coping and
locus of control: A study of managerial stress in Hong Kong. Psychology and Aging, 16, 707-
710.
SOUZA-POZA, A. & HENNEBERGER, 2002. Analysing job mobility with job turnover
intentions: An international comparative study. Research Institute for Labour Economics and
Labour law, 82(1): 1-28.
SOUSA-POZA, T. 2003. Gender differences in job satisfaction in Great Britain, 1991-2000.
Applied Economics Letters, 10(11): 691.
SPECTOR, P.E. 1996. Industrial and organisational psychology – research and practice. New
Jersey: John Wiley & Sons, Inc.
SPECTOR, P.E. 1997. Job satisfaction: Application, assessment, causes and consequences.
California: SAGE Publications.
SPECTOR, P. E. 2000. Industrial and organisational psychology: research and practice. 2nd
ed. Chichester: John Wiley & Sons.
Page 132
List of references 117
SPREITER, G.M. & MISHR, A.K. 2002. To stay or to go: Voluntary survivor turnover
following an organisational downsizing. Journal of Organisational Behaviour, 23: 707-729.
STEEL, R. P. & OVALLE, N. K. 1984. A review and meta-analysis of research on the
relationship between behavioural intentions and employee turnover. Journal of Applied
Psychology, 69: 673 – 686.
STOVEL, M. & BONTIS, N. 2002. Voluntary turnover: knowledge management-friend or
foe? Journal of intellectual Capability, 3(3): 303-322.
SUTHERLAND, M. & JORDAAN, W. 2004. Factors affecting the retention of knowledge
workers. South African Journal of Human Resource Management, 2(2): 55-64.
SWANEPOEL, B. J., ERASMUS, B. J. & SCHENK, H. W. 2008. South African human
resource management: theory and practice. 4th ed. Cape Town: Juta.
TESTA, M. R. 2001. Organisational commitment, job satisfaction and effort in the service
environment. Journal of Pscychology, 135 (2).
TETT, R.P. & MEYER, J.R. 1993. Job satisfaction, organisational commitment, turnover
intention, and turnover: Path analyses based on meta-analytic findings. Journal of Personnel
Psychology, 46(2): 259-92.
THOMAS, J.R., NELSON, J.K. & SILVERMAN, S.J. 2011. Research methods in physical
activity. 6th ed. Illinois: Human Kinetics Publishers, Inc.
TING, Y. 1997. Determinants of job satisfaction of federal government employees. Public
Personnel Management, 26(3): 313-335.
TSEANE, T. M. 2009. The importance of job satisfaction. [Online]. Available at:
<http://www.mba.co.za/article>. Accessed: 18/09/2010.
VANDENBERG, R.J. & NELSON, J.B. 1999. Disaggregating the motives underlying
turnover intentions: When do intentions predict turnover behaviour? Human Relations, 52:
1313 – 1336.
VAN DICK, R., CHRIST, O., STELLMACHER, J., WAGNER, U., AHLSWEDE, O.,
GRUBBA, C.,HAUPTMEIER, M., HÖHFELD, C., MOLTZEN, K. & TISSINGTON, P.A.
Page 133
List of references 118
2004. Should I stay or should I go? Explaining turnover intentions with organizational
identification and job satisfaction. British Journal of Management, 15 (4), 351 – 360.
VAN SCHALKWYK, S., DU TOIT, D.H., BOTHMA, A.S., & ROTHMANN, S. 2010. Job
insecurity, leadership empowerment behaviour, employee engagement and intention to leave
in a petrochemical laboratory. South African Journal of Human Resource Management, 8
(1):1 – 7.
VORSTER, M.E. 1992. Ondersoek na die verband tussen rolkonflik, werkstevredenheid en
organisasieverbondenheid by gegradueerde en nie- egradueerde werkende vroue in ‘n hoë-
tegnologie vervaardigingsorganisasie.Unpublished master’s thesis, University of the Orange
Free State, Bloemfontein, Free State.
WEIHRICH, H. & KOONTZ H. 1999. Management: a global perspective. 10th ed. McGraw-
Hill.
WEINER, Y. 1980. Commitment in organisations: a normative view. Academy of
Management Review, 7, 418-428.
WELMAN, C., KRUGER, F. & MITCHELL, B. 2005. Research methodology. 3rd ed. South
Africa: Oxford University Press.
WESTERMAN, M. A. 2006. What counts as a good quantitative research and what can we
say about when to use quantitative and/or qualitative methods? New Ideas in Psychology,
24(3): 263-274.
WILLIAMS, B., BROWN, T., & ONSMAN, A. 2010. Exploratory factor analysis: a five-
step guide for novices. Australasian Journal of Paramedicine, 8(3).
WYND, C.A., SCHMIDT, B. & SCHAEFER, M.A. 2003. Two quantitative approaches for
estimating content validity. Western Journal of Nursing Research, 25(5): 508-518.
YANG, J.T. 2008. Effect of newcomer socialisation on organisational commitment, job
satisfaction and turnover intention in the hotel industry. Journal of Service Industries, 28(4):
43-429.
YIING, L. H. & BIN AHMAD, K. Z. 2009. The moderating effects of organisational culture
on the relationships between leadership behaviour and organisational commitment and
Page 134
List of references 119
between organisational commitment and job satisfaction and performance. Journal of
Leadership and Organisation Development, 30(10): 53-86.
YOUSEF, D. A. 2000. Organisational commitment: a mediator of the relationship behaviour
with job satisfaction and performance in a non-western country. Journal of Managerial
Psychology, 15(1): 6-24.
ZIKMUND, W. G. 2003. Business research methods. 7th ed. USA: Thomson – South
Western.
ZIKMUND, W. G., BABIN, B. J., CARR, J. C. & GRIFFIN, M. 2010. Business research
methods. 8th ed. South-Western: Cengage Learning.
Page 135
Annexures 120
ANNEXURE A- QUESTIONNAIRE
JOB SATISFACTION AND THE INTENTION TO QUIT,
BY EMPLOYEES IN A STEEL MANUFACTURING COMPANY IN GAUTENG
INTRODUCTION
Good day, my name is Steve Mgiba. I am registered for a MTech in Human Resource
Management with Vaal University of Technology and am doing research on the level of job
satisfaction and intention to quit by employees in Babcock Ntuthuko Generation. The
research will assist the company to: (1) understand the employee’s perceptions and feelings
about the company; and (2) recommend strategies that can be deployed to retain current
employees. Any information you provide will be kept confidential and results of the survey
will be reported in an aggregated form that does not disclose the identity of individual
respondents. Participants are not required to state their names on the forms. Your
participation is voluntary and if at any time during the research you wish to withdraw your
participation, you are free to do so without any prejudice. It will take about 15 minutes to
complete the questionnaire. It will be appreciated if I could have the completed questionnaire
by 16 July 2014.
For further questions please do not hesitate to contact the researcher at the following contact
number: 011 601 1289.
Thank you very much for your willingness to participate in this very important study.
Please circle your answers
SECTION A: BASIC DEMOGRAPHICS & BACKGROUND
A1 Into which of the following age groups
do you fall?
18 - 24 years 1
25 – 34 years 2
35 – 44 years 3
45 – 49 years 4
50 + years 5
A2 Gender Male 1
Female 2
Page 136
Annexures 121
A3 Race
Black 1
Coloured 2
Indian 3
White 4
A4 Which of the following best describes
your marital status
Single 1
Married 2
Cohabiting 3
Divorced/separated 4
Widow/widower 5
A5
How many years have you been
working at Babcock? (round off to the
nearest year)
0 - 3 Years 1
4 – 6 Years 2
7 – 9 years 3
10 – 15 years 4
16 – 19 years 5
20 years + 6
A6 Which of the following best describes
your occupation?
Senior Management 1
Middle Management 2
Junior Management 3
Professionally Qualified/Skilled
worker 4
Semi-Skilled 5
Unskilled 6
Page 137
Annexures 122
A7 Please indicate your highest level of
education.
Primary school 1
Some secondary school 2
Matric 3
Professional training
/apprenticeship 4
Technical college/ Technikon 5
Bachelor’s Degree 6
Post Graduate 7
A8 Place of work
Babcock Ntuthuko (Head Office) 1
Babcock Ntuthuko (Fabrication) 2
Babcock Ntuthuko (Lethabo) 3
Babcock Ntuthuko (Matla) 4
Babcock Ntuthuko (Kendal) 5
Babcock Ntuthuko (Hendrina) 6
Babcock Ntuthuko (Grootvlei) 7
Page 138
Annexures 123
SECTION B: JOB SATISFACTION
The following section relates to your feelings towards your work-related needs (job
satisfaction). Please choose and circle one number for each of the statements.
B1 How busy are you kept in your present
job?
Not busy at
all 1 2 3 4 5
Extreme
busy
B2 To what extent do you have the chance to
work on your own in your present job?
To no
extent 1 2 3 4 5
To a very
large
extent
B3 How satisfied are you with the task
variety in your present job?
Not
satisfied 1 2 3 4 5
Highly
satisfied
B4 To what extent do you feel that you are
valued in your present job?
To no
extent 1 2 3 4 5
To a very
large
extent
B5
How satisfied are you with your
immediate supervisor (superior) in your
present job?
Not
satisfied 1 2 3 4 5
Highly
satisfied
B6
How satisfied are you with your
immediate supervisor’s (superior’s)
ability to make effective decisions?
Not
satisfied 1 2 3 4 5
Highly
satisfied
B7 How satisfied are you that you do not do
things that go against your conscience?
Not
satisfied 1 2 3 4 5
Highly
satisfied
B8 To what extent does your present job
provide steady employment?
To no
extent 1 2 3 4 5
To a very
large
extent
B9
To what extent do you have the chance to
do things for other people in your present
job?
To no
extent 1 2 3 4 5
To a very
large
extent
B10
How often do you have the opportunity
in your present job to be in a position of
authority and instruct other people what
to do?
Never 1 2 3 4 5 All of the
time
B11 To what extent does the current work you
do reflect your abilities?
To no
extent 1 2 3 4 5
To a very
large
extent
B12 To what extent are the organisation’s
policies put into practice?
To no
extent 1 2 3 4 5
To a very
large
extent
Page 139
Annexures 124
SECTION C: INTENTION TO QUIT
In this section we would like to know more about your tenure intentions within the
organisation that you work for. If you are unsure on your choice, please choose among the
options that seem most appropriate to you. Please indicate the extent of your dissatisfaction
or satisfaction with the statements by encircling the corresponding number between 1 (Very
dissatisfied) and 5 (Very satisfied). Please choose and circle one number for each of the
statements.
C1 In the last six months I have thought of
quitting my job
Very
dissatisfied 1 2 3 4 5
Very
satisfied
C2 I frequently think about quitting my job in
this organisation
Very
dissatisfied 1 2 3 4 5
Very
satisfied
C3 I plan to quit my job in this organisation Very
dissatisfied 1 2 3 4 5
Very
satisfied
C4 I have a desire to leave my job in this
organisation
Very
dissatisfied 1 2 3 4 5
Very
satisfied
C5 I have actively searched for a new job in
other organisations
Very
dissatisfied 1 2 3 4 5
Very
satisfied
B13
How satisfied are you that the pay you
receive reflects the amount of effort you
put into your job?
Not
satisfied 1 2 3 4 5
Highly
satisfied
B14 To what extent are there opportunities for
advancement in your present job?
To no
extent 1 2 3 4 5
To a very
large
extent
B15 How much freedom is there in your
present job to use your own judgement?
No
freedom 1 2 3 4 5
Total
freedom
B16
To what extent are you allowed to
experiment with your own methods of
doing the job?
To no
extent 1 2 3 4 5
To a very
large
extent
B17 How satisfied are you with your work
conditions?
Not
satisfied 1 2 3 4 5
Highly
satisfied
B18 How well do co-workers get along with
each other in your present job?
Not well at
all 1 2 3 4 5
Extremely
well
B19 How often do you get praise for doing a
good job? Never 1 2 3 4 5
All of the
time
B20 How often do you experience a feeling of
accomplishment from your job? Never 1 2 3 4 5
All of the
time