21
JOB SEEKER REPORT 2019
JOB SEEKER REPORT
2019

TABLE OF CONTENTS
3
2
4
5
6
7
8
9
10
11
12
13
14
16
18
19
Work Motivators
Overview
Work Motivators by Job Title
Work Motivators by Age
Work Motivators by Region
Attracting Non Applicants
Attracting Non Applicants by Age
Readiness to Adopt Latest Technology
Job Search Duration
Job Application Experience
Job Search Channels
Job Search & Application Devices
Learning Motivators
Job Change Motivators
Online Employment Platform Awareness
Approach

2
With the US jobless rate down to a near record low of 3.9%,1
attracting candidates is more competitive than ever.
Simply advertising open jobs in more places is not enough.
What motivates applicants to apply for public sector jobs?
Do motivators vary among different demographics? How
are candidates searching for new jobs and what makes
them stay?
NEOGOV answers these questions and
more in the NEOGOV Job Seeker Report.
OVERVIEW
// 888.636.4681 | [email protected] | neogov.com

WORK MOTIVATORS
// 888.636.4681 | [email protected] | neogov.com 3
Over the last 6 years, there has been an
expanding gap between public sector job
openings and the number of job seekers
applying to fill those positions. The gap has
grown to 37% (See Figure 1)2. All signs lead to
a continued widening of the gap, which could
ultimately impact the quality of service
provided by government organizations.
Therefore, it is critical to make jobs more
attractive in the public sector.
To improve the attractiveness of public sector
jobs, understanding what motivates candidates
to apply is critical. According to findings from
the NEOGOV Job Seeker Report, motivations
vary by demographic. By understanding these
motivators, employers can more strategically
attract candidates in today’s competitive job
market landscape.
NEOGOV collected responses from 2,959
respondents through a 20-minute online survey. Responses were gathered Sept 6, 2018 - Oct 3, 2018. Results
for public sector jobs show job security (61%), benefit packages (58%), the opportunity to do meaningful work
(51%), and the opportunity to serve one’s community (47%) hold the most appeal for job applicants interested
in the public sector (See Figure 2).
Salary (50%) is the most attractive aspect of working in the private sector, followed by career advancement
opportunities (41%), the opportunity to do meaningful work (36%), and working in an innovative sector (33%)
(See Figure 2).
Competitive salaries and career advancement opportunities are stronger motivators to work in the private
sector compared to the public sector (33% & 31%, respectively). Promoting job security and benefits packages
generally will appeal to the pool of job seekers interested in the public sector. However, in order to prevent job
seekers from entering the private sector, public sector salaries will need to be addressed.
Public Sector Private Sector
Appeal of Working in Public Sector vs Private Sector
Figure 2
Job Security
61% 13%
Benefits Package
58% 31%
Meaningful Work
51% 36%
Serve One’sCommunity
CompetitiveSalary
CareerAdvancement
47% 21% 33% 50% 31% 41%
Innovative Sector
11% 33%
Comparison of top motivators. Respondents select all that apply.
Public sector n=2871. Private sector n=1246.
20%
25%
30%
15%
10%
5%
0%
-5%
-10%
Job Demand vs Applicant Supply
Figure 1
% C
ha
ng
e s
ince
20
13
Jobs
Applicants
37%9%
14%
-5% -7% -5%
17%
-2%
22%
29%
-8%
2013 2014 2015 2016 2017 2018
WORK MOTIVATORS BY JOB TITLE
// 888.636.4681 | [email protected] | neogov.com
Public Sector
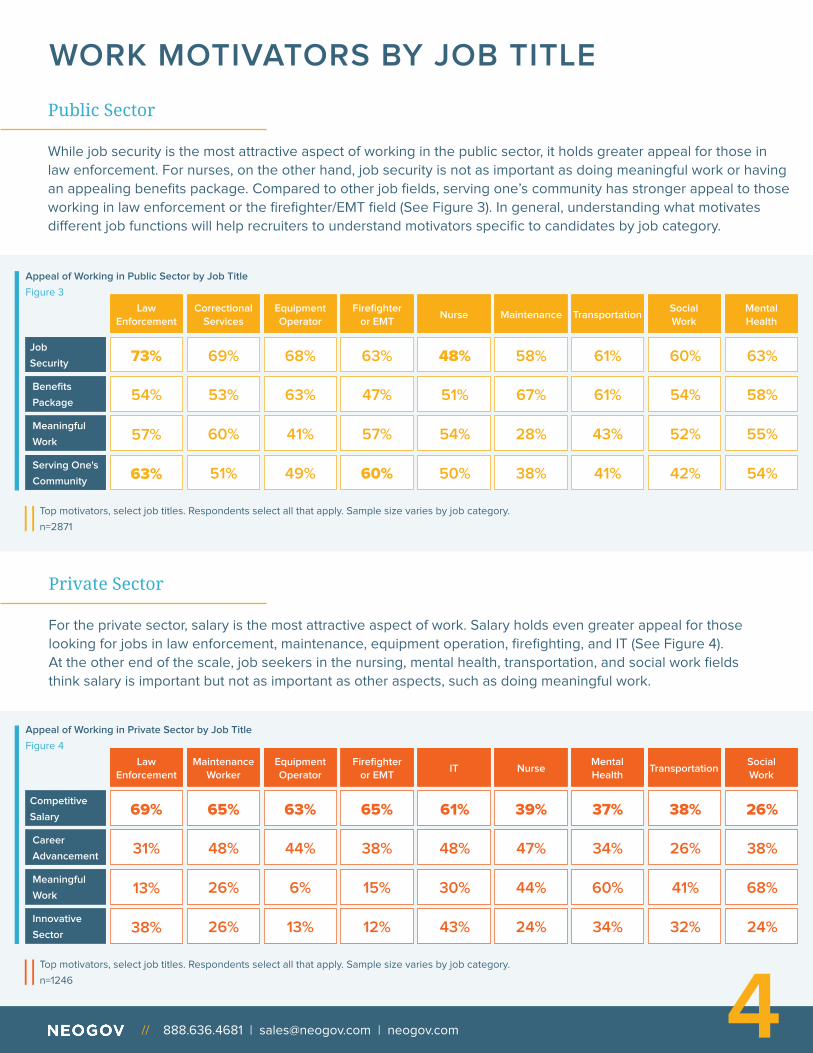
While job security is the most attractive aspect of working in the public sector, it holds greater appeal for those in
law enforcement. For nurses, on the other hand, job security is not as important as doing meaningful work or having
an appealing benefits package. Compared to other job fields, serving one’s community has stronger appeal to those
working in law enforcement or the firefighter/EMT field (See Figure 3). In general, understanding what motivates
different job functions will help recruiters to understand motivators specific to candidates by job category.
Private Sector
For the private sector, salary is the most attractive aspect of work. Salary holds even greater appeal for those
looking for jobs in law enforcement, maintenance, equipment operation, firefighting, and IT (See Figure 4).
At the other end of the scale, job seekers in the nursing, mental health, transportation, and social work fields
think salary is important but not as important as other aspects, such as doing meaningful work.
Appeal of Working in Public Sector by Job Title
Figure 3
Job
Security
Benefits
Package
Meaningful
Work
Serving One's
Community
73%
54% 53% 63% 47% 51% 67% 61% 54% 58%
69% 68% 63% 48% 58% 61% 60% 63%
60% 41% 57% 54% 28% 43% 52% 55%
51% 49% 60% 50% 38% 41% 42% 54%
57%
63%
LawEnforcement
CorrectionalServices
EquipmentOperator
Firefighteror EMT
SocialWork
Nurse Maintenance TransportationMentalHealth
Top motivators, select job titles. Respondents select all that apply. Sample size varies by job category.
n=2871
Appeal of Working in Private Sector by Job Title
Figure 4
Competitive
Salary
Career
Advancement
Meaningful
Work
Innovative
Sector
69%
31% 48% 44% 38% 48% 47% 34% 26% 38%
65% 63% 65% 61% 39% 37% 38% 26%
26% 6% 15% 30% 44% 60% 41% 68%
26% 13% 12% 43% 24% 34% 32% 24%
13%
38%
Top motivators, select job titles. Respondents select all that apply. Sample size varies by job category.
n=1246
LawEnforcement
MaintenanceWorker
EquipmentOperator
Firefighteror EMT
TransportationIT NurseMentalHealth
SocialWork
4
WORK MOTIVATORS BY AGE
// 888.636.4681 | [email protected] | neogov.com
Public Sector
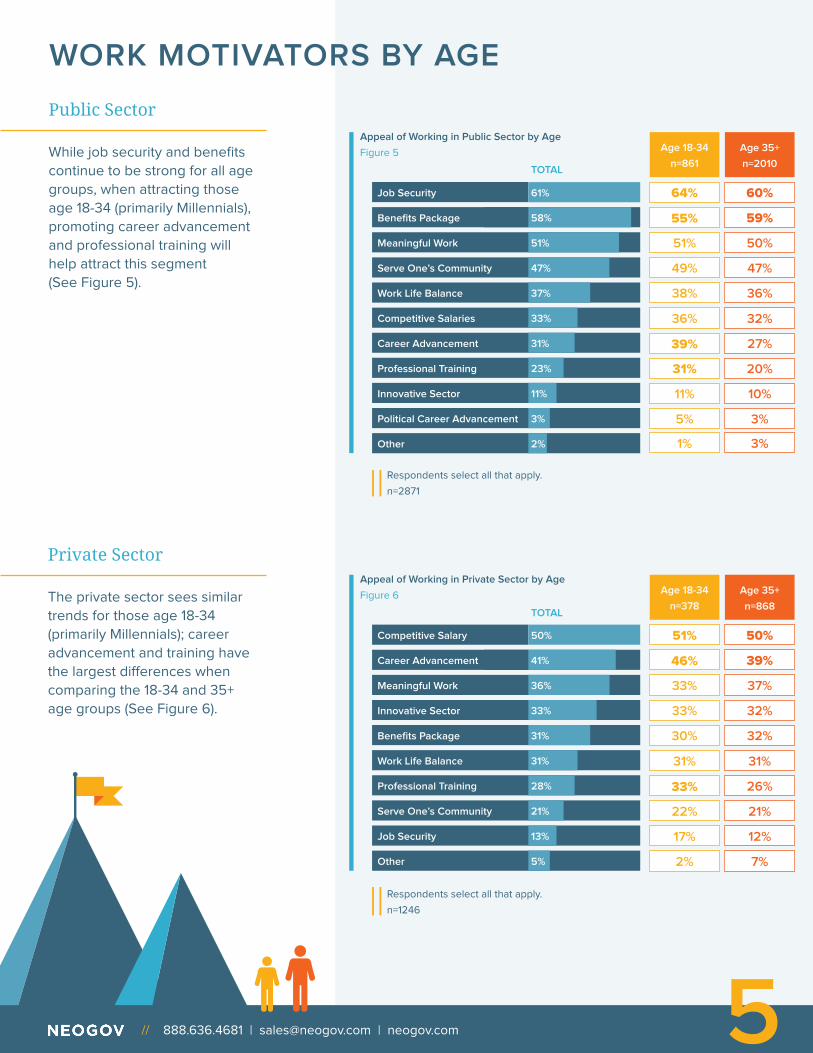
While job security and benefits
continue to be strong for all age
groups, when attracting those
age 18-34 (primarily Millennials),
promoting career advancement
and professional training will
help attract this segment
(See Figure 5).
Private Sector
The private sector sees similar
trends for those age 18-34
(primarily Millennials); career
advancement and training have
the largest differences when
comparing the 18-34 and 35+
age groups (See Figure 6).
5
Appeal of Working in Public Sector by Age
Figure 5 Age 18-34
n=861
64%
36%
55%
39%
51%
31%
49%
11%
38%
5%
1%
Age 35+
n=2010
60%
32%
59%
27%
50%
20%
47%
10%
36%
3%
3%
Job Security
Benefits Package
Meaningful Work
Serve One’s Community
Work Life Balance
Competitive Salaries
Career Advancement
Professional Training
Innovative Sector
Political Career Advancement
Other 2%
3%
11%
23%
31%
33%
37%
47%
51%
58%
61%
Respondents select all that apply.
n=2871
TOTAL
Appeal of Working in Private Sector by Age
Figure 6 Age 18-34
n=378
51%
31%
46%
33%
33%
22%
33%
17%
30%
2%
Age 35+
n=868
50%
31%
39%
26%
37%
21%
32%
12%
32%
7%
Competitive Salary
Career Advancement
Meaningful Work
Innovative Sector
Benefits Package
Work Life Balance
Professional Training
Serve One’s Community
Job Security
Other 5%
13%
21%
28%
31%
31%
33%
36%
41%
50%
Respondents select all that apply.
n=1246
TOTAL

WORK MOTIVATORS BY REGION
6// 888.636.4681 | [email protected] | neogov.com
Public Sector
Government job applicants in the West, Northeast, and South find job security and benefits in the public sector most appealing. The West and Central region put greater value on doing meaningful work and the Northeast and South are less motivated by salary. In the Central region, the benefits package and opportunity to do meaningful work provide greater appeal (See Figure 7). By being more aware of regional trends, recruiters can more accurately create job postings that appeal to applicants by geography.
Private Sector
Competitive salaries and opportunities for career advancement hold the greatest appeal among those applying for private sector jobs across all regions. Benefits packages have above average appeal for those in the South and Northeast, while more in the Central region are motivated by the opportunity to attain work life balance (See Figure 8).
Appeal of Working in Public Sector by Region
Figure 7
Job Security
West Central Northeast South
62% 52% 65% 61%
58% 58% 55% 56%
52% 57% 45% 47%
48%
35%
36%
49%
35%
38%
46%
39%
26%
45%
42%
28%
Benefits Package
Meaningful Work
Serve One’s Community
Work Life Balance
Competitive Salary
Top motivators. Respondents select all that apply. Sample size varies by region.
n=2871
Appeal of Working in Private Sector by Region
Figure 8
West Central Northeast South
48% 48% 58% 56%
40% 44% 46% 42%
38% 41% 35% 31%
36%
29%
29%
29%
26%
39%
33%
37%
33%
29%
38%
29%
Competitive Salary
Career Advancement
Meaningful Work
Innovative Sector
Benefits Package
Work Life Balance
Top motivators. Respondents select all that apply. Sample size varies by region.
n=1246
7 // 888.636.4681 | [email protected] | neogov.com
We’ve recognized we have to
go find people who aren’t looking
for us and convince them to make
a leap into the public sector.
NANCY BUONANNO GRENNAN
Human Resources Director
Kitsap County
““
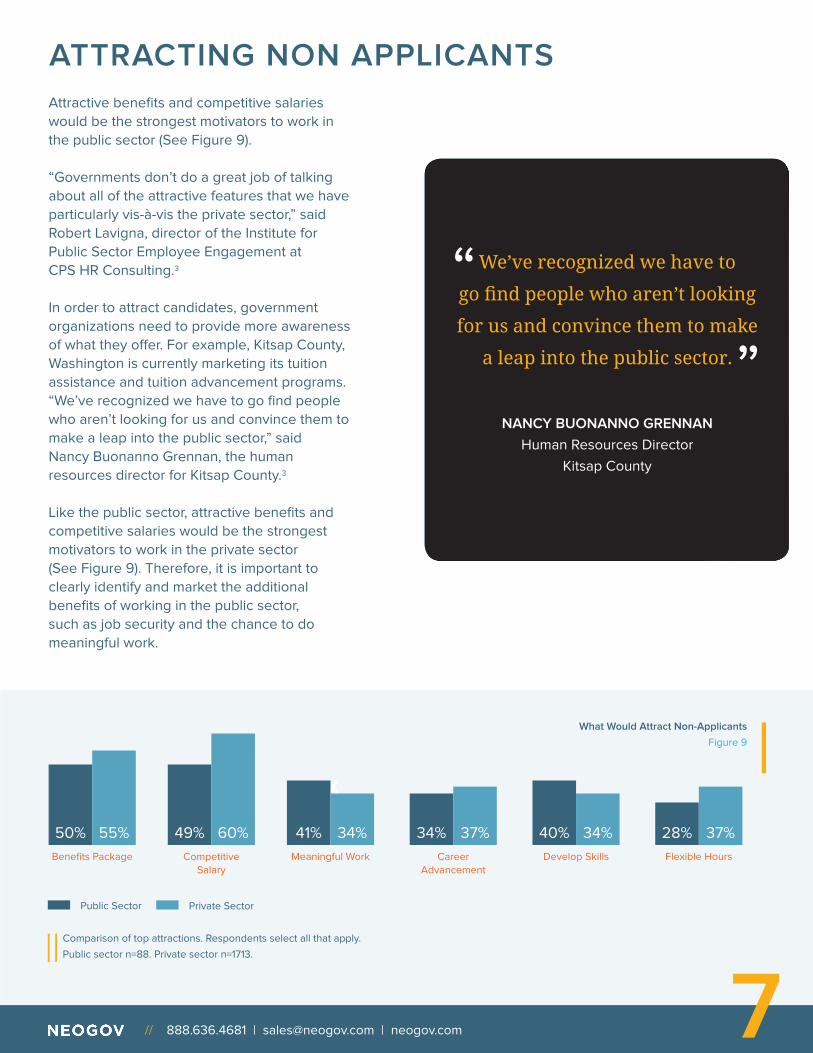
ATTRACTING NON APPLICANTS
Attractive benefits and competitive salaries
would be the strongest motivators to work in
the public sector (See Figure 9).
“Governments don’t do a great job of talking
about all of the attractive features that we have
particularly vis-à-vis the private sector,” said
Robert Lavigna, director of the Institute for
Public Sector Employee Engagement at
CPS HR Consulting.3
In order to attract candidates, government
organizations need to provide more awareness
of what they offer. For example, Kitsap County,
Washington is currently marketing its tuition
assistance and tuition advancement programs.
“We’ve recognized we have to go find people
who aren’t looking for us and convince them to
make a leap into the public sector,” said
Nancy Buonanno Grennan, the human
resources director for Kitsap County.3
Like the public sector, attractive benefits and
competitive salaries would be the strongest
motivators to work in the private sector
(See Figure 9). Therefore, it is important to
clearly identify and market the additional
benefits of working in the public sector,
such as job security and the chance to do
meaningful work.
Private Sector
Benefits Package
50% 55%“
Meaningful Work
41% 34%49% 60%
CompetitiveSalary
CareerAdvancement
34% 37%
Develop Skills
40% 34%
Flexible Hours
28% 37%
What Would Attract Non-Applicants
Figure 9
Public Sector
Comparison of top attractions. Respondents select all that apply.
Public sector n=88. Private sector n=1713.

8 // 888.636.4681 | [email protected] | neogov.com
Public Sector
Despite the small sample size of
those not applying for jobs in the
public sector, significant
differences were found among
age groups. While benefits and
salary would attract non
applicants to the public sector
across age groups, those age
18-34 (primarily Millennials) are
more likely to be attracted by
opportunities to learn skills of
interest, serve their communities,
and work in attractive cities.
The ability to work remotely and
flexible work hours hold greater
appeal for older job applicants.
ATTRACTING NON APPLICANTS BY AGE
Private Sector
Like the public sector, across
age groups competitive salary
and benefits would attract non
applicants to the private sector;
however competitive salaries
hold greater attraction for older
respondents. The ability to work
remotely holds greater
attraction for older respondents,
while younger ones place greater
emphasis on potential
advancement and working in
attractive cities (See Figure 11).
What Would Attract Non-Applicants to Public Sector by Age
Figure 10 Age 18-34
n=21
57%
14%
48%
38%
38%
14%
48%
19%
38%
19%
19%
19%
5%
10%
-
Age 35+
n=67
48%
37%
49%
30%
42%
33%
37%
27%
33%
21%
19%
12%
4%
3%
4%
Benefits Package
Competitive Salary
Meaningful Work
Learn Skills I’m interested in
Career Advancement
Work Remotely
Serve One’s Community
Flexible Hours
Available Jobs in Profession
Innovative Environment
Fast / Simple Hiring Process
Attractive City
Political Ideology Represented
Advance Political Career
Other
19%
14%
5%
5%
3%
20%
25%
28%
32%
32%
34%
40%
41%
49%
50%
Respondents select all that apply. n=88
TOTAL
Respondents select all that apply. n=1246
What Would Attract Non-Applicants to Private Sector by Age
Figure 11 Age 18-34
n=378
56%
28%
54%
34%
41%
30%
38%
26%
36%
23%
19%
17%
3%
4%
Age 35+
n=868
61%
37%
55%
34%
36%
31%
36%
25%
34%
22%
19%
12%
2%
4%
Competitive Salary
Benefits Package
Career Advancement
Flexible Hours
Learn Skills I’m Interested in
Work Remotely
Meaningful Work
Available Jobs in Profession
Serve One’s Community
Fast / Simple Hiring Process
Innovative Environment
Attractive City
Political Ideology Represented
Other
19%
14%
2%
4%
22%
25%
31%
34%
34%
34%
36%
37%
54%
60%
TOTAL

9 // 888.636.4681 | [email protected] | neogov.com
Most job applicants (86%) believe that government’s
readiness to adopt the latest technology is likely to have
an impact on their willingness to work for the public
sector (See Figure 12).
Younger job seekers who applied for a government job
are more likely to indicate that the government’s
readiness to adopt the latest technology completely
impacts their willingness to work in the public sector
(See Figure 13).
READINESS TO ADOPT LATEST TECHNOLOGIES IMPACTS WILLINGNESS TO WORK
Yes, completely
Yes, to some extent
No, not at all
38%
48%
14%
Does the government’s readiness to adopt
the latest technologies have a positive
impact on your willingness to work there?
Government’s Readiness to Adopt Latest Technology Impact
on Willingness to Work in Public Sector
Figure 12
n=2871
Government’s Readiness to Adopt Latest Technology
Impact on Willingness to Work in Public Sector by Age
Figure 13
Yes, completely 43%
46%
12%
35%
49%
15%
Yes, to some extent
No, not at all
n=2871
Age 18-34
n=861
Age 35+
n=2010

10 // 888.636.4681 | [email protected] | neogov.com
Among respondents, nearly half of job applicants have
been looking for a job for less than 6 months (47%)
(See Figure 14). Many applicants are finding jobs quickly,
so it is important for public sector organizations to
efficiently market available jobs and streamline the
hiring process in order to capture qualified candidates.
Younger job seekers 18 to 34 tend to spend less time
looking for a job, while significantly more respondents
35 or older have been looking for 12 months or more
(See Figure 15).
JOB SEARCH DURATION
Length of Time Looking for a Job
Figure 14
LESS THAN A MONTH
1 - 3 MONTHS
4 - 6 MONTHS
6 - 9 MONTHS
10 - 12 MONTHS
12+ MONTHS
8%
20%
19%
11%
8%
35%
n=2959
Length of Time Looking for a Job by Age
Figure 15
1 - 3 MONTHS
12+ MONTHS
Age 18 - 34
n=882
Age 35+
n=2077
Age 35+
n=2077
Age 18 - 34
n=882
25%
38%
18%
27%
n=2959
11 // 888.636.4681 | [email protected] | neogov.com
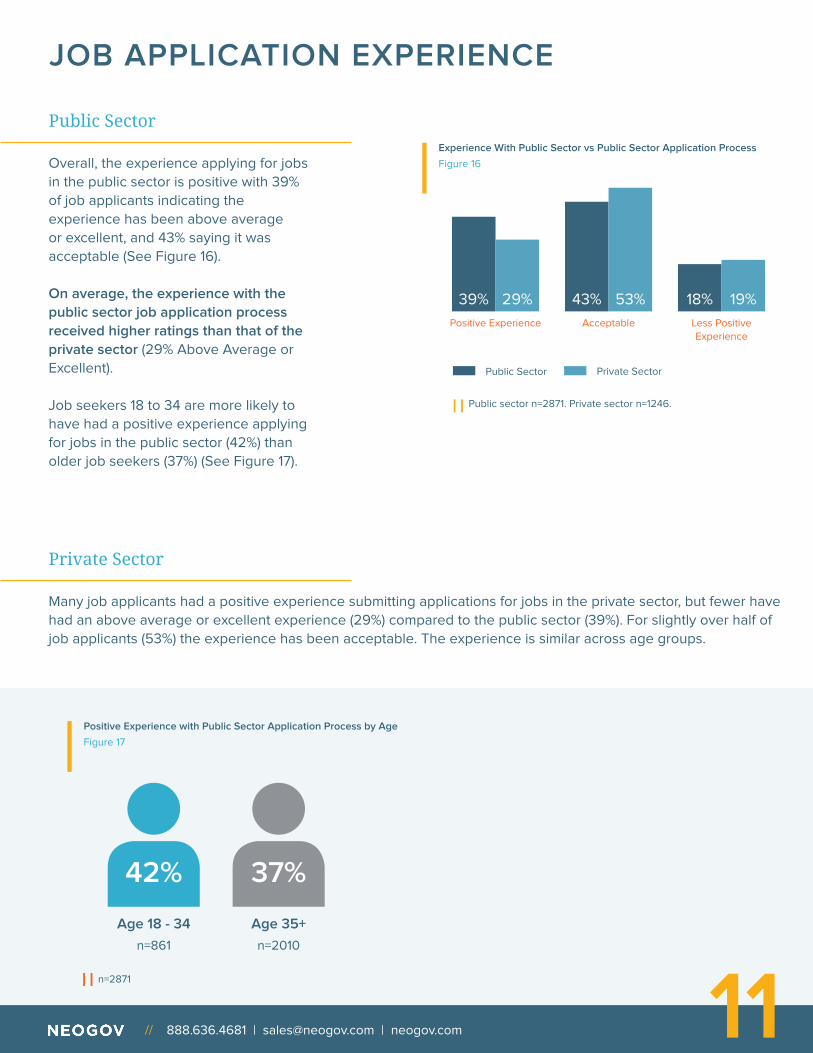
JOB APPLICATION EXPERIENCE
Private Sector
Many job applicants had a positive experience submitting applications for jobs in the private sector, but fewer have
had an above average or excellent experience (29%) compared to the public sector (39%). For slightly over half of
job applicants (53%) the experience has been acceptable. The experience is similar across age groups.
Public Sector
Overall, the experience applying for jobs
in the public sector is positive with 39%
of job applicants indicating the
experience has been above average
or excellent, and 43% saying it was
acceptable (See Figure 16).
On average, the experience with the
public sector job application process
received higher ratings than that of the
private sector (29% Above Average or
Excellent).
Job seekers 18 to 34 are more likely to
have had a positive experience applying
for jobs in the public sector (42%) than
older job seekers (37%) (See Figure 17).
Positive Experience with Public Sector Application Process by Age
Figure 17
Age 18 - 34
n=861
Age 35+
n=2010
42% 37%
n=2871
Acceptable
43% 53%
Positive Experience
39% 29%
Less PositiveExperience
18% 19%
Public Sector Private Sector
Public sector n=2871. Private sector n=1246.
Experience With Public Sector vs Public Sector Application Process
Figure 16
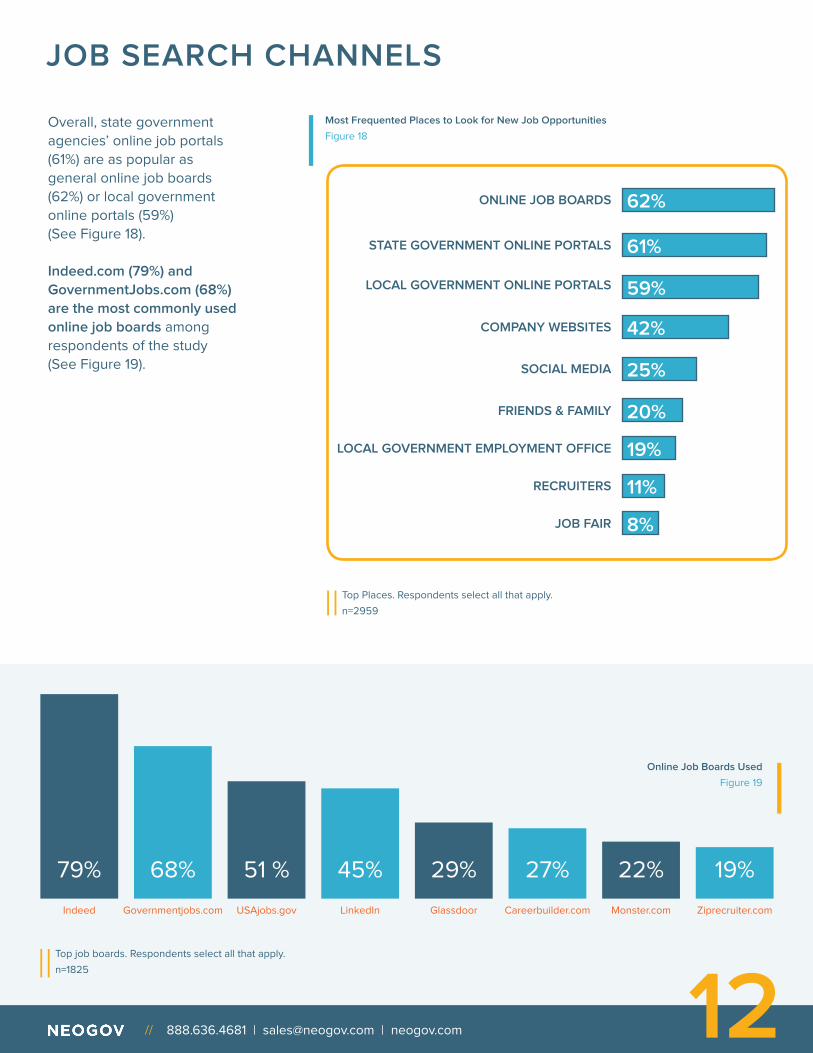
Online Job Boards Used
Figure 19
Indeed USAjobs.gov LinkedIn Glassdoor Monster.com Ziprecruiter.comCareerbuilder.comGovernmentjobs.com
79% 68% 51 % 45% 29% 27% 22% 19%
12 // 888.636.4681 | [email protected] | neogov.com
Overall, state government
agencies’ online job portals
(61%) are as popular as
general online job boards
(62%) or local government
online portals (59%)
(See Figure 18).
Indeed.com (79%) and
GovernmentJobs.com (68%)
are the most commonly used
online job boards among
respondents of the study
(See Figure 19).
JOB SEARCH CHANNELS
Top job boards. Respondents select all that apply.
n=1825
Most Frequented Places to Look for New Job Opportunities
Figure 18
Top Places. Respondents select all that apply.
n=2959
ONLINE JOB BOARDS
STATE GOVERNMENT ONLINE PORTALS
LOCAL GOVERNMENT ONLINE PORTALS
COMPANY WEBSITES
SOCIAL MEDIA
FRIENDS & FAMILY
LOCAL GOVERNMENT EMPLOYMENT OFFICE
RECRUITERS
JOB FAIR
62%
61%
59%
42%
25%
20%
19%
11%
8%

13 // 888.636.4681 | [email protected] | neogov.com
JOB SEARCH & APPLICATION DEVICES
Computers/Laptops Preferred Devices for Applying
Computers/laptops are still the preferred
devices for applying for jobs, while
mobile apps are the least preferred
(See Figure 20).
Significantly more respondents 18 to 34
(26% vs. 20% among 35+) visit websites
on a phone or tablet when searching for
jobs (See Figure 21).
Half of Job Seekers Very Confident in Their Tech Skills
Nearly half of job seekers are very
confident (48%) in their ability to work
with intelligent technologies
(See Figure 22).
Consistent with the belief that knowing
how to work with intelligent technology
can increase job opportunities, over 6
in 10 job seekers think it is important or
very important to develop skills in this
field (See Figure 23).
Channel Usage by Age
Figure 21 Age 18-34
n=882
62%
26%
12%
Age 35+
n=2077
69%
20%
10%
Website on Computer / Laptop
Website on Phone / Tablet
Mobile App on Phone / Tablet 11%
22%
67%
n=2959
Confidence in Ability to Work with Intelligent Technologies
Figure 22
Importance of Developing Skills to Work with Intelligent Technology
Figure 23
VERY CONFIDENT 48% VERY IMPORTANT 37%
SOMEWHAT CONFIDENT 37% IMPORTANT 27%NOT PARTICULARLY CONFIDENT 12% MODERATELY IMPORTANT 18%
NOT CONFIDENT AT ALL 3% SLIGHTLY IMPORTANT 11%
NOT IMPORTANT AT ALL 7%
Preferred Device for Applying for Jobs
Figure 20
Website on
Computer / Laptop
Website on
Phone / Tablet
Mobile App
82%10% 8%
n=2959
n=2959
n=2959

14 // 888.636.4681 | [email protected] | neogov.com
LEARNING MOTIVATORS
Career Advancement Top Motivator for Learning
Having opportunities to advance
their careers (65%), receiving funds
to cover training (63%), and being
given time for training during the
work day (51%) are the top
motivators to look for learning
opportunities (See Figure 24).
Helping them advance their career
is more likely to motivate younger
workers to look for opportunities to
develop new skills. Older workers
place greater motivation on being
able to participate in customized or
personalized training
(See Figure 25).
Marketing the potential for new
skills training in a job description
could give applicants the ability to
see growth within their public
sector career.
Respondents select up to 3 choices.
n=2959
Career Advancement
Funding to Cover Training Costs
Time to Learn During Work Day
Increased Job Security
Training Run by External Partners
Customized Training
Access to Job Rotation Programs
Other 1%
11%
24%
29%
35%
51%
63%
65%
Top 3 Motivators to Look for Learning Opportunities
Figure 24
Respondents select up to 3 choices.
n=2959
Top 3 Motivators to Look for Learning Opportunities
by Age
Figure 25
Age 18-34
n=882
70%
19%
65%
10%
53%
0%
37%
30%
Age 35+
n=2077
63%
26%
62%
12%
50%
2%
34%
29%
Career Advancement
Funding for Training
Time to Learn
Increased Job Security
External Training Programs
Personalized Training
Job Rotation Programs
Other 1%
11%
24%
29%
35%
51%
63%
65%
TOTAL

15 // 888.636.4681 | [email protected] | neogov.com
Personal Responsibility for Skill Relevancy
When it comes to ensuring that
their skills stay relevant, most job
seekers place the responsibility first
on themselves (53%), and second
on employers (29%)
(See Figure 26).
The majority of respondents 35
or older (56%) say they are
responsible for keeping their skills
relevant. While most respondents
18 to 34 agree (46%), this group is
more likely to say employers share
some of this responsibility as well
(32%) (See Figure 27).
Most Responsible for Ensuring Workers’ Skills Stay Relevant
Figure 26
Educational
Institutions
The Government
Workers Union
Employers
Workers
Themselves
8%
3%
8%
29%
53%
Responsibility for Skill Relevancy by Age
Figure 27 Age 18-34
n=882
46%
32%
8%
9%
5%
Age 35+
n=2077
56%
27%
7%
7%
3%
Workers Themselves
Employers
Educational Institutions
The Government
Workers Union 3%
7%
8%
29%
53%
Respondents rank in order.
n=2959
Respondents rank in order.
n=2959
TOTAL
16 // 888.636.4681 | [email protected] | neogov.com
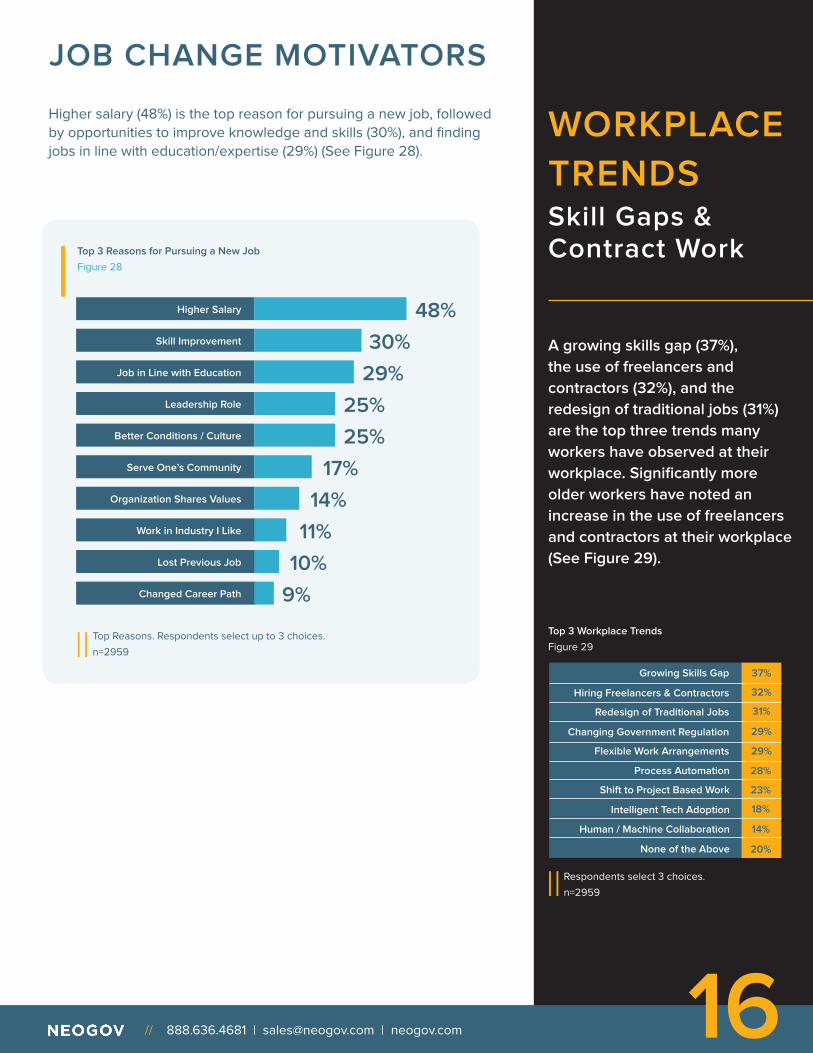
JOB CHANGE MOTIVATORS
Higher salary (48%) is the top reason for pursuing a new job, followed
by opportunities to improve knowledge and skills (30%), and finding
jobs in line with education/expertise (29%) (See Figure 28).
WORKPLACE
TRENDS Skill Gaps & Contract Work
A growing skills gap (37%),
the use of freelancers and
contractors (32%), and the
redesign of traditional jobs (31%)
are the top three trends many
workers have observed at their
workplace. Significantly more
older workers have noted an
increase in the use of freelancers
and contractors at their workplace
(See Figure 29).
Top Reasons. Respondents select up to 3 choices.
n=2959
Higher Salary
Skill Improvement
Job in Line with Education
Leadership Role
Better Conditions / Culture
Serve One’s Community
Organization Shares Values
Work in Industry I Like
Lost Previous Job
Changed Career Path
11%
10%
9%
14%
17%
25%
25%
29%
30%
48%
Top 3 Reasons for Pursuing a New Job
Figure 28
Respondents select 3 choices.
n=2959
Top 3 Workplace Trends
Figure 29
Growing Skills Gap
Hiring Freelancers & Contractors
Redesign of Traditional Jobs
Changing Government Regulation
Flexible Work Arrangements
37%
32%
31%
29%
29%
28%
23%
18%
14%
20%
Process Automation
Shift to Project Based Work
Intelligent Tech Adoption
Human / Machine Collaboration
None of the Above

17 // 888.636.4681 | [email protected] | neogov.com
Competitive salary/benefit plans (61%),
a pleasing work environment (41%),
and challenging/rewarding work (33%)
are the top 3 reasons for staying at a
job across job categories
(See Figure 30).
While most job seekers across
categories have changed jobs 1 to 3
times in the past 5 years (64%),
frequency of job changes declines
with age (See Figure 31).
Respondents 18 to 34 are significantly
more likely to have changed jobs two
to five times in the past 5 years, while
respondents 35 or older have changed
once or not at all.
Top 3 Motivators to Stay at a Job
Figure 30
Respondents select up to 3 choices.
n=2959
Competitive Salary & Benefits 61%
Pleasing Work Environment 41%
Rewarding Work 33%
Flexible Work Arrangements 30%
Ability to Fully Utilize Skills 25%
Reasonable Commute 22%
Continuous Training 17%
“On The Job” Experience 17%
Serve One’s Community 16%
Flexible Career Path 7%
Personalized Benefit Plans 7%
Formal Training 6%
Personalized Career Plan 3%
Digital Enablement in Workplace 2%
Other 2%
Number of Times Changed Jobs in Past 5 Years by AgeFigure 31
Age 18-34
n=882
16%
27%
25%
19%
6%
5%
3%
Age 35+
n=2077
33%
31%
20%
10%
3%
1%
2%
None
Once
Twice
Three Times
Four Times
Five Times
More Than Five Times
4%
2%
2%
13%
21%
30%
28%
n=2959
TOTAL

18 // 888.636.4681 | [email protected] | neogov.com
Awareness of online
employment platforms,
which are part of the
current “gig “economy,
are still limited with
TaskRabbit having the
highest awareness (18%)
followed by Freelancer
(14%) (See Figure 32).
Awareness of these
platforms is higher
among younger
respondents (18 to 34)
compared to their
older counterparts
(See Figure 33).
ONLINE EMPLOYMENT PLATFORM AWARENESS
Online Employment Platform Awareness
Figure 32
18% 14% 8% 7%
TaskRabbit Freelancer Upwork Amazon
Mechanical
Turk
Online Employment Platform Awareness by Age
Figure 33
TaskRabbit
Age 18-34
n=882
22%
15%
9%
9%
Age 35+
n=2077
16%
13%
7%
7%
Freelancer
Upwork
Amazon Mechanical Turk
n=2959
n=2959

19
NEOGOV’s 2018 Job Seeker Report included 2,959
respondents from the GovernmentJobs.com job applicant
database. The 20-minute online survey, conducted by
Relevant Insights LLC, was completed by respondents
September 6, 2018 to October 3, 2018.
References
1 Employment Situation Summary. (2018, December 7). Retrieved from
https://www.bls.gov/news.release/empsit.nr0.htm
2 NEOGOV. (2019). Supply & Demand Trends, Applicants vs Jobs. Re-
trieved from NEOGOV. From Jan 1, 2013 to Dec 31, 2018, NEOGOV ana-
lyzed the recruitment data from 821 agencies, representing 687,778 jobs
posted with over 43 million applications.
3 Barrett, K. Greene, R. (2018, October 8). How Public Employee
Benefits (Beyond Pensions and Health Care) Compare to the Private
Sector’s. Governing. Retrieved from http://www.governing.com/topics
workforce/gov-private-versus-public-sector-employee-benefits.html
APPROACH
// 888.636.4681 | [email protected] | neogov.com
NEOGOV provides a high quality and easy-to-use
talent management system to service the public
sector market.
Serving over 6,000 organizations, the company’s suite of solutions
supports the entire employee lifecycle, automating recruitment,
onboarding, training, and performance management. Customers say
NEOGOV helps them save time and money, reduce paper processes,
improve regulatory requirement compliance, increase employee
productivity and engagement, and provide better services to citizens.
More information at neogov.com
// 888.636.4681 | [email protected] | neogov.com


