23
JOB SEEKER REPORT 2021
JOB SEEKER REPORT
2021
TABLE OF CONTENTS
1 Overview
2 The Gap Between Jobs and Applications Per Job Continues to Widen
4 Top Motivators for Job Seekers in the Public Sector
8 Top Motivators for Employee Retention
9 Sources of Frustration
13 The Most Popular Choice When Applying to Jobs Are Online Methods
14 What Job Seekers Want to See In Job Descriptions
15 How Can Employers Improve the Candidate Experience?
17 Looking Ahead to the Future of Work Trends
20 Methodology & References
888.636.4681 | [email protected] | neogov.com
OVERVIEW
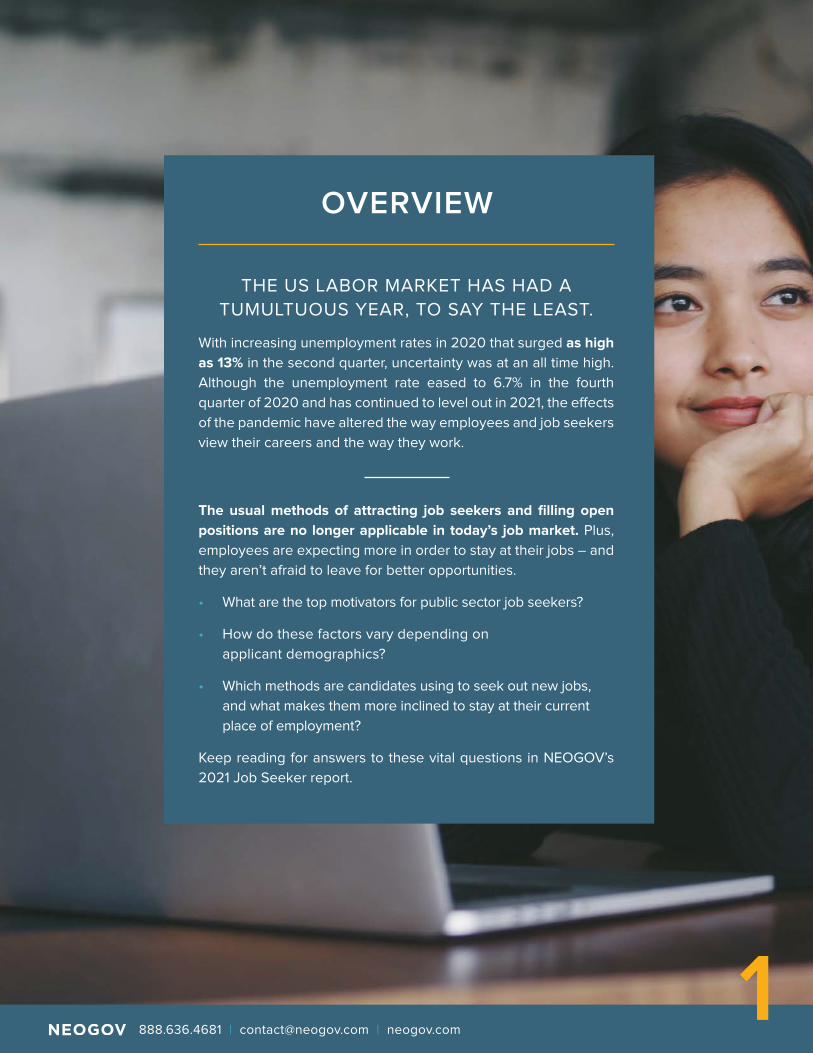
THE US LABOR MARKET HAS HAD A
TUMULTUOUS YEAR, TO SAY THE LEAST.
With increasing unemployment rates in 2020 that surged as high
as 13% in the second quarter, uncertainty was at an all time high.
Although the unemployment rate eased to 6.7% in the fourth
quarter of 2020 and has continued to level out in 2021, the effects
of the pandemic have altered the way employees and job seekers
view their careers and the way they work.
The usual methods of attracting job seekers and filling open
positions are no longer applicable in today’s job market. Plus,
employees are expecting more in order to stay at their jobs – and
they aren’t afraid to leave for better opportunities.
• What are the top motivators for public sector job seekers?
• How do these factors vary depending on
applicant demographics?
• Which methods are candidates using to seek out new jobs,
and what makes them more inclined to stay at their current
place of employment?
Keep reading for answers to these vital questions in NEOGOV’s
2021 Job Seeker report.
1 888.636.4681 | [email protected] | neogov.com
THE GAP BETWEEN JOBS & APPLICATIONS CONTINUES TO WIDEN IN 2021
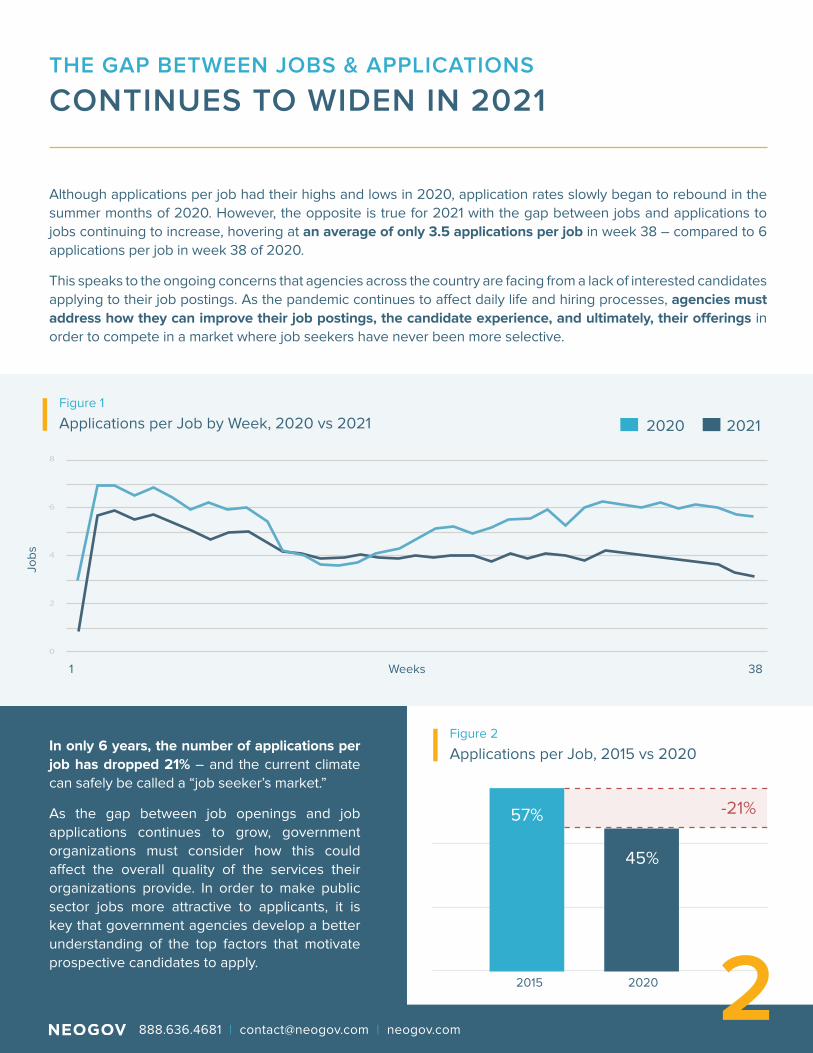
In only 6 years, the number of applications per
job has dropped 21% – and the current climate
can safely be called a “job seeker’s market.”
As the gap between job openings and job
applications continues to grow, government
organizations must consider how this could
affect the overall quality of the services their
organizations provide. In order to make public
sector jobs more attractive to applicants, it is
key that government agencies develop a better
understanding of the top factors that motivate
prospective candidates to apply.
Although applications per job had their highs and lows in 2020, application rates slowly began to rebound in the
summer months of 2020. However, the opposite is true for 2021 with the gap between jobs and applications to
jobs continuing to increase, hovering at an average of only 3.5 applications per job in week 38 – compared to 6
applications per job in week 38 of 2020.
This speaks to the ongoing concerns that agencies across the country are facing from a lack of interested candidates
applying to their job postings. As the pandemic continues to affect daily life and hiring processes, agencies must
address how they can improve their job postings, the candidate experience, and ultimately, their offerings in
order to compete in a market where job seekers have never been more selective.
Figure 1
Applications per Job by Week, 2020 vs 2021
Figure 2
Applications per Job, 2015 vs 2020
2020 2021
Weeks
2015 2020
Job
s
1 38
8
6
4
2
0
57% -21%
45%
2 888.636.4681 | [email protected] | neogov.com
FROM 2019 TO 2020 APPLICATIONS PER JOB
DECREASED IN MOST CATEGORIES
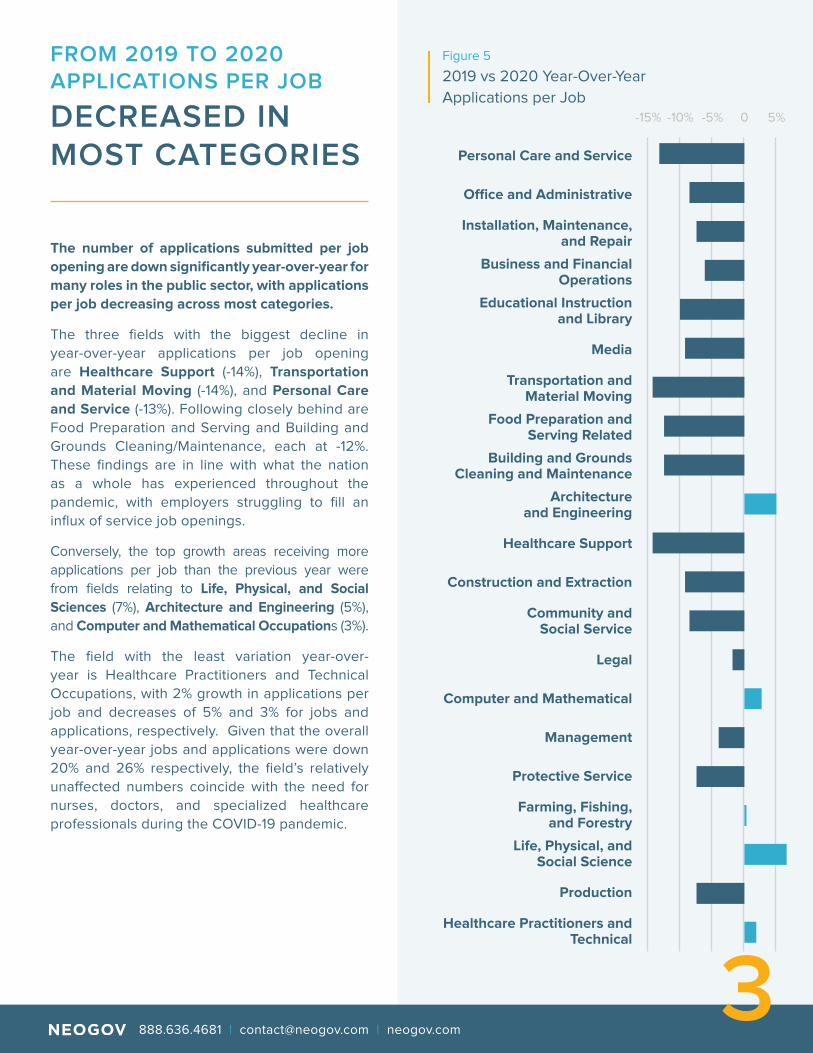
The number of applications submitted per job
opening are down significantly year-over-year for
many roles in the public sector, with applications
per job decreasing across most categories.
The three fields with the biggest decline in
year-over-year applications per job opening
are Healthcare Support (-14%), Transportation
and Material Moving (-14%), and Personal Care
and Service (-13%). Following closely behind are
Food Preparation and Serving and Building and
Grounds Cleaning/Maintenance, each at -12%.
These findings are in line with what the nation
as a whole has experienced throughout the
pandemic, with employers struggling to fill an
influx of service job openings.
Conversely, the top growth areas receiving more
applications per job than the previous year were
from fields relating to Life, Physical, and Social
Sciences (7%), Architecture and Engineering (5%),
and Computer and Mathematical Occupations (3%).
The field with the least variation year-over-
year is Healthcare Practitioners and Technical
Occupations, with 2% growth in applications per
job and decreases of 5% and 3% for jobs and
applications, respectively. Given that the overall
year-over-year jobs and applications were down
20% and 26% respectively, the field’s relatively
unaffected numbers coincide with the need for
nurses, doctors, and specialized healthcare
professionals during the COVID-19 pandemic.
0 5%-5%-10%-15%
Personal Care and Service
Office and Administrative
Installation, Maintenance, and Repair
Business and Financial Operations
Educational Instruction and Library
Media
Transportation and Material Moving
Food Preparation and Serving Related
Building and Grounds Cleaning and Maintenance
Architecture and Engineering
Healthcare Support
Construction and Extraction
Community and Social Service
Legal
Computer and Mathematical
Management
Protective Service
Farming, Fishing, and Forestry
Life, Physical, and Social Science
Production
Healthcare Practitioners and Technical
Figure 5
2019 vs 2020 Year-Over-Year
Applications per Job
3 888.636.4681 | [email protected] | neogov.com
THE BIGGEST MOTIVATORS
IN THE PUBLIC SECTOR
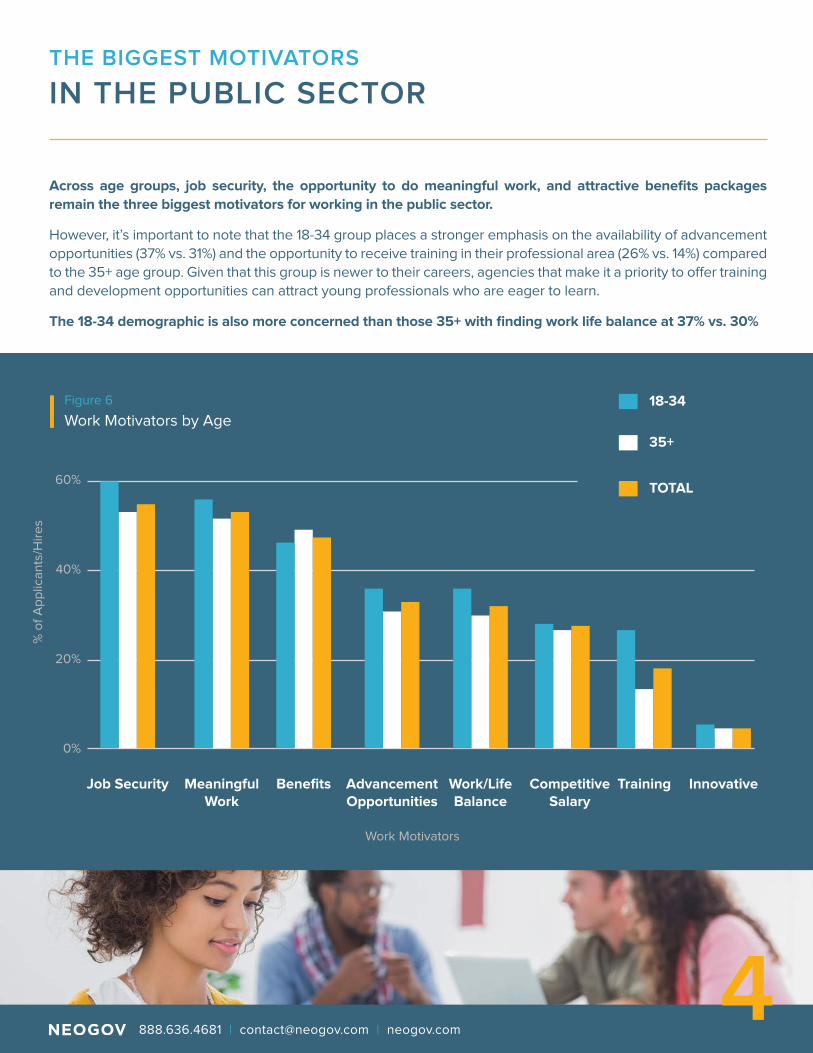
Across age groups, job security, the opportunity to do meaningful work, and attractive benefits packages
remain the three biggest motivators for working in the public sector.
However, it’s important to note that the 18-34 group places a stronger emphasis on the availability of advancement
opportunities (37% vs. 31%) and the opportunity to receive training in their professional area (26% vs. 14%) compared
to the 35+ age group. Given that this group is newer to their careers, agencies that make it a priority to offer training
and development opportunities can attract young professionals who are eager to learn.
The 18-34 demographic is also more concerned than those 35+ with finding work life balance at 37% vs. 30%
Figure 6
Work Motivators by Age
40%
60%
20%
0%
35+
TOTAL
18-34
Job Security Meaningful Work
Benefits Advancement Opportunities
Work/Life Balance
Competitive Salary
Training Innovative
% o
f A
pp
lica
nts
/Hir
es
Work Motivators
4 888.636.4681 | [email protected] | neogov.com
JOB SECURITY AND MEANINGFUL WORK
DRAW JOB SEEKERS TO THE PUBLIC SECTOR
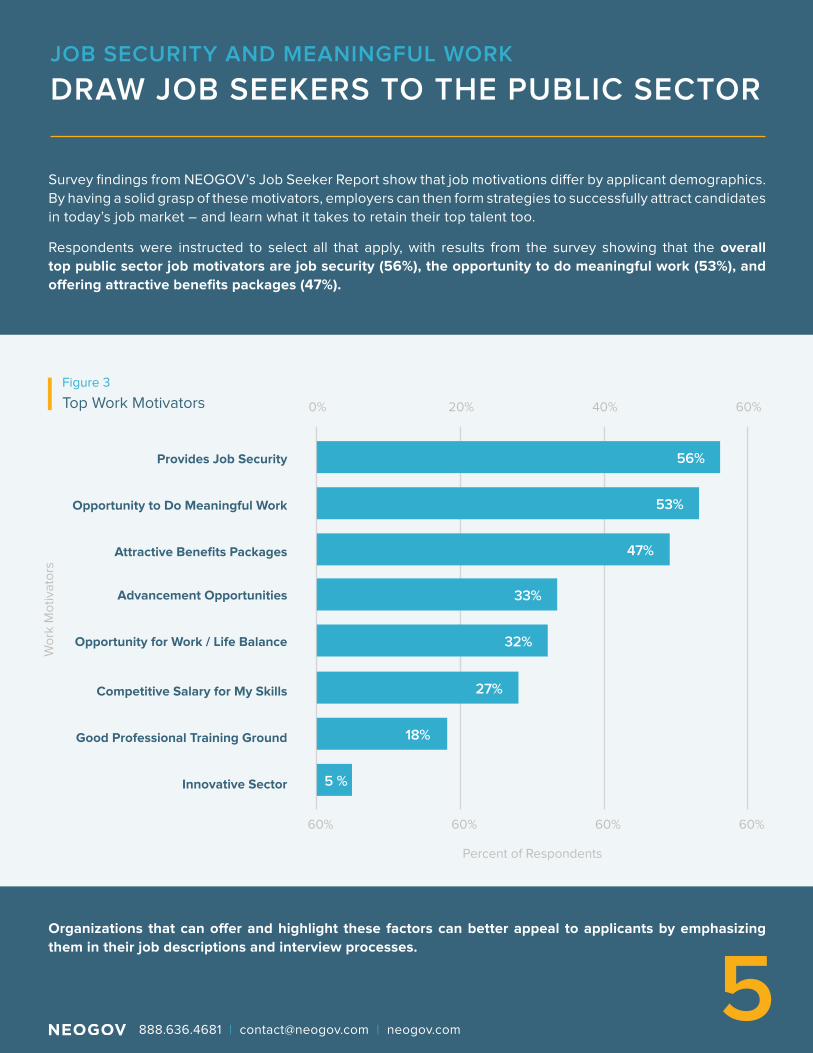
Survey findings from NEOGOV’s Job Seeker Report show that job motivations differ by applicant demographics.
By having a solid grasp of these motivators, employers can then form strategies to successfully attract candidates
in today’s job market – and learn what it takes to retain their top talent too.
Respondents were instructed to select all that apply, with results from the survey showing that the overall
top public sector job motivators are job security (56%), the opportunity to do meaningful work (53%), and
offering attractive benefits packages (47%).
Organizations that can offer and highlight these factors can better appeal to applicants by emphasizing
them in their job descriptions and interview processes.
Figure 3
Top Work Motivators
Wo
rk M
oti
vato
rs
Percent of Respondents
0%
60%
20%
60%
40%
60%
60%
60%
Provides Job Security 56%
Opportunity to Do Meaningful Work 53%
Attractive Benefits Packages 47%
Advancement Opportunities 33%
Opportunity for Work / Life Balance 32%
Competitive Salary for My Skills 27%
Good Professional Training Ground 18%
Innovative Sector 5 %
5 888.636.4681 | [email protected] | neogov.com
WORK-LIFE BALANCE IS ESPECIALLY APPEALING FOR
HIGHLY SPECIALIZED ROLES
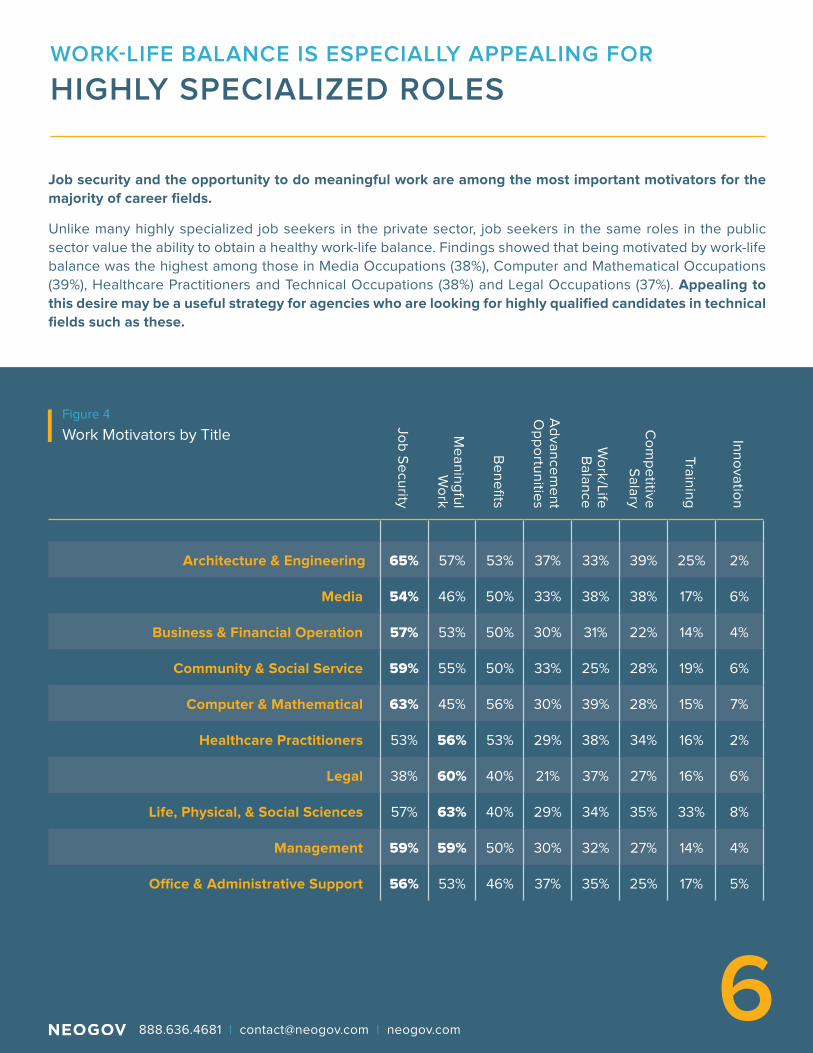
Job security and the opportunity to do meaningful work are among the most important motivators for the
majority of career fields.
Unlike many highly specialized job seekers in the private sector, job seekers in the same roles in the public
sector value the ability to obtain a healthy work-life balance. Findings showed that being motivated by work-life
balance was the highest among those in Media Occupations (38%), Computer and Mathematical Occupations
(39%), Healthcare Practitioners and Technical Occupations (38%) and Legal Occupations (37%). Appealing to
this desire may be a useful strategy for agencies who are looking for highly qualified candidates in technical
fields such as these.
Figure 4
Work Motivators by Title
Job
Se
cu
rity
Me
an
ing
ful
Wo
rk
Be
ne
fits
Ad
van
ce
me
nt
Op
po
rtun
ities
Wo
rk/L
ife
Ba
lan
ce
Co
mp
etitive
S
ala
ry
Train
ing
Inn
ova
tion
Architecture & Engineering 65% 57% 53% 37% 33% 39% 25% 2%
Media 54% 46% 50% 33% 38% 38% 17% 6%
Business & Financial Operation 57% 53% 50% 30% 31% 22% 14% 4%
Community & Social Service 59% 55% 50% 33% 25% 28% 19% 6%
Computer & Mathematical 63% 45% 56% 30% 39% 28% 15% 7%
Healthcare Practitioners 53% 56% 53% 29% 38% 34% 16% 2%
Legal 38% 60% 40% 21% 37% 27% 16% 6%
Life, Physical, & Social Sciences 57% 63% 40% 29% 34% 35% 33% 8%
Management 59% 59% 50% 30% 32% 27% 14% 4%
Office & Administrative Support 56% 53% 46% 37% 35% 25% 17% 5%
6 888.636.4681 | [email protected] | neogov.com
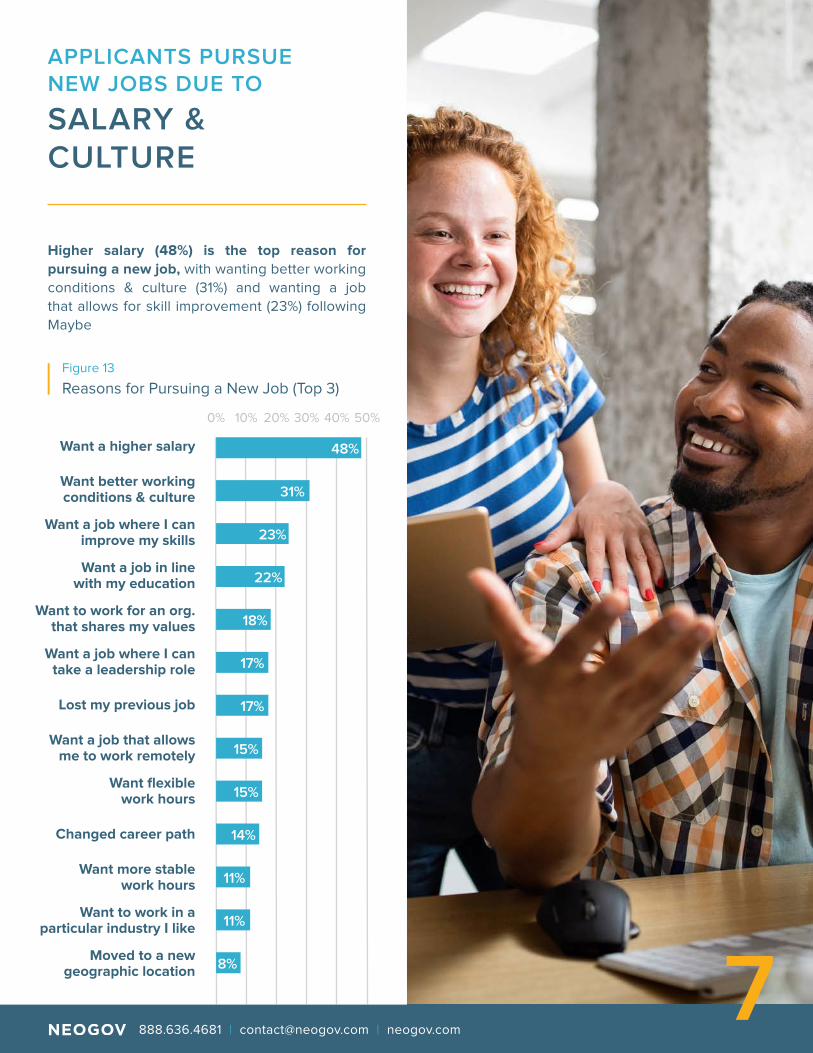
APPLICANTS PURSUE NEW JOBS DUE TO
SALARY & CULTURE
Higher salary (48%) is the top reason for
pursuing a new job, with wanting better working
conditions & culture (31%) and wanting a job
that allows for skill improvement (23%) following
Maybe
30% 50%40%20%10%0%
Want a higher salary
Want better working conditions & culture
Want a job where I can improve my skills
Want a job in line with my education
Want to work for an org. that shares my values
Want a job where I can take a leadership role
Lost my previous job
Want a job that allows me to work remotely
Want flexible work hours
Changed career path
Want more stable work hours
Want to work in a particular industry I like
Moved to a new geographic location
Figure 13
Reasons for Pursuing a New Job (Top 3)
8%
11%
11%
14%
15%
15%
17%
17%
18%
22%
23%
31%
48%
7 888.636.4681 | [email protected] | neogov.com
30% 50%40%20%10%0%
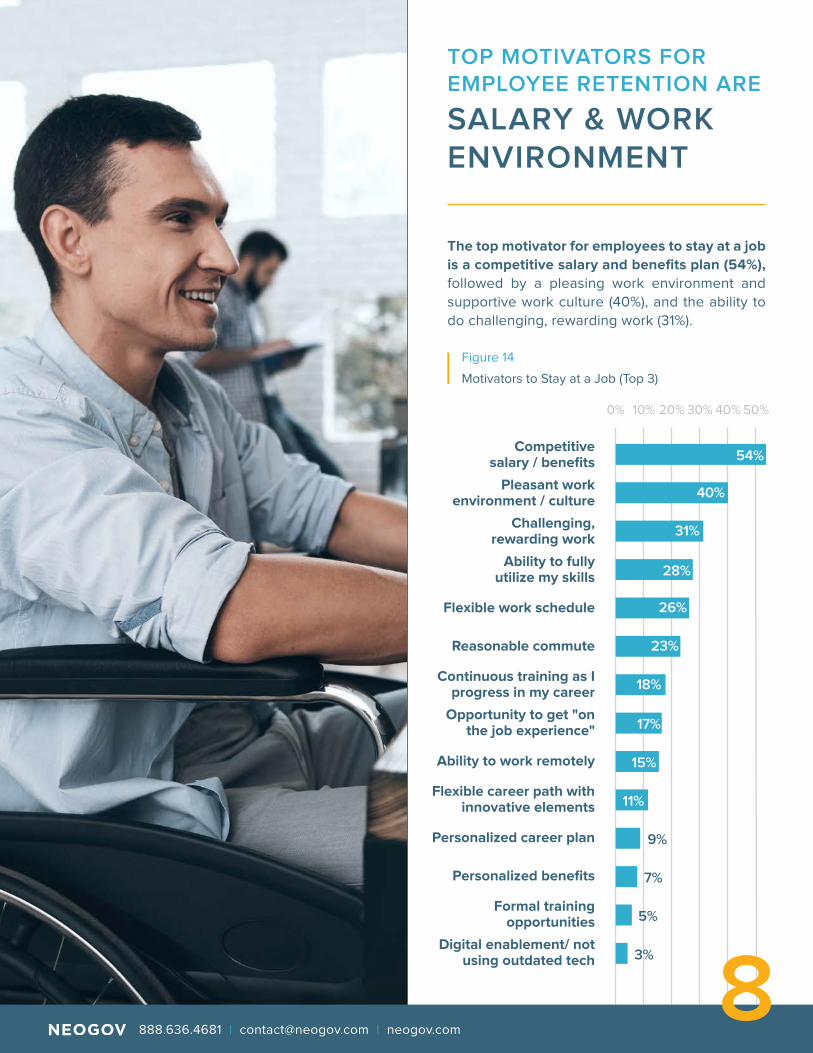
TOP MOTIVATORS FOR EMPLOYEE RETENTION ARE
SALARY & WORK ENVIRONMENT
The top motivator for employees to stay at a job
is a competitive salary and benefits plan (54%),
followed by a pleasing work environment and
supportive work culture (40%), and the ability to
do challenging, rewarding work (31%).
Competitive salary / benefits
Pleasant work environment / culture
Challenging, rewarding work
Ability to fully utilize my skills
Flexible work schedule
Reasonable commute
Continuous training as I progress in my career
Opportunity to get "on the job experience"
Ability to work remotely
Flexible career path with innovative elements
Personalized career plan
Personalized benefits
Formal training opportunities
Digital enablement/ not using outdated tech
Figure 14
Motivators to Stay at a Job (Top 3)
54%
40%
31%
28%
26%
23%
18%
17%
3%
5%
7%
9%
11%
15%
8 888.636.4681 | [email protected] | neogov.com
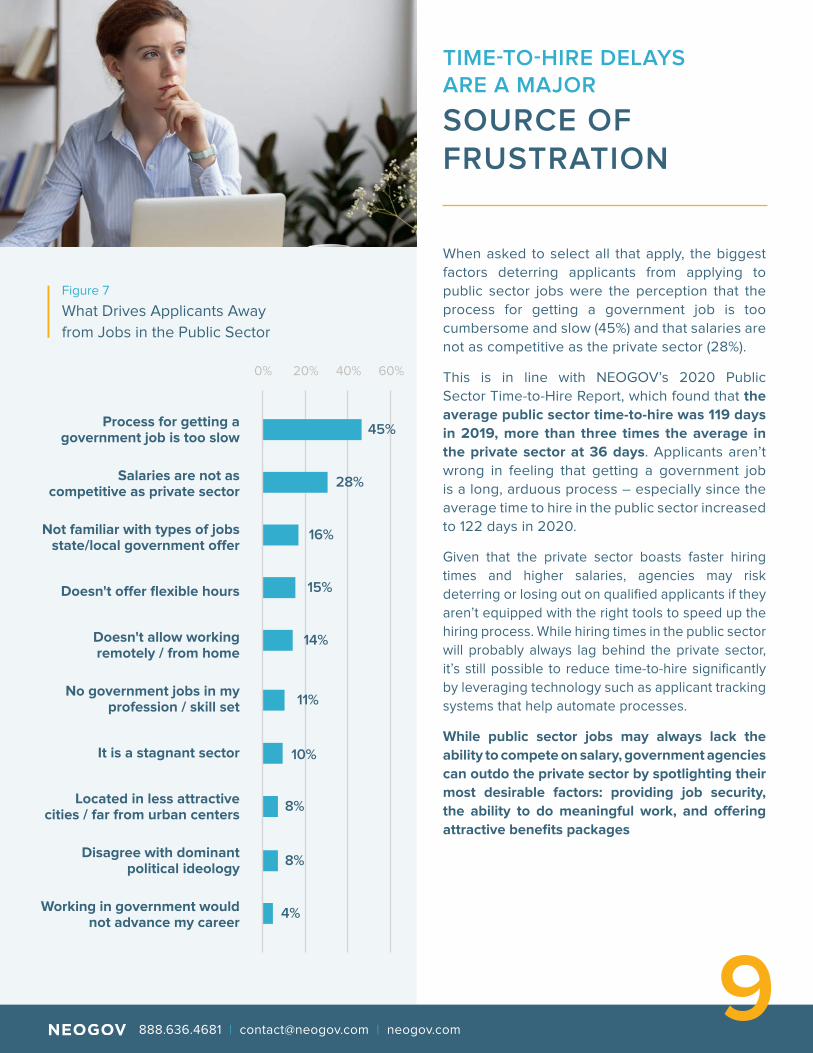
TIME-TO-HIRE DELAYS ARE A MAJOR
SOURCE OF FRUSTRATION
When asked to select all that apply, the biggest
factors deterring applicants from applying to
public sector jobs were the perception that the
process for getting a government job is too
cumbersome and slow (45%) and that salaries are
not as competitive as the private sector (28%).
This is in line with NEOGOV’s 2020 Public
Sector Time-to-Hire Report, which found that the
average public sector time-to-hire was 119 days
in 2019, more than three times the average in
the private sector at 36 days. Applicants aren’t
wrong in feeling that getting a government job
is a long, arduous process – especially since the
average time to hire in the public sector increased
to 122 days in 2020.
Given that the private sector boasts faster hiring
times and higher salaries, agencies may risk
deterring or losing out on qualified applicants if they
aren’t equipped with the right tools to speed up the
hiring process. While hiring times in the public sector
will probably always lag behind the private sector,
it’s still possible to reduce time-to-hire significantly
by leveraging technology such as applicant tracking
systems that help automate processes.
While public sector jobs may always lack the
ability to compete on salary, government agencies
can outdo the private sector by spotlighting their
most desirable factors: providing job security,
the ability to do meaningful work, and offering
attractive benefits packages
Figure 7
What Drives Applicants Away
from Jobs in the Public Sector
Process for getting a government job is too slow
Salaries are not as competitive as private sector
Not familiar with types of jobs state/local government offer
Doesn't offer flexible hours
Doesn't allow working remotely / from home
No government jobs in my profession / skill set
It is a stagnant sector
Located in less attractive cities / far from urban centers
Disagree with dominant political ideology
Working in government would not advance my career
60%40%20%0%
45%
28%
16%
15%
14%
11%
10%
8%
8%
4%
9 888.636.4681 | [email protected] | neogov.com
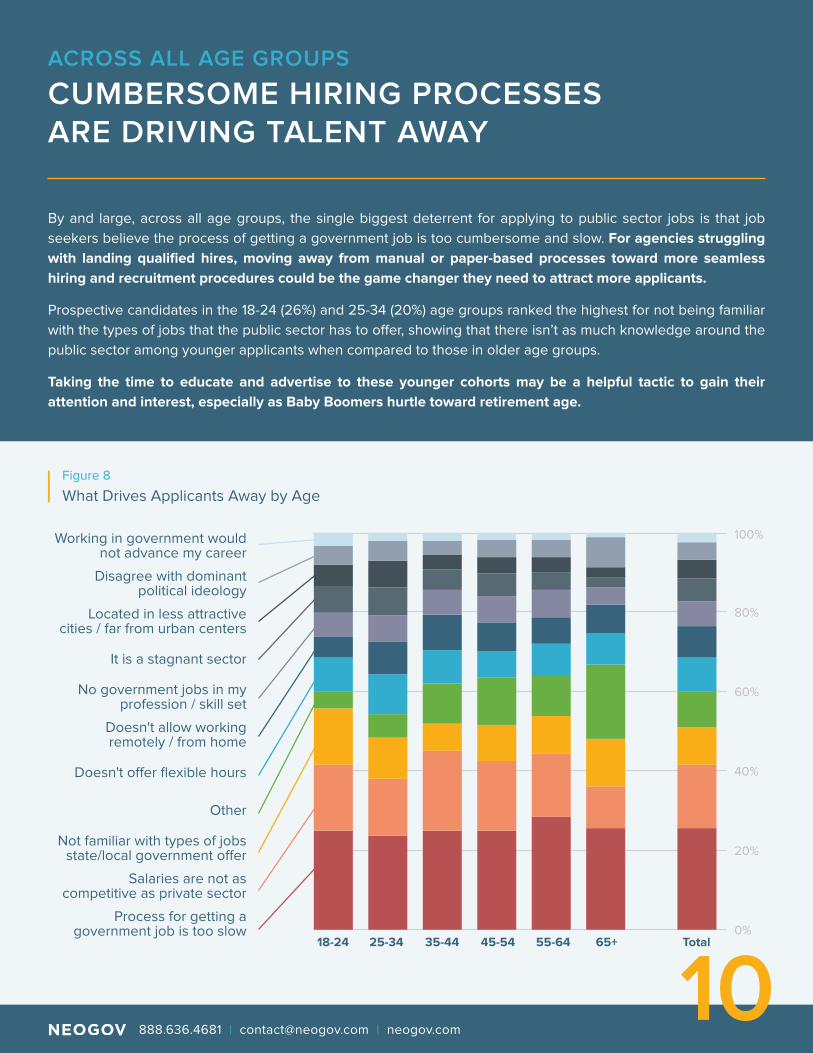
ACROSS ALL AGE GROUPS
CUMBERSOME HIRING PROCESSES ARE DRIVING TALENT AWAY
By and large, across all age groups, the single biggest deterrent for applying to public sector jobs is that job
seekers believe the process of getting a government job is too cumbersome and slow. For agencies struggling
with landing qualified hires, moving away from manual or paper-based processes toward more seamless
hiring and recruitment procedures could be the game changer they need to attract more applicants.
Prospective candidates in the 18-24 (26%) and 25-34 (20%) age groups ranked the highest for not being familiar
with the types of jobs that the public sector has to offer, showing that there isn’t as much knowledge around the
public sector among younger applicants when compared to those in older age groups.
Taking the time to educate and advertise to these younger cohorts may be a helpful tactic to gain their
attention and interest, especially as Baby Boomers hurtle toward retirement age.
Figure 8
What Drives Applicants Away by Age
Working in government would not advance my career
Disagree with dominant political ideology
Located in less attractive cities / far from urban centers
It is a stagnant sector
No government jobs in my profession / skill set
Doesn't allow working remotely / from home
Doesn't offer flexible hours
Other
Not familiar with types of jobs state/local government offer
Salaries are not as competitive as private sector
Process for getting a government job is too slow
40%
60%
20%
80%
0%
100%
18-24 25-34 35-44 45-54 55-64 65+ Total
10 888.636.4681 | [email protected] | neogov.com
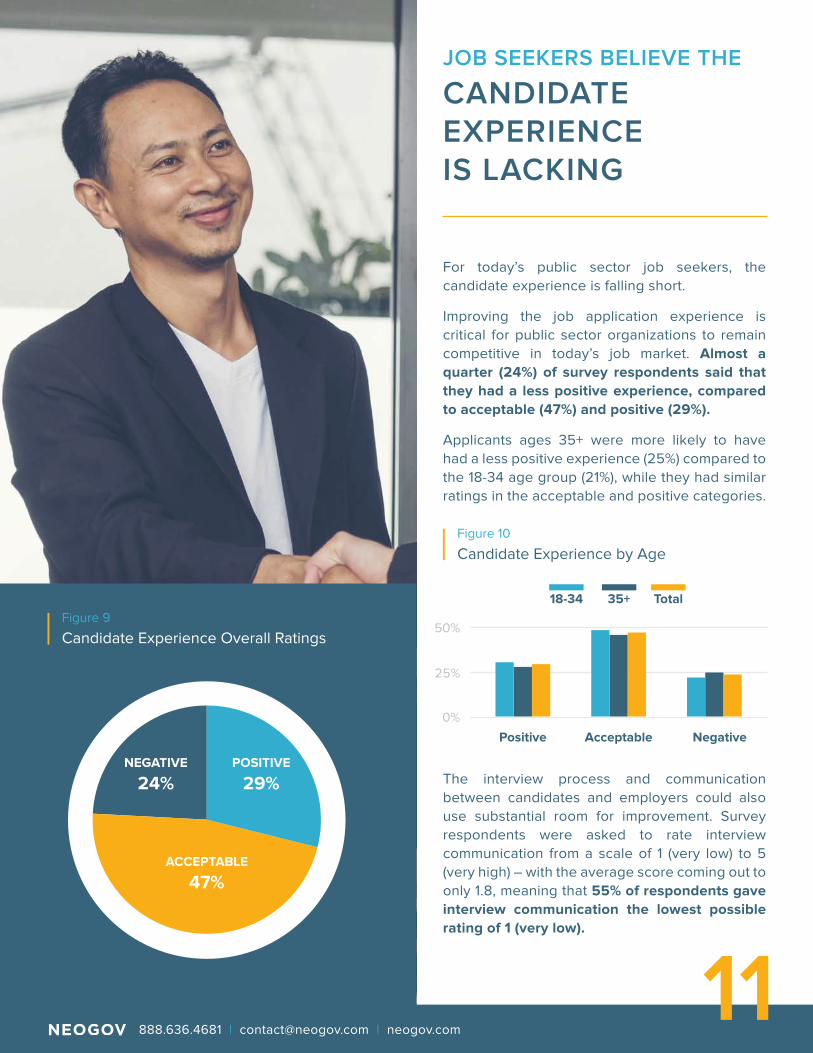
JOB SEEKERS BELIEVE THE
CANDIDATE EXPERIENCE IS LACKING
For today’s public sector job seekers, the
candidate experience is falling short.
Improving the job application experience is
critical for public sector organizations to remain
competitive in today’s job market. Almost a
quarter (24%) of survey respondents said that
they had a less positive experience, compared
to acceptable (47%) and positive (29%).
Applicants ages 35+ were more likely to have
had a less positive experience (25%) compared to
the 18-34 age group (21%), while they had similar
ratings in the acceptable and positive categories.
The interview process and communication
between candidates and employers could also
use substantial room for improvement. Survey
respondents were asked to rate interview
communication from a scale of 1 (very low) to 5
(very high) – with the average score coming out to
only 1.8, meaning that 55% of respondents gave
interview communication the lowest possible
rating of 1 (very low).
Figure 9
Candidate Experience Overall Ratings
Figure 10
Candidate Experience by Age
18-34
Positive Acceptable Negative
35+ Total
0%
25%
50%
POSITIVE
29%NEGATIVE
24%
ACCEPTABLE
47%
11 888.636.4681 | [email protected] | neogov.com
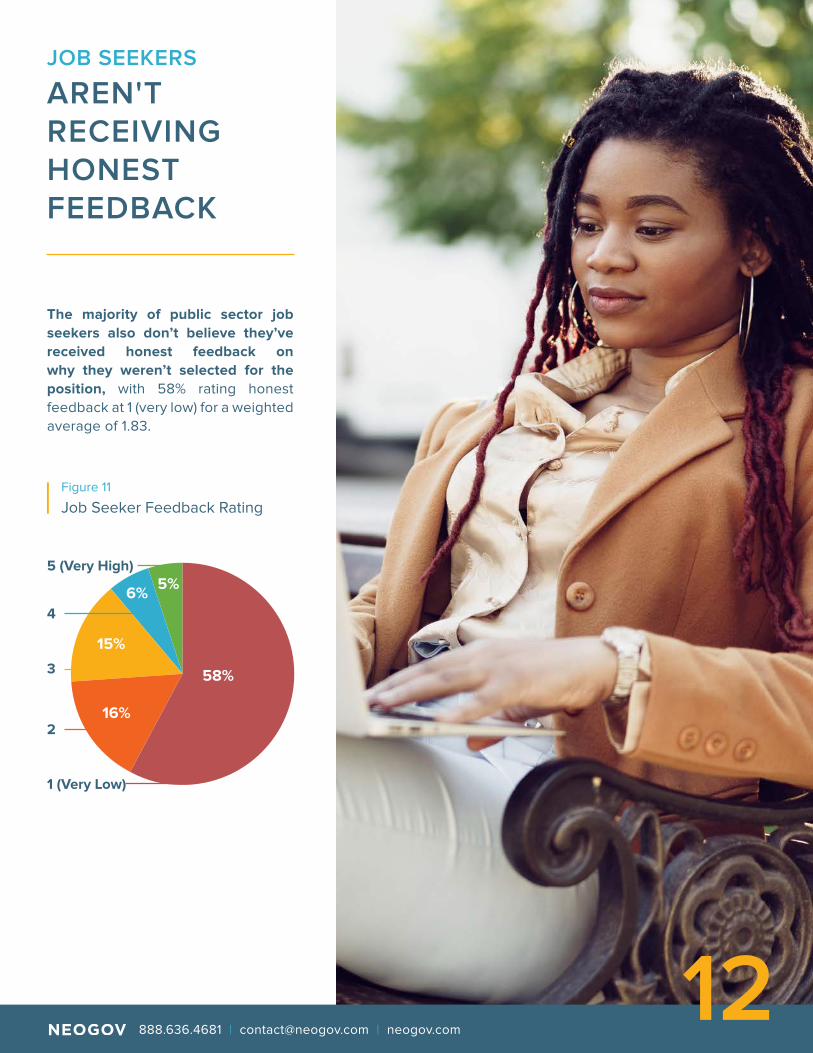
JOB SEEKERS
AREN'T RECEIVING HONEST FEEDBACK
The majority of public sector job
seekers also don’t believe they’ve
received honest feedback on
why they weren’t selected for the
position, with 58% rating honest
feedback at 1 (very low) for a weighted
average of 1.83.
Figure 11
Job Seeker Feedback Rating
1 (Very Low)
58%
5%6%
15%
16%
5 (Very High)
4
3
2
12 888.636.4681 | [email protected] | neogov.com
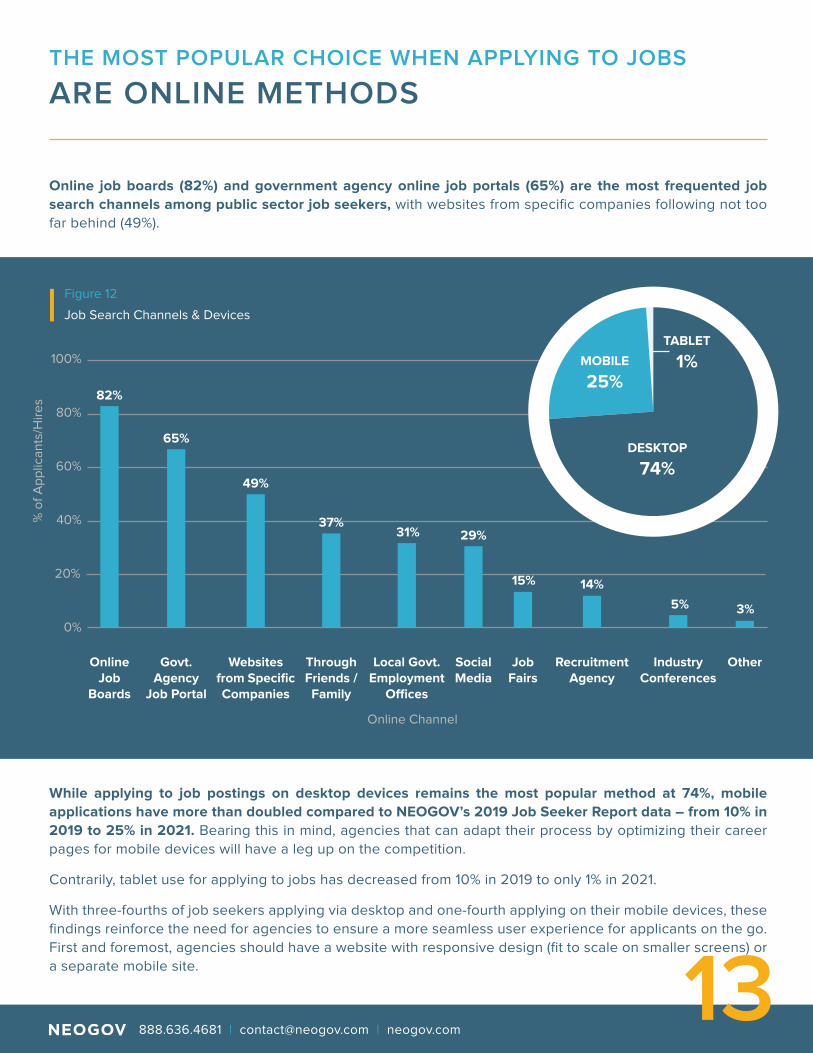
THE MOST POPULAR CHOICE WHEN APPLYING TO JOBS
ARE ONLINE METHODS
Online job boards (82%) and government agency online job portals (65%) are the most frequented job
search channels among public sector job seekers, with websites from specific companies following not too
far behind (49%).
While applying to job postings on desktop devices remains the most popular method at 74%, mobile
applications have more than doubled compared to NEOGOV’s 2019 Job Seeker Report data – from 10% in
2019 to 25% in 2021. Bearing this in mind, agencies that can adapt their process by optimizing their career
pages for mobile devices will have a leg up on the competition.
Contrarily, tablet use for applying to jobs has decreased from 10% in 2019 to only 1% in 2021.
With three-fourths of job seekers applying via desktop and one-fourth applying on their mobile devices, these
findings reinforce the need for agencies to ensure a more seamless user experience for applicants on the go.
First and foremost, agencies should have a website with responsive design (fit to scale on smaller screens) or
a separate mobile site.
Figure 12
Job Search Channels & Devices
40%
60%
80%
100%
20%
0%
Online Job
Boards
82%
65%
49%
37%31% 29%
15% 14%
5% 3%
Govt. Agency
Job Portal
Websites from Specific Companies
Through Friends / Family
Local Govt. Employment
Offices
Social Media
Job Fairs
Industry Conferences
OtherRecruitment Agency
% o
f A
pp
lica
nts
/Hir
es
Online Channel
TABLET
1%MOBILE
25%
DESKTOP
74%
13 888.636.4681 | [email protected] | neogov.com
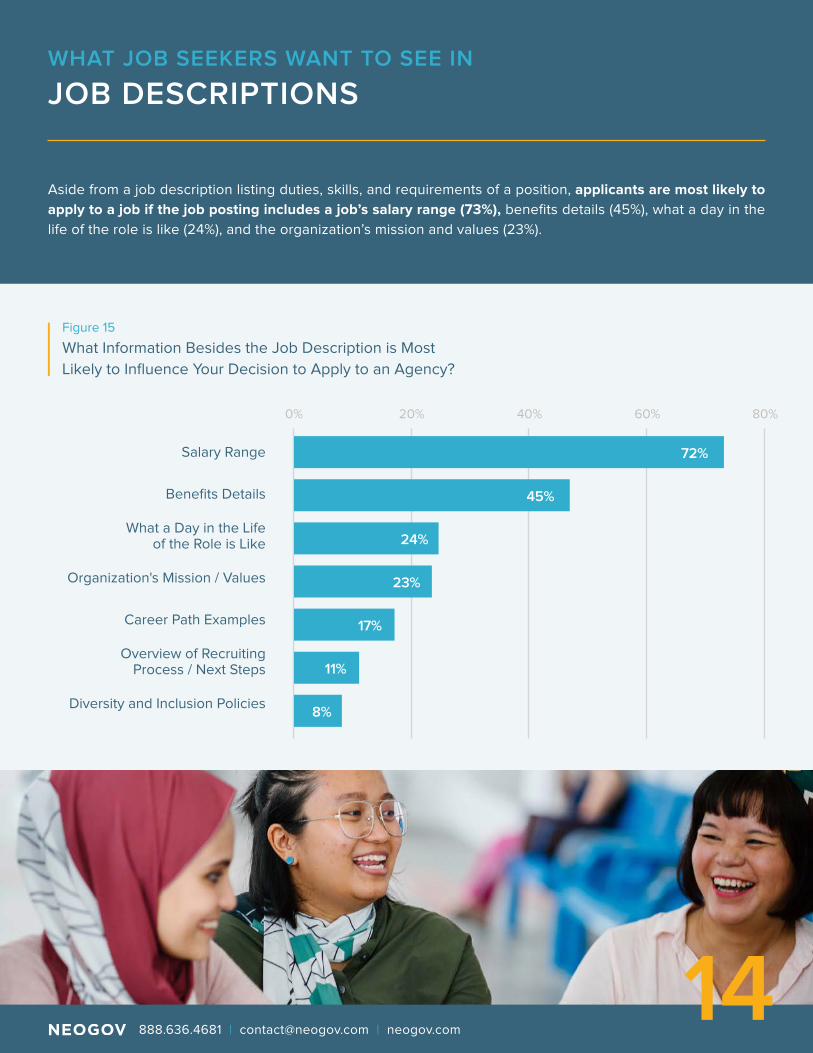
WHAT JOB SEEKERS WANT TO SEE IN
JOB DESCRIPTIONS
Aside from a job description listing duties, skills, and requirements of a position, applicants are most likely to
apply to a job if the job posting includes a job’s salary range (73%), benefits details (45%), what a day in the
life of the role is like (24%), and the organization’s mission and values (23%).
Figure 15
What Information Besides the Job Description is Most
Likely to Influence Your Decision to Apply to an Agency?
Salary Range
Benefits Details
What a Day in the Life of the Role is Like
Organization's Mission / Values
Career Path Examples
Overview of Recruiting Process / Next Steps
Diversity and Inclusion Policies
0% 20% 40% 60% 80%
45%
17%
11%
8%
24%
23%
72%
14 888.636.4681 | [email protected] | neogov.com
HOW CAN EMPLOYERS IMPROVE THE CANDIDATE EXPERIENCE?
When asked an open-ended question about how employers could
improve the job application process, survey respondents overwhelmingly
voiced their concerns regarding honest feedback, salary details, fairness,
communication, and the overall candidate experience. Below are several
anonymous responses to get a glimpse into the frustrations that many
public sector applicants often experience.
Provide Honest Feedback
“Give honest, detailed feedback about why I wasn't selected, rather than
‘others more closely matched the job specifications.’ Tell me HOW, and how
my skills didn't fit the job.”
“Be honest and open about what they are REALLY looking for – my
experience, education, and expertise checks all the boxes for my resume…
but what is truly needed and wanted up front in the job description and
recruitment posting?”
“Tell me why I didn't get the job and why. Don't wait six months to send me
a rejection letter. Be clearer about requirements.”
List Salary Details
“Provide basic information like the salary, how many openings there are, if they
received an application, and why candidates aren’t chosen for an interview.
It seems that oftentimes an internal candidate is chosen, which makes it feel
like there’s no chance of an outsider getting picked – it’s like I filled out the
application for nothing.”
“Be open and honest about the pay rate. Nothing turns me off more as a job
seeker than a posting that doesn't tell me how much I am going to get paid.
How am I to know if it is worth my time to move positions without knowing if
my pay rate is going to be comparable?”
“Salary range is a big one, along with making the application process less
troublesome. I already submitted my resume, why do I need to fill out my
whole work experience again? Being required to input the phone number and
address of previous employers is also a pain.“
15 888.636.4681 | [email protected] | neogov.com
Level the playing field for entry level, non-traditional, and diverse candidates
“Do not list jobs needing high levels of experience as
‘entry level’ jobs.”
“Relax some of the educational standards. You may
have the experience, but because you don't have
every qualification they are asking for does not mean
you are not capable of learning and excelling at the
job. Hiring teams overlook people like that.”
“Open up the aperture of the applicant pool to attract
more diversified and non-traditional applicants.”
Improve communication processes
“Make it easier to apply and make the process faster.
Waiting months to hear anything is disheartening, and
so is not knowing why you weren't chosen.”
“COMMUNICATION! Communicate expectations,
processes, updates, outcomes, and provide feedback.”
“Stronger, more efficient communication. The
application status for several jobs I applied for in
2020 is still listed as ‘Currently in Review.’ I hesitate to
believe that this is true.”
Streamline the application process and overall candidate experience
“Provide clear details about hiring priorities and
timelines (and stick to them).”
“A better website would be nice. It sometimes is very
cumbersome to apply.”
“Make the job description readable. Sometimes it's a
bunch of words crammed into one paragraph.”
“Including more descriptions about the work
environment, the feel of the office, and the flow of
the day to get a glimpse of in the job description. Too
often all we know are the tasks and expectations are,
versus what the job actually ‘looks and feels’ like.”
“Have information regarding the position from
personnel who actually perform the job duties. HR does
not always understand the job duties and functions
especially for specialists and technical positions.”
16 888.636.4681 | [email protected] | neogov.com
LOOKING AHEAD TO
THE FUTURE OF WORK TRENDS
The Need for Flexibility
The COVID-19 pandemic
has accelerated the already
growing remote work trend,
forcing many organizations to
move a large portion of their
workforce to remote work.
As a result of working from
home during the pandemic,
many employees now want to
work remotely permanently,
or at least have the flexibility
to work from home on a
regular basis.
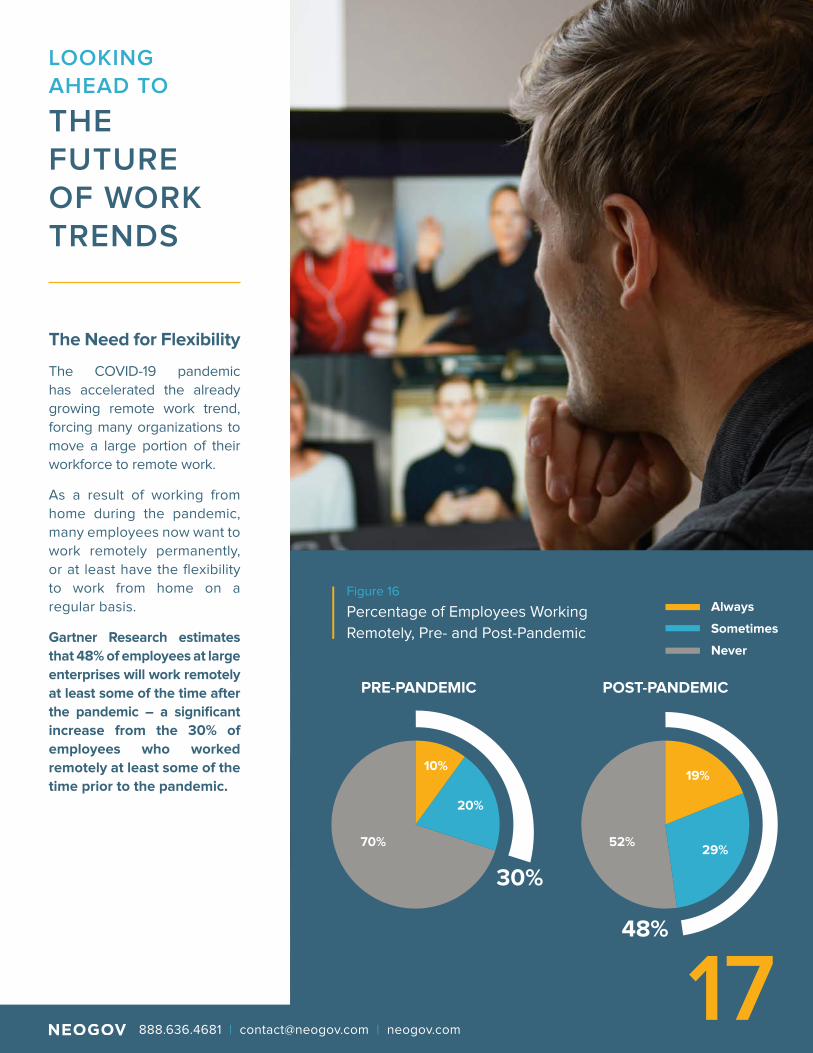
Gartner Research estimates
that 48% of employees at large
enterprises will work remotely
at least some of the time after
the pandemic – a significant
increase from the 30% of
employees who worked
remotely at least some of the
time prior to the pandemic.
Figure 16
Percentage of Employees Working
Remotely, Pre- and Post-Pandemic
PRE-PANDEMIC
70% 52%
10%19%
20%
29%
POST-PANDEMIC
Always
Sometimes
Never
30%
48%
17 888.636.4681 | [email protected] | neogov.com
A Strong Desire for Learning and Development
Wanting a job that allows for skill improvement is
the third biggest motivator for candidates pursuing
a new job (23%) – with younger applicants (ages
18-34) placing an especially strong emphasis on
the availability of advancement opportunities (37%
vs. 31%) and the opportunity to receive training in
their professional area (26% vs. 14%) compared to
the 35+ age group.
As candidates demonstrate a strong appetite for
learning and development, companies across
the globe have begun implementing practices
to align with these trends. For instance, over
half (58%) of respondents from a recent global
survey from McKinsey & Company said that
closing skill gaps has become a greater priority
since the pandemic began, and 69% said their
companies engage in more skill building than
they did before the crisis.
Of their findings, the most in-demand skills are
leadership and managing others, critical thinking
and decision making, and project management
– which points toward a more employee-centric
model as the world heads into the post-pandemic
future of work.
Agencies that make it a point to invest in the learning
and development of their employees will not only
reap the benefits of a more skilled workforce,
but they can also boost morale by nurturing an
employee-first culture.
Employee Engagement and Workplace Culture
Employee engagement matters more than
ever, and high-engagement organizations have
been shown to achieve their strategic goals,
enjoy higher levels of productivity, deliver
more responsive customer service, and have
lower turnover. According to Gallup, high-
engagement organizations have a 43% lower
turnover rate compared to low-engagement
organizations.
Since many public sector workers are initially
attracted to public sector work because they
believe in an organization’s mission, it comes as
no surprise that engaged employees working at
government agencies are three times more likely
than disengaged employees to believe their
organization is achieving its mission. Agencies
should spend time crafting an employer brand
that speaks to these goals and paints the
organization’s culture in a good light.
Along with employee engagement and culture
is the topic of diversity, equity, and inclusion
(DEI). Since the pandemic has without a
doubt magnified social justice issues and the
importance of paving a better path forward,
the way organizations react and commit to DEI
initiatives will likely continue to play a key role
in how employees view the workplace and their
likelihood of staying there.
18 888.636.4681 | [email protected] | neogov.com
Retaining Employees and Minimizing Turnover Rates
Compared to the private sector, the public
sector often takes a considerable amount of
time to select new employees. That being said,
historically government agencies may have
failed to overlook the importance of investing
in employee onboarding and retention because
there was less turnover. However, in today’s job
market when swaths of government employees
are planning to exit their current place of
employment, it’s time for agencies to invest in
workforce retention strategies.
Replacing a government employee can cost
up to 150% of the employee’s annual salary
– making it increasingly important to meet
employees in the middle by accommodating
their workplace preferences.
Agencies can collect turnover data, employee
surveys, and conduct exit interviews to gain a
better understanding of why employees leave
their organization. By doing so, organizations
can look for patterns to see if there are specific
reasons employees decide to leave.
This can help answer questions such as:
• Are employees with specific job titles or from
specific departments leaving at high rates?
• Are turnover rates higher for employees of
underrepresented groups, signaling a need
for improved DEI commitments?
• Is senior management making up a large
portion of employee exits?
• Is the organization having difficulty
onboarding and retaining new hires?
• Are top performers leaving the organization
after securing work elsewhere, and if so,
which reasons are motivating them to leave?
Ultimately, after all that has changed in the last
year, there's no doubt that today’s employees
and job seekers are reimagining the world of
work – it’s now up to employers to step up to the
challenge if they want to remain in the game.
19 888.636.4681 | [email protected] | neogov.com
METHODOLOGY & REFERENCES
NEOGOV’s 2021 Job Seeker Report included 3,962 responses from the
GovernmentJobs.com job applicant database. The 10-minute online survey was
completed by 3,956 respondents from June 15, 2021 to August 7, 2021.
1 U.S. Bureau of Labor Statistics. (2021, June). Unemployment rises in 2020, as
the country battles the COVID-19 pandemic. Retrieved from https://www.bls.
gov/opub/mlr/2021/article/unemployment-rises-in-2020-as-the-country-battles-
the-covid-19-pandemic.htm
2 NEOGOV Job Seeker Report Survey. June 15, 2021 to August 7, 2021.
3 NEOGOV (2020, August, 19). The Public Sector’s Average Time-to-Hire is
Three Times as Long as the Private Sector. Retrieved from https://blog.neogov.
com/press/neogov-releases-time-to-hire-report-2020
4 Gartner Research, Human Resources Research Team. (2020, May 14). 9
Predictions for the Post-COVID Future of Work.
5 McKinsey and Company. (2021, July 30). Three keys to building a more skilled
post pandemic workforce Retrieved from https://www.mckinsey.com/business-
functions/organization/our-insights/three-keys-to-building-a-more-skilled-
postpandemic-workforce
6 Lavigna, B. (2021, July 22). Replacing a Government Employee Can Cost 150%
of Worker's Salary. Retrieved from https://www.route-fifty.com/finance/2021/07/
replacing-government-employee-can-cost-150-workers-salary/183989/
20 888.636.4681 | [email protected] | neogov.com

NEOGOV provides a high quality and easy-to-use talent management
system to service the public sector market. Serving over 6,000
organizations, the company’s suite of solutions supports the entire
employee lifecycle, automating recruitment, onboarding, training,
and performance management. NEOGOV helps customers save time
and money, reduce paper processes, improve regulatory requirement
compliance, increase employee productivity and engagement, and
provide better services to citizens. More information at www.neogov.com.
6,000+ Public Sector Agencies
250,000+
People Use NEOGOV
20
Years of Experience
888.636.4681 | [email protected] | neogov.com


