94
BACKGROUND PAPER FOR THE WORLD DEVELOPMENT REPORT 2013 Ukraine Case Study: Jobs and Demographic Change Olga Kupets Volodymyr Vakhitov Svitlana Babenko
| Date post: | 07-Aug-2015 |
| Category: |
Government & Nonprofit |
| Upload: | - |
| View: | 24 times |
| Download: | 0 times |
BACKGROUND PAPER FOR THE
WORLD DEVELOPMENT REPORT 2013
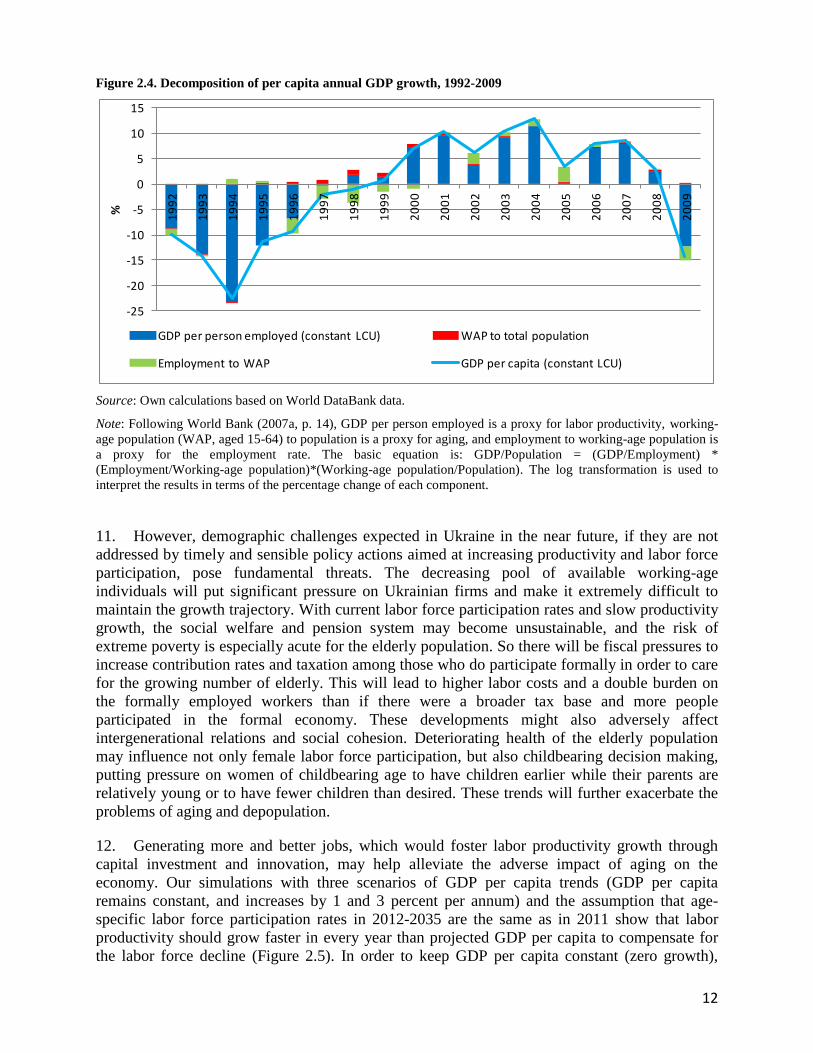
Ukraine Case Study: Jobs and Demographic Change
Olga Kupets
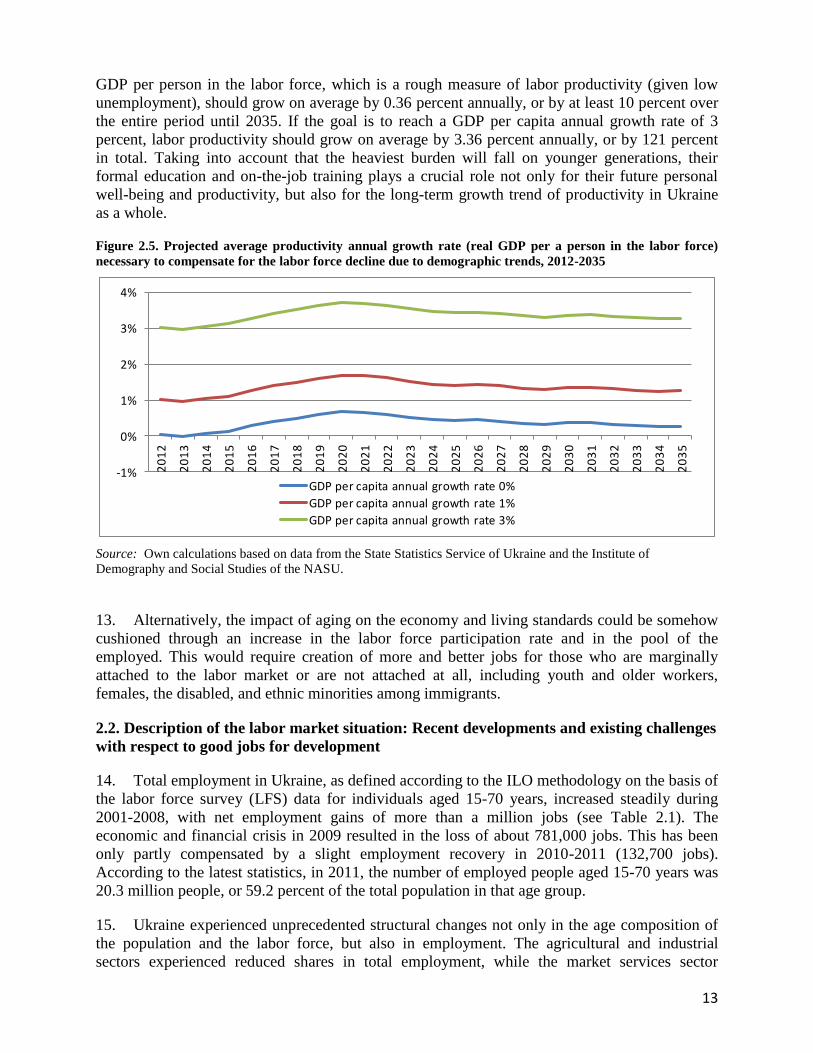
Volodymyr Vakhitov
Svitlana Babenko

The findings, interpretations, and conclusions expressed in this paper are entirely those of the
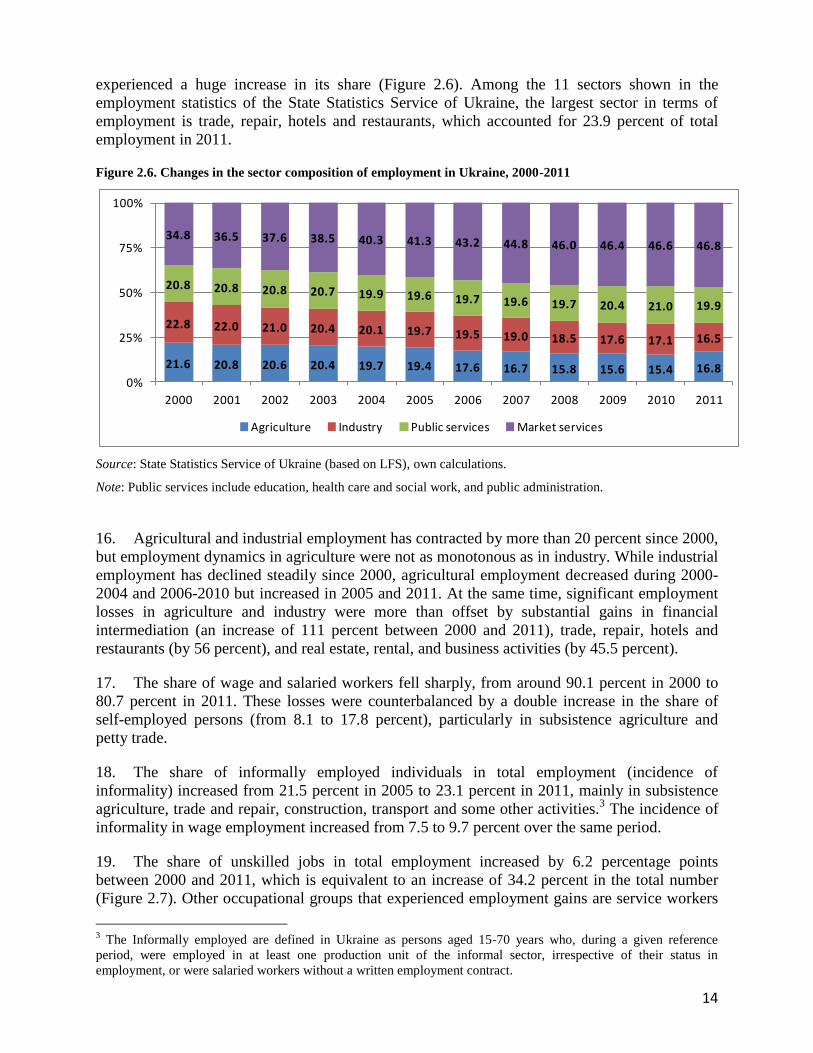
authors. They do not necessarily represent the views of the World Development Report 2013
team, the World Bank and its affiliated organizations, or those of the Executive Directors of the
World Bank or the governments they represent.
1
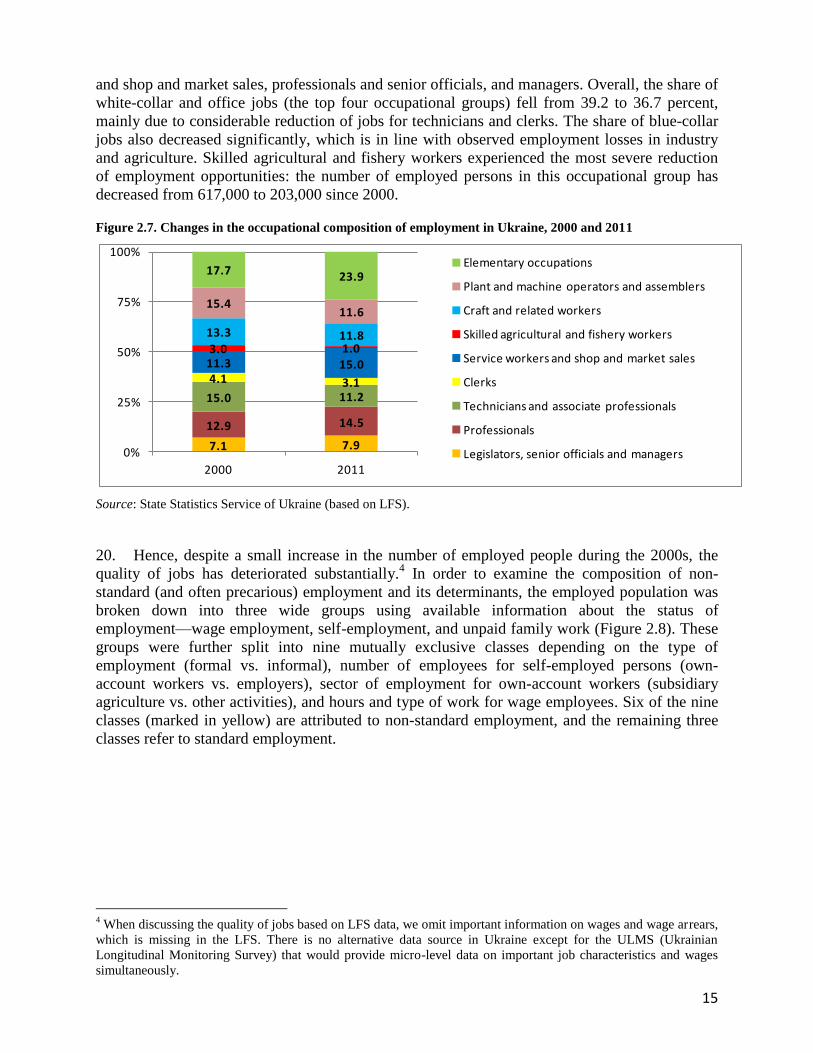
Contents
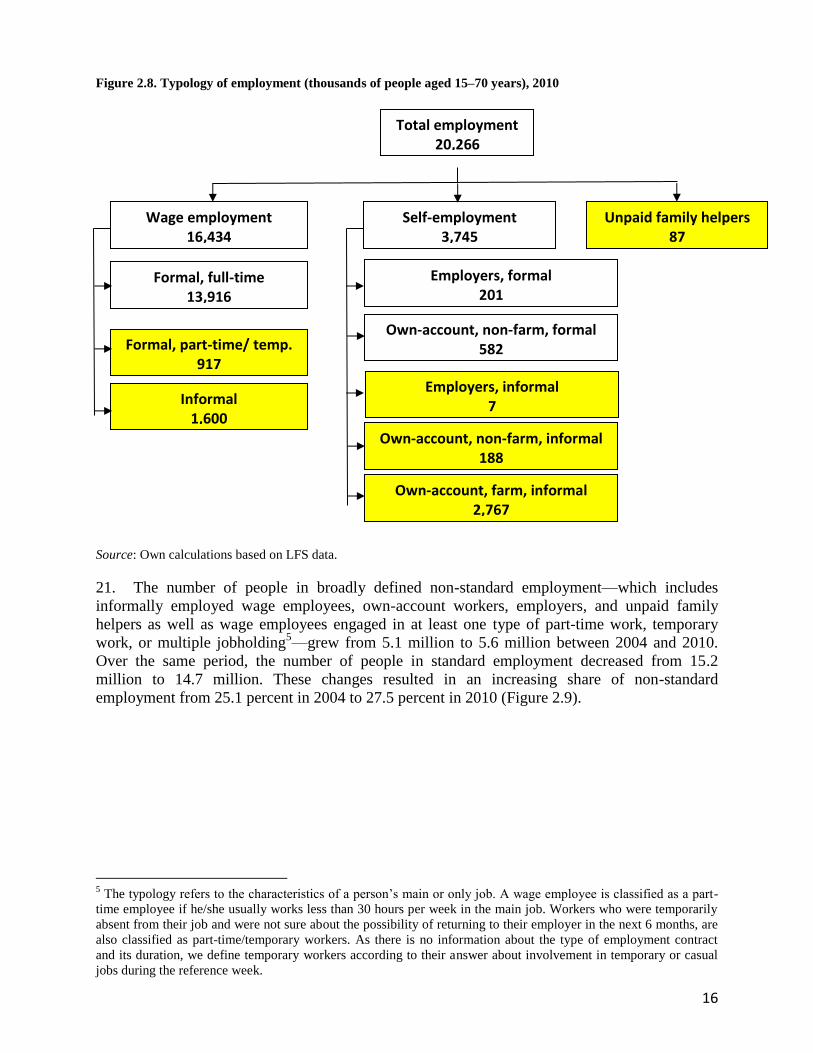
EXECUTIVE SUMMARY ...................................................................................................................... 2
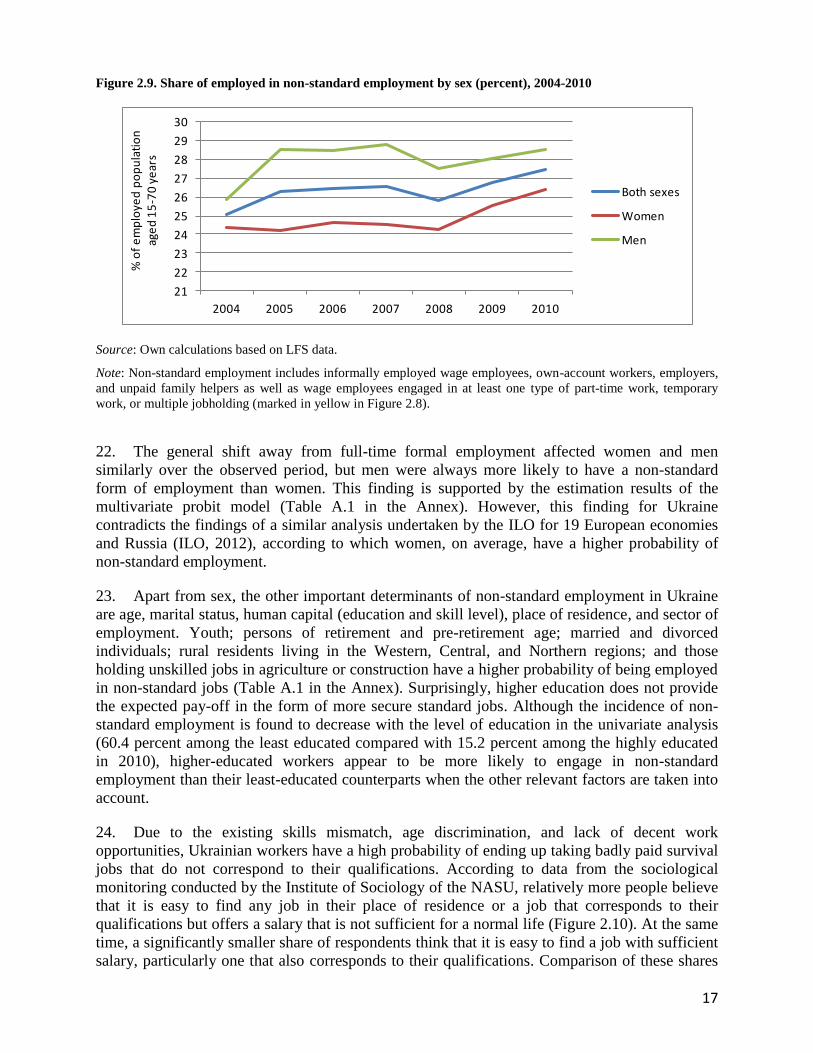
LIST OF ABBREVIATIONS ................................................................................................................... 6
1. INTRODUCTION ................................................................................................................................ 7
2. BACKGROUND INFORMATION ..................................................................................................... 9
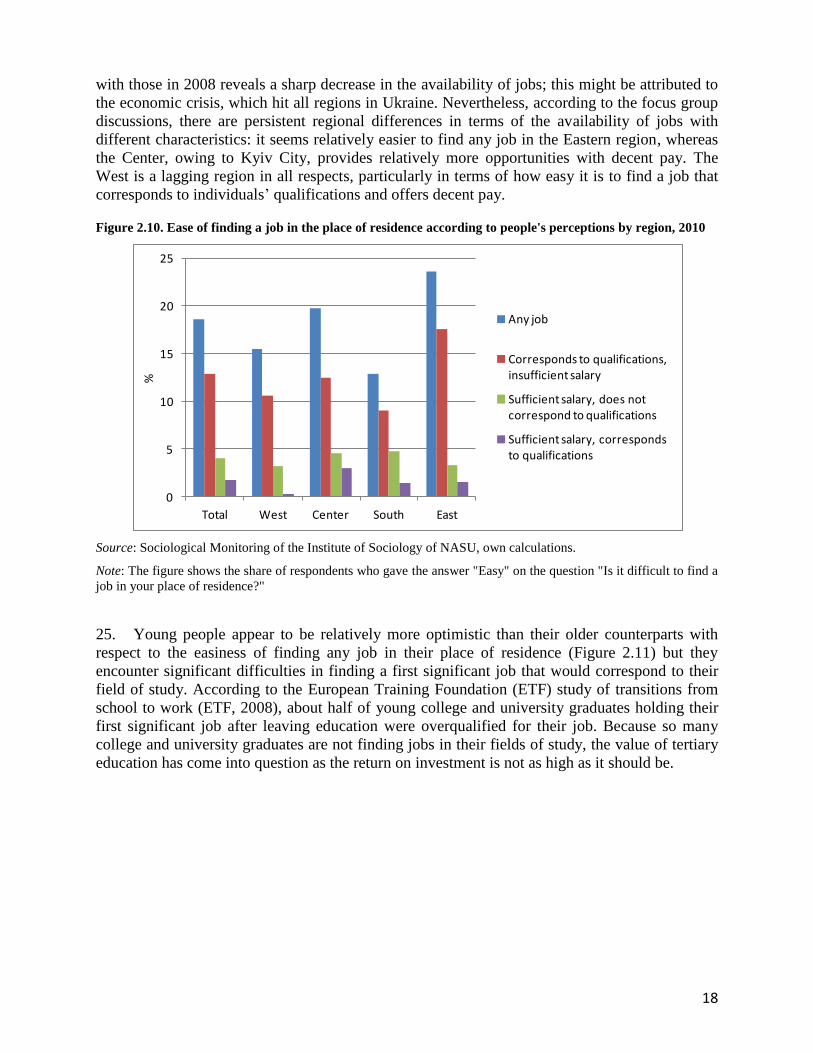
2.1. Demographic change and its implications for the Ukrainian labor market ................................... 9
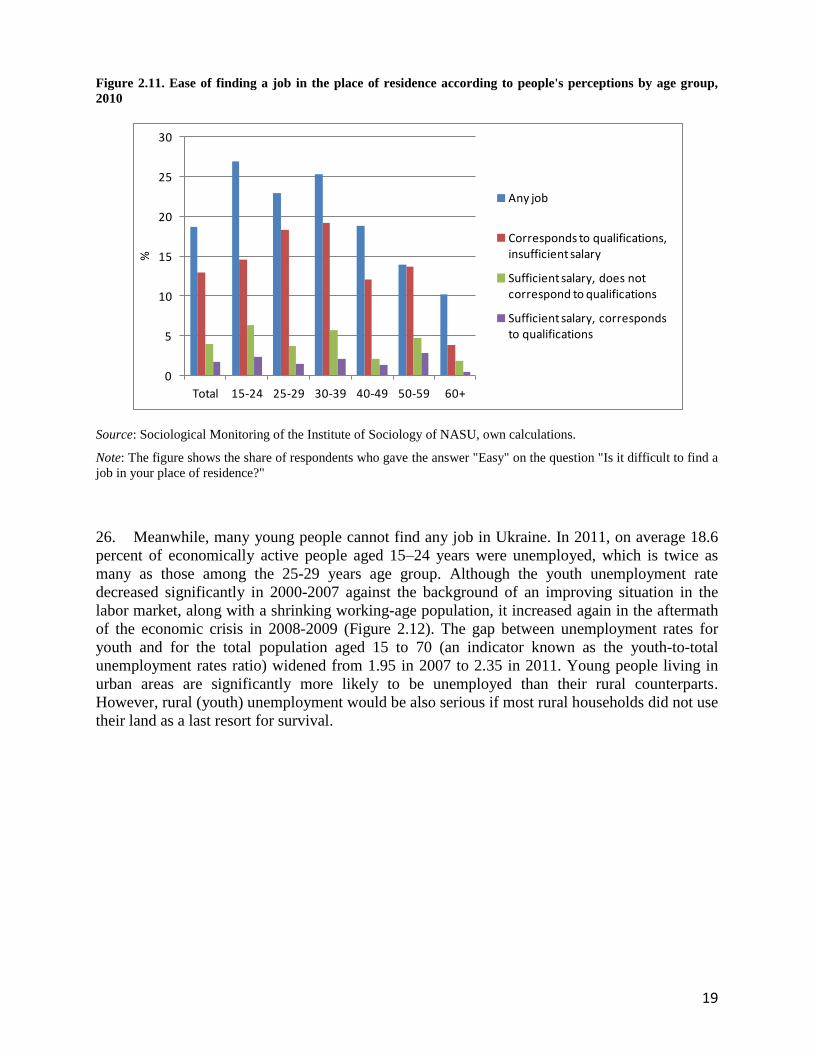
2.2. Description of the labor market situation: Recent developments and existing challenges
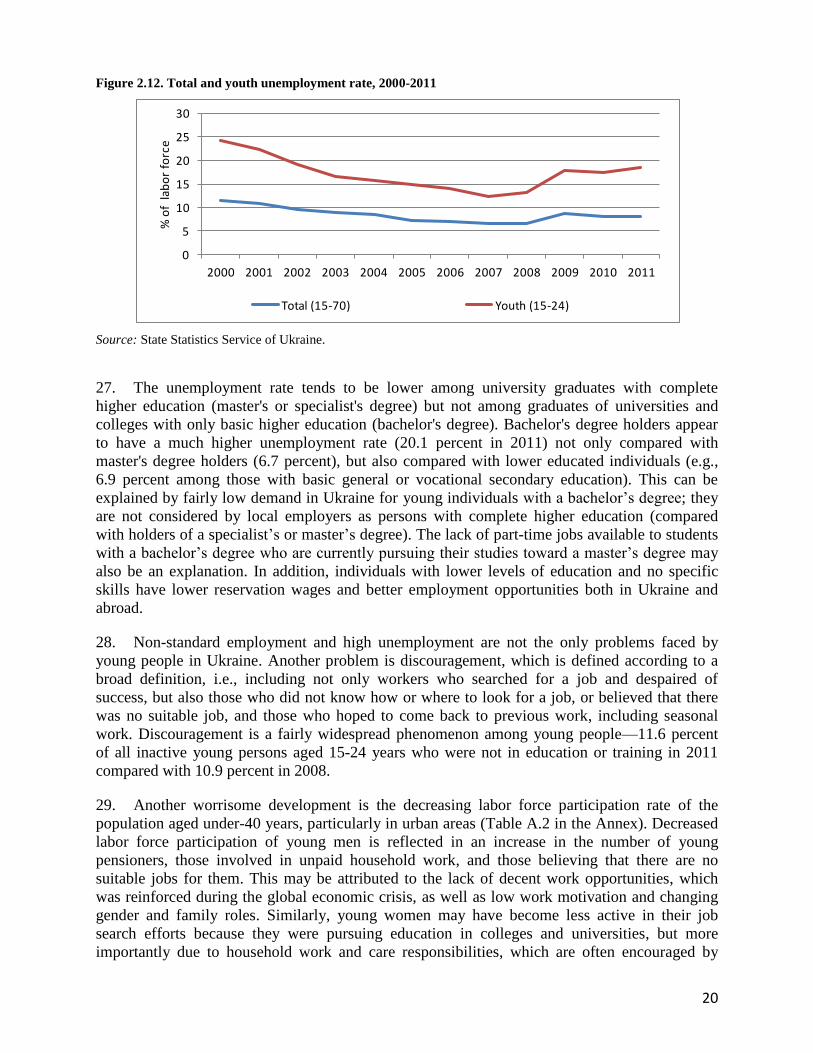
with respect to good jobs for development ......................................................................................... 13
3. JOBS AND LIVING STANDARDS .................................................................................................. 25
3.1. Jobs, poverty, and subjective well-being: The individual perspective ........................................ 25
3.2. Jobs and living standards: Development perspective and aging .................................................. 35
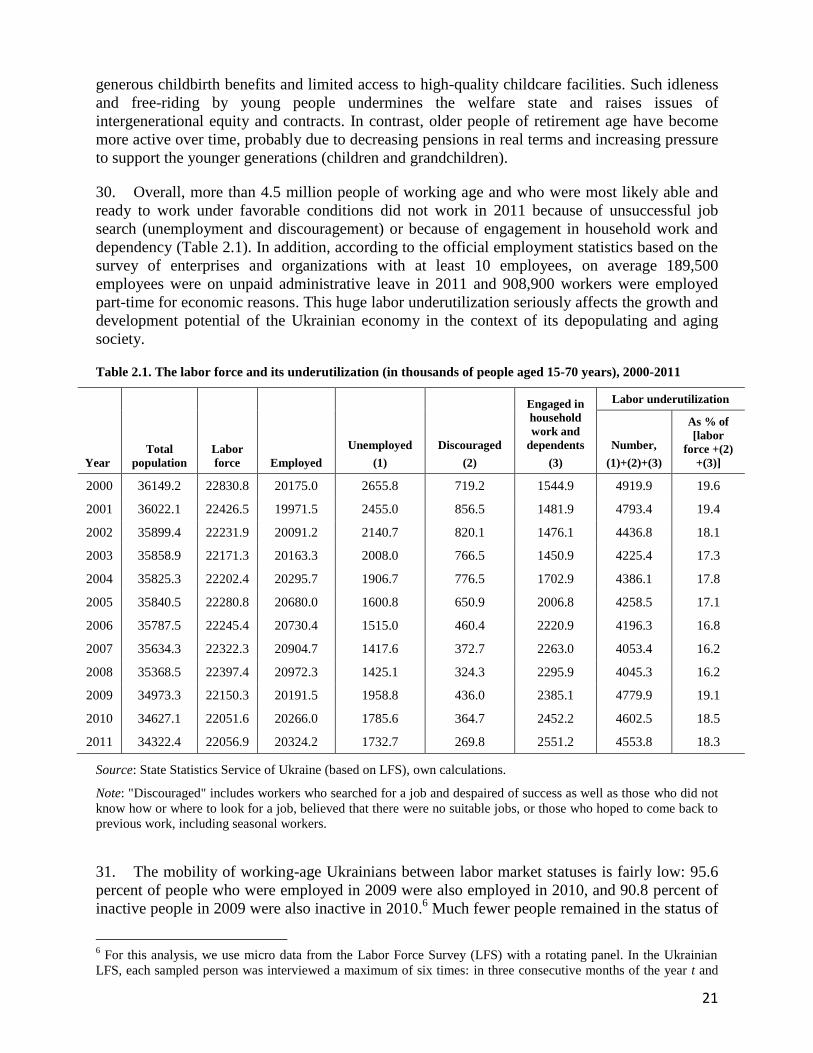
4. JOBS AND PRODUCTIVITY ........................................................................................................... 41
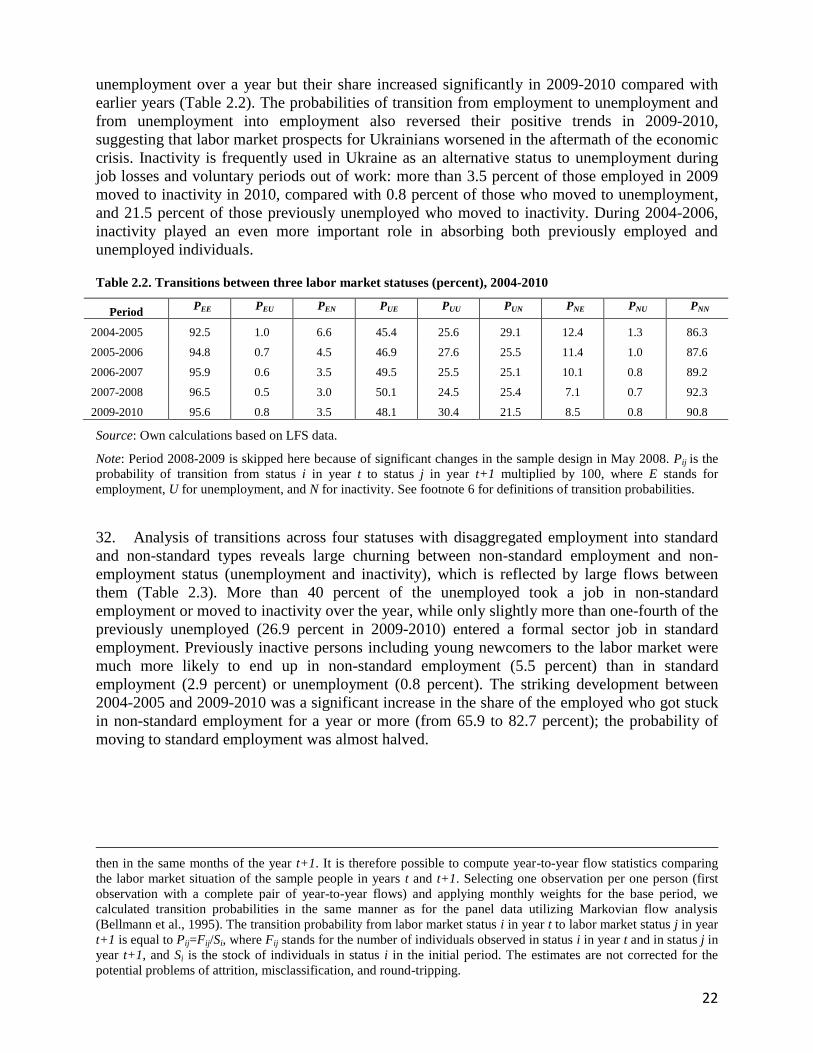
4.1. Trajectories of labor and total factor productivity ...................................................................... 41
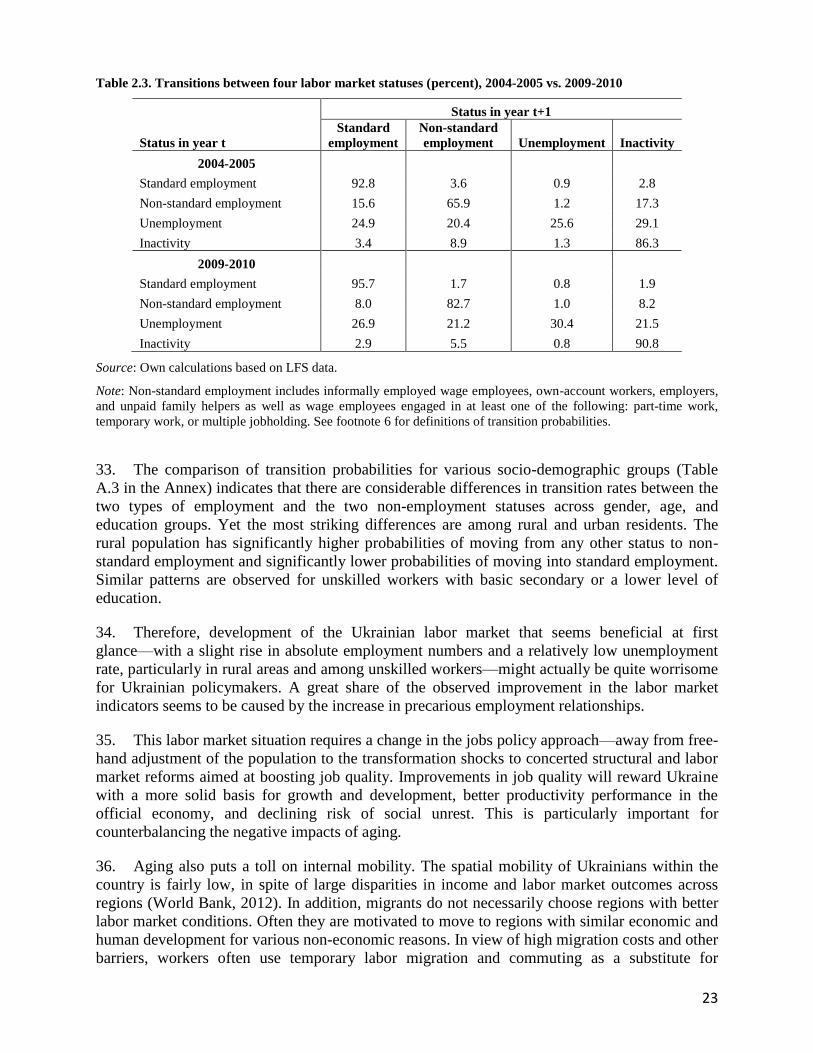
4.2. Agglomeration and spillover effects ............................................................................................ 45
4.3. Recent trends in job creation and destruction .............................................................................. 46
4.4. Jobs and productivity: Development perspective and aging........................................................ 49
5. JOBS AND SOCIAL COHESION ..................................................................................................... 54
5.1. Jobs within the framework of social cohesion: Macro data and people’s attitudes ..................... 54
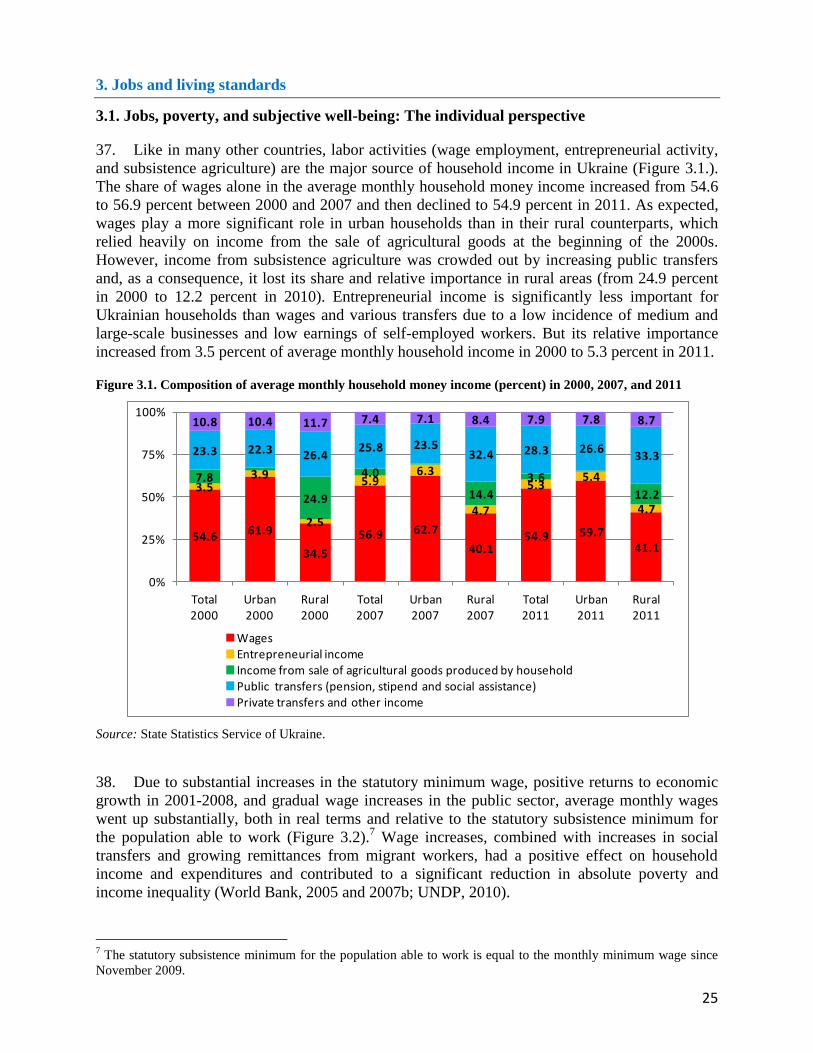
5.2. Local traps for good jobs in Ukraine: Focus groups analysis ...................................................... 62
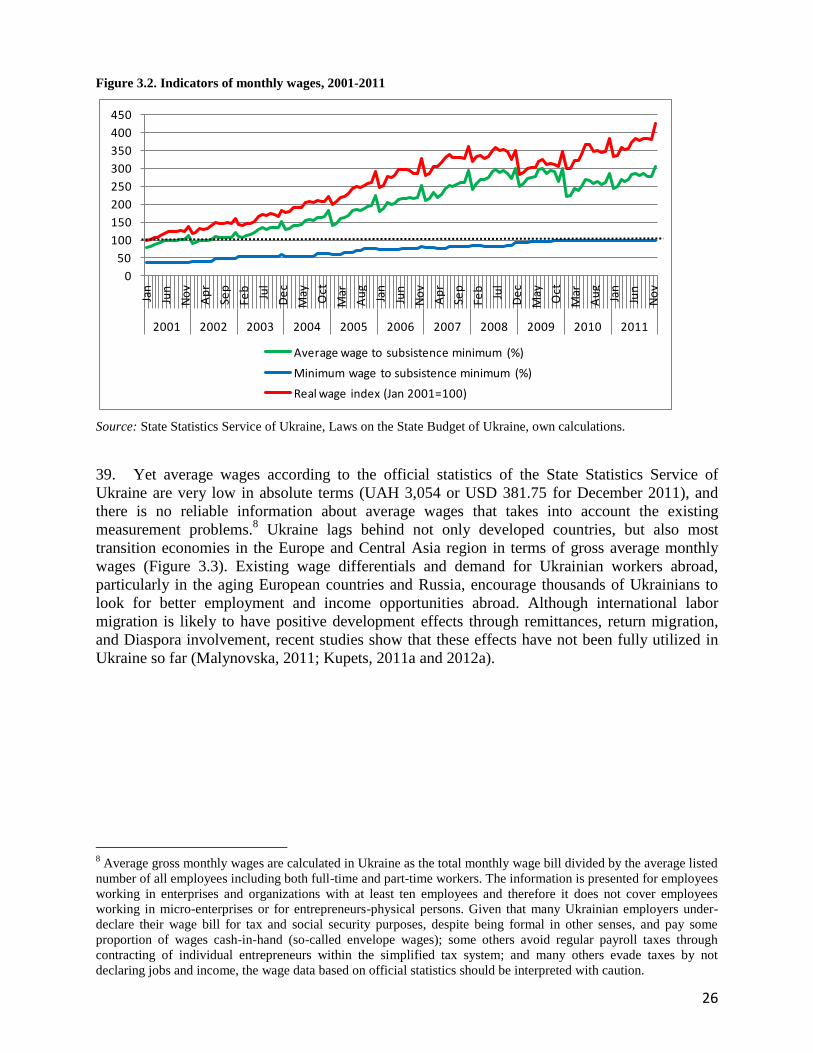
5.3. Jobs and social cohesion: Development perspective and aging ................................................... 68
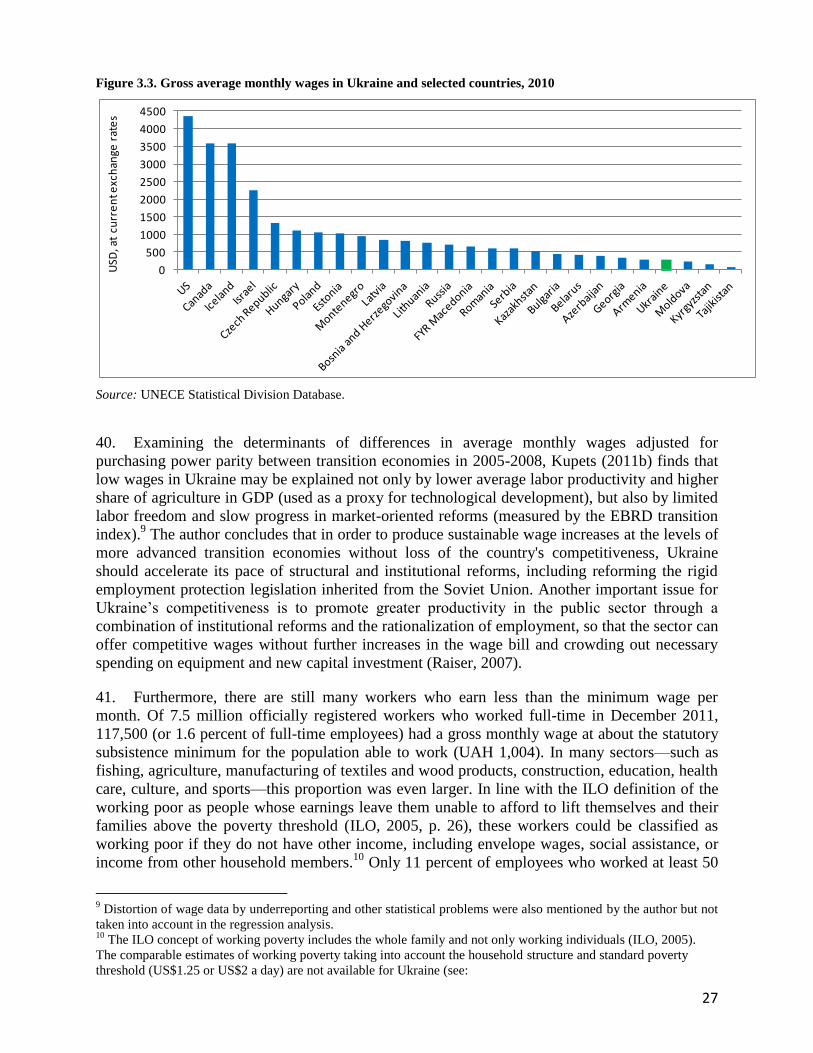
6. GOOD JOBS FOR DEVELOPMENT AND POSSIBLE TRADE-OFFS ACROSS THE
THREE TRANSFORMATIONS: THE UKRAINIAN CONTEXT ...................................................... 71
6.1. Good jobs for development: Examples ........................................................................................ 71
6.2. The main obstacles to creation of good jobs in Ukraine .............................................................. 74
6.3. Possible trade-offs between living standards, productivity, and social cohesion ........................ 78
7. CONCLUSIONS................................................................................................................................. 81
REFERENCES ....................................................................................................................................... 83
ANNEX................................................................................................................................................... 87
2
Executive Summary
The World Development Report (WDR), which is the World Bank’s most widely-known and
most visible flagship product, for 2013 focuses on jobs. In parallel with the production of the
main World Development Report, a number of case studies have been conducted in seven
countries, among them Ukraine. The country is faced with a particular jobs challenge given its
aging demographic profile, ongoing structural transformation, and fundamental political and
economic changes.
The Ukraine case study follows the main concept of the WDR 2013, linking jobs to three
transformations (living standards, productivity, and social cohesion) and making the distinction
between “good jobs for development” (those that carry a longer-term development pay-off) and
other jobs. The study encompasses desk and field research. The desk research provides an
extensive analysis of various aspects of jobs in Ukraine based on available quantitative data and
empirical evidence. The qualitative field research is based on focus group discussions with
various categories of individuals and in-depth interviews with representatives of private
employment agencies conducted by the Kiev International Institute of Sociology in March-April
2012.
Key findings of the country case study
During the past 20 years, Ukraine, as one of the fastest-aging countries in Europe, has been
suffering from severe losses of population and labor force. If age-specific labor force
participation rates are kept constant, the labor force is projected to shrink by more than 15
percent between 2012 and 2035. The aging population and shrinking labor force pose very
serious threats for the future development of the country.
In order to compensate for the labor force decline and ensure unchanging living standards, it
is necessary to provide for a steady increase in labor productivity (on average by 0.36 percent
annually).
The Ukrainian labor market is characterized by enormous skill waste (which coincides with
skill shortages), labor underutilization, and low mobility of the workforce. This seriously
undermines Ukraine's competitiveness under conditions of the global move to a more
knowledge-based and innovation-led economy. At the same time, there is significant room to
adjust to the challenge of an aging and shrinking population through increasing employment
and productivity levels by bringing hitherto idle youth and adults into the workplace,
encouraging more internal migration and professional mobility of workers, and better utilizing
their knowledge and skills.
The composition of employment is not socially optimal, with the bulk in non-standard
employment (including casual, temporary, undeclared, and own-account work) and generally
low-quality jobs (low skilled, with low and unstable earnings, poor working conditions,
violation of basic workers' rights, limited on-the-job training, job security, and promotion
prospects). As a result, employment does not always provide a solid pathway out of poverty,
and households with a working member could face even more severe economic hardship and
social deprivation than households relying on social assistance, pension, and other non-labor
income.
3
Ukrainian workers put a low priority on the social value of job (i.e., a job that is useful for
other people) and the content of work when they decide on their profession/job and work
effort. Most care about the salary level and its timely payment, job security, fringe benefits,
and a healthy work environment (i.e., friendly relations with administration and colleagues).
Young people give high preference to career opportunities, work prestige, and interesting
work but very low preference to the social aspects of jobs. Focus group discussions provide
further evidence for the prevalence of survival attitudes toward jobs over their development
value (social importance, self-realization, ecological effects, and future development). These
survival individualistic strategies do not allow individuals to see the broad perspective on jobs
for development.
Access to better jobs is limited and unfair, especially for youth and older workers, lower-
skilled workers, and residents of rural areas and regions with limited employment
opportunities. Education, skills, and personal attributes—which are considered the
individual’s “employability assets” in developed countries—appear to be less important for
gaining and maintaining employment in Ukraine than personal connections and social status
(often defined by family background).
Job creation occurs predominantly in the informal sector and in low-productivity sectors (less
knowledge-intensive services and medium or low-technology sectors with pollution
externalities). High levels of job creation and destruction in many sectors result in a lot of
churning but not in net creation of jobs. The structure of available jobs for wage employees in
the formal sector has changed from high-technology manufacturing and knowledge-intensive
services toward less knowledge-intensive services (such as retail trade) and basic
manufacturing jobs. Being predominantly “survival jobs,” they can hardly contribute to long-
term development and have rather detrimental effects for the future quality of the labor force.
Similar consequences for the labor force can be predicted based on workers switching to the
informal sector or small-scale private entrepreneurship.
Labor productivity reveals an upward trend in all sectors over the period 2001 to 2009. The
services sector has been growing the fastest and has consistently demonstrated the greatest
overall productivity. Productivity exhibits clear spatial patterns. The most productive firms
(and the most highly-paid jobs) are located in the capital city (Kyiv) and in the Eastern
regions, whereas firms in Northern and Central Ukraine show lower labor productivity. The
distribution of the workforce across regions follows a similar pattern.
Similar to other countries, Ukrainian firms enjoy agglomeration economies through
productivity gains and higher wages in locations with a higher concentration of jobs. Larger
firms, foreign-owned firms, and firms in cities benefit the most from co-location effects.
These types of firms also tend to pay higher wages to their workers.
Although foreign direct investment (FDI) may potentially bring about the best management
and production practices, the effect of FDI on Ukrainian firms is limited due to the small
number of firms that have access to FDI. In addition, many foreign affiliates rely on importing
their value-chain components from foreign companies abroad in view of the lack of adequate
supplies locally or dissatisfaction with the range and quality of local producers. However,
even the few foreign firms, on average, hire the most productive workers and pay higher
wages.
4
Due to a massive services sector restructuring, the access of foreign firms to the Ukrainian
market has been beneficial for manufacturing firms. In particular, firms that had used services
more intensively managed to convert better access to these services into greater productivity
gains.
Employment is related to the level of social trust, social participation, and people’s subjective
well-being. Those who are employed trust people more, are more actively involved in social
organizations and movements, and evaluate their well-being more positively. But the level of
generalized trust, life satisfaction, and evaluation of democracy developments in Ukraine is
much lower than in Europe. And the level of political and civic participation is very low in
Ukraine, although the employed are twice more involved in civic and political activities than
the unemployed. Regardless of employment status, Ukrainians demonstrate low trust in social
and political institutions, both public (President, government, parliament, police, tax
authorities, court, political parties, and public employment services) and private (banks,
insurance companies, and employers). Trust is even low when it comes to charity foundations,
nongovernmental organizations (NGOs), and trade unions. Unless traditional institutions
regenerate public trust, people will continue to give high preference to a close social network
(relatives, friends, colleagues, and neighbors), thus providing grounds for maintenance of the
existing informal and conservative society with low civic engagement. Alternatively, they will
search for new forms of voice that might eventually end up in greater system instability.
Participants in focus group discussions agree that contributions to the Public Pension Fund are
necessary to support the current generation of the elderly. However, people do not trust the
state and bureaucrats because there is no transparency in the distribution of taxes and no
control of law enforcement. Therefore, many prefer to work informally and support their
pension-age relatives (parents and grandparents) directly rather than through making
contributions to the Public Pension Fund.
Widespread informal employment contributes to the violation of core worker rights in such
aspects as job security, timely and reasonable remuneration for work done, access to fringe
benefits, age and gender equality, initial employment for young people, and employment of
individuals according to their skills and qualifications. In addition, there are many schemes
involving cheating and violation of basic rights by employers, even in the formal sector, as
documented by numerous examples given by the focus group participants. Bribery and other
forms of corruption are widespread phenomena in the Ukrainian labor market: in order to get
a lucrative job in the public sector (local authorities, tax administration, internal affairs,
railway, etc.) one must pay a sizeable bribe or trade in favors. A high incidence of corruption
occurs in those agencies that are responsible for the rule of law in Ukraine. This makes it
impossible to overcome corrupt schemes in access to jobs and government subsidies (both
direct and indirect). Existing unfairness in the labor market, which is amplified by widespread
corruption and informal schemes, is one of the biggest threats to trust, civic engagement, and
therefore social cohesion in Ukraine.
Taking into account the recent developments in the Ukrainian labor market, we suggest
several examples of good jobs for development that are likely to provide high value for
society due to positive spillovers. These examples are based on the argument that the
following steps are key to addressing the possible constraints caused by aging via increasing
productivity and participation: (i) to promote learning spillovers (e.g., from FDI or cross-
border movement of workers) and increase human capital through lifelong learning; (ii) to
5
raise the activity and productivity levels of underemployed categories of the population,
including rural residents, youth, women with small children, the elderly, return migrants, and
residents of backward regions; (iii) to enhance innovation and entrepreneurship; and (iv) to
improve the health status of the younger generations not only through improvements in
lifestyle and health care, but also through investment in environment-friendly and energy-
saving technologies. Our examples include the following four categories of jobs: (i) jobs
created by companies with FDI (mostly multinational enterprises); (ii) all-year jobs for rural
workers, created by agricultural (small and middle-size farmers) and non-agricultural firms;
(iii) jobs created by small entrepreneurs among return migrants; and (iv) new jobs in start-up
companies generating "green" energy.
We recognize that there are obstacles to the creation of good jobs for development in Ukraine
and that even in the case of removing these obstacles, there are possible trade-offs between
the three transformations. For example, an uneven distribution of winners and losers from
productivity and employment growth supported by FDI may lead to huge regional/sector
imbalances and geographic “pockets” of poverty, deprivation, and social exclusion. However,
strong social connections and the high capacity of local communities to engage in collective
decision making may emerge along with unwillingness to move professionally or territorially
for efficiency reasons as people choose "not to rise above the crowd".
The challenge for policymakers is to develop jobs policies and programs that focus on
generating employment opportunities that bring positive spillovers with respect to living
standards, productivity gains, and social cohesion but minimize the possible side effects.
Improving fairness in the Ukrainian labor market is one of the priority tasks for rebuilding
social cohesion in Ukraine's society and increasing the development pay-off of jobs. Other
important areas for policy interventions are removing the market distortions and structural
obstacles to doing business; investing, innovating, and creating jobs in the formal sector;
targeting investment programs at activities that have clear potential to provide productivity
spillovers, improving living standards, and enhancing social cohesion; facilitating
employment prospects for youth and those who are older than 45 years, previously inactive
women who lack adequate skills, the rural population, returning migrants, and other
categories through affirmative action; reforming the education and training system aimed at
equipping people with broad, flexible, and transferable skills that enable them to progress in
their working lives; supporting the geographical and occupational mobility of the workforce;
and improving cooperation between education and labor market institutions, social partners,
and businesses in order to avoid labor shortages and skills mismatches and use scarce human
resources more efficiently.
6
List of abbreviations
EBRD European Bank for Reconstruction and Development
ETF European Training Foundation
ESS European Social Survey
FDI Foreign direct investment
FEZ Free Economic Zone
FGD Focus group discussion
GDP Gross domestic product
ILO International Labor Organization
ISSP International Social Survey Program
IT Information technology (sector)
JCR Job creation rate
JDR Job destruction rate
LFS Labor Force Survey
OECD Organization for Economic Cooperation and Development
OLF Out of labor force (inactive)
NACE Statistical classification of economic activities (Nomenclature statistique des activités
économiques dans la Communauté européenne)
NASU National Academy of Science of Ukraine
NGO Nongovernmental organization
PES Public Employment Service
PPI Producer price index
SME Small and medium enterprises
TPC Territorial-industrial complex
TPD Territories of Priority Development
UAH Ukrainian Hryvnia
ULMS Ukrainian Longitudinal Monitoring Survey
UN United Nations
UNECE United Nations Economic Commission for Europe
USD US dollars
USSR The Union of Soviet Socialist Republics
VAT Value-added tax
VET Vocational education and training
WAP Working-age population
WDR World Development Report
7
1. Introduction
1. The recent economic crisis, globalization, and ongoing structural transformation have
resulted in massive job losses and deteriorating working conditions in many countries, including
Ukraine. These negative developments have brought about remarkable changes in people's living
standards, life satisfaction, productivity, trust in government and various political and economic
institutions, and the cohesiveness of society. This puts creation of more and better jobs high on
the policy agenda. But the main challenge is to develop jobs policies and programs that focus not
solely on generating employment opportunities that bring individual earnings, benefits, and
satisfaction, but rather on jobs that entail additional value for society through positive spillover
effects on poverty, productivity, and social cohesion.
2. The jobs challenge in Ukraine is amplified by the country’s shrinking and aging population
together with its low labor force participation rates and poor productivity performance. As a
result, Ukraine may face a vicious circle: the decreasing pool of available working-age
individuals may put significant pressure on Ukrainian firms looking for skilled workers, whereas
smaller cohorts of young people might reduce the innovative capacity and competitiveness of
local firms. At the same time, in order to care for the growing number of elderly, there will be
fiscal pressures reflected in higher contribution rates and taxation among those who participate in
the formal economy. This will ultimately lead to higher labor costs and a double burden on
formally employed working-age individuals and formal firms. These developments could create
incentives for more individuals and firms to exit to the shadow economy, but they can also
increase social tension and undermine civic engagement. At the macro level, this might result in
worsening living standards, decreasing productivity, and less cohesiveness in society.
3. This case study aims to improve our understanding of the connection between jobs and
important dimensions of social and economic development in an aging society, to provide
country-specific examples of jobs with potentially high value for society, and to help address the
most difficult jobs-related questions facing policymakers. This report is one of the seven country
studies of different “typologies” of countries contributing to the WDR 2013 on Jobs. Therefore,
like the other country studies, it follows the main framework of the WDR (Box 1) according to
which jobs are to be understood in a broader (multi-dimensional) way as they determine living
standards and productivity levels and contribute to social cohesion (the three transformations).
Moreover, jobs are considered to have more than an individual level: they can have positive or
negative development pay-offs. This is why the WDR emphasizes “good jobs for development,”
defined as those contributing the most to societal goals (the society level). The decent work
aspects formulated by the International Labor Organization’s (ILO’s) constituents—including
creating jobs for sustainable livelihoods, guaranteeing rights at work, extending social protection,
and promoting social dialogue—are left pretty much out of the picture. The main focus is instead
on how jobs are linked to three transformations that accompany the development process—living
standards, productivity, and social cohesion, and how specific job-related programs and
interventions can increase the development pay-off of jobs. Jobs are defined here as labor
activities that generate income, monetary or in kind, and can take the form of wage employment,
self-employment, and farming.
Box 1. WDR 2013 on Jobs—Main Messages
8
Jobs are multi-dimensional (transformational). Jobs are at the center of development. They connect
improvements in three development transformations: living standards, productivity gains, and social cohesion.
Living standards. Living standards encompass the material and subjective aspects of well-being. Jobs
contribute to living standards by generating earnings opportunities that lift people out of poverty, making them
less vulnerable, motivating them, and contributing to their broader happiness and satisfaction with life.
Productivity. Productivity is the amount of output generated with a given amount of inputs. Higher productivity
of individual jobs, creation of more productive jobs and destruction of less productive ones, and reallocation of
workers within countries and across borders drive changes in aggregate productivity.
Social cohesion. Societies are cohesive when they have the capacity to manage collective decision making
peacefully. Jobs can contribute to social cohesion by nurturing trust in others beyond the group to which people
belong. They can also do so by fostering civic engagement.
What are good jobs for development? These are jobs that contribute the most to societal goals. The
development pay-off of a job is the sum of its value in the work and its spillovers (if any). The individual value
is the first-order measure of the development pay-off, but spillovers can be substantial as jobs reduce poverty
and inequality, strengthen value chains and production clusters, or help build trust and shared values.
Policies through the jobs lens. Strategies, policies, and programs adopt a jobs lens if they take into account the
development pay-offs from jobs. The jobs lens involves realizing untapped development pay-offs by addressing
the constraints that prevent the private sector from creating more good jobs for development.
Source: WDR (2013).
4. The research for this study encompassed desk and field qualitative research, as well as
discussions with the key stakeholders in January 2012, including representatives from the
Ukrainian government and Public Employment Service, trade unions, employer associations,
NGOs, and the ILO. The desk research component of the study involved an extensive
quantitative analysis based on available job-related data in Ukraine, such as aggregate statistics
provided by the State Statistics Service of Ukraine, individual-level data from the Labor Force
Survey (LFS), and Social Monitoring by the Institute of Sociology of the National Academy of
Science of Ukraine (NASU); firm-level data from the Establishment Survey; household-level
data from the Household Budget Survey; and data from international surveys, such as the
International Social Survey Program (ISSP), the European Social Survey (ESS), and the Life in
Transition Survey. It also drew extensively on existing studies, research papers, and ongoing
projects. The second component of the study was qualitative research based on focus group
discussions with various categories of individuals and in-depth interviews with representatives of
private employment agencies conducted by the Kiev International Institute of Sociology in
March-April 2012.
5. Section 2 provides an overview of the current demographic and labor market trends and
thinking regarding the existing challenges in Ukraine with respect to good jobs for development.
Sections 3, 4, and 5 analyze how jobs are related to the three transformations mentioned above,
namely, living standards, productivity, and social cohesion, with particular emphasis on the
development aspects of jobs and aging, using the framework of the WDR. In addition, Section 5
summarizes the main results of focus group discussions and in-depth interviews on the attitudes
of Ukrainian workers toward jobs and their social value. Section 6 offers examples of jobs that
have a high potential for significant development pay-offs in Ukraine; it also discusses the main
obstacles to the creation of such jobs and possible trade-offs between the three transformations.
It also addresses three of seven difficult job-related policy questions offered in the WDR.
Finally, Section 7 sets out conclusions from the country study and policy recommendations.
9
2. Background information
2.1. Demographic change and its implications for the Ukrainian labor market
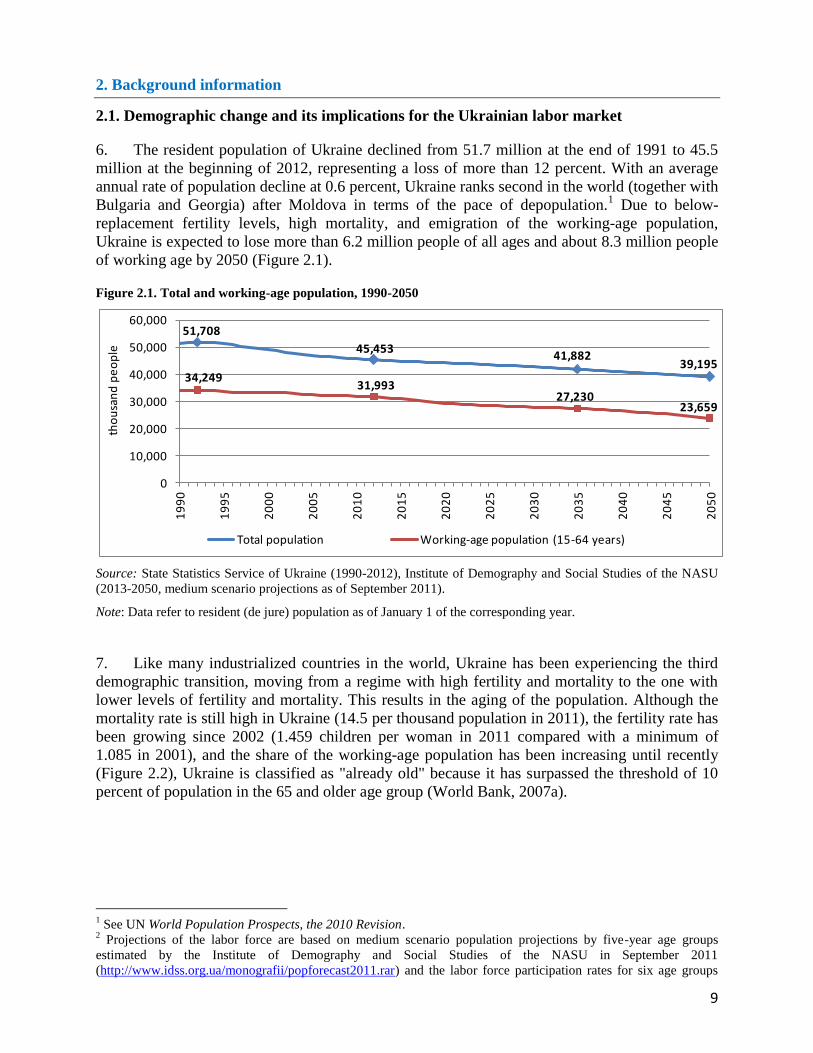
6. The resident population of Ukraine declined from 51.7 million at the end of 1991 to 45.5
million at the beginning of 2012, representing a loss of more than 12 percent. With an average
annual rate of population decline at 0.6 percent, Ukraine ranks second in the world (together with
Bulgaria and Georgia) after Moldova in terms of the pace of depopulation.1 Due to below-
replacement fertility levels, high mortality, and emigration of the working-age population,
Ukraine is expected to lose more than 6.2 million people of all ages and about 8.3 million people
of working age by 2050 (Figure 2.1).
Figure 2.1. Total and working-age population, 1990-2050
Source: State Statistics Service of Ukraine (1990-2012), Institute of Demography and Social Studies of the NASU
(2013-2050, medium scenario projections as of September 2011).
Note: Data refer to resident (de jure) population as of January 1 of the corresponding year.
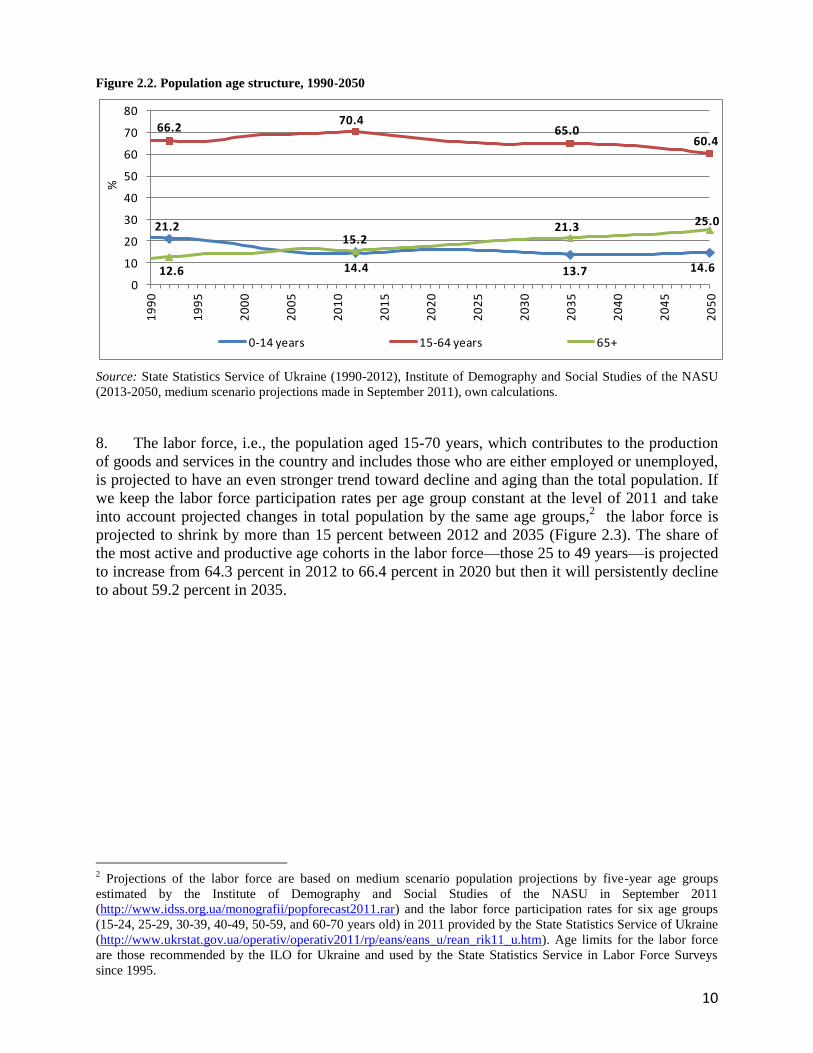
7. Like many industrialized countries in the world, Ukraine has been experiencing the third
demographic transition, moving from a regime with high fertility and mortality to the one with
lower levels of fertility and mortality. This results in the aging of the population. Although the
mortality rate is still high in Ukraine (14.5 per thousand population in 2011), the fertility rate has
been growing since 2002 (1.459 children per woman in 2011 compared with a minimum of
1.085 in 2001), and the share of the working-age population has been increasing until recently
(Figure 2.2), Ukraine is classified as "already old" because it has surpassed the threshold of 10
percent of population in the 65 and older age group (World Bank, 2007a).
1 See UN World Population Prospects, the 2010 Revision.
2 Projections of the labor force are based on medium scenario population projections by five-year age groups
estimated by the Institute of Demography and Social Studies of the NASU in September 2011
(http://www.idss.org.ua/monografii/popforecast2011.rar) and the labor force participation rates for six age groups
51,708
45,45341,882
39,19534,249
31,99327,230
23,659
0
10,000
20,000
30,000
40,000
50,000
60,000
19
90
19
95
20
00
20
05
20
10
20
15
20
20
20
25
20
30
20
35
20
40
20
45
20
50
tho
usa
nd
pe
op
le
Total population Working-age population (15-64 years)
10
Figure 2.2. Population age structure, 1990-2050
Source: State Statistics Service of Ukraine (1990-2012), Institute of Demography and Social Studies of the NASU
(2013-2050, medium scenario projections made in September 2011), own calculations.
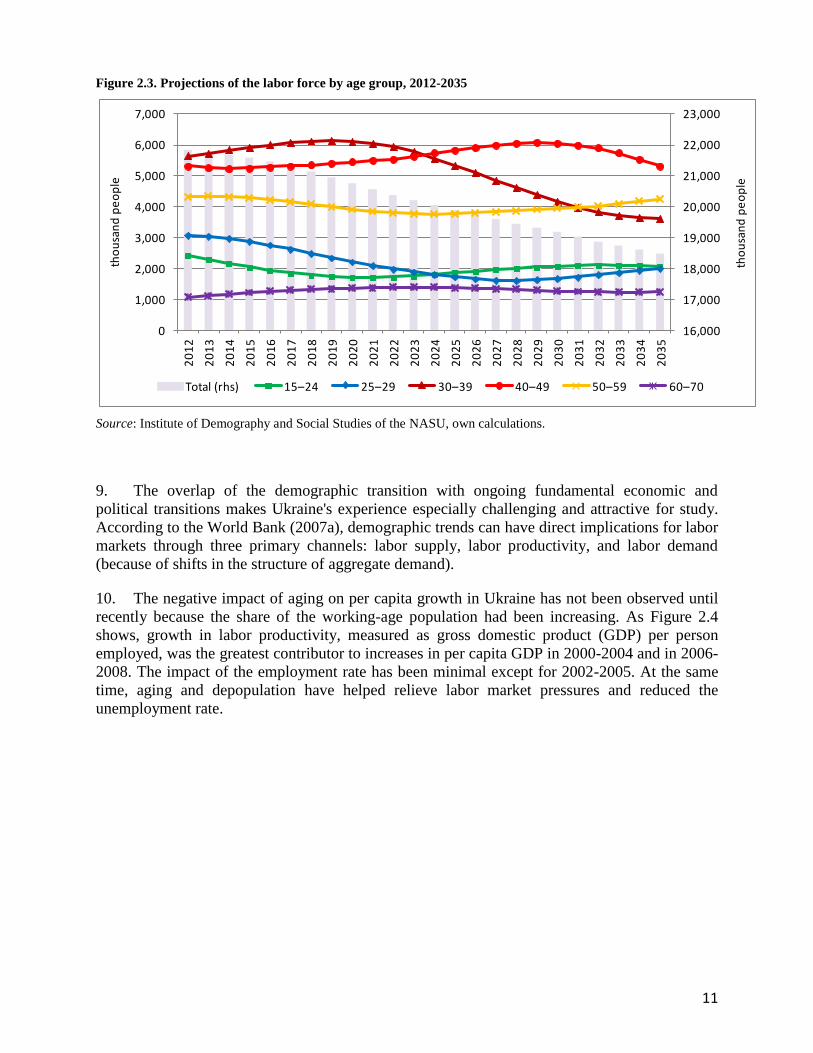
8. The labor force, i.e., the population aged 15-70 years, which contributes to the production
of goods and services in the country and includes those who are either employed or unemployed,
is projected to have an even stronger trend toward decline and aging than the total population. If
we keep the labor force participation rates per age group constant at the level of 2011 and take
into account projected changes in total population by the same age groups,2 the labor force is
projected to shrink by more than 15 percent between 2012 and 2035 (Figure 2.3). The share of
the most active and productive age cohorts in the labor force—those 25 to 49 years—is projected
to increase from 64.3 percent in 2012 to 66.4 percent in 2020 but then it will persistently decline
to about 59.2 percent in 2035.
2 Projections of the labor force are based on medium scenario population projections by five-year age groups
estimated by the Institute of Demography and Social Studies of the NASU in September 2011
(http://www.idss.org.ua/monografii/popforecast2011.rar) and the labor force participation rates for six age groups
(15-24, 25-29, 30-39, 40-49, 50-59, and 60-70 years old) in 2011 provided by the State Statistics Service of Ukraine
(http://www.ukrstat.gov.ua/operativ/operativ2011/rp/eans/eans_u/rean_rik11_u.htm). Age limits for the labor force
are those recommended by the ILO for Ukraine and used by the State Statistics Service in Labor Force Surveys
since 1995.
21.2
14.4 13.7 14.6
66.270.4
65.060.4
12.6
15.221.3 25.0
0
10
20
30
40
50
60
70
80
19
90
19
95
20
00
20
05
20
10
20
15
20
20
20
25
20
30
20
35
20
40
20
45
20
50
%
0-14 years 15-64 years 65+
11
Figure 2.3. Projections of the labor force by age group, 2012-2035
Source: Institute of Demography and Social Studies of the NASU, own calculations.
9. The overlap of the demographic transition with ongoing fundamental economic and
political transitions makes Ukraine's experience especially challenging and attractive for study.
According to the World Bank (2007a), demographic trends can have direct implications for labor
markets through three primary channels: labor supply, labor productivity, and labor demand
(because of shifts in the structure of aggregate demand).
10. The negative impact of aging on per capita growth in Ukraine has not been observed until
recently because the share of the working-age population had been increasing. As Figure 2.4
shows, growth in labor productivity, measured as gross domestic product (GDP) per person
employed, was the greatest contributor to increases in per capita GDP in 2000-2004 and in 2006-
2008. The impact of the employment rate has been minimal except for 2002-2005. At the same
time, aging and depopulation have helped relieve labor market pressures and reduced the
unemployment rate.
16,000
17,000
18,000
19,000
20,000
21,000
22,000
23,000
0
1,000
2,000
3,000
4,000
5,000
6,000
7,000
20
12
20
13
20
14
20
15
20
16
20
17
20
18
20
19
20
20
20
21
20
22
20
23
20
24
20
25
20
26
20
27
20
28
20
29
20
30
20
31
20
32
20
33
20
34
20
35
tho
usa
nd
pe
op
le
tho
usa
nd
pe
op
le
Total (rhs) 15–24 25–29 30–39 40–49 50–59 60–70
12
Figure 2.4. Decomposition of per capita annual GDP growth, 1992-2009
Source: Own calculations based on World DataBank data.
Note: Following World Bank (2007a, p. 14), GDP per person employed is a proxy for labor productivity, working-
age population (WAP, aged 15-64) to population is a proxy for aging, and employment to working-age population is
a proxy for the employment rate. The basic equation is: GDP/Population = (GDP/Employment) *
(Employment/Working-age population)*(Working-age population/Population). The log transformation is used to
interpret the results in terms of the percentage change of each component.
11. However, demographic challenges expected in Ukraine in the near future, if they are not
addressed by timely and sensible policy actions aimed at increasing productivity and labor force
participation, pose fundamental threats. The decreasing pool of available working-age
individuals will put significant pressure on Ukrainian firms and make it extremely difficult to
maintain the growth trajectory. With current labor force participation rates and slow productivity
growth, the social welfare and pension system may become unsustainable, and the risk of
extreme poverty is especially acute for the elderly population. So there will be fiscal pressures to
increase contribution rates and taxation among those who do participate formally in order to care
for the growing number of elderly. This will lead to higher labor costs and a double burden on
the formally employed workers than if there were a broader tax base and more people
participated in the formal economy. These developments might also adversely affect
intergenerational relations and social cohesion. Deteriorating health of the elderly population
may influence not only female labor force participation, but also childbearing decision making,
putting pressure on women of childbearing age to have children earlier while their parents are
relatively young or to have fewer children than desired. These trends will further exacerbate the
problems of aging and depopulation.
12. Generating more and better jobs, which would foster labor productivity growth through
capital investment and innovation, may help alleviate the adverse impact of aging on the
economy. Our simulations with three scenarios of GDP per capita trends (GDP per capita
remains constant, and increases by 1 and 3 percent per annum) and the assumption that age-
specific labor force participation rates in 2012-2035 are the same as in 2011 show that labor
productivity should grow faster in every year than projected GDP per capita to compensate for
the labor force decline (Figure 2.5). In order to keep GDP per capita constant (zero growth),
-25
-20
-15
-10
-5
0
5
10
15
19
92
19
93
19
94
19
95
19
96
19
97
19
98
19
99
20
00
20
01
20
02
20
03
20
04
20
05
20
06
20
07
20
08
20
09
%
GDP per person employed (constant LCU) WAP to total population
Employment to WAP GDP per capita (constant LCU)
13
GDP per person in the labor force, which is a rough measure of labor productivity (given low
unemployment), should grow on average by 0.36 percent annually, or by at least 10 percent over
the entire period until 2035. If the goal is to reach a GDP per capita annual growth rate of 3
percent, labor productivity should grow on average by 3.36 percent annually, or by 121 percent
in total. Taking into account that the heaviest burden will fall on younger generations, their
formal education and on-the-job training plays a crucial role not only for their future personal
well-being and productivity, but also for the long-term growth trend of productivity in Ukraine
as a whole.
Figure 2.5. Projected average productivity annual growth rate (real GDP per a person in the labor force)
necessary to compensate for the labor force decline due to demographic trends, 2012-2035
Source: Own calculations based on data from the State Statistics Service of Ukraine and the Institute of
Demography and Social Studies of the NASU.
13. Alternatively, the impact of aging on the economy and living standards could be somehow
cushioned through an increase in the labor force participation rate and in the pool of the
employed. This would require creation of more and better jobs for those who are marginally
attached to the labor market or are not attached at all, including youth and older workers,
females, the disabled, and ethnic minorities among immigrants.
2.2. Description of the labor market situation: Recent developments and existing challenges
with respect to good jobs for development
14. Total employment in Ukraine, as defined according to the ILO methodology on the basis of
the labor force survey (LFS) data for individuals aged 15-70 years, increased steadily during
2001-2008, with net employment gains of more than a million jobs (see Table 2.1). The
economic and financial crisis in 2009 resulted in the loss of about 781,000 jobs. This has been
only partly compensated by a slight employment recovery in 2010-2011 (132,700 jobs).
According to the latest statistics, in 2011, the number of employed people aged 15-70 years was
20.3 million people, or 59.2 percent of the total population in that age group.
15. Ukraine experienced unprecedented structural changes not only in the age composition of
the population and the labor force, but also in employment. The agricultural and industrial
sectors experienced reduced shares in total employment, while the market services sector
-1%
0%
1%
2%
3%
4%
20
12
20
13
20
14
20
15
20
16
20
17
20
18
20
19
20
20
20
21
20
22
20
23
20
24
20
25
20
26
20
27
20
28
20
29
20
30
20
31
20
32
20
33
20
34
20
35
GDP per capita annual growth rate 0%
GDP per capita annual growth rate 1%
GDP per capita annual growth rate 3%
14
experienced a huge increase in its share (Figure 2.6). Among the 11 sectors shown in the
employment statistics of the State Statistics Service of Ukraine, the largest sector in terms of
employment is trade, repair, hotels and restaurants, which accounted for 23.9 percent of total
employment in 2011.
Figure 2.6. Changes in the sector composition of employment in Ukraine, 2000-2011
Source: State Statistics Service of Ukraine (based on LFS), own calculations.
Note: Public services include education, health care and social work, and public administration.
16. Agricultural and industrial employment has contracted by more than 20 percent since 2000,
but employment dynamics in agriculture were not as monotonous as in industry. While industrial
employment has declined steadily since 2000, agricultural employment decreased during 2000-
2004 and 2006-2010 but increased in 2005 and 2011. At the same time, significant employment
losses in agriculture and industry were more than offset by substantial gains in financial
intermediation (an increase of 111 percent between 2000 and 2011), trade, repair, hotels and
restaurants (by 56 percent), and real estate, rental, and business activities (by 45.5 percent).
17. The share of wage and salaried workers fell sharply, from around 90.1 percent in 2000 to
80.7 percent in 2011. These losses were counterbalanced by a double increase in the share of
self-employed persons (from 8.1 to 17.8 percent), particularly in subsistence agriculture and
petty trade.
18. The share of informally employed individuals in total employment (incidence of
informality) increased from 21.5 percent in 2005 to 23.1 percent in 2011, mainly in subsistence
agriculture, trade and repair, construction, transport and some other activities.3 The incidence of
informality in wage employment increased from 7.5 to 9.7 percent over the same period.
19. The share of unskilled jobs in total employment increased by 6.2 percentage points
between 2000 and 2011, which is equivalent to an increase of 34.2 percent in the total number
(Figure 2.7). Other occupational groups that experienced employment gains are service workers
3 The Informally employed are defined in Ukraine as persons aged 15-70 years who, during a given reference
period, were employed in at least one production unit of the informal sector, irrespective of their status in
employment, or were salaried workers without a written employment contract.
21.6 20.8 20.6 20.4 19.7 19.4 17.6 16.7 15.8 15.6 15.4 16.8
22.8 22.0 21.0 20.4 20.1 19.7 19.5 19.0 18.5 17.6 17.1 16.5
20.8 20.8 20.8 20.7 19.9 19.6 19.7 19.6 19.7 20.4 21.0 19.9
34.8 36.5 37.6 38.5 40.3 41.3 43.2 44.8 46.0 46.4 46.6 46.8
0%
25%
50%
75%
100%
2000 2001 2002 2003 2004 2005 2006 2007 2008 2009 2010 2011
Agriculture Industry Public services Market services
15
and shop and market sales, professionals and senior officials, and managers. Overall, the share of
white-collar and office jobs (the top four occupational groups) fell from 39.2 to 36.7 percent,
mainly due to considerable reduction of jobs for technicians and clerks. The share of blue-collar
jobs also decreased significantly, which is in line with observed employment losses in industry
and agriculture. Skilled agricultural and fishery workers experienced the most severe reduction
of employment opportunities: the number of employed persons in this occupational group has
decreased from 617,000 to 203,000 since 2000.
Figure 2.7. Changes in the occupational composition of employment in Ukraine, 2000 and 2011
Source: State Statistics Service of Ukraine (based on LFS).
20. Hence, despite a small increase in the number of employed people during the 2000s, the
quality of jobs has deteriorated substantially.4 In order to examine the composition of non-
standard (and often precarious) employment and its determinants, the employed population was
broken down into three wide groups using available information about the status of
employment—wage employment, self-employment, and unpaid family work (Figure 2.8). These
groups were further split into nine mutually exclusive classes depending on the type of
employment (formal vs. informal), number of employees for self-employed persons (own-
account workers vs. employers), sector of employment for own-account workers (subsidiary
agriculture vs. other activities), and hours and type of work for wage employees. Six of the nine
classes (marked in yellow) are attributed to non-standard employment, and the remaining three
classes refer to standard employment.
4 When discussing the quality of jobs based on LFS data, we omit important information on wages and wage arrears,
which is missing in the LFS. There is no alternative data source in Ukraine except for the ULMS (Ukrainian
Longitudinal Monitoring Survey) that would provide micro-level data on important job characteristics and wages
simultaneously.
7.1 7.9
12.9 14.5
15.0 11.2
4.1 3.1
11.3 15.03.0 1.013.3 11.8
15.411.6
17.7 23.9
0%
25%
50%
75%
100%
2000 2011
Elementary occupations
Plant and machine operators and assemblers
Craft and related workers
Skilled agricultural and fishery workers
Service workers and shop and market sales
Clerks
Technicians and associate professionals
Professionals
Legislators, senior officials and managers
16
Figure 2.8. Typology of employment (thousands of people aged 15–70 years), 2010
Source: Own calculations based on LFS data.
21. The number of people in broadly defined non-standard employment—which includes
informally employed wage employees, own-account workers, employers, and unpaid family
helpers as well as wage employees engaged in at least one type of part-time work, temporary
work, or multiple jobholding5—grew from 5.1 million to 5.6 million between 2004 and 2010.
Over the same period, the number of people in standard employment decreased from 15.2
million to 14.7 million. These changes resulted in an increasing share of non-standard
employment from 25.1 percent in 2004 to 27.5 percent in 2010 (Figure 2.9).
5 The typology refers to the characteristics of a person’s main or only job. A wage employee is classified as a part-
time employee if he/she usually works less than 30 hours per week in the main job. Workers who were temporarily
absent from their job and were not sure about the possibility of returning to their employer in the next 6 months, are
also classified as part-time/temporary workers. As there is no information about the type of employment contract
and its duration, we define temporary workers according to their answer about involvement in temporary or casual
jobs during the reference week.
Total employment 20,266
Wage employment 16,434
Self-employment 3,745
Unpaid family helpers 87
Formal, full-time 13,916
Formal, part-time/ temp. 917
Informal 1,600
Own-account, farm, informal 2,767
Own-account, non-farm, formal 582
Own-account, non-farm, informal 188
Employers, formal 201
Employers, informal 7
17
Figure 2.9. Share of employed in non-standard employment by sex (percent), 2004-2010
Source: Own calculations based on LFS data.
Note: Non-standard employment includes informally employed wage employees, own-account workers, employers,
and unpaid family helpers as well as wage employees engaged in at least one type of part-time work, temporary
work, or multiple jobholding (marked in yellow in Figure 2.8).
22. The general shift away from full-time formal employment affected women and men
similarly over the observed period, but men were always more likely to have a non-standard
form of employment than women. This finding is supported by the estimation results of the
multivariate probit model (Table A.1 in the Annex). However, this finding for Ukraine
contradicts the findings of a similar analysis undertaken by the ILO for 19 European economies
and Russia (ILO, 2012), according to which women, on average, have a higher probability of
non-standard employment.
23. Apart from sex, the other important determinants of non-standard employment in Ukraine
are age, marital status, human capital (education and skill level), place of residence, and sector of
employment. Youth; persons of retirement and pre-retirement age; married and divorced
individuals; rural residents living in the Western, Central, and Northern regions; and those
holding unskilled jobs in agriculture or construction have a higher probability of being employed
in non-standard jobs (Table A.1 in the Annex). Surprisingly, higher education does not provide
the expected pay-off in the form of more secure standard jobs. Although the incidence of non-
standard employment is found to decrease with the level of education in the univariate analysis
(60.4 percent among the least educated compared with 15.2 percent among the highly educated
in 2010), higher-educated workers appear to be more likely to engage in non-standard
employment than their least-educated counterparts when the other relevant factors are taken into
account.
24. Due to the existing skills mismatch, age discrimination, and lack of decent work
opportunities, Ukrainian workers have a high probability of ending up taking badly paid survival
jobs that do not correspond to their qualifications. According to data from the sociological
monitoring conducted by the Institute of Sociology of the NASU, relatively more people believe
that it is easy to find any job in their place of residence or a job that corresponds to their
qualifications but offers a salary that is not sufficient for a normal life (Figure 2.10). At the same
time, a significantly smaller share of respondents think that it is easy to find a job with sufficient
salary, particularly one that also corresponds to their qualifications. Comparison of these shares
21
22
23
24
25
26
27
28
29
30
2004 2005 2006 2007 2008 2009 2010
% o
f e
mp
loye
d p
op
ula
tio
n
age
d 1
5-7
0 y
ear
s
Both sexes
Women
Men
18
with those in 2008 reveals a sharp decrease in the availability of jobs; this might be attributed to
the economic crisis, which hit all regions in Ukraine. Nevertheless, according to the focus group
discussions, there are persistent regional differences in terms of the availability of jobs with
different characteristics: it seems relatively easier to find any job in the Eastern region, whereas
the Center, owing to Kyiv City, provides relatively more opportunities with decent pay. The
West is a lagging region in all respects, particularly in terms of how easy it is to find a job that
corresponds to individuals’ qualifications and offers decent pay.
Figure 2.10. Ease of finding a job in the place of residence according to people's perceptions by region, 2010
Source: Sociological Monitoring of the Institute of Sociology of NASU, own calculations.
Note: The figure shows the share of respondents who gave the answer "Easy" on the question "Is it difficult to find a
job in your place of residence?"
25. Young people appear to be relatively more optimistic than their older counterparts with
respect to the easiness of finding any job in their place of residence (Figure 2.11) but they
encounter significant difficulties in finding a first significant job that would correspond to their
field of study. According to the European Training Foundation (ETF) study of transitions from
school to work (ETF, 2008), about half of young college and university graduates holding their
first significant job after leaving education were overqualified for their job. Because so many
college and university graduates are not finding jobs in their fields of study, the value of tertiary
education has come into question as the return on investment is not as high as it should be.
0
5
10
15
20
25
Total West Center South East
%
Any job
Corresponds to qualifications, insufficient salary
Sufficient salary, does not correspond to qualifications
Sufficient salary, corresponds to qualifications
19
Figure 2.11. Ease of finding a job in the place of residence according to people's perceptions by age group,
2010
Source: Sociological Monitoring of the Institute of Sociology of NASU, own calculations.
Note: The figure shows the share of respondents who gave the answer "Easy" on the question "Is it difficult to find a
job in your place of residence?"
26. Meanwhile, many young people cannot find any job in Ukraine. In 2011, on average 18.6
percent of economically active people aged 15–24 years were unemployed, which is twice as
many as those among the 25-29 years age group. Although the youth unemployment rate
decreased significantly in 2000-2007 against the background of an improving situation in the
labor market, along with a shrinking working-age population, it increased again in the aftermath
of the economic crisis in 2008-2009 (Figure 2.12). The gap between unemployment rates for
youth and for the total population aged 15 to 70 (an indicator known as the youth-to-total
unemployment rates ratio) widened from 1.95 in 2007 to 2.35 in 2011. Young people living in
urban areas are significantly more likely to be unemployed than their rural counterparts.
However, rural (youth) unemployment would be also serious if most rural households did not use
their land as a last resort for survival.
0
5
10
15
20
25
30
Total 15-24 25-29 30-39 40-49 50-59 60+
%
Any job
Corresponds to qualifications, insufficient salary
Sufficient salary, does not correspond to qualifications
Sufficient salary, corresponds to qualifications
20
Figure 2.12. Total and youth unemployment rate, 2000-2011
Source: State Statistics Service of Ukraine.
27. The unemployment rate tends to be lower among university graduates with complete
higher education (master's or specialist's degree) but not among graduates of universities and
colleges with only basic higher education (bachelor's degree). Bachelor's degree holders appear
to have a much higher unemployment rate (20.1 percent in 2011) not only compared with
master's degree holders (6.7 percent), but also compared with lower educated individuals (e.g.,
6.9 percent among those with basic general or vocational secondary education). This can be
explained by fairly low demand in Ukraine for young individuals with a bachelor’s degree; they
are not considered by local employers as persons with complete higher education (compared
with holders of a specialist’s or master’s degree). The lack of part-time jobs available to students
with a bachelor’s degree who are currently pursuing their studies toward a master’s degree may
also be an explanation. In addition, individuals with lower levels of education and no specific
skills have lower reservation wages and better employment opportunities both in Ukraine and
abroad.
28. Non-standard employment and high unemployment are not the only problems faced by
young people in Ukraine. Another problem is discouragement, which is defined according to a
broad definition, i.e., including not only workers who searched for a job and despaired of
success, but also those who did not know how or where to look for a job, or believed that there
was no suitable job, and those who hoped to come back to previous work, including seasonal
work. Discouragement is a fairly widespread phenomenon among young people—11.6 percent
of all inactive young persons aged 15-24 years who were not in education or training in 2011
compared with 10.9 percent in 2008.
29. Another worrisome development is the decreasing labor force participation rate of the
population aged under-40 years, particularly in urban areas (Table A.2 in the Annex). Decreased
labor force participation of young men is reflected in an increase in the number of young
pensioners, those involved in unpaid household work, and those believing that there are no
suitable jobs for them. This may be attributed to the lack of decent work opportunities, which
was reinforced during the global economic crisis, as well as low work motivation and changing
gender and family roles. Similarly, young women may have become less active in their job
search efforts because they were pursuing education in colleges and universities, but more
importantly due to household work and care responsibilities, which are often encouraged by
0
5
10
15
20
25
30
2000 2001 2002 2003 2004 2005 2006 2007 2008 2009 2010 2011
% o
f la
bo
r fo
rce
Total (15-70) Youth (15-24)
21
generous childbirth benefits and limited access to high-quality childcare facilities. Such idleness
and free-riding by young people undermines the welfare state and raises issues of
intergenerational equity and contracts. In contrast, older people of retirement age have become
more active over time, probably due to decreasing pensions in real terms and increasing pressure
to support the younger generations (children and grandchildren).
30. Overall, more than 4.5 million people of working age and who were most likely able and
ready to work under favorable conditions did not work in 2011 because of unsuccessful job
search (unemployment and discouragement) or because of engagement in household work and
dependency (Table 2.1). In addition, according to the official employment statistics based on the
survey of enterprises and organizations with at least 10 employees, on average 189,500
employees were on unpaid administrative leave in 2011 and 908,900 workers were employed
part-time for economic reasons. This huge labor underutilization seriously affects the growth and
development potential of the Ukrainian economy in the context of its depopulating and aging
society.
Table 2.1. The labor force and its underutilization (in thousands of people aged 15-70 years), 2000-2011
Year
Total
population
Labor
force Employed
Unemployed
(1)
Discouraged
(2)
Engaged in
household
work and
dependents
(3)
Labor underutilization
Number,
(1)+(2)+(3)
As % of
[labor
force +(2)
+(3)]
2000 36149.2 22830.8 20175.0 2655.8 719.2 1544.9 4919.9 19.6
2001 36022.1 22426.5 19971.5 2455.0 856.5 1481.9 4793.4 19.4
2002 35899.4 22231.9 20091.2 2140.7 820.1 1476.1 4436.8 18.1
2003 35858.9 22171.3 20163.3 2008.0 766.5 1450.9 4225.4 17.3
2004 35825.3 22202.4 20295.7 1906.7 776.5 1702.9 4386.1 17.8
2005 35840.5 22280.8 20680.0 1600.8 650.9 2006.8 4258.5 17.1
2006 35787.5 22245.4 20730.4 1515.0 460.4 2220.9 4196.3 16.8
2007 35634.3 22322.3 20904.7 1417.6 372.7 2263.0 4053.4 16.2
2008 35368.5 22397.4 20972.3 1425.1 324.3 2295.9 4045.3 16.2
2009 34973.3 22150.3 20191.5 1958.8 436.0 2385.1 4779.9 19.1
2010 34627.1 22051.6 20266.0 1785.6 364.7 2452.2 4602.5 18.5
2011 34322.4 22056.9 20324.2 1732.7 269.8 2551.2 4553.8 18.3
Source: State Statistics Service of Ukraine (based on LFS), own calculations.
Note: "Discouraged" includes workers who searched for a job and despaired of success as well as those who did not
know how or where to look for a job, believed that there were no suitable jobs, or those who hoped to come back to
previous work, including seasonal workers.
31. The mobility of working-age Ukrainians between labor market statuses is fairly low: 95.6
percent of people who were employed in 2009 were also employed in 2010, and 90.8 percent of
inactive people in 2009 were also inactive in 2010.6 Much fewer people remained in the status of
6 For this analysis, we use micro data from the Labor Force Survey (LFS) with a rotating panel. In the Ukrainian
LFS, each sampled person was interviewed a maximum of six times: in three consecutive months of the year t and
22
unemployment over a year but their share increased significantly in 2009-2010 compared with
earlier years (Table 2.2). The probabilities of transition from employment to unemployment and
from unemployment into employment also reversed their positive trends in 2009-2010,
suggesting that labor market prospects for Ukrainians worsened in the aftermath of the economic
crisis. Inactivity is frequently used in Ukraine as an alternative status to unemployment during
job losses and voluntary periods out of work: more than 3.5 percent of those employed in 2009
moved to inactivity in 2010, compared with 0.8 percent of those who moved to unemployment,
and 21.5 percent of those previously unemployed who moved to inactivity. During 2004-2006,
inactivity played an even more important role in absorbing both previously employed and
unemployed individuals.
Table 2.2. Transitions between three labor market statuses (percent), 2004-2010
Period PEE PEU PEN PUE PUU PUN PNE PNU PNN
2004-2005 92.5 1.0 6.6 45.4 25.6 29.1 12.4 1.3 86.3
2005-2006 94.8 0.7 4.5 46.9 27.6 25.5 11.4 1.0 87.6
2006-2007 95.9 0.6 3.5 49.5 25.5 25.1 10.1 0.8 89.2
2007-2008 96.5 0.5 3.0 50.1 24.5 25.4 7.1 0.7 92.3
2009-2010 95.6 0.8 3.5 48.1 30.4 21.5 8.5 0.8 90.8
Source: Own calculations based on LFS data.
Note: Period 2008-2009 is skipped here because of significant changes in the sample design in May 2008. Pij is the
probability of transition from status i in year t to status j in year t+1 multiplied by 100, where E stands for
employment, U for unemployment, and N for inactivity. See footnote 6 for definitions of transition probabilities.
32. Analysis of transitions across four statuses with disaggregated employment into standard
and non-standard types reveals large churning between non-standard employment and non-
employment status (unemployment and inactivity), which is reflected by large flows between
them (Table 2.3). More than 40 percent of the unemployed took a job in non-standard
employment or moved to inactivity over the year, while only slightly more than one-fourth of the
previously unemployed (26.9 percent in 2009-2010) entered a formal sector job in standard
employment. Previously inactive persons including young newcomers to the labor market were
much more likely to end up in non-standard employment (5.5 percent) than in standard
employment (2.9 percent) or unemployment (0.8 percent). The striking development between
2004-2005 and 2009-2010 was a significant increase in the share of the employed who got stuck
in non-standard employment for a year or more (from 65.9 to 82.7 percent); the probability of
moving to standard employment was almost halved.
then in the same months of the year t+1. It is therefore possible to compute year-to-year flow statistics comparing
the labor market situation of the sample people in years t and t+1. Selecting one observation per one person (first
observation with a complete pair of year-to-year flows) and applying monthly weights for the base period, we
calculated transition probabilities in the same manner as for the panel data utilizing Markovian flow analysis
(Bellmann et al., 1995). The transition probability from labor market status i in year t to labor market status j in year
t+1 is equal to Pij=Fij/Si, where Fij stands for the number of individuals observed in status i in year t and in status j in
year t+1, and Si is the stock of individuals in status i in the initial period. The estimates are not corrected for the
potential problems of attrition, misclassification, and round-tripping.
23
Table 2.3. Transitions between four labor market statuses (percent), 2004-2005 vs. 2009-2010
Status in year t
Status in year t+1
Standard
employment
Non-standard
employment Unemployment Inactivity
2004-2005
Standard employment 92.8 3.6 0.9 2.8
Non-standard employment 15.6 65.9 1.2 17.3
Unemployment 24.9 20.4 25.6 29.1
Inactivity 3.4 8.9 1.3 86.3
2009-2010
Standard employment 95.7 1.7 0.8 1.9
Non-standard employment 8.0 82.7 1.0 8.2
Unemployment 26.9 21.2 30.4 21.5
Inactivity 2.9 5.5 0.8 90.8
Source: Own calculations based on LFS data.
Note: Non-standard employment includes informally employed wage employees, own-account workers, employers,
and unpaid family helpers as well as wage employees engaged in at least one of the following: part-time work,
temporary work, or multiple jobholding. See footnote 6 for definitions of transition probabilities.
33. The comparison of transition probabilities for various socio-demographic groups (Table
A.3 in the Annex) indicates that there are considerable differences in transition rates between the
two types of employment and the two non-employment statuses across gender, age, and
education groups. Yet the most striking differences are among rural and urban residents. The
rural population has significantly higher probabilities of moving from any other status to non-
standard employment and significantly lower probabilities of moving into standard employment.
Similar patterns are observed for unskilled workers with basic secondary or a lower level of
education.
34. Therefore, development of the Ukrainian labor market that seems beneficial at first
glance—with a slight rise in absolute employment numbers and a relatively low unemployment
rate, particularly in rural areas and among unskilled workers—might actually be quite worrisome
for Ukrainian policymakers. A great share of the observed improvement in the labor market
indicators seems to be caused by the increase in precarious employment relationships.
35. This labor market situation requires a change in the jobs policy approach—away from free-
hand adjustment of the population to the transformation shocks to concerted structural and labor
market reforms aimed at boosting job quality. Improvements in job quality will reward Ukraine
with a more solid basis for growth and development, better productivity performance in the
official economy, and declining risk of social unrest. This is particularly important for
counterbalancing the negative impacts of aging.
36. Aging also puts a toll on internal mobility. The spatial mobility of Ukrainians within the
country is fairly low, in spite of large disparities in income and labor market outcomes across
regions (World Bank, 2012). In addition, migrants do not necessarily choose regions with better
labor market conditions. Often they are motivated to move to regions with similar economic and
human development for various non-economic reasons. In view of high migration costs and other
barriers, workers often use temporary labor migration and commuting as a substitute for

24
residential migration. Evidence also shows that some Ukrainians living in bordering regions and
with strong connections abroad (social capital) are more inclined to find temporary employment
abroad than within Ukraine. They motivate their choice explaining that there is no sense in
"trading bad for worse" in moving to some other part of Ukraine. Low and inefficient internal
labor mobility does not lead to a desired labor reallocation in the economy and therefore still
plays a limited role in productivity gains and improvements in the living standards of the
population.
25
3. Jobs and living standards
3.1. Jobs, poverty, and subjective well-being: The individual perspective
37. Like in many other countries, labor activities (wage employment, entrepreneurial activity,
and subsistence agriculture) are the major source of household income in Ukraine (Figure 3.1.).
The share of wages alone in the average monthly household money income increased from 54.6
to 56.9 percent between 2000 and 2007 and then declined to 54.9 percent in 2011. As expected,
wages play a more significant role in urban households than in their rural counterparts, which
relied heavily on income from the sale of agricultural goods at the beginning of the 2000s.
However, income from subsistence agriculture was crowded out by increasing public transfers
and, as a consequence, it lost its share and relative importance in rural areas (from 24.9 percent
in 2000 to 12.2 percent in 2010). Entrepreneurial income is significantly less important for
Ukrainian households than wages and various transfers due to a low incidence of medium and
large-scale businesses and low earnings of self-employed workers. But its relative importance
increased from 3.5 percent of average monthly household income in 2000 to 5.3 percent in 2011.
Figure 3.1. Composition of average monthly household money income (percent) in 2000, 2007, and 2011
Source: State Statistics Service of Ukraine.
38. Due to substantial increases in the statutory minimum wage, positive returns to economic
growth in 2001-2008, and gradual wage increases in the public sector, average monthly wages
went up substantially, both in real terms and relative to the statutory subsistence minimum for
the population able to work (Figure 3.2).7 Wage increases, combined with increases in social
transfers and growing remittances from migrant workers, had a positive effect on household
income and expenditures and contributed to a significant reduction in absolute poverty and
income inequality (World Bank, 2005 and 2007b; UNDP, 2010).
7 The statutory subsistence minimum for the population able to work is equal to the monthly minimum wage since
November 2009.
54.6 61.9
34.5
56.9 62.7
40.154.9 59.7
41.1
3.53.9
2.5
5.96.3
4.7
5.35.4
4.7
7.8
24.9
4.0
14.4
3.6
12.2
23.3 22.3 26.425.8 23.5
32.4 28.3 26.633.3
10.8 10.4 11.7 7.4 7.1 8.4 7.9 7.8 8.7
0%
25%
50%
75%
100%
Total 2000
Urban 2000
Rural 2000
Total 2007
Urban 2007
Rural 2007
Total 2011
Urban 2011
Rural 2011
WagesEntrepreneurial incomeIncome from sale of agricultural goods produced by householdPublic transfers (pension, stipend and social assistance)Private transfers and other income
26
Figure 3.2. Indicators of monthly wages, 2001-2011
Source: State Statistics Service of Ukraine, Laws on the State Budget of Ukraine, own calculations.
39. Yet average wages according to the official statistics of the State Statistics Service of
Ukraine are very low in absolute terms (UAH 3,054 or USD 381.75 for December 2011), and
there is no reliable information about average wages that takes into account the existing
measurement problems.8 Ukraine lags behind not only developed countries, but also most
transition economies in the Europe and Central Asia region in terms of gross average monthly
wages (Figure 3.3). Existing wage differentials and demand for Ukrainian workers abroad,
particularly in the aging European countries and Russia, encourage thousands of Ukrainians to
look for better employment and income opportunities abroad. Although international labor
migration is likely to have positive development effects through remittances, return migration,
and Diaspora involvement, recent studies show that these effects have not been fully utilized in
Ukraine so far (Malynovska, 2011; Kupets, 2011a and 2012a).
8 Average gross monthly wages are calculated in Ukraine as the total monthly wage bill divided by the average listed
number of all employees including both full-time and part-time workers. The information is presented for employees
working in enterprises and organizations with at least ten employees and therefore it does not cover employees
working in micro-enterprises or for entrepreneurs-physical persons. Given that many Ukrainian employers under-
declare their wage bill for tax and social security purposes, despite being formal in other senses, and pay some
proportion of wages cash-in-hand (so-called envelope wages); some others avoid regular payroll taxes through
contracting of individual entrepreneurs within the simplified tax system; and many others evade taxes by not
declaring jobs and income, the wage data based on official statistics should be interpreted with caution.
0
50
100
150
200
250
300
350
400
450
Jan
Jun
No
v
Ap
r
Sep
Feb
Jul
De
c
May
Oct
Mar
Au
g
Jan
Jun
No
v
Ap
r
Sep
Feb
Jul
De
c
May
Oct
Mar
Au
g
Jan
Jun
No
v
2001 2002 2003 2004 2005 2006 2007 2008 2009 2010 2011
Average wage to subsistence minimum (%)
Minimum wage to subsistence minimum (%)
Real wage index (Jan 2001=100)
27
Figure 3.3. Gross average monthly wages in Ukraine and selected countries, 2010
Source: UNECE Statistical Division Database.
40. Examining the determinants of differences in average monthly wages adjusted for
purchasing power parity between transition economies in 2005-2008, Kupets (2011b) finds that
low wages in Ukraine may be explained not only by lower average labor productivity and higher
share of agriculture in GDP (used as a proxy for technological development), but also by limited
labor freedom and slow progress in market-oriented reforms (measured by the EBRD transition
index).9 The author concludes that in order to produce sustainable wage increases at the levels of
more advanced transition economies without loss of the country's competitiveness, Ukraine
should accelerate its pace of structural and institutional reforms, including reforming the rigid
employment protection legislation inherited from the Soviet Union. Another important issue for
Ukraine’s competitiveness is to promote greater productivity in the public sector through a
combination of institutional reforms and the rationalization of employment, so that the sector can
offer competitive wages without further increases in the wage bill and crowding out necessary
spending on equipment and new capital investment (Raiser, 2007).
41. Furthermore, there are still many workers who earn less than the minimum wage per
month. Of 7.5 million officially registered workers who worked full-time in December 2011,
117,500 (or 1.6 percent of full-time employees) had a gross monthly wage at about the statutory
subsistence minimum for the population able to work (UAH 1,004). In many sectors—such as
fishing, agriculture, manufacturing of textiles and wood products, construction, education, health
care, culture, and sports—this proportion was even larger. In line with the ILO definition of the
working poor as people whose earnings leave them unable to afford to lift themselves and their
families above the poverty threshold (ILO, 2005, p. 26), these workers could be classified as
working poor if they do not have other income, including envelope wages, social assistance, or
income from other household members.10
Only 11 percent of employees who worked at least 50
9 Distortion of wage data by underreporting and other statistical problems were also mentioned by the author but not
taken into account in the regression analysis. 10
The ILO concept of working poverty includes the whole family and not only working individuals (ILO, 2005).
The comparable estimates of working poverty taking into account the household structure and standard poverty
threshold (US$1.25 or US$2 a day) are not available for Ukraine (see:
0
500
1000
1500
2000
2500
3000
3500
4000
4500U
SD, a
t cu
rre
nt e
xch
ange
rat
es
28
percent of working time in December 2011 earned more than UAH 5,000 per month (before
income tax and social security deductions).
42. Overall, earnings are not distributed equally in Ukraine, with large differentials between
and within regions, sectors, state and private companies, women and men, young and old
individuals, and unskilled and highly skilled workers. For example, the average gross wage in
Kyiv City is several times larger than in Ternopil oblast (UAH 4012 vs. UAH 1871 in 2011);
men earn on average 25.1 percent more than women (UAH 3035 vs. UAH 2272 in 2011); the
declared average wages of staff employees in state enterprises and open joint stock companies
are more than twice as large as the average wages of those employed in small private enterprises
(UAH 3329, UAH 3342, and UAH 1512 respectively in 2011); and employees in air transport
earn significantly more than fishermen (UAH 8742 vs. UAH 1369 in 2011).
43. Multivariate analysis of the determinants of individual earnings based on micro data from
the Ukrainian Longitudinal Monitoring Survey shows that education significantly affects
individual earnings but returns to education are on average relatively low in Ukraine, at around 6
percent per year of adjusted education (Coupé and Vakhitova, 2011). Meanwhile, women have
significantly higher returns per year of education than men (7.4 vs. 4.5 percent in 2007). The
other important determinants of wages in Ukraine are age (or experience, with the expected
concave relationship), place of residence, sector of employment, size of firm (larger firms pay
higher wages), and ownership type (foreign-owned firms pay the highest wages ceteris paribus,
followed by private firms, while the state sector has the lowest wages) (Coupé and Vakhitova,
2011; Gorodnichenko and Sabirianova Peter, 2005). Lehmann et al. (2005) find no wage
premium for being a trade union member but a marginally significant and positive premium for
working in the informal sector; based on the latter finding, the authors conclude that workers
might be “pulled” into good opportunities that exist in the informal sector. A recent empirical
study by Constant et al. (2011) reveals that ethnicity, manifested via language, also significantly
affects individual earnings in Ukraine: Russian-speaking workers enjoy a wage premium in the
local labor market although the official language in Ukraine is Ukrainian.
44. Specific adjustment mechanisms frequently used by Ukrainian employers, such as wage
arrears and "envelope wages," accentuate the problem of fairly low wages and uneven
differentiation. As of January 1, 2012, the amount of wage arrears was more than UAH 977
million, or 3 percent of the total wage bill in December 2011, with the bulk (44.6 percent)
accumulated in economically active enterprises and organizations. There are no official statistics
about the magnitude or the incidence of under-declared income (i.e., envelope wages); but
according to the public opinion poll performed by the Razumkov Centre Sociological Service in
April 2010, 29.8 percent of respondents reported that the practice of wage payment "in
envelopes" was widespread in their region of residence, another 36.2 percent considered it as
rather widespread, and only 14.6 percent reported that there were only infrequent cases, or this
was not the case at all. Polled experts appeared to be even less optimistic: 44.3 percent of them
reported that the practice of "envelope wages" was very widespread in their region. Furthermore,
a significant share of respondents (45 percent among surveyed individuals and 43.4 percent
among experts) did not believe that Ukrainians would exchange wages "in envelopes" for wider
social guarantees (UCEPS, 2010).
http://kilm.ilo.org/KILMnet/view.asp?t=Table 18b Working poverty (national estimates, by sex and age
group)&I=K18b&C=*&Y=*&S=|1|&P3=|0||1||2|). Estimates presented in the ILO country report (ILO, 2011, Table
3) refer to poverty in general rather than to working poverty.

29
45. Employment is an important source of household income, but it is not always likely to lift
people out of poverty because of underemployment, low wages, and unstable earnings of self-
employed workers, particularly of those engaged in subsistence agriculture. Estimates for 2008
show that every fourth household with children in which all adults were employed was classified
as poor according to the national methodology with relative criteria (UNDP, 2010, p. 13).
Although the highest poverty rates and risks of poverty have been observed among households
headed by the unemployed (World Bank, 2007; UNDP, 2010), about 44 percent of poor
Ukrainians lived in households headed by employees in 2008 (Table 3.1). Households headed by
employers were in a relatively better situation but still almost every fifth household headed by an
employer was poor (UNDP, 2010, p. 14).
Table 3.1. Composition of the poor by the economic status of the household head, 2008
Economic status
of the household head
Share of
households (%)
Share of poor
households (%)
Share of poor
population (%)
Employee 47.0 22.3 43.8
Employer 1.0 11.3 0.4
Unemployed 6.9 43.7 12.9
Pensioner 37.1 30.4 32.7
Source: UNDP (2010), Table 2.3.
46. The share of poor households defined according to the national methodology with absolute
poverty criteria (average per capita equivalent income at the level of the statutory subsistence
minimum) appears to be significantly larger among the households with at least one working
member than among households with no working members (Figure 3.4). This suggests that the
labor income of one working household member is not sufficient to lift the household members
out of poverty, and the more household members work the better, regardless of their age. Along
these lines, the reduced risk of income poverty in households with a larger share of elderly
(women aged over 55 years and men aged over 60 years), found by Brück et al. (2010) and
attributed by the authors to strong pension increases, may also be explained by the contribution
of working pensioners to household income through their labor income. According to the State
Statistics Service of Ukraine (SSSU, 2012a), of 10.6 million individuals receiving an old-age
pension at the end of 2011, 1.4 million (or more than 13 percent) were employed in enterprises
or organizations with at least 10 employees. Comparison of these figures with earlier years (e.g.,
2005) shows an increase in both numbers and shares of working pensioners.
30
Figure 3.4. The share of households with average per capita equivalent income lower than subsistence
minimum depending on the number of working members, 2011*
Source: State Statistics Service of Ukraine (Yearbook based on Household budget survey data).
Note: * Average subsistence minimum in 2011 was UAH 914.08.
47. As regards the subjective well-being of Ukrainian workers, job satisfaction increased
compared with the beginning of 2000 but it is still low (Table 3.2). Job satisfaction is higher
among better-off individuals with higher or incomplete higher education. Unexpectedly,
residents of poorer Western oblasts appear to be more satisfied with their jobs compared with
their counterparts living in more prosperous parts of Ukraine. This regional difference in
subjective assessments is attributed not so much to the differences in the type of jobs as to the
differences in the socio-psychological climate in those regions and the general satisfaction of
people with their life and situation in the country (UCEPS, 2010). Younger people (18-39) are
much less satisfied with their jobs than people of retirement age.
Table 3.2. Job satisfaction in Ukraine, 2000 vs. 2003 vs. 2010
Category Score
UKRAINE February 2000 5.18
November 2003 5.53
April 2010 5.65
REGIONS (2010) West 6
Center 5.59
South 5.19
East 5.8
AGE (2010) 18-29 5.62
30-39 5.62
40-49 5.72
50-59 5.65
60+ 6
EDUCATION (2010) Secondary and secondary vocational 5.44
Higher and incomplete higher 6.02
FINANCIAL STATUS (2010) Hardly make ends meet 5.09
Enough for buying food 5.63
Enough for life but the purchase of durables is difficult 5.55
Better off but not able to make some purchases 7.05
0
4
8
12
16
HH with one working member
HH with two working members
HH with three and more working
members
HH with no working members
All HH
%
Total income Money income
31
SOCIAL CLASS (2010) Middle 5.9
Lower 5.08
Source: Public opinion poll performed by the Razumkov Centre Sociological Service in April 2010 (UCEPS, 2010).
Note: Mean score based on a 10-point scale from 1 (dissatisfied) to 10 (satisfied). Of all respondents over 18 years
old, 50.4 percent had a job at the time of the interview.
48. According to the EBRD-World Bank Life in Transition Survey in 2010, Ukraine is among
ten countries at the bottom of the distribution in terms of the share of employees satisfied with
their job (Figure 3.5). Only 45.3 percent of the employed respondents were satisfied with their
job as a whole. Furthermore, less than 30 percent of Ukrainians who were generally satisfied
with their jobs were satisfied with their financial situation. By comparison, in Sweden the share
of workers satisfied with their job and financial situation was about 79 percent.
Figure 3.5. Job satisfaction in Ukraine and selected countries, 2010
Source: EBRD-World Bank Life in Transition Survey in 2010, own calculations.
Note: The proportion of employed respondents with definite answers who answered "Agree" and "Strongly agree"
on the question "All things considered, I am satisfied with my job as a whole."
49. Fewer Ukrainians are satisfied with their jobs not only because of low wages per se, but
also because they perceive the wages are unjust given their skills and efforts. According to the
International Social Survey Program, employed Ukrainians more often than workers from many
other countries evaluated the level of return for their work as very unjust (Figure 3.6). Of
surveyed Ukrainians, 47 percent considered their pay much less than just, compared with 9
percent in the United Kingdom and 11 percent in West Germany. Only 14 percent of Ukrainian
workers perceived their pay as just for their skills and efforts. Employees who perceive
unfairness in the workplace may experience feelings of under-appreciation and lack of respect
and recognition that may lead to lower levels of employee engagement and higher levels of
negative behaviors, and therefore lower production and performance levels.
0
10
20
30
40
50
60
70
80
90
Swe
de
nG
erm
any
Fran
ce UK
Uzb
eki
stan
Tajik
ista
nSl
ove
nia
Esto
nia
Latv
iaK
azak
hst
anB
ulg
aria
Cze
ch R
ep
ub
licC
roat
iaIt
aly
Po
lan
dM
on
golia
Ko
sovo
Turk
ey
FYR
Mac
ed
on
iaB
ela
rus
Slo
vaki
aR
uss
iaLi
thu
ania
Aze
rbai
jan
Alb
ania
Bo
snia
an
d …
Ukr
ain
eM
on
ten
egr
oK
yrgy
zsta
nSe
rbia
Mo
ldo
vaH
un
gary
Ro
man
iaG
eo
rgia
Arm
en
ia
%
32
Figure 3.6. Perception of workers about just pay for their job, 2009
Source: International Social Survey Program (ISSP), Module on Inequalities, 2009 (http://www.issp.org/), own
calculations.
Note: The question is formulated as follows: “Is your pay just? We are not asking about how much you would like to
earn—but what you feel is just given your skills and effort” (in percent of employed).
50. Comparative analysis of the main reasons for putting effort into work in 26 European
countries, including Ukraine and Russia, based on the data from the European Social Survey in
2010 reveals significant differences between Ukraine and developed countries (Table 3.3). The
most popular reasons for putting effort into work mentioned by half the respondents in Ukraine
is to keep their job or to get a higher wage or promotion, whereas the bulk of respondents in
developed countries do it to be satisfied with what they accomplish. Many Europeans from
better-off countries, both in terms of economic indicators and social cohesion, are also interested
in the usefulness of their work for other people or at least in interesting work tasks. The survey
shows that 2.5 percent of working Ukrainians do not put any effort into their work at all, whereas
this is not an issue for European societies. The distribution of motives for working harder among
the employed in Ukraine is an indication of the survival life course (just to keep a job and get a
higher wage) and limited orientation of workers toward more human and social development (to
be satisfied with doing the best, to have an interesting job, and to do useful work for other
people) that could carry an additional value for the society.
4741
29 2311
209 12 13
38
35
4448
40
46
3739
46
1422 25 28
45
32
50 4335
0
20
40
60
80
100
Ukraine Russia Poland Bulgaria West Germany
East Germany
UK US China
%
Much less than is just A little less than is just About just for me
33
Table 3.3. Main reasons for putting efforts into work in Europe and Ukraine (percentage of respondents),
2010
Country
Be satisfied
with what I
accomplish
Keep
my
job
My work is
useful for
other people
Get a higher
wage or
promotion
My work
tasks are
interesting
It is everyone's
duty to always
do their best
I do not put
effort into
my work
Sweden 56.9 4.4 16.1 2.8 14 5.4
Denmark 51.4 5.4 15 1.5 16.8 8.8 0.6
Spain 49.5 23.6 10.1 3 2.8 10.8
Finland 48.4 4.9 16.9 4.3 11.1 14.4
United
Kingdom 47.7 17 11.3 5.9 7.1 10 0.1
Slovenia 43.5 19.7 8.3 6.6 6.8 14 0.6
Germany 40.2 23.1 9.7 5 10.7 9.6 0.4
Switzerland 38.8 10.4 14.4 3.2 26.2 6.2
Ireland 37.8 30.3 13.1 4.8 6.2 6.9 0.3
Norway 37.1 5.9 18.2 3.4 26.8 7.8
Belgium 31.7 17.2 16.7 3.9 18.5 11.6
Portugal 30.2 41.7 10.3 3.4 3.7 8.6 0.2
France 29.9 15.7 15.2 2.6 27.1 9.2
Netherlands 29.8 8.7 20.2 4.1 25.3 10.1
Hungary 27.9 32.9 9.9 9.9 4.7 13.8 0.5
Poland 27 24.7 12.1 12.5 5.6 17.8
Bulgaria 18.2 36.7 8.8 17.8 7.4 10.3 0.5
Croatia 17.7 40.2 9.7 13 4.8 13.6 0.2
Israel 17.6 36.1 11.1 13.9 9.5 8.5 0.9
Russian
Federation 16.9 16.3 13.9 31.4 11.9 7 1.1
Slovakia 16.8 38.5 13 12.7 5.5 12.6
Ukraine 16.4 29.1 11 22.3 4.9 12.4 2.5
Cyprus 16.1 33.7 10.6 11.8 3.8 23.6 0.3
Estonia 15.4 16 17.7 20.1 12.7 15.1 1.5
Greece 14.2 45.6 13.3 4.1 5.8 16.2 0.4
Czech
Republic 13.7 43.6 8 16.8 9.4 6.6 1.2
Source: European Social Survey (ESS, 2010), own calculations.
Note: Distribution on the main reasons people personally put effort into their work as a percentage of those who
have a paid job.
51. In addition to the pay level and stability of work, the other most important characteristics
of jobs for Ukrainians are co-workers, working hours, visible results, and promotion
opportunities. There are noticeable changes in the workers' attitudes between 2000 and 2010
toward more importance of promotion opportunities and leisure time (convenient working hours,
long leave, and not very intensive work) and less importance of the content of work (Table 3.4).
Young people report more frequently than their older counterparts about individual job
characteristics such as promotion opportunities, interesting, prestigious, and responsible work
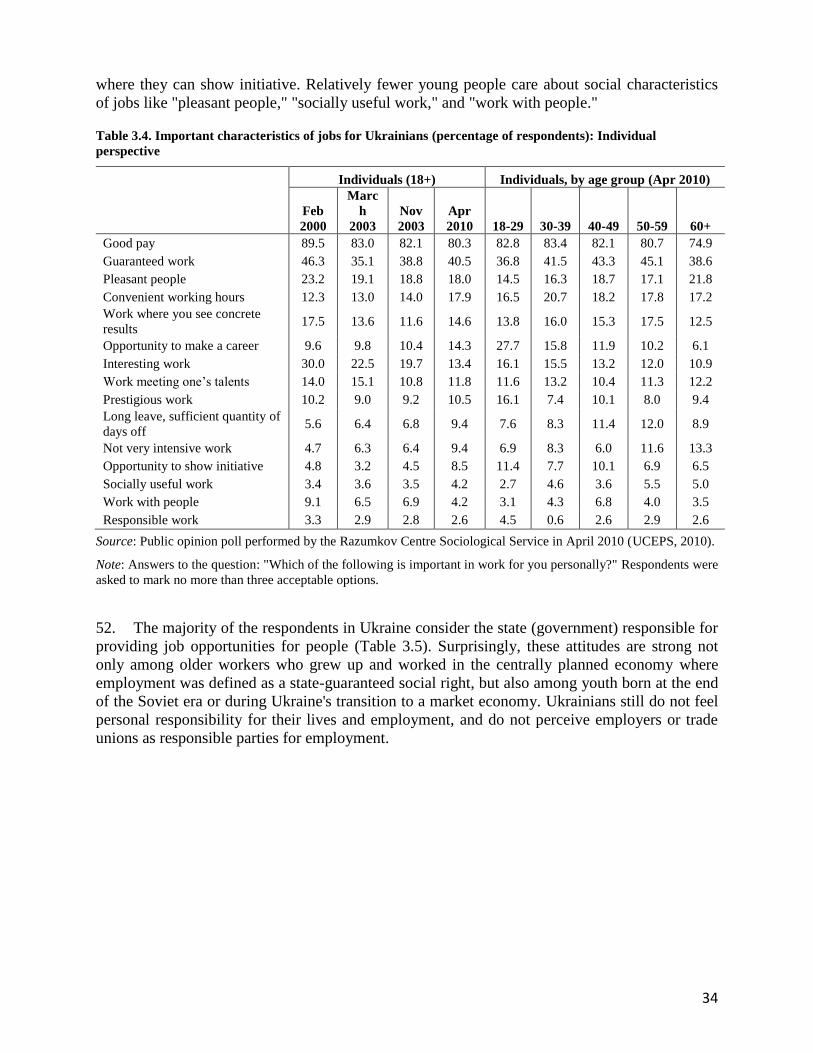
34
where they can show initiative. Relatively fewer young people care about social characteristics
of jobs like "pleasant people," "socially useful work," and "work with people."
Table 3.4. Important characteristics of jobs for Ukrainians (percentage of respondents): Individual
perspective
Individuals (18+) Individuals, by age group (Apr 2010)
Feb
2000
Marc
h
2003
Nov
2003
Apr
2010 18-29 30-39 40-49 50-59 60+
Good pay 89.5 83.0 82.1 80.3 82.8 83.4 82.1 80.7 74.9
Guaranteed work 46.3 35.1 38.8 40.5 36.8 41.5 43.3 45.1 38.6
Pleasant people 23.2 19.1 18.8 18.0 14.5 16.3 18.7 17.1 21.8
Convenient working hours 12.3 13.0 14.0 17.9 16.5 20.7 18.2 17.8 17.2
Work where you see concrete
results 17.5 13.6 11.6 14.6 13.8 16.0 15.3 17.5 12.5
Opportunity to make a career 9.6 9.8 10.4 14.3 27.7 15.8 11.9 10.2 6.1
Interesting work 30.0 22.5 19.7 13.4 16.1 15.5 13.2 12.0 10.9
Work meeting one’s talents 14.0 15.1 10.8 11.8 11.6 13.2 10.4 11.3 12.2
Prestigious work 10.2 9.0 9.2 10.5 16.1 7.4 10.1 8.0 9.4
Long leave, sufficient quantity of
days off 5.6 6.4 6.8 9.4 7.6 8.3 11.4 12.0 8.9
Not very intensive work 4.7 6.3 6.4 9.4 6.9 8.3 6.0 11.6 13.3
Opportunity to show initiative 4.8 3.2 4.5 8.5 11.4 7.7 10.1 6.9 6.5
Socially useful work 3.4 3.6 3.5 4.2 2.7 4.6 3.6 5.5 5.0
Work with people 9.1 6.5 6.9 4.2 3.1 4.3 6.8 4.0 3.5
Responsible work 3.3 2.9 2.8 2.6 4.5 0.6 2.6 2.9 2.6
Source: Public opinion poll performed by the Razumkov Centre Sociological Service in April 2010 (UCEPS, 2010).
Note: Answers to the question: "Which of the following is important in work for you personally?" Respondents were
asked to mark no more than three acceptable options.
52. The majority of the respondents in Ukraine consider the state (government) responsible for
providing job opportunities for people (Table 3.5). Surprisingly, these attitudes are strong not
only among older workers who grew up and worked in the centrally planned economy where
employment was defined as a state-guaranteed social right, but also among youth born at the end
of the Soviet era or during Ukraine's transition to a market economy. Ukrainians still do not feel
personal responsibility for their lives and employment, and do not perceive employers or trade
unions as responsible parties for employment.
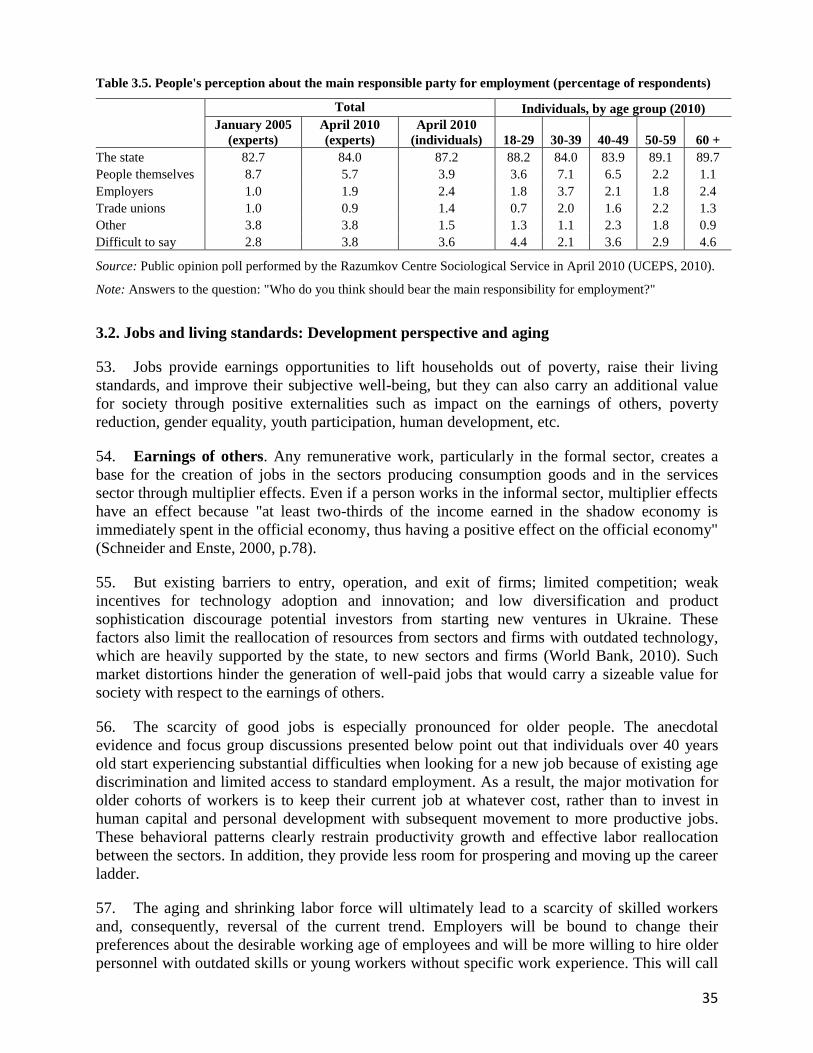
35
Table 3.5. People's perception about the main responsible party for employment (percentage of respondents)
Total Individuals, by age group (2010)
January 2005
(experts)
April 2010
(experts)
April 2010
(individuals) 18-29 30-39 40-49 50-59 60 +
The state 82.7 84.0 87.2 88.2 84.0 83.9 89.1 89.7
People themselves 8.7 5.7 3.9 3.6 7.1 6.5 2.2 1.1
Employers 1.0 1.9 2.4 1.8 3.7 2.1 1.8 2.4
Trade unions 1.0 0.9 1.4 0.7 2.0 1.6 2.2 1.3
Other 3.8 3.8 1.5 1.3 1.1 2.3 1.8 0.9
Difficult to say 2.8 3.8 3.6 4.4 2.1 3.6 2.9 4.6
Source: Public opinion poll performed by the Razumkov Centre Sociological Service in April 2010 (UCEPS, 2010).
Note: Answers to the question: "Who do you think should bear the main responsibility for employment?"
3.2. Jobs and living standards: Development perspective and aging
53. Jobs provide earnings opportunities to lift households out of poverty, raise their living
standards, and improve their subjective well-being, but they can also carry an additional value
for society through positive externalities such as impact on the earnings of others, poverty
reduction, gender equality, youth participation, human development, etc.
54. Earnings of others. Any remunerative work, particularly in the formal sector, creates a
base for the creation of jobs in the sectors producing consumption goods and in the services
sector through multiplier effects. Even if a person works in the informal sector, multiplier effects
have an effect because "at least two-thirds of the income earned in the shadow economy is
immediately spent in the official economy, thus having a positive effect on the official economy"
(Schneider and Enste, 2000, p.78).
55. But existing barriers to entry, operation, and exit of firms; limited competition; weak
incentives for technology adoption and innovation; and low diversification and product
sophistication discourage potential investors from starting new ventures in Ukraine. These
factors also limit the reallocation of resources from sectors and firms with outdated technology,
which are heavily supported by the state, to new sectors and firms (World Bank, 2010). Such
market distortions hinder the generation of well-paid jobs that would carry a sizeable value for
society with respect to the earnings of others.
56. The scarcity of good jobs is especially pronounced for older people. The anecdotal
evidence and focus group discussions presented below point out that individuals over 40 years
old start experiencing substantial difficulties when looking for a new job because of existing age
discrimination and limited access to standard employment. As a result, the major motivation for
older cohorts of workers is to keep their current job at whatever cost, rather than to invest in
human capital and personal development with subsequent movement to more productive jobs.
These behavioral patterns clearly restrain productivity growth and effective labor reallocation
between the sectors. In addition, they provide less room for prospering and moving up the career
ladder.
57. The aging and shrinking labor force will ultimately lead to a scarcity of skilled workers
and, consequently, reversal of the current trend. Employers will be bound to change their
preferences about the desirable working age of employees and will be more willing to hire older
personnel with outdated skills or young workers without specific work experience. This will call
36
for special policies to equip people with the necessary skills and to encourage investment in
lifelong learning.
58. One of the most important barriers in changing jobs is the low mobility of workers, both
occupational and spatial. The probability of moving to a new location is four times as high
among young workers (15-24 years old) compared with all other age groups (Kupets, 2012b).
Low mobility of older workers creates additional challenges for employers and social services in
the aging society as placement in new jobs in the future may fail unless relocation programs and
moving incentives are explicitly provided for the workers in older age cohorts.
59. Female employment, gender equality, and household decisions. Who gets the earnings
in the household and how they are subsequently spent can matter for the living standards of both
the current and the next generation as well. As the WDR on Gender Equity and Development
shows, jobs do influence women’s bargaining power within households and in society and
decrease women's risk of domestic violence (World Bank, 2011).
60. Female employment in Ukraine is traditionally high: 63.5 percent of women aged 15-54
years (working age according to Ukrainian legislation) were employed in 2011, compared with
69.3 percent among working-age men (15-59 years). Similar figures for a wider age group (15-
70 years) are 54.4 percent of women and 64.4 percent of men. The employment rate of Ukrainian
working-age women is higher than the European Union average (58.5 percent of women aged
15-64 years), whereas the gender gap is half as narrow (5.8 percentage points in Ukraine vs. 11.6
percentage points in the European Union). At the same time, Ukrainian women experience lower
unemployment than men (7.8 vs. 9.2 percent among working age labor force in 2011).
Nevertheless, there are pronounced gender inequalities in terms of working hours, access to top
positions and better paid jobs, quality of life after retirement, etc., reinforced by strong gender
stereotypes.11
61. Ukrainian society has a more traditional perception of gender roles compared with
European societies,12
and therefore more traditional attitudes toward female employment and
women’s access to jobs. For example, significantly more Ukrainians, regardless of their
employment status, consider that a woman should be prepared to cut down on paid work for the
sake of family and that men should have more rights to a job than women when jobs are scarce
(Figure 3.7). However, employed persons demonstrate less support for unequal rights of women
and men in their access to jobs as opposed to unemployed or inactive persons. Hence, higher
employment may be associated with more gender equality, and vice versa.
11
See more on gender inequalities in the Ukrainian labor market and the role of the Public Employment Service in
gender mainstreaming in Kupets (2010). 12
Here and in Figures 5.3 and 5.4, Europe includes all countries that participated in the European Social Survey in
2008 except for Russia and Ukraine: Belgium, Bulgaria, Switzerland, Cyprus, Czech Republic, Germany, Denmark,
Estonia, Spain, Finland, France, United Kingdom, Greece, Croatia, Hungary, Israel, Latvia, Netherlands, Norway,
Poland, Portugal, Romania, Sweden, Slovenia, Slovakia, and Turkey.
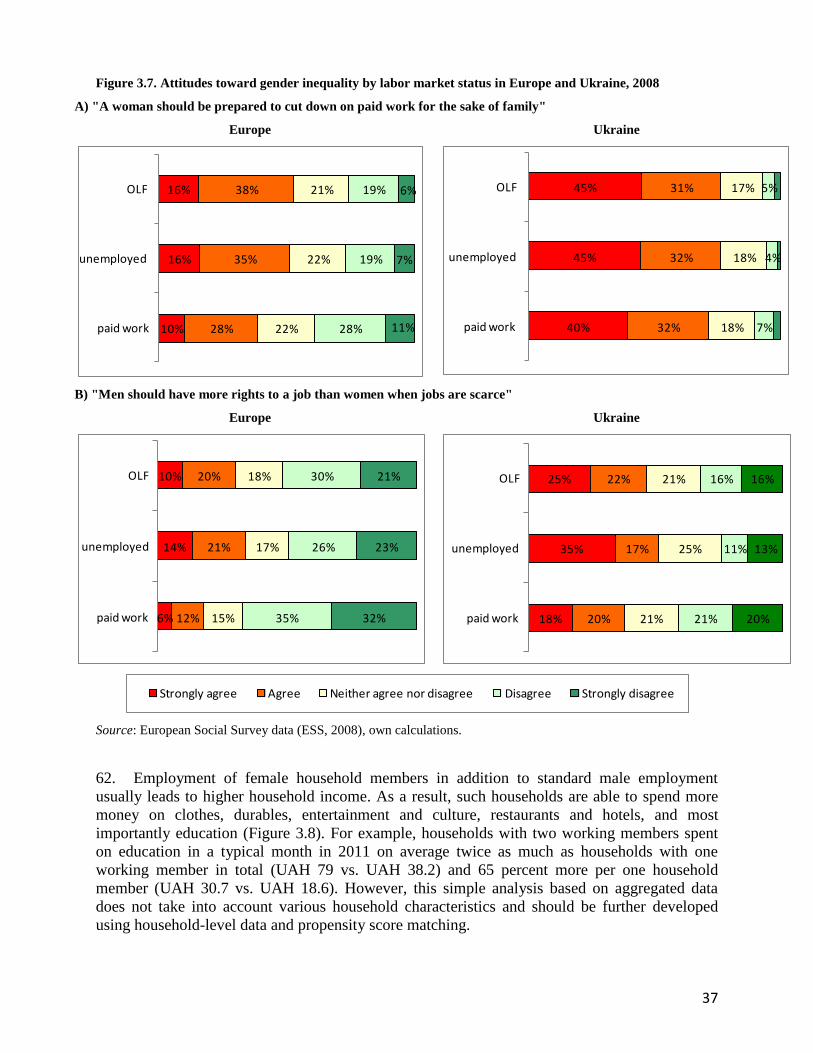
37
Figure 3.7. Attitudes toward gender inequality by labor market status in Europe and Ukraine, 2008
A) "A woman should be prepared to cut down on paid work for the sake of family"
Europe Ukraine
B) "Men should have more rights to a job than women when jobs are scarce"
Europe Ukraine
Source: European Social Survey data (ESS, 2008), own calculations.
62. Employment of female household members in addition to standard male employment
usually leads to higher household income. As a result, such households are able to spend more
money on clothes, durables, entertainment and culture, restaurants and hotels, and most
importantly education (Figure 3.8). For example, households with two working members spent
on education in a typical month in 2011 on average twice as much as households with one
working member in total (UAH 79 vs. UAH 38.2) and 65 percent more per one household
member (UAH 30.7 vs. UAH 18.6). However, this simple analysis based on aggregated data
does not take into account various household characteristics and should be further developed
using household-level data and propensity score matching.
10%
16%
16%
28%
35%
38%
22%
22%
21%
28%
19%
19%
11%
7%
6%
paid work
unemployed
OLF
40%
45%
45%
32%
32%
31%
18%
18%
17%
7%
4%
5%
paid work
unemployed
OLF
6%
14%
10%
12%
21%
20%
15%
17%
18%
35%
26%
30%
32%
23%
21%
paid work
unemployed
OLF
18%
35%
25%
20%
17%
22%
21%
25%
21%
21%
11%
16%
20%
13%
16%
paid work
unemployed
OLF
Strongly agree Agree Neither agree nor disagree Disagree Strongly disagree
38
Figure 3.8. Differences in per capita household money expenditures depending on the number of working
members in the household, 2011
Source: State Statistics Service of Ukraine (based on HBS), own calculations.
Note: The figure shows the percentage change in the average monthly per capita household
money expenditures on various items between households with two or more working members
(the second one is most likely a woman) and households with one working member (most likely,
a man). Per capita expenditures are calculated as average monthly household expenditures
divided by the average equivalent size of the household (2.05 persons for households with one
working member, 2.57 persons for households with two working members, and 3.22 persons for
households with three or more working members).
63. There are significant differences between women in terms of their having family and
children, work effort, and income. Career-oriented and highly educated women tend to have
lower fertility rates because of role incompatibility, greater opportunity costs, and preference for
career over children (Perelli-Harris, 2006 and 2008). Family-oriented women tend to have more
children and/or to stay on parental leave longer in view of the fact that available jobs in Ukraine
are often incompatible with childrearing and do not offer flexible working hours.
64. As numerous poverty studies in Ukraine show (see, among others, UNDP, 2010; World
Bank, 2007b), households with two or more children have a significantly higher risk of poverty,
particularly in rural areas. According to UNICEF (2010, p. 72-73), the poverty rate in families
with three or more children was 64.6 percent in 2007, compared with 27.3 percent for families
with one child and 40.6 percent for families with two children. Although employment of both
parents does not always ensure adequate well-being for their children and the family as a whole,
the presence of a non-working person of working age in a family with two children increases the
monetary poverty rate by more than 10 percentage points.
65. Furthermore, non-employment of one of the parents increases the deprivation-based
poverty rate by 9.4 percentage points in families with one child and by 11.9 percentage points in
families with two children (UNICEF, 2010, p. 101). Families with children face such
-30 -20 -10 0 10 20 30 40 50 60 70
Food and non-alcoholic beverages
Alcoholic beverages
Tobacco
Clothes and footwear
Housing
Durables
Health care
Transport
Communication
Entertainment and culture
Education
Restaurants and hotels
%
Three and more vs. one Two vs. one
39
deprivations as lack of accessibility to medical services (all families with children regardless of
place of residence) and social infrastructure facilities (particularly in rural areas), inability to buy
children’s clothes and footwear, inaccessibility of schools and professional education
(particularly in rural areas), and housing condition deprivations.
66. When women with children enter the labor force, they often face a wage penalty for their
motherhood. According to estimations based on the ULMS data (Sliusarenko, 2007), Ukrainian
women with only one child are found to earn 6.5 percent less than females without children, and
females with two or more children earn approximately 13.3 percent less.
67. Increasing costs of post-secondary and tertiary education and low education motivation
exacerbate the problem and further impede the social and labor market mobility of children
coming from poor households. With a poor educational background and no necessary
connections, they usually have a slim chance of finding a high-quality job in the primary labor
market and are more likely to end up with only low-skilled and low-paid jobs. This leads to a
conservation of poverty and further segmentation of the labor market, with inherent income
inequality, social exclusion, and deterioration of the stock of human capital.
68. Therefore, Ukraine faces a trade-off between better educated but less numerous children
coming from households with working females and a less educated but larger number of children
coming from households with non-working females and many children. In other words, there is a
trade-off between the quality and quantity of the future workforce but both dimensions are of
particular importance in the aging society.
69. Poverty reduction. By benefitting other categories of population through redistribution of
tax payments and social security contributions, formal sector jobs are likely to reduce poverty in
the country. However, as our analysis shows, decent employment in the formal sector in Ukraine
demonstrates a downward trend over the past years despite strong economic growth in 2001-
2008 (so-called jobless growth). Moreover, even formally employed people are often forced to
accept only minimum wage contracts, with the rest of their wages paid unofficially (in
envelopes).
70. One of the most important consequences of this negative trend is a decrease of effective
contributions to the Pension Fund and social insurance funds, which results in significant
worsening of the financial position of these funds and strains public finances. Pension
expenditures expressed as a share of GDP increased from around 9.2 percent in 2003 to about 18
percent in 2009, one of the highest in the world. Yet many pensioners receive a low pension in
nominal terms—the average pension benefit was UAH 1223.3 at the beginning of 2012. Of 13.8
million Pension Fund beneficiaries, more than 1.8 million people (or 13.1 percent) received a
pension at the subsistence minimum level for the non-working population or less (SSSU, 2012a),
and there is a lack of differentiation in pension benefits among the majority of pensioners.
71. Ukraine's aging population, with an inherent increase in the old-age dependency ratio,
along with its low retirement age, early retirement provision, extensive special pension regimes,
and compliance problems on the revenue side threaten the short-term fiscal viability and long-
term sustainability of the Pension Fund. It is estimated that by 2020 there will be almost one
pensioner for each contributor in the system, and the ratio will worsen sharply after that (World
Bank, 2010). This significantly increases the risk of poverty among the elderly, especially in the
next generation.
40
72. Declining employment in the formal sector is somewhat compensated by the growth of the
informal sector. Acting as a buffer, informal employment did help lift many individuals and their
households out of extreme poverty, but this is only a short-term solution. Since those employed
in the informal sector are very reluctant to make voluntary contributions to the social insurance
funds and the Pension Fund, whereas the savings rate in Ukraine is very low, they are very likely
to encounter severe poverty outcomes in the case of job loss and particularly when they approach
pension age.
73. There are several options for keeping the pension scheme balanced—increase workers’
pension contributions, decrease the replacement rate, increase the share of government
contributions (through an increase in tax contributions, not considered here), and raise the
pension age. According to Lisenkova (2011), an increase in the female pension age by 5 years to
match that of males (60 years), as suggested by the recent pension reform, would not be enough
to sustain the balance of the pay-as-you-go pension scheme without significant changes in the
other parameters. The effective rate of workers’ pension contributions would have to be
increased from 23 percent in 2007 to 39 percent by 2057,13
or the replacement rate would have to
decrease from 35 to 20 percent in the same period. The latter change would definitely increase
the risk of poverty among the elderly, whereas the former would increase the burden on the
employed younger cohorts. To lessen this burden on the population working in the formal sector,
it will be vital to broaden the contribution base through de-shadowing the economy, legalizing
all labor income, and introducing incentives for young workers to participate in the pension
system. The real challenge for policymakers is to increase public trust and renegotiate the
"intergenerational contract" that would reflect an adjustment to the realities of an aging society in
terms of resource distribution and thinking.
13
The effective workers’ contribution rate in 2007 is calculated based on the size of workers’ pension contributions,
taken from the balance of the pay-as-you-go pension scheme, and employees’ compensation, taken from the Social
Accounting Matrix (Lisenkova, 2011). The standard contribution rate to the Pension Fund is 35.2 percent of gross
wages since 2007 – 33.2 percent from the employer's side and 2 percent from the employee's side.
41
4. Jobs and productivity
4.1. Trajectories of labor and total factor productivity14
74. As has been discussed above, the pressure on the labor force in Ukraine is bound to
increase in the near future because of the gradual aging of the population. Under such
unfavorable demographic trends, boosting the productivity of available resources and achieving
high degrees of efficiency in the labor market will be key to counterbalancing the impact of
aging. This section focuses on the analysis of productivity patterns in recent years and possible
sources for increasing productivity.
75. The labor productivity measured here is the size-weighted average of the individual firm’s
real output divided by its full-time equivalent of employment. It demonstrated an upward trend
in all sectors over the period from 2001 to 2009 (Figure 4.1). The services sector15
has been the
clear leader in terms of productivity. Production of electricity, water, and gas (utilities) appears
to be another leader in productivity. However, the stories behind the reasons for such high
productivity in the leading sectors are quite different. The services sector was to a large extent
influenced by the opening of the markets to foreign services and, as a result, by an influx of
foreign capital, with foreign companies opening new banks, insurance companies, hotels, and
shopping malls. By contrast, the utilities sector has served mostly local markets, has been
subjected to natural monopolies, and has enjoyed substantial monopoly rents. At the same time,
all other sectors demonstrated more modest levels of productivity, although with positive
dynamics.
14
The analysis in this section is based on firm-level data for 2001-2009 from several statistical forms annually
submitted to the State Statistics Service by all commercial firms in the country. Public organizations financed from
the budget (such as most schools, hospitals, public administration, etc.), as well as commercial banks are not
included in the sample. Originally, there were more than 400,000 firms per year. However, firms that failed to report
positive levels of employment or output (and, therefore, were considered “not active”) were removed from the
productivity description. Hence, the number of firms varied between 200,000 and 250,000 per year. The data are
restricted and not available for public use. 15
The sectors are defined based on the NACE classification. The services sector includes wholesale and retail trade,
repair of motor vehicles, motorcycles and personal and household goods, hotels and restaurants, financial
intermediation, real estate, renting and business activities, private health care, private education and other services.
Utilities include electricity, gas and water supply. The names of other sectors coincide with those in the NACE
classification.
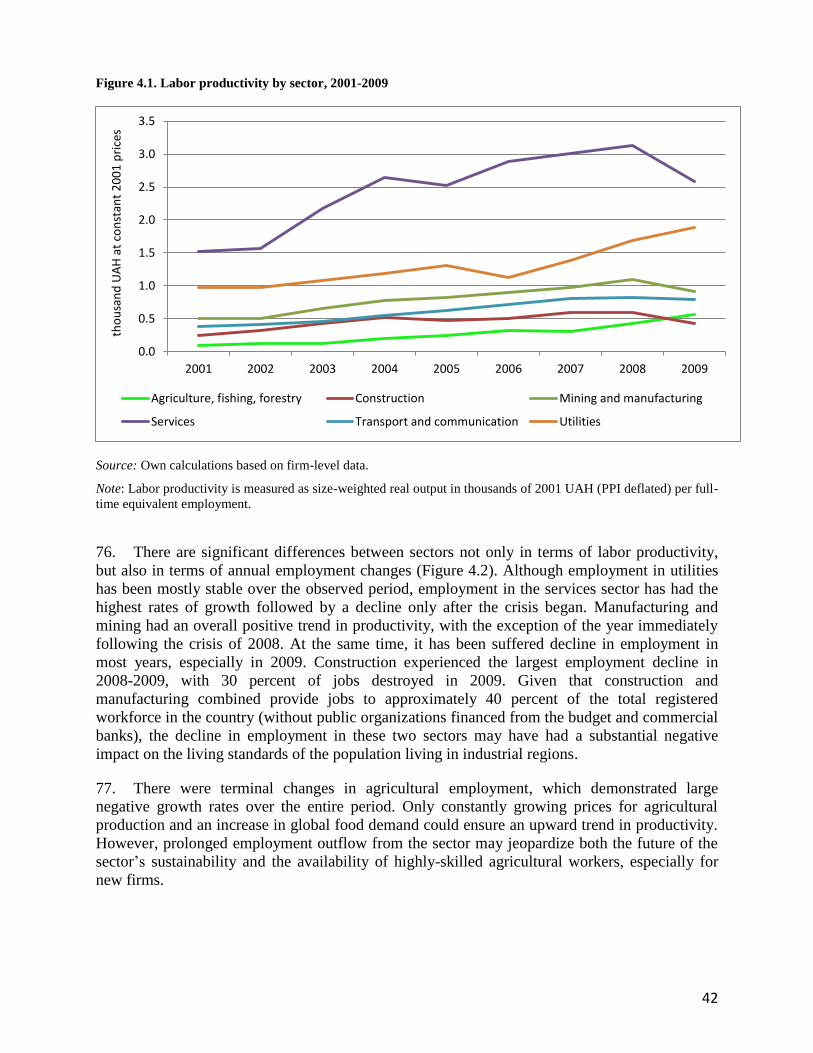
42
Figure 4.1. Labor productivity by sector, 2001-2009
Source: Own calculations based on firm-level data.
Note: Labor productivity is measured as size-weighted real output in thousands of 2001 UAH (PPI deflated) per full-
time equivalent employment.
76. There are significant differences between sectors not only in terms of labor productivity,
but also in terms of annual employment changes (Figure 4.2). Although employment in utilities
has been mostly stable over the observed period, employment in the services sector has had the
highest rates of growth followed by a decline only after the crisis began. Manufacturing and
mining had an overall positive trend in productivity, with the exception of the year immediately
following the crisis of 2008. At the same time, it has been suffered decline in employment in
most years, especially in 2009. Construction experienced the largest employment decline in
2008-2009, with 30 percent of jobs destroyed in 2009. Given that construction and
manufacturing combined provide jobs to approximately 40 percent of the total registered
workforce in the country (without public organizations financed from the budget and commercial
banks), the decline in employment in these two sectors may have had a substantial negative
impact on the living standards of the population living in industrial regions.
77. There were terminal changes in agricultural employment, which demonstrated large
negative growth rates over the entire period. Only constantly growing prices for agricultural
production and an increase in global food demand could ensure an upward trend in productivity.
However, prolonged employment outflow from the sector may jeopardize both the future of the
sector’s sustainability and the availability of highly-skilled agricultural workers, especially for
new firms.
0.0
0.5
1.0
1.5
2.0
2.5
3.0
3.5
2001 2002 2003 2004 2005 2006 2007 2008 2009
tho
usa
nd
UA
H a
t co
nst
ant
20
01
pri
ces
Agriculture, fishing, forestry Construction Mining and manufacturing
Services Transport and communication Utilities
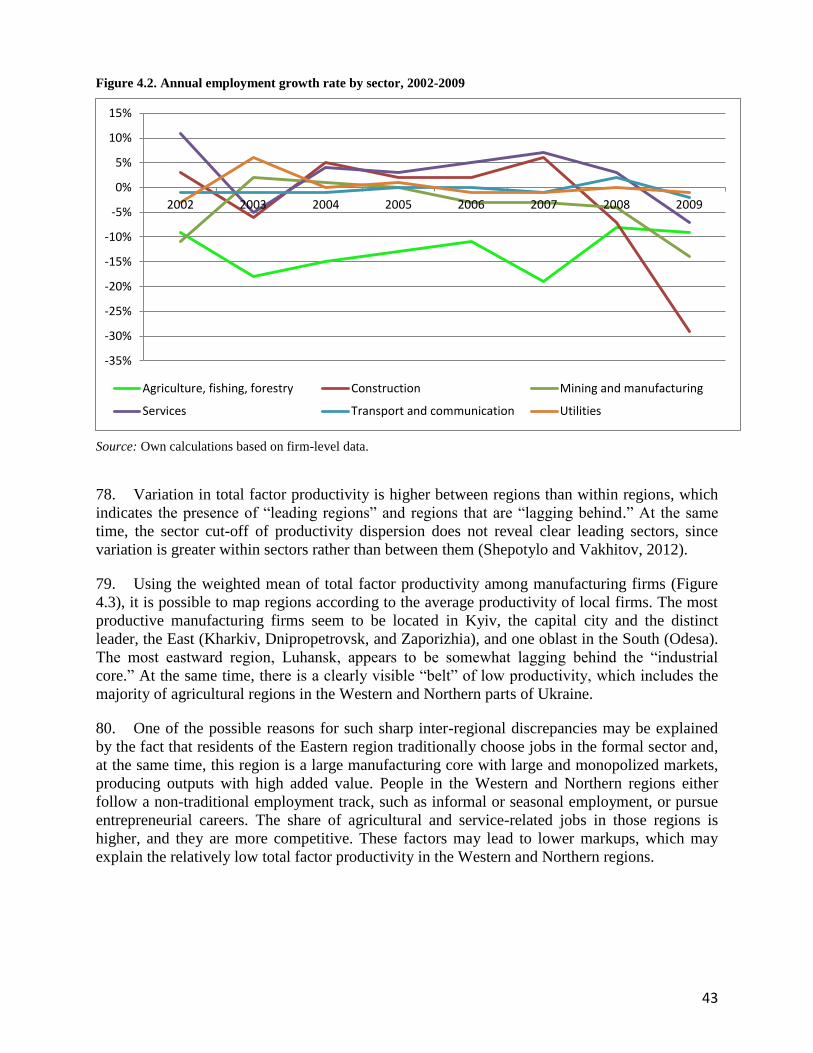
43
Figure 4.2. Annual employment growth rate by sector, 2002-2009
Source: Own calculations based on firm-level data.
78. Variation in total factor productivity is higher between regions than within regions, which
indicates the presence of “leading regions” and regions that are “lagging behind.” At the same
time, the sector cut-off of productivity dispersion does not reveal clear leading sectors, since
variation is greater within sectors rather than between them (Shepotylo and Vakhitov, 2012).
79. Using the weighted mean of total factor productivity among manufacturing firms (Figure
4.3), it is possible to map regions according to the average productivity of local firms. The most
productive manufacturing firms seem to be located in Kyiv, the capital city and the distinct
leader, the East (Kharkiv, Dnipropetrovsk, and Zaporizhia), and one oblast in the South (Odesa).
The most eastward region, Luhansk, appears to be somewhat lagging behind the “industrial
core.” At the same time, there is a clearly visible “belt” of low productivity, which includes the
majority of agricultural regions in the Western and Northern parts of Ukraine.
80. One of the possible reasons for such sharp inter-regional discrepancies may be explained
by the fact that residents of the Eastern region traditionally choose jobs in the formal sector and,
at the same time, this region is a large manufacturing core with large and monopolized markets,
producing outputs with high added value. People in the Western and Northern regions either
follow a non-traditional employment track, such as informal or seasonal employment, or pursue
entrepreneurial careers. The share of agricultural and service-related jobs in those regions is
higher, and they are more competitive. These factors may lead to lower markups, which may
explain the relatively low total factor productivity in the Western and Northern regions.
-35%
-30%
-25%
-20%
-15%
-10%
-5%
0%
5%
10%
15%
2002 2003 2004 2005 2006 2007 2008 2009
Agriculture, fishing, forestry Construction Mining and manufacturing
Services Transport and communication Utilities
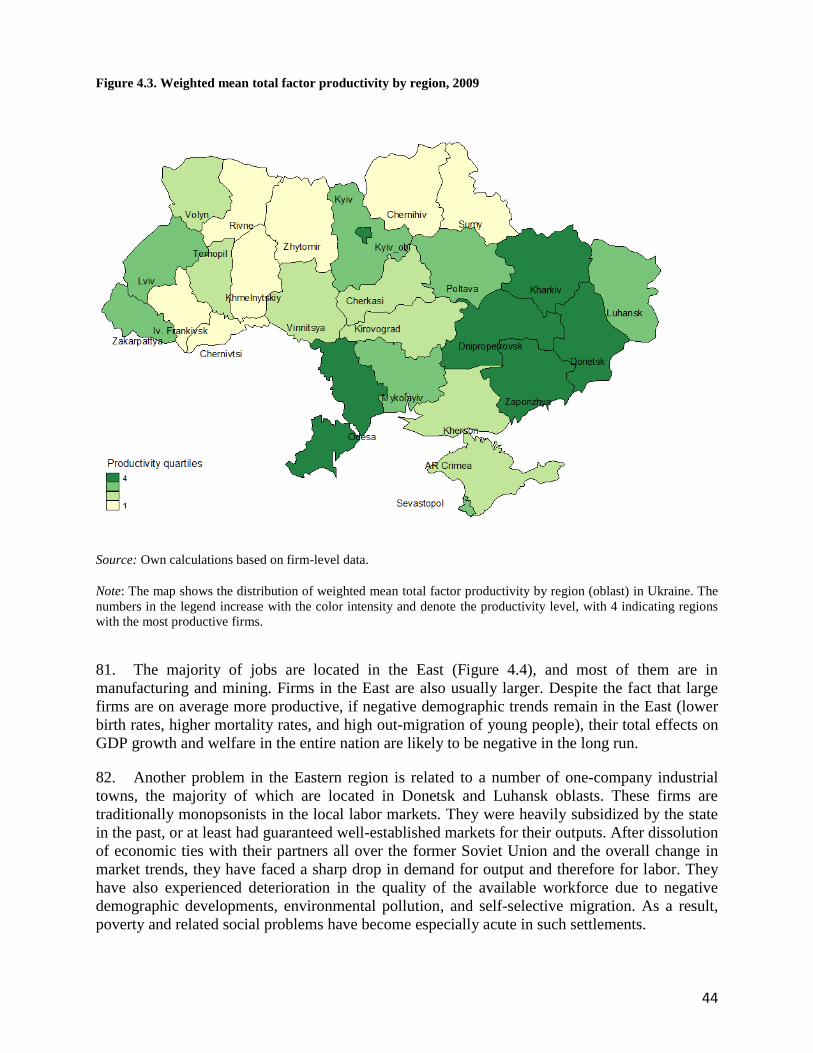
44
Figure 4.3. Weighted mean total factor productivity by region, 2009
Source: Own calculations based on firm-level data.
Note: The map shows the distribution of weighted mean total factor productivity by region (oblast) in Ukraine. The
numbers in the legend increase with the color intensity and denote the productivity level, with 4 indicating regions
with the most productive firms.
81. The majority of jobs are located in the East (Figure 4.4), and most of them are in
manufacturing and mining. Firms in the East are also usually larger. Despite the fact that large
firms are on average more productive, if negative demographic trends remain in the East (lower
birth rates, higher mortality rates, and high out-migration of young people), their total effects on
GDP growth and welfare in the entire nation are likely to be negative in the long run.
82. Another problem in the Eastern region is related to a number of one-company industrial
towns, the majority of which are located in Donetsk and Luhansk oblasts. These firms are
traditionally monopsonists in the local labor markets. They were heavily subsidized by the state
in the past, or at least had guaranteed well-established markets for their outputs. After dissolution
of economic ties with their partners all over the former Soviet Union and the overall change in
market trends, they have faced a sharp drop in demand for output and therefore for labor. They
have also experienced deterioration in the quality of the available workforce due to negative
demographic developments, environmental pollution, and self-selective migration. As a result,
poverty and related social problems have become especially acute in such settlements.
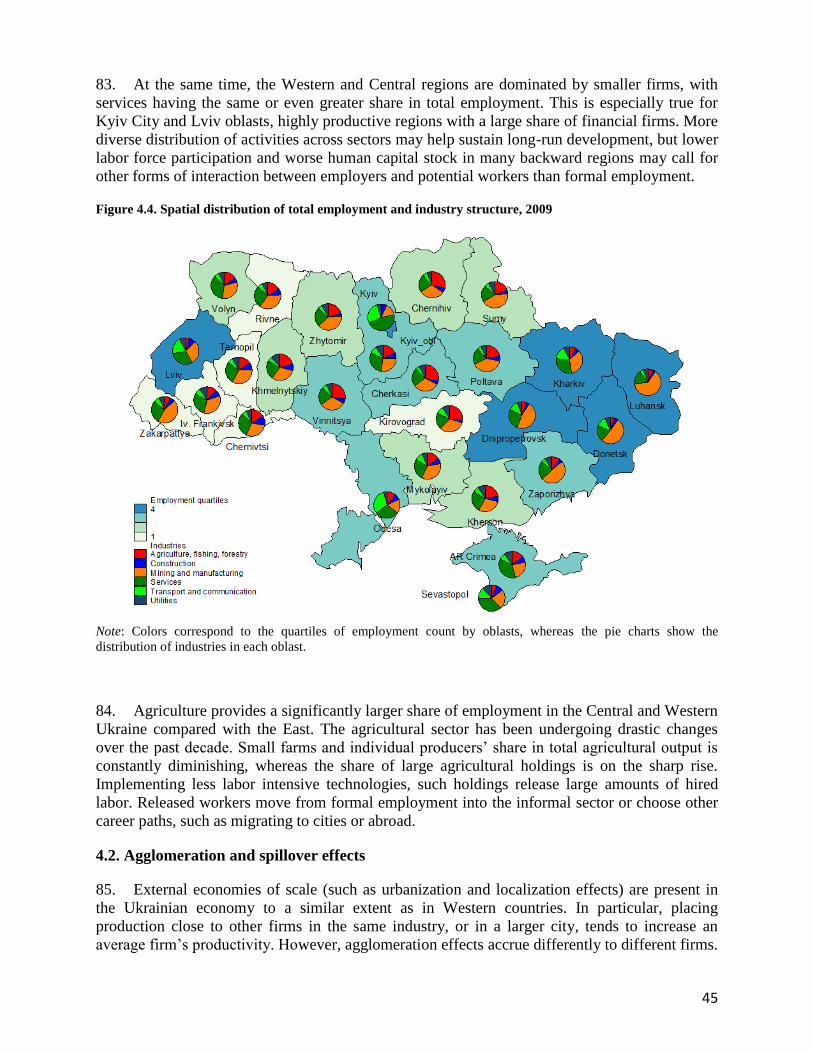
45
83. At the same time, the Western and Central regions are dominated by smaller firms, with
services having the same or even greater share in total employment. This is especially true for
Kyiv City and Lviv oblasts, highly productive regions with a large share of financial firms. More
diverse distribution of activities across sectors may help sustain long-run development, but lower
labor force participation and worse human capital stock in many backward regions may call for
other forms of interaction between employers and potential workers than formal employment.
Figure 4.4. Spatial distribution of total employment and industry structure, 2009
Note: Colors correspond to the quartiles of employment count by oblasts, whereas the pie charts show the
distribution of industries in each oblast.
84. Agriculture provides a significantly larger share of employment in the Central and Western
Ukraine compared with the East. The agricultural sector has been undergoing drastic changes
over the past decade. Small farms and individual producers’ share in total agricultural output is
constantly diminishing, whereas the share of large agricultural holdings is on the sharp rise.
Implementing less labor intensive technologies, such holdings release large amounts of hired
labor. Released workers move from formal employment into the informal sector or choose other
career paths, such as migrating to cities or abroad.
4.2. Agglomeration and spillover effects
85. External economies of scale (such as urbanization and localization effects) are present in
the Ukrainian economy to a similar extent as in Western countries. In particular, placing
production close to other firms in the same industry, or in a larger city, tends to increase an
average firm’s productivity. However, agglomeration effects accrue differently to different firms.
46
In particular, large firms in urban settlements are more likely to benefit from agglomeration
economies than smaller firms or firms in rural areas.
86. One of the strongest channels for agglomeration economies is the presence of other firms
in the vicinity. First, agglomeration effects tend to attenuate very quickly: after 30 km, the effect
vanishes almost completely (Rosenthal and Strange, 2003). Second, the effects are strongest
where the location is sufficiently diverse and provides a wide choice of specialists and firms for
the local labor market. The size of the market also plays a role: the larger is the pool of workers
and potential jobs, the lower are the search costs and the greater is competition for the best
workers, which immediately transforms into productivity gains for the firms and higher wages
for the workers (Rosenthal and Strange, 2004).
87. The presence of foreign capital in a city also plays an important role: foreign-owned firms
are able to benefit more from agglomeration effects. Predominantly state-controlled firms and
firms with more complex governance structure (with many branches over the country) are less
successful in accruing productivity gains from agglomeration economies. In locations with a
larger share of obsolete fixed assets, as well as in locations with a larger share of former state-
owned firms, agglomeration effects are less pronounced (Vakhitov and Bollinger, 2010).
88. Economists agree that active participation of foreign firms in an economy (with FDI, first
of all) should have strong positive spillover effects. Foreign firms are supposedly able to
stimulate competition and provide more advanced and modern standards of production, forming
value chains and distribution networks, as well as signaling to other foreign firms about a new
potential market for possible entrance (Tytel and Yudaeva, 2007). However, the share of firms
with foreign capital in Ukraine is too small (about 5 percent), with a substantial share of
ownership from off-shore countries. This makes it difficult to discuss whether knowledge
transfers are indeed significant or whether they might have any spillover effect for the rest of the
economy. However, foreign-owned firms do indeed pay higher wages and tend to hire
employees with better education and skills. Natural churning of their former workers across the
economy after leaving the foreign employer leads to slow dissemination of best practices and
thus may have a positive effect on working conditions, salaries, and the total number of good
jobs in the long run.
89. There are statistically significant spillovers from upstream firms in services to downstream
firms in manufacturing. Massive restructuring of the services sector (granting foreign companies
access to banking, insurance, reforms in telecommunications, opening the stock market for
individuals, lifting currency controls) has had a strong and positive effect on productivity gains
in the manufacturing sector. The effects have been especially strong for smaller domestic firms
(Shepotylo and Vakhitov, 2012).
90. Preliminary results of studies of Ukrainian firms point to the fact that variation in the
number of firms is more important in explaining agglomeration effects than variation in total
employment in the location. This fact can be explained by a greater reliance on inter-firm links
and contacts among managers and experts rather than by using the common pool of knowledge
and sharing information between employees. This may suggest lower cohesion levels in
Ukrainian firms and lower reliance on networks. It appears that the high potential of
interpersonal relations for productivity has yet to be uncovered.
4.3. Recent trends in job creation and destruction
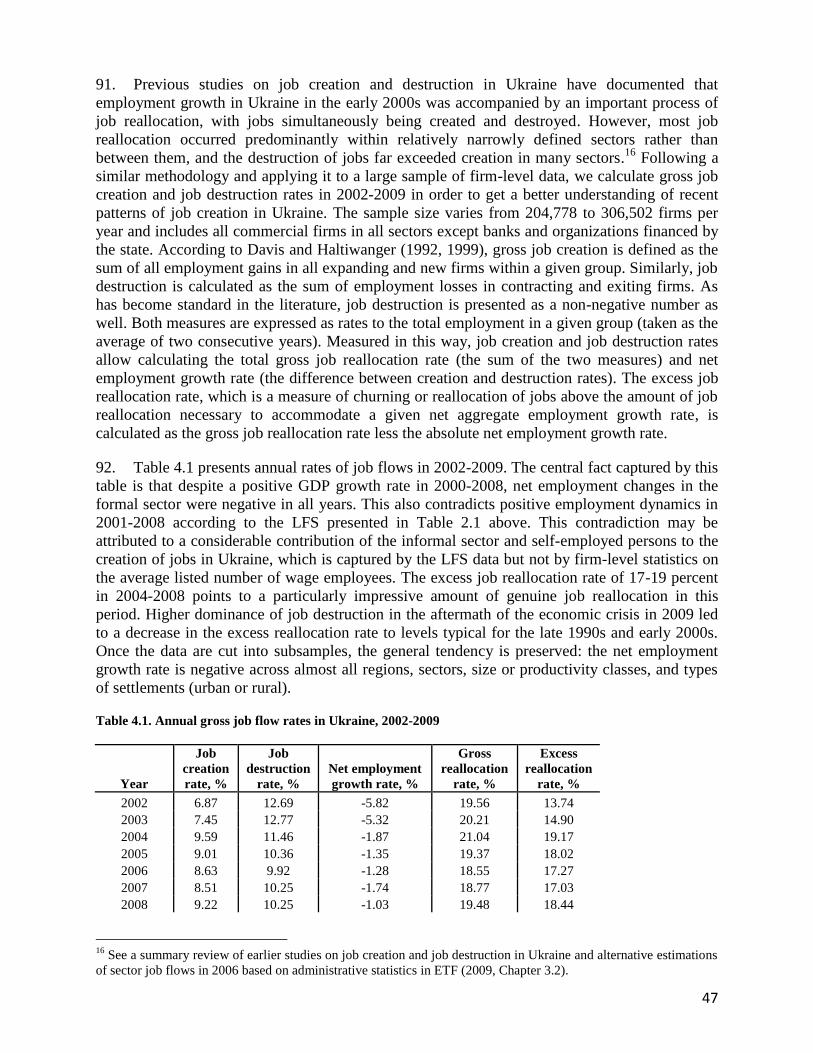
47
91. Previous studies on job creation and destruction in Ukraine have documented that
employment growth in Ukraine in the early 2000s was accompanied by an important process of
job reallocation, with jobs simultaneously being created and destroyed. However, most job
reallocation occurred predominantly within relatively narrowly defined sectors rather than
between them, and the destruction of jobs far exceeded creation in many sectors.16
Following a
similar methodology and applying it to a large sample of firm-level data, we calculate gross job
creation and job destruction rates in 2002-2009 in order to get a better understanding of recent
patterns of job creation in Ukraine. The sample size varies from 204,778 to 306,502 firms per
year and includes all commercial firms in all sectors except banks and organizations financed by
the state. According to Davis and Haltiwanger (1992, 1999), gross job creation is defined as the
sum of all employment gains in all expanding and new firms within a given group. Similarly, job
destruction is calculated as the sum of employment losses in contracting and exiting firms. As
has become standard in the literature, job destruction is presented as a non-negative number as
well. Both measures are expressed as rates to the total employment in a given group (taken as the
average of two consecutive years). Measured in this way, job creation and job destruction rates
allow calculating the total gross job reallocation rate (the sum of the two measures) and net
employment growth rate (the difference between creation and destruction rates). The excess job
reallocation rate, which is a measure of churning or reallocation of jobs above the amount of job
reallocation necessary to accommodate a given net aggregate employment growth rate, is
calculated as the gross job reallocation rate less the absolute net employment growth rate.
92. Table 4.1 presents annual rates of job flows in 2002-2009. The central fact captured by this
table is that despite a positive GDP growth rate in 2000-2008, net employment changes in the
formal sector were negative in all years. This also contradicts positive employment dynamics in
2001-2008 according to the LFS presented in Table 2.1 above. This contradiction may be
attributed to a considerable contribution of the informal sector and self-employed persons to the
creation of jobs in Ukraine, which is captured by the LFS data but not by firm-level statistics on
the average listed number of wage employees. The excess job reallocation rate of 17-19 percent
in 2004-2008 points to a particularly impressive amount of genuine job reallocation in this
period. Higher dominance of job destruction in the aftermath of the economic crisis in 2009 led
to a decrease in the excess reallocation rate to levels typical for the late 1990s and early 2000s.
Once the data are cut into subsamples, the general tendency is preserved: the net employment
growth rate is negative across almost all regions, sectors, size or productivity classes, and types
of settlements (urban or rural).
Table 4.1. Annual gross job flow rates in Ukraine, 2002-2009
Year
Job
creation
rate, %
Job
destruction
rate, %
Net employment
growth rate, %
Gross
reallocation
rate, %
Excess
reallocation
rate, %
2002 6.87 12.69 -5.82 19.56 13.74
2003 7.45 12.77 -5.32 20.21 14.90
2004 9.59 11.46 -1.87 21.04 19.17
2005 9.01 10.36 -1.35 19.37 18.02
2006 8.63 9.92 -1.28 18.55 17.27
2007 8.51 10.25 -1.74 18.77 17.03
2008 9.22 10.25 -1.03 19.48 18.44
16
See a summary review of earlier studies on job creation and job destruction in Ukraine and alternative estimations
of sector job flows in 2006 based on administrative statistics in ETF (2009, Chapter 3.2).
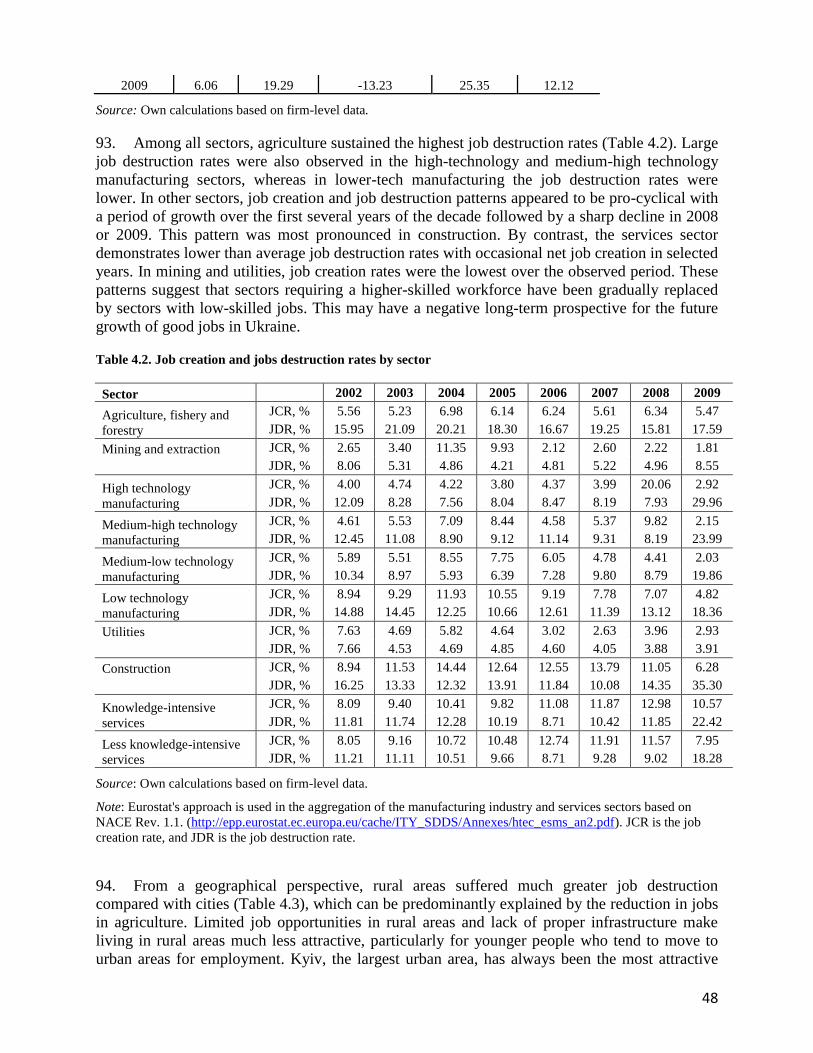
48
2009 6.06 19.29 -13.23 25.35 12.12
Source: Own calculations based on firm-level data.
93. Among all sectors, agriculture sustained the highest job destruction rates (Table 4.2). Large
job destruction rates were also observed in the high-technology and medium-high technology
manufacturing sectors, whereas in lower-tech manufacturing the job destruction rates were
lower. In other sectors, job creation and job destruction patterns appeared to be pro-cyclical with
a period of growth over the first several years of the decade followed by a sharp decline in 2008
or 2009. This pattern was most pronounced in construction. By contrast, the services sector
demonstrates lower than average job destruction rates with occasional net job creation in selected
years. In mining and utilities, job creation rates were the lowest over the observed period. These
patterns suggest that sectors requiring a higher-skilled workforce have been gradually replaced
by sectors with low-skilled jobs. This may have a negative long-term prospective for the future
growth of good jobs in Ukraine.
Table 4.2. Job creation and jobs destruction rates by sector
Sector 2002 2003 2004 2005 2006 2007 2008 2009
Agriculture, fishery and
forestry
JCR, % 5.56 5.23 6.98 6.14 6.24 5.61 6.34 5.47
JDR, % 15.95 21.09 20.21 18.30 16.67 19.25 15.81 17.59
Mining and extraction JCR, % 2.65 3.40 11.35 9.93 2.12 2.60 2.22 1.81
JDR, % 8.06 5.31 4.86 4.21 4.81 5.22 4.96 8.55
High technology
manufacturing
JCR, % 4.00 4.74 4.22 3.80 4.37 3.99 20.06 2.92
JDR, % 12.09 8.28 7.56 8.04 8.47 8.19 7.93 29.96
Medium-high technology
manufacturing
JCR, % 4.61 5.53 7.09 8.44 4.58 5.37 9.82 2.15
JDR, % 12.45 11.08 8.90 9.12 11.14 9.31 8.19 23.99
Medium-low technology
manufacturing
JCR, % 5.89 5.51 8.55 7.75 6.05 4.78 4.41 2.03
JDR, % 10.34 8.97 5.93 6.39 7.28 9.80 8.79 19.86
Low technology
manufacturing
JCR, % 8.94 9.29 11.93 10.55 9.19 7.78 7.07 4.82
JDR, % 14.88 14.45 12.25 10.66 12.61 11.39 13.12 18.36
Utilities JCR, % 7.63 4.69 5.82 4.64 3.02 2.63 3.96 2.93
JDR, % 7.66 4.53 4.69 4.85 4.60 4.05 3.88 3.91
Construction JCR, % 8.94 11.53 14.44 12.64 12.55 13.79 11.05 6.28
JDR, % 16.25 13.33 12.32 13.91 11.84 10.08 14.35 35.30
Knowledge-intensive
services
JCR, % 8.09 9.40 10.41 9.82 11.08 11.87 12.98 10.57
JDR, % 11.81 11.74 12.28 10.19 8.71 10.42 11.85 22.42
Less knowledge-intensive
services
JCR, % 8.05 9.16 10.72 10.48 12.74 11.91 11.57 7.95
JDR, % 11.21 11.11 10.51 9.66 8.71 9.28 9.02 18.28
Source: Own calculations based on firm-level data.
Note: Eurostat's approach is used in the aggregation of the manufacturing industry and services sectors based on
NACE Rev. 1.1. (http://epp.eurostat.ec.europa.eu/cache/ITY_SDDS/Annexes/htec_esms_an2.pdf). JCR is the job
creation rate, and JDR is the job destruction rate.
94. From a geographical perspective, rural areas suffered much greater job destruction
compared with cities (Table 4.3), which can be predominantly explained by the reduction in jobs
in agriculture. Limited job opportunities in rural areas and lack of proper infrastructure make
living in rural areas much less attractive, particularly for younger people who tend to move to
urban areas for employment. Kyiv, the largest urban area, has always been the most attractive
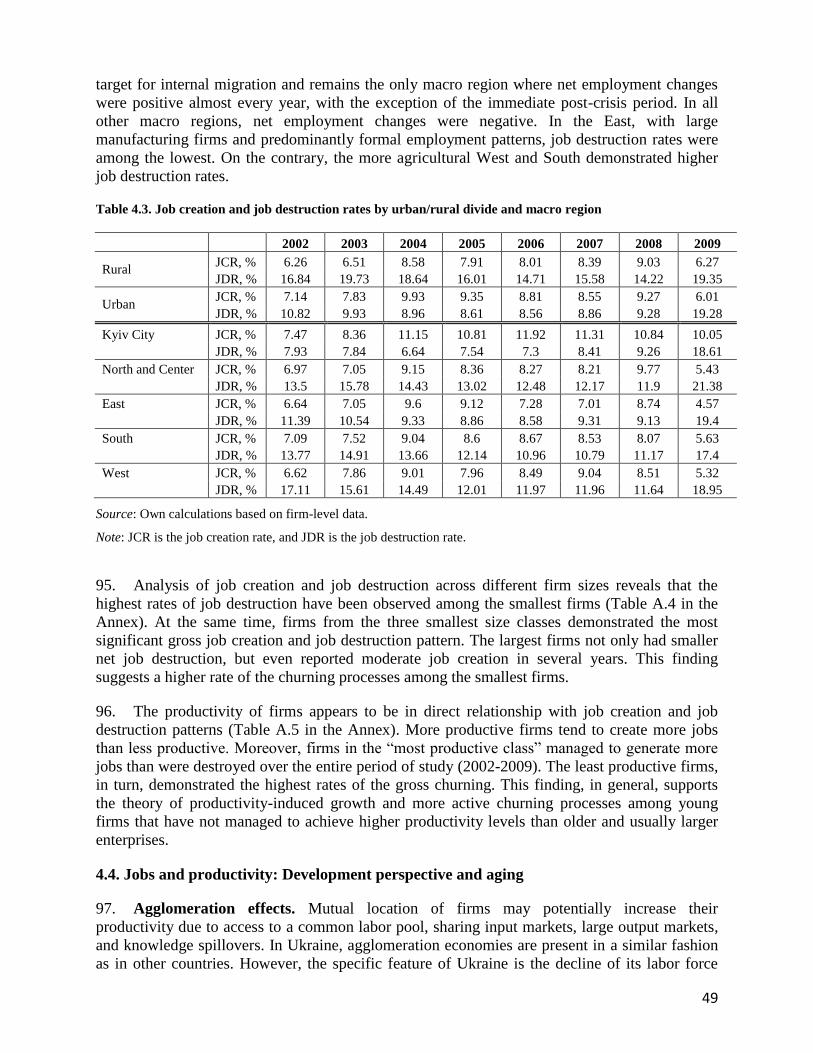
49
target for internal migration and remains the only macro region where net employment changes
were positive almost every year, with the exception of the immediate post-crisis period. In all
other macro regions, net employment changes were negative. In the East, with large
manufacturing firms and predominantly formal employment patterns, job destruction rates were
among the lowest. On the contrary, the more agricultural West and South demonstrated higher
job destruction rates.
Table 4.3. Job creation and job destruction rates by urban/rural divide and macro region
2002 2003 2004 2005 2006 2007 2008 2009
Rural JCR, % 6.26 6.51 8.58 7.91 8.01 8.39 9.03 6.27
JDR, % 16.84 19.73 18.64 16.01 14.71 15.58 14.22 19.35
Urban JCR, % 7.14 7.83 9.93 9.35 8.81 8.55 9.27 6.01
JDR, % 10.82 9.93 8.96 8.61 8.56 8.86 9.28 19.28
Kyiv City JCR, % 7.47 8.36 11.15 10.81 11.92 11.31 10.84 10.05
JDR, % 7.93 7.84 6.64 7.54 7.3 8.41 9.26 18.61
North and Center JCR, % 6.97 7.05 9.15 8.36 8.27 8.21 9.77 5.43
JDR, % 13.5 15.78 14.43 13.02 12.48 12.17 11.9 21.38
East JCR, % 6.64 7.05 9.6 9.12 7.28 7.01 8.74 4.57
JDR, % 11.39 10.54 9.33 8.86 8.58 9.31 9.13 19.4
South JCR, % 7.09 7.52 9.04 8.6 8.67 8.53 8.07 5.63
JDR, % 13.77 14.91 13.66 12.14 10.96 10.79 11.17 17.4
West JCR, % 6.62 7.86 9.01 7.96 8.49 9.04 8.51 5.32
JDR, % 17.11 15.61 14.49 12.01 11.97 11.96 11.64 18.95
Source: Own calculations based on firm-level data.
Note: JCR is the job creation rate, and JDR is the job destruction rate.
95. Analysis of job creation and job destruction across different firm sizes reveals that the
highest rates of job destruction have been observed among the smallest firms (Table A.4 in the
Annex). At the same time, firms from the three smallest size classes demonstrated the most
significant gross job creation and job destruction pattern. The largest firms not only had smaller
net job destruction, but even reported moderate job creation in several years. This finding
suggests a higher rate of the churning processes among the smallest firms.
96. The productivity of firms appears to be in direct relationship with job creation and job
destruction patterns (Table A.5 in the Annex). More productive firms tend to create more jobs
than less productive. Moreover, firms in the “most productive class” managed to generate more
jobs than were destroyed over the entire period of study (2002-2009). The least productive firms,
in turn, demonstrated the highest rates of the gross churning. This finding, in general, supports
the theory of productivity-induced growth and more active churning processes among young
firms that have not managed to achieve higher productivity levels than older and usually larger
enterprises.
4.4. Jobs and productivity: Development perspective and aging
97. Agglomeration effects. Mutual location of firms may potentially increase their
productivity due to access to a common labor pool, sharing input markets, large output markets,
and knowledge spillovers. In Ukraine, agglomeration economies are present in a similar fashion
as in other countries. However, the specific feature of Ukraine is the decline of its labor force
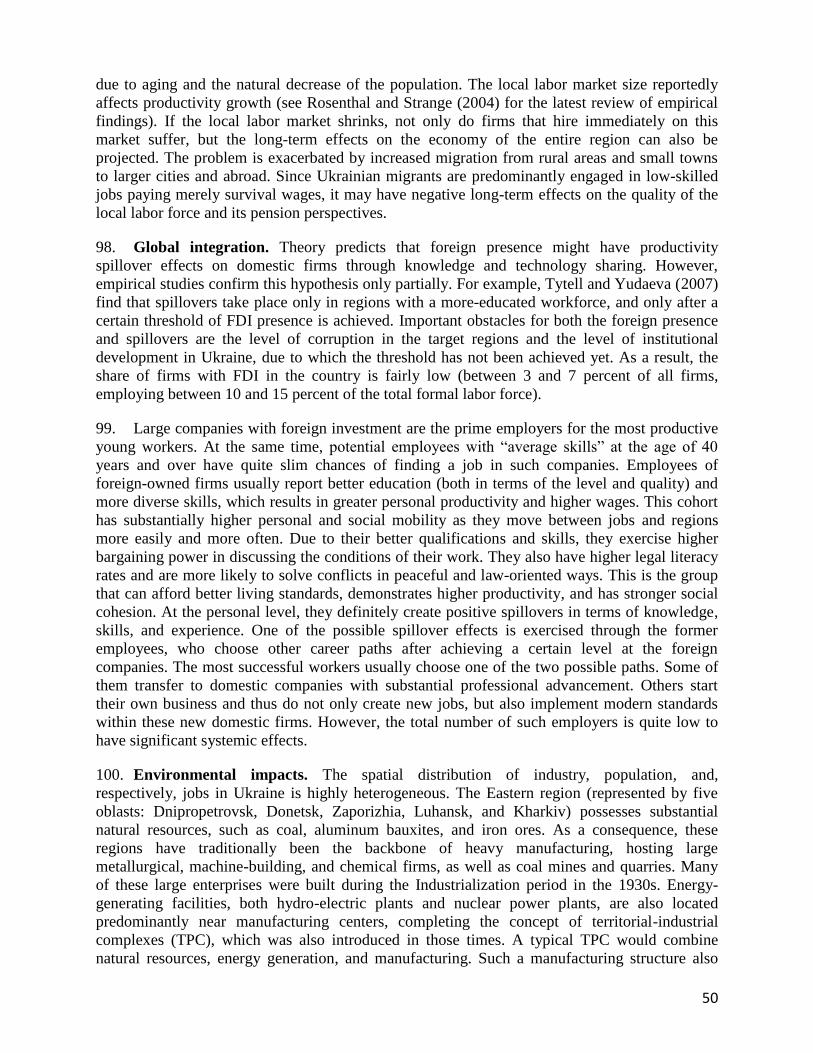
50
due to aging and the natural decrease of the population. The local labor market size reportedly
affects productivity growth (see Rosenthal and Strange (2004) for the latest review of empirical
findings). If the local labor market shrinks, not only do firms that hire immediately on this
market suffer, but the long-term effects on the economy of the entire region can also be
projected. The problem is exacerbated by increased migration from rural areas and small towns
to larger cities and abroad. Since Ukrainian migrants are predominantly engaged in low-skilled
jobs paying merely survival wages, it may have negative long-term effects on the quality of the
local labor force and its pension perspectives.
98. Global integration. Theory predicts that foreign presence might have productivity
spillover effects on domestic firms through knowledge and technology sharing. However,
empirical studies confirm this hypothesis only partially. For example, Tytell and Yudaeva (2007)
find that spillovers take place only in regions with a more-educated workforce, and only after a
certain threshold of FDI presence is achieved. Important obstacles for both the foreign presence
and spillovers are the level of corruption in the target regions and the level of institutional
development in Ukraine, due to which the threshold has not been achieved yet. As a result, the
share of firms with FDI in the country is fairly low (between 3 and 7 percent of all firms,
employing between 10 and 15 percent of the total formal labor force).
99. Large companies with foreign investment are the prime employers for the most productive
young workers. At the same time, potential employees with “average skills” at the age of 40
years and over have quite slim chances of finding a job in such companies. Employees of
foreign-owned firms usually report better education (both in terms of the level and quality) and
more diverse skills, which results in greater personal productivity and higher wages. This cohort
has substantially higher personal and social mobility as they move between jobs and regions
more easily and more often. Due to their better qualifications and skills, they exercise higher
bargaining power in discussing the conditions of their work. They also have higher legal literacy
rates and are more likely to solve conflicts in peaceful and law-oriented ways. This is the group
that can afford better living standards, demonstrates higher productivity, and has stronger social
cohesion. At the personal level, they definitely create positive spillovers in terms of knowledge,
skills, and experience. One of the possible spillover effects is exercised through the former
employees, who choose other career paths after achieving a certain level at the foreign
companies. The most successful workers usually choose one of the two possible paths. Some of
them transfer to domestic companies with substantial professional advancement. Others start
their own business and thus do not only create new jobs, but also implement modern standards
within these new domestic firms. However, the total number of such employers is quite low to
have significant systemic effects.
100. Environmental impacts. The spatial distribution of industry, population, and,
respectively, jobs in Ukraine is highly heterogeneous. The Eastern region (represented by five
oblasts: Dnipropetrovsk, Donetsk, Zaporizhia, Luhansk, and Kharkiv) possesses substantial
natural resources, such as coal, aluminum bauxites, and iron ores. As a consequence, these
regions have traditionally been the backbone of heavy manufacturing, hosting large
metallurgical, machine-building, and chemical firms, as well as coal mines and quarries. Many
of these large enterprises were built during the Industrialization period in the 1930s. Energy-
generating facilities, both hydro-electric plants and nuclear power plants, are also located
predominantly near manufacturing centers, completing the concept of territorial-industrial
complexes (TPC), which was also introduced in those times. A typical TPC would combine
natural resources, energy generation, and manufacturing. Such a manufacturing structure also
51
required substantial human resources. Hence, the Eastern region is the most populated: the
combined population of the five oblasts composes a third of the total population in the country.
And the region is heavily urbanized: almost 85 percent of the population in these five oblasts
lives in urban settlements.
101. The Western and Southern regions are predominantly agricultural, with less numerous and
much smaller firms. With the exception of several industrial centers, most of which are the
administrative centers as well (such as Lviv, Odessa, or Mykolaiv), and a large industrial cluster
around the capital city of Kyiv, industrial production is scattered (see Figure 4.4).
102. Such locational patterns determine the types of environmental effects of local industries.
Most jobs in the Eastern part of the country are considered “harmful” both for workers and the
environment. Many enterprises reached their total depreciation point long ago, but only some of
them have been reconstructed. During reconstruction, only minimal requirements for purification
equipment installation are usually met. The state’s efforts at regulating levels of emissions
through economic stimuli or systems of penalties are evidently not sufficient. As a result, the
levels of emissions of air, soil, and water pollutants observed in the Eastern Ukraine exceed all
possible limits of acceptable concentration and thus create obvious danger for the health and
lives of local population.
103. Figure 4.5 shows emissions of air pollutants in urban territories as of 2004. The South-East
of the country is especially contaminated with air emissions from stationary sources. A similar
picture is evident from Figure A.1 in the Annex, which shows not only contamination of the air,
but also soil pollutants in 2006. The same regions are shown to have several sources of
pollutants. Annual reports from the Ministry of Environmental Protection also indicate that the
overall stock of different types of contamination substances grows every year, since the
purification and cleaning efforts of firms and local governments are not sufficient to cope with
these levels of pollution.
52
Figure 4.5. Emission of air pollutants from stationary and mobile sources, 2004
Source: http://www.rav.com.ua/useful_know/ecomaps/ecological_cards/, accessed on September 24, 2012.
Note: The size of circles corresponds to the level of pollutants; the purple color denotes stationary sources, whereas
the olive color stands for mobile sources.
104. The relatively fast economic growth of household incomes in the first decade of the
century, which was especially pronounced in large cities, caused increased demand for personal
vehicles. As a result, the total number of cars in private possession approached 6.5 million by the
end of 2010, compared with 5.1 million cars at the end of 2000. As is evident from the map in
Figure 4.5, Kyiv City holds leadership in the amount of air pollution from vehicles owned by
private households, but also by firms and organizations. The fact that more than 50 percent of the
vehicles are old and not equipped with modern catalytic convertors, which would reduce
pollution, exacerbates the problem. This poses an unexpected outcome of having a good job:
current jobs provide “good enough income” for a household to afford a new car, but it is not
“sufficiently good” to afford an environmentally-friendly car. As a result, total air pollution tends
to increase.
105. Massive contamination of the air and soil in several regions of Ukraine has negative long-
term consequences for the health status of the local population. The average life expectancy in
those regions is about two to four years shorter compared with the rest of Ukraine.17
The
pollution has clear intergenerational effects, which are evident through a series of inherited
distortions in development and chronic diseases among children. Combined with lower fertility
17
For example, life expectancy at birth in Donetsk oblast (East) was 69.64 years in 2011, compared with 72.97 years
in Chernivtsi oblast (West) and 74.15 years in Kyiv City.
53
and birth rates, the long-term development perspectives of regions with a poor ecological
situation look grim. It appears that in the next 25 years, Ukrainians will not only become older,
but also less healthy, which will have negative impacts on the quantity and quality of the labor
force.
106. One of possible policy actions from the state should be to encourage local manufacturing
firms to increase the share of costs which could be directed toward purification of emissions
from the largest pollutants. As another possible recommendation, expenditure on health care and
diagnostics, as well as investments in health care infrastructure, should be significantly increased
and more effectively used. An alternative would be to finance programs that promote population
relocation to less polluted areas.
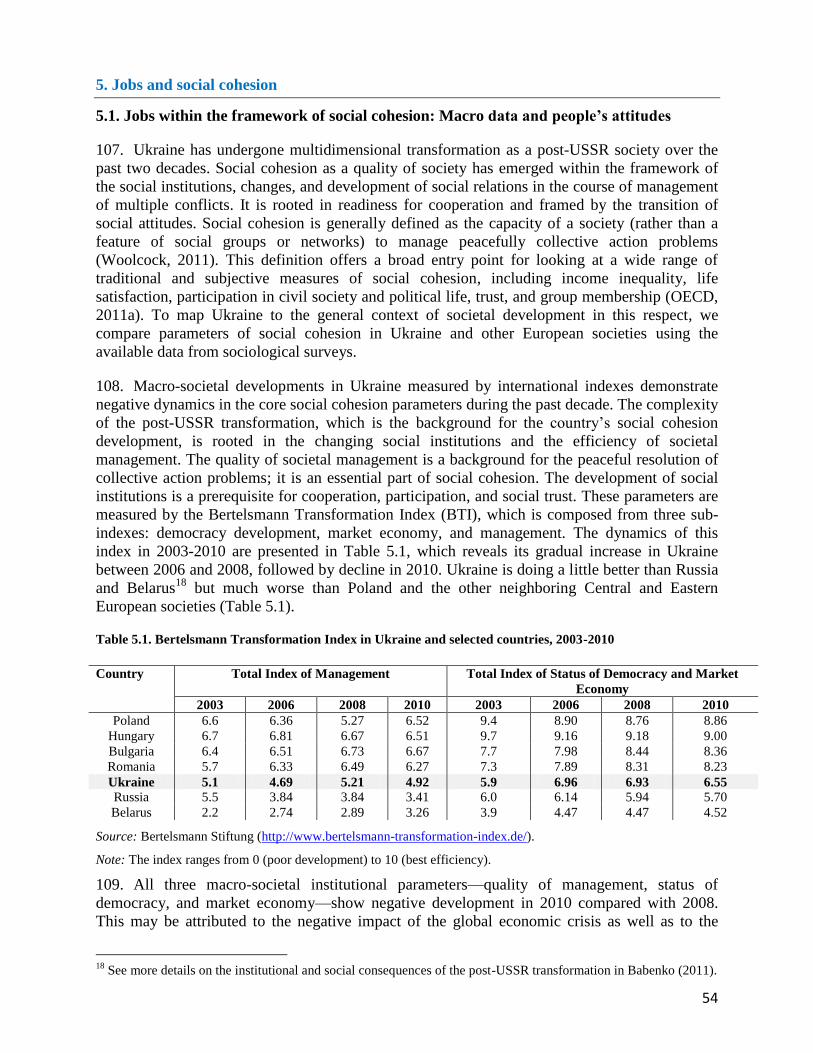
54
5. Jobs and social cohesion
5.1. Jobs within the framework of social cohesion: Macro data and people’s attitudes
107. Ukraine has undergone multidimensional transformation as a post-USSR society over the
past two decades. Social cohesion as a quality of society has emerged within the framework of
the social institutions, changes, and development of social relations in the course of management
of multiple conflicts. It is rooted in readiness for cooperation and framed by the transition of
social attitudes. Social cohesion is generally defined as the capacity of a society (rather than a
feature of social groups or networks) to manage peacefully collective action problems
(Woolcock, 2011). This definition offers a broad entry point for looking at a wide range of
traditional and subjective measures of social cohesion, including income inequality, life
satisfaction, participation in civil society and political life, trust, and group membership (OECD,
2011a). To map Ukraine to the general context of societal development in this respect, we
compare parameters of social cohesion in Ukraine and other European societies using the
available data from sociological surveys.
108. Macro-societal developments in Ukraine measured by international indexes demonstrate
negative dynamics in the core social cohesion parameters during the past decade. The complexity
of the post-USSR transformation, which is the background for the country’s social cohesion
development, is rooted in the changing social institutions and the efficiency of societal
management. The quality of societal management is a background for the peaceful resolution of
collective action problems; it is an essential part of social cohesion. The development of social
institutions is a prerequisite for cooperation, participation, and social trust. These parameters are
measured by the Bertelsmann Transformation Index (BTI), which is composed from three sub-
indexes: democracy development, market economy, and management. The dynamics of this
index in 2003-2010 are presented in Table 5.1, which reveals its gradual increase in Ukraine
between 2006 and 2008, followed by decline in 2010. Ukraine is doing a little better than Russia
and Belarus18
but much worse than Poland and the other neighboring Central and Eastern
European societies (Table 5.1).
Table 5.1. Bertelsmann Transformation Index in Ukraine and selected countries, 2003-2010
Source: Bertelsmann Stiftung (http://www.bertelsmann-transformation-index.de/).
Note: The index ranges from 0 (poor development) to 10 (best efficiency).
109. All three macro-societal institutional parameters—quality of management, status of
democracy, and market economy—show negative development in 2010 compared with 2008.
This may be attributed to the negative impact of the global economic crisis as well as to the
18
See more details on the institutional and social consequences of the post-USSR transformation in Babenko (2011).
Country Total Index of Management Total Index of Status of Democracy and Market
Economy
2003 2006 2008 2010 2003 2006 2008 2010
Poland 6.6 6.36 5.27 6.52 9.4 8.90 8.76 8.86
Hungary 6.7 6.81 6.67 6.51 9.7 9.16 9.18 9.00
Bulgaria 6.4 6.51 6.73 6.67 7.7 7.98 8.44 8.36
Romania 5.7 6.33 6.49 6.27 7.3 7.89 8.31 8.23
Ukraine 5.1 4.69 5.21 4.92 5.9 6.96 6.93 6.55
Russia 5.5 3.84 3.84 3.41 6.0 6.14 5.94 5.70
Belarus 2.2 2.74 2.89 3.26 3.9 4.47 4.47 4.52
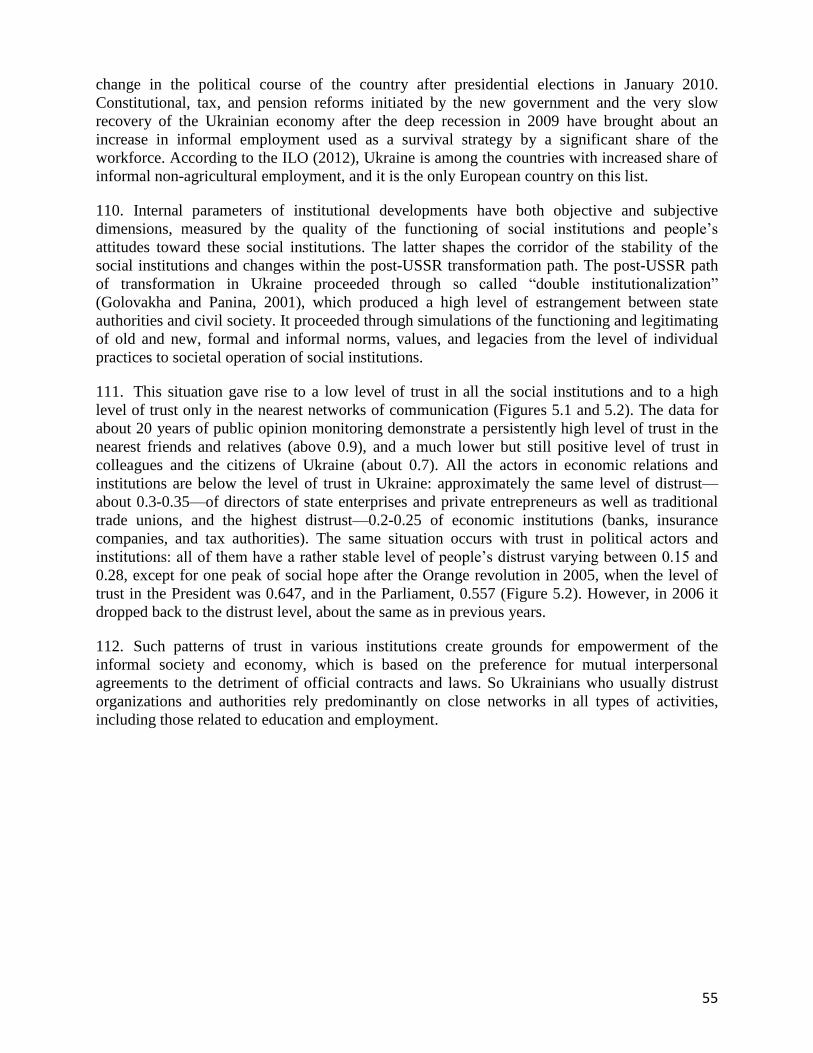
55
change in the political course of the country after presidential elections in January 2010.
Constitutional, tax, and pension reforms initiated by the new government and the very slow
recovery of the Ukrainian economy after the deep recession in 2009 have brought about an
increase in informal employment used as a survival strategy by a significant share of the
workforce. According to the ILO (2012), Ukraine is among the countries with increased share of
informal non-agricultural employment, and it is the only European country on this list.
110. Internal parameters of institutional developments have both objective and subjective
dimensions, measured by the quality of the functioning of social institutions and people’s
attitudes toward these social institutions. The latter shapes the corridor of the stability of the
social institutions and changes within the post-USSR transformation path. The post-USSR path
of transformation in Ukraine proceeded through so called “double institutionalization”
(Golovakha and Panina, 2001), which produced a high level of estrangement between state
authorities and civil society. It proceeded through simulations of the functioning and legitimating
of old and new, formal and informal norms, values, and legacies from the level of individual
practices to societal operation of social institutions.
111. This situation gave rise to a low level of trust in all the social institutions and to a high
level of trust only in the nearest networks of communication (Figures 5.1 and 5.2). The data for
about 20 years of public opinion monitoring demonstrate a persistently high level of trust in the
nearest friends and relatives (above 0.9), and a much lower but still positive level of trust in
colleagues and the citizens of Ukraine (about 0.7). All the actors in economic relations and
institutions are below the level of trust in Ukraine: approximately the same level of distrust—
about 0.3-0.35—of directors of state enterprises and private entrepreneurs as well as traditional
trade unions, and the highest distrust—0.2-0.25 of economic institutions (banks, insurance
companies, and tax authorities). The same situation occurs with trust in political actors and
institutions: all of them have a rather stable level of people’s distrust varying between 0.15 and
0.28, except for one peak of social hope after the Orange revolution in 2005, when the level of
trust in the President was 0.647, and in the Parliament, 0.557 (Figure 5.2). However, in 2006 it
dropped back to the distrust level, about the same as in previous years.
112. Such patterns of trust in various institutions create grounds for empowerment of the
informal society and economy, which is based on the preference for mutual interpersonal
agreements to the detriment of official contracts and laws. So Ukrainians who usually distrust
organizations and authorities rely predominantly on close networks in all types of activities,
including those related to education and employment.
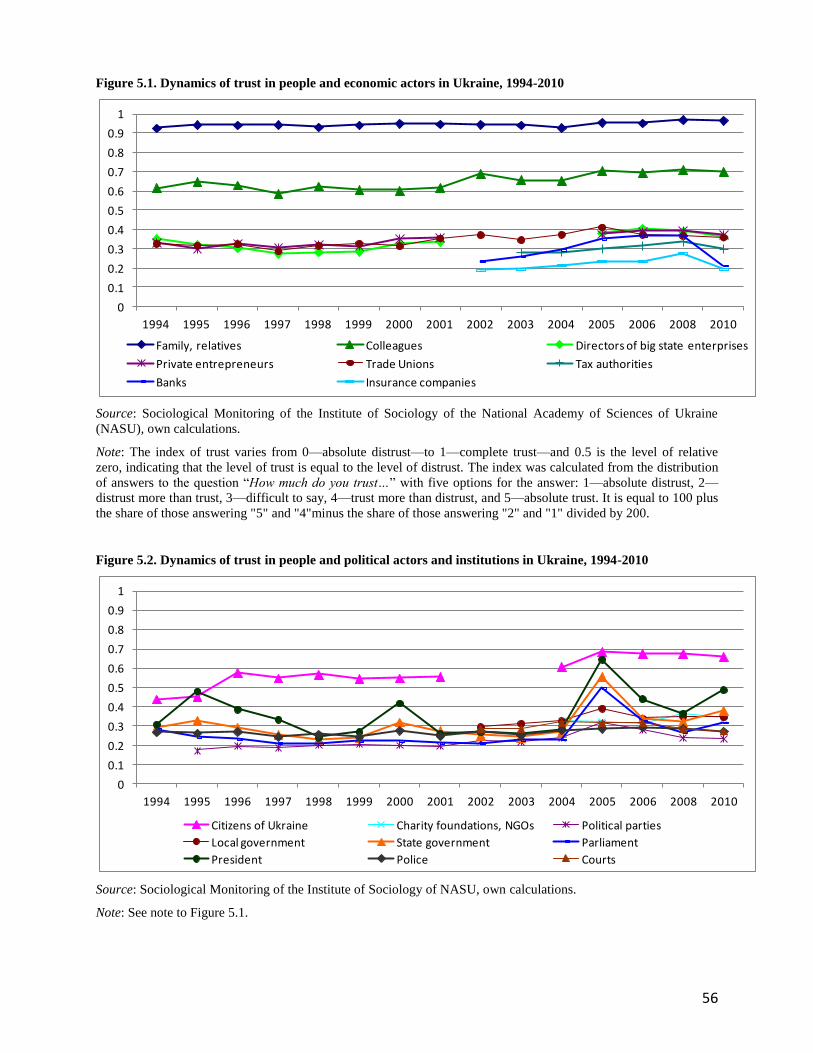
56
Figure 5.1. Dynamics of trust in people and economic actors in Ukraine, 1994-2010
Source: Sociological Monitoring of the Institute of Sociology of the National Academy of Sciences of Ukraine
(NASU), own calculations.
Note: The index of trust varies from 0—absolute distrust—to 1—complete trust—and 0.5 is the level of relative
zero, indicating that the level of trust is equal to the level of distrust. The index was calculated from the distribution
of answers to the question “How much do you trust…” with five options for the answer: 1—absolute distrust, 2—
distrust more than trust, 3—difficult to say, 4—trust more than distrust, and 5—absolute trust. It is equal to 100 plus
the share of those answering "5" and "4"minus the share of those answering "2" and "1" divided by 200.
Figure 5.2. Dynamics of trust in people and political actors and institutions in Ukraine, 1994-2010
Source: Sociological Monitoring of the Institute of Sociology of NASU, own calculations.
Note: See note to Figure 5.1.
0
0.1
0.2
0.3
0.4
0.5
0.6
0.7
0.8
0.9
1
1994 1995 1996 1997 1998 1999 2000 2001 2002 2003 2004 2005 2006 2008 2010
Family, relatives Colleagues Directors of big state enterprises
Private entrepreneurs Trade Unions Tax authorities
Banks Insurance companies
0
0.1
0.2
0.3
0.4
0.5
0.6
0.7
0.8
0.9
1
1994 1995 1996 1997 1998 1999 2000 2001 2002 2003 2004 2005 2006 2008 2010
Citizens of Ukraine Charity foundations, NGOs Political parties
Local government State government Parliament
President Police Courts
57
113. Interestingly, there is no statistically significant difference in trust in both economic and
political actors and institutions between people who had a paid job and those who were out of the
labor force. A slight difference (less than 0.1) can be observed between those who had a paid job
and the unemployed in their trust toward economic actors (private entrepreneurs and trade
unions). This could be just a case of small sample error as the average level of trust is indeed
low.
114. As defined above, the most important indicators for social cohesion are the level of trust in
people, trust in social institutions, and the level of social participation. All of them, measured by
objective macro-societal indicators and people's attitudes, demonstrate low chances to achieve
social cohesion in Ukraine.
115. If we compare Ukraine with European countries, we can see that both in Ukraine and
Europe employment is positively related to people’s level of trust and subjective well-being
(Figure 5.3): the employed trusted people more than the unemployed, and were more satisfied
with life and democracy. However, the level of generalized trust, life satisfaction, and evaluation
of the development of democracy is much lower in Ukraine than in Europe. Meanwhile, the
employed in Ukraine trust people more than the unemployed in Europe, which is in line with our
expectations.
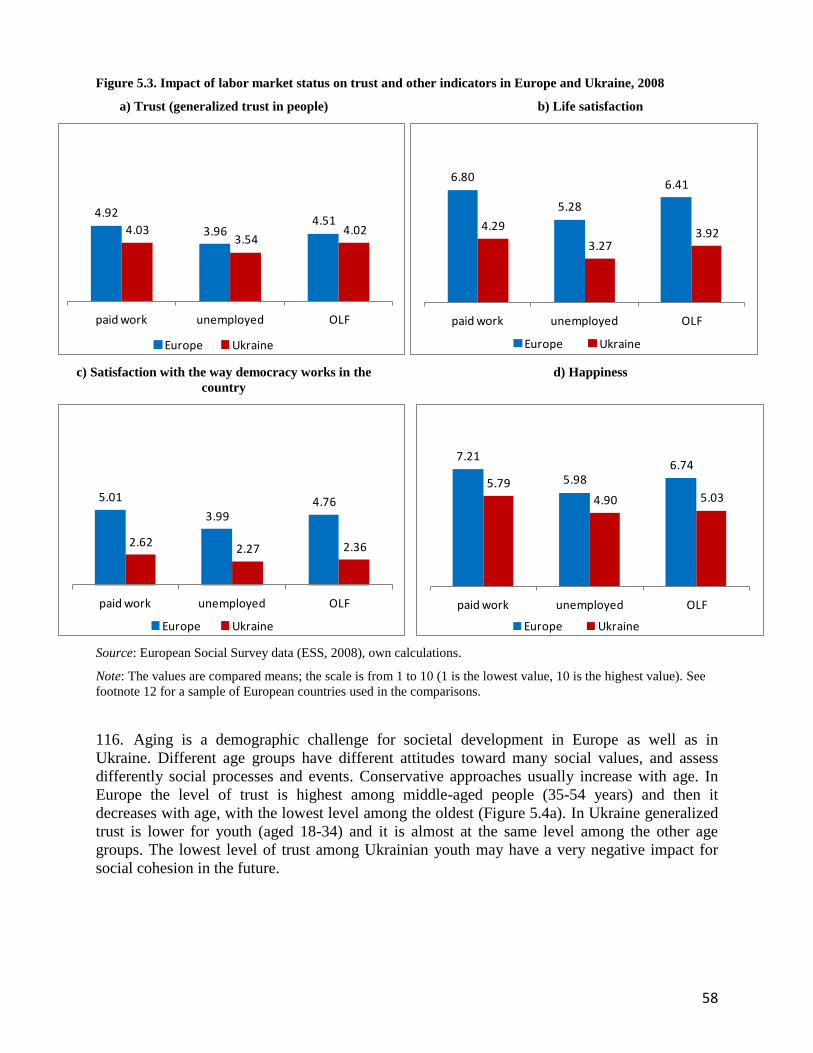
58
Figure 5.3. Impact of labor market status on trust and other indicators in Europe and Ukraine, 2008
a) Trust (generalized trust in people) b) Life satisfaction
c) Satisfaction with the way democracy works in the
country
d) Happiness
Source: European Social Survey data (ESS, 2008), own calculations.
Note: The values are compared means; the scale is from 1 to 10 (1 is the lowest value, 10 is the highest value). See
footnote 12 for a sample of European countries used in the comparisons.
116. Aging is a demographic challenge for societal development in Europe as well as in
Ukraine. Different age groups have different attitudes toward many social values, and assess
differently social processes and events. Conservative approaches usually increase with age. In
Europe the level of trust is highest among middle-aged people (35-54 years) and then it
decreases with age, with the lowest level among the oldest (Figure 5.4a). In Ukraine generalized
trust is lower for youth (aged 18-34) and it is almost at the same level among the other age
groups. The lowest level of trust among Ukrainian youth may have a very negative impact for
social cohesion in the future.
4.92
3.964.51
4.033.54
4.02
paid work unemployed OLF
Europe Ukraine
6.80
5.28
6.41
4.29
3.273.92
paid work unemployed OLF
Europe Ukraine
5.01
3.994.76
2.622.27 2.36
paid work unemployed OLF
Europe Ukraine
7.21
5.986.74
5.79
4.90 5.03
paid work unemployed OLF
Europe Ukraine
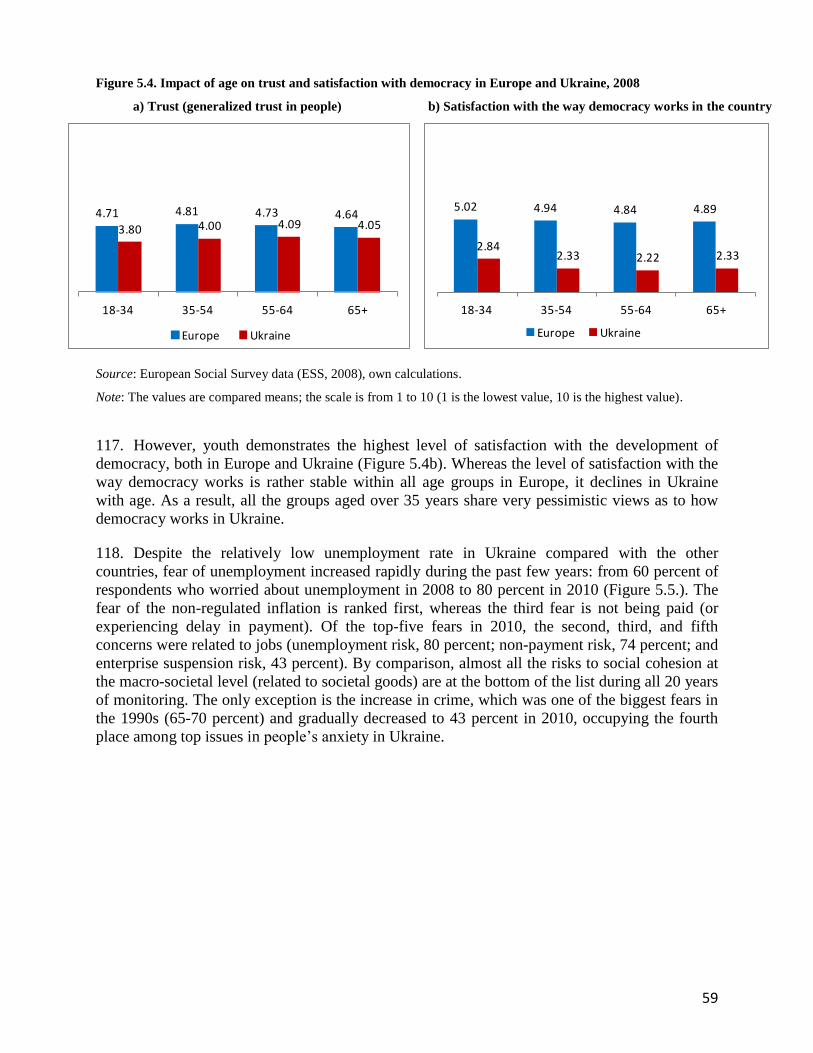
59
Figure 5.4. Impact of age on trust and satisfaction with democracy in Europe and Ukraine, 2008
a) Trust (generalized trust in people) b) Satisfaction with the way democracy works in the country
Source: European Social Survey data (ESS, 2008), own calculations.
Note: The values are compared means; the scale is from 1 to 10 (1 is the lowest value, 10 is the highest value).
117. However, youth demonstrates the highest level of satisfaction with the development of
democracy, both in Europe and Ukraine (Figure 5.4b). Whereas the level of satisfaction with the
way democracy works is rather stable within all age groups in Europe, it declines in Ukraine
with age. As a result, all the groups aged over 35 years share very pessimistic views as to how
democracy works in Ukraine.
118. Despite the relatively low unemployment rate in Ukraine compared with the other
countries, fear of unemployment increased rapidly during the past few years: from 60 percent of
respondents who worried about unemployment in 2008 to 80 percent in 2010 (Figure 5.5.). The
fear of the non-regulated inflation is ranked first, whereas the third fear is not being paid (or
experiencing delay in payment). Of the top-five fears in 2010, the second, third, and fifth
concerns were related to jobs (unemployment risk, 80 percent; non-payment risk, 74 percent; and
enterprise suspension risk, 43 percent). By comparison, almost all the risks to social cohesion at
the macro-societal level (related to societal goods) are at the bottom of the list during all 20 years
of monitoring. The only exception is the increase in crime, which was one of the biggest fears in
the 1990s (65-70 percent) and gradually decreased to 43 percent in 2010, occupying the fourth
place among top issues in people’s anxiety in Ukraine.
4.71 4.81 4.73 4.643.80 4.00 4.09 4.05
18-34 35-54 55-64 65+
Europe Ukraine
5.02 4.94 4.84 4.89
2.842.33 2.22 2.33
18-34 35-54 55-64 65+
Europe Ukraine
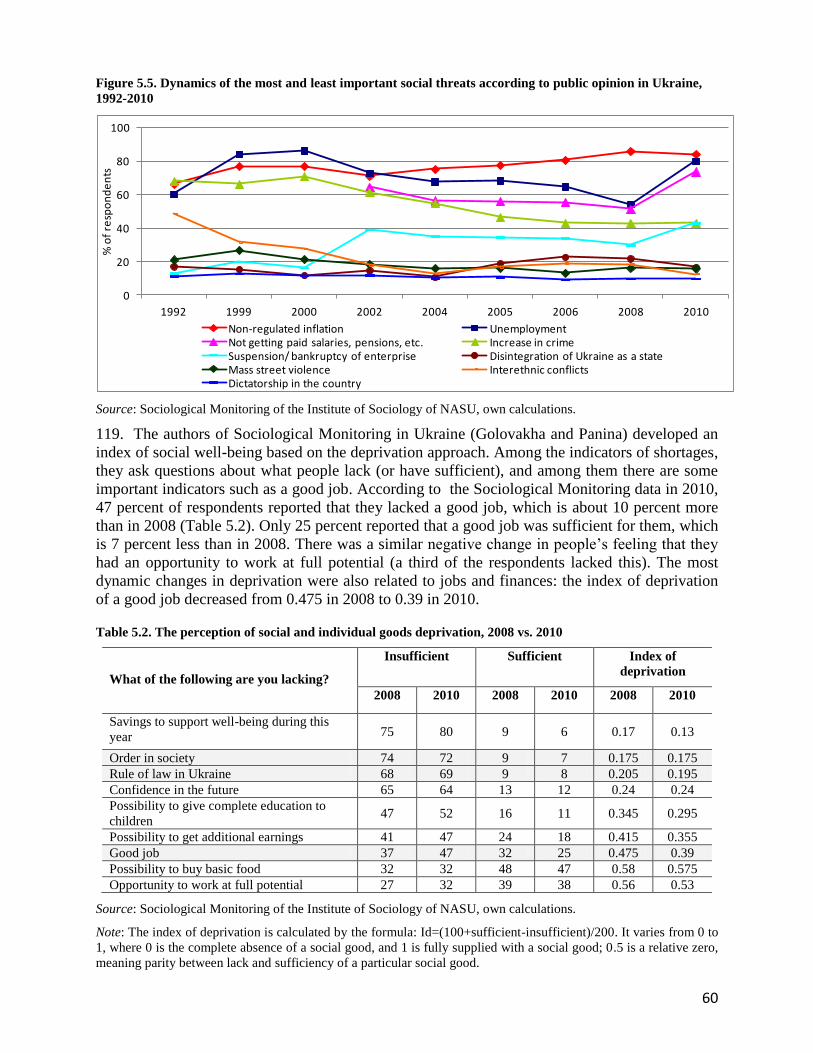
60
Figure 5.5. Dynamics of the most and least important social threats according to public opinion in Ukraine,
1992-2010
Source: Sociological Monitoring of the Institute of Sociology of NASU, own calculations.
119. The authors of Sociological Monitoring in Ukraine (Golovakha and Panina) developed an
index of social well-being based on the deprivation approach. Among the indicators of shortages,
they ask questions about what people lack (or have sufficient), and among them there are some
important indicators such as a good job. According to the Sociological Monitoring data in 2010,
47 percent of respondents reported that they lacked a good job, which is about 10 percent more
than in 2008 (Table 5.2). Only 25 percent reported that a good job was sufficient for them, which
is 7 percent less than in 2008. There was a similar negative change in people’s feeling that they
had an opportunity to work at full potential (a third of the respondents lacked this). The most
dynamic changes in deprivation were also related to jobs and finances: the index of deprivation
of a good job decreased from 0.475 in 2008 to 0.39 in 2010.
Table 5.2. The perception of social and individual goods deprivation, 2008 vs. 2010
What of the following are you lacking?
Insufficient Sufficient Index of
deprivation
2008 2010 2008 2010 2008 2010
Savings to support well-being during this
year 75 80 9 6 0.17 0.13
Order in society 74 72 9 7 0.175 0.175
Rule of law in Ukraine 68 69 9 8 0.205 0.195
Confidence in the future 65 64 13 12 0.24 0.24
Possibility to give complete education to
children 47 52 16 11 0.345 0.295
Possibility to get additional earnings 41 47 24 18 0.415 0.355
Good job 37 47 32 25 0.475 0.39
Possibility to buy basic food 32 32 48 47 0.58 0.575
Opportunity to work at full potential 27 32 39 38 0.56 0.53
Source: Sociological Monitoring of the Institute of Sociology of NASU, own calculations.
Note: The index of deprivation is calculated by the formula: Id=(100+sufficient-insufficient)/200. It varies from 0 to
1, where 0 is the complete absence of a social good, and 1 is fully supplied with a social good; 0.5 is a relative zero,
meaning parity between lack and sufficiency of a particular social good.
0
20
40
60
80
100
1992 1999 2000 2002 2004 2005 2006 2008 2010
% o
f re
spo
nd
en
ts
Non-regulated inflation UnemploymentNot getting paid salaries, pensions, etc. Increase in crimeSuspension/ bankruptcy of enterprise Disintegration of Ukraine as a stateMass street violence Interethnic conflicts Dictatorship in the country
61
120. According to about 70 percent of people in Ukraine, order in society and the rule of law are
unavailable social goods. People feel that these general social goods have been permanently
insufficient over the years of economic crisis. This is a visible threat to social cohesion and the
capacity to peacefully resolve collective action problems, because the rule of law and social
order are the principal means for the development of agreements and implementing them in
policies and practices.
121. Due to the low level of trust in social institutions and the lack of real opportunities to
impact the situation, civic and political participation in Ukraine has also been at a very low level
during the past two decades. This has kept the majority of Ukrainians at a long distance from the
social and political processes. The only exception was in 2004-2005, when people from all over
Ukraine mobilized to participate in the Orange revolution. The share of Ukrainians who are
members of a political party or civic organization varied about 3-5 percent each year over the
past two decades. Nevertheless, employed people were about twice as likely to be included in
political and civic activities as the unemployed (Table 5.3). This supports the argument that jobs
positively influence civic engagement. It would be worthwhile to exclude students from those
who are out of the labor force, because they are just as active or sometimes even more active
than the employed (unlike other groups, such as housewives, pensioners, etc.), but the number of
politically involved people in Ukraine is too small for further analysis.
Table 5.3. Political participation in Europe and Ukraine by labor market status (percent), 2008
Europe Ukraine
Paid work Unemployed OLF Paid work Unemployed
OL
F
Worked in political party or action group
during the last 12 months
4.1 2.5 2.9 4.5 2.6 1.9
Worked in another organization or
association during the last 12 months
13.1 5.7 9 3.1 1.8 1.3
Took part in a lawful public demonstration
during the last 12 months
6.9 5.8 4.3 5.6 5.2 3.6
Source: European Social Survey data (ESS, 2008), own calculations.
Note: Europe N=53,691, Ukraine N=1,806.
122. Ukrainian data on membership in civic and political organizations support the previous
finding: the employed participate in any kind of organization more often than the unemployed
(Figure 5.6.) Statistically significant differences in membership in civic organizations by the
employed, unemployed, and inactive (OLF) are found only for participation in trade unions,
professional organizations, and religious organizations. Among the organizations where
employed people typically participate, trade unions are ranked first (about 5 percent during all
the years), followed by professional associations (about 5 percent), sports clubs (about 4
percent), and religious organizations (about 3 percent). Membership in religious organizations is
almost twice more often among inactive people. A very low level of participation (about 1
percent) was found for all kinds of civic organizations and movements like NGOs, ecological
movements, clubs, charity foundations, and socio-political movements, i.e., all the forms of
social activities that consolidate and develop civic society at the level of individual involvement
in social problems, awareness, and activities. Therefore, there is very limited ability of the
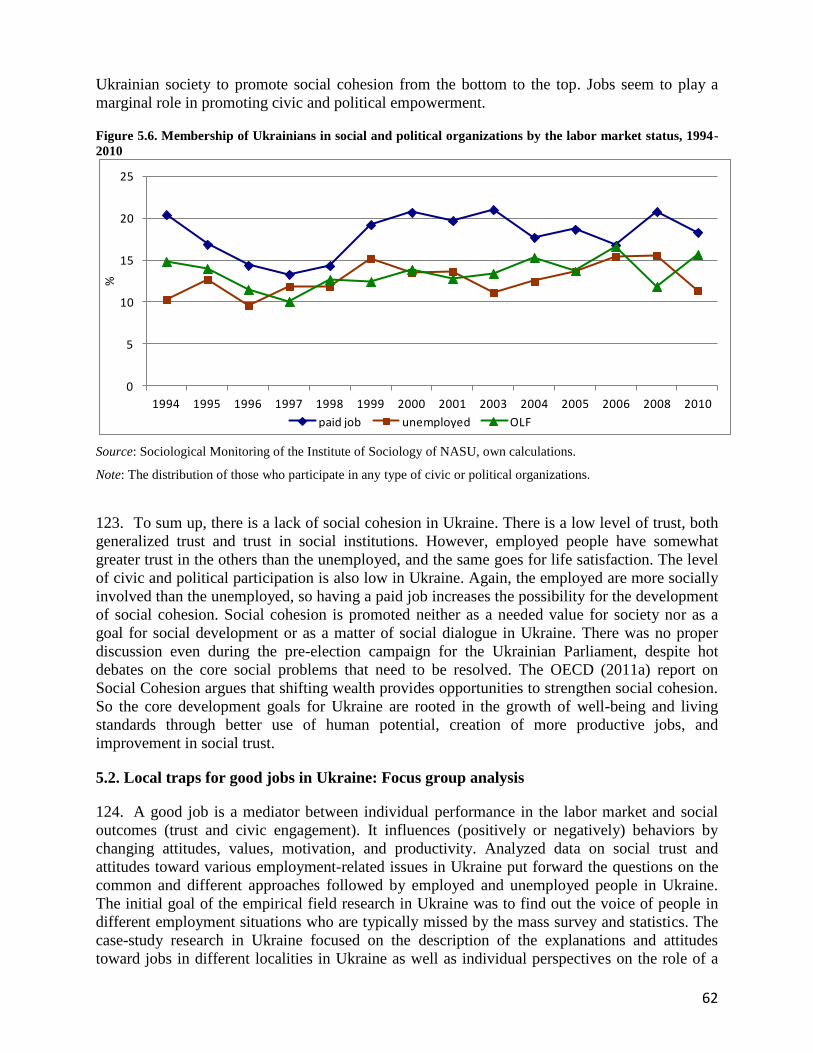
62
Ukrainian society to promote social cohesion from the bottom to the top. Jobs seem to play a
marginal role in promoting civic and political empowerment.
Figure 5.6. Membership of Ukrainians in social and political organizations by the labor market status, 1994-
2010
Source: Sociological Monitoring of the Institute of Sociology of NASU, own calculations.
Note: The distribution of those who participate in any type of civic or political organizations.
123. To sum up, there is a lack of social cohesion in Ukraine. There is a low level of trust, both
generalized trust and trust in social institutions. However, employed people have somewhat
greater trust in the others than the unemployed, and the same goes for life satisfaction. The level
of civic and political participation is also low in Ukraine. Again, the employed are more socially
involved than the unemployed, so having a paid job increases the possibility for the development
of social cohesion. Social cohesion is promoted neither as a needed value for society nor as a
goal for social development or as a matter of social dialogue in Ukraine. There was no proper
discussion even during the pre-election campaign for the Ukrainian Parliament, despite hot
debates on the core social problems that need to be resolved. The OECD (2011a) report on
Social Cohesion argues that shifting wealth provides opportunities to strengthen social cohesion.
So the core development goals for Ukraine are rooted in the growth of well-being and living
standards through better use of human potential, creation of more productive jobs, and
improvement in social trust.
5.2. Local traps for good jobs in Ukraine: Focus group analysis
124. A good job is a mediator between individual performance in the labor market and social
outcomes (trust and civic engagement). It influences (positively or negatively) behaviors by
changing attitudes, values, motivation, and productivity. Analyzed data on social trust and
attitudes toward various employment-related issues in Ukraine put forward the questions on the
common and different approaches followed by employed and unemployed people in Ukraine.
The initial goal of the empirical field research in Ukraine was to find out the voice of people in
different employment situations who are typically missed by the mass survey and statistics. The
case-study research in Ukraine focused on the description of the explanations and attitudes
toward jobs in different localities in Ukraine as well as individual perspectives on the role of a
0
5
10
15
20
25
1994 1995 1996 1997 1998 1999 2000 2001 2003 2004 2005 2006 2008 2010
%
paid job unemployed OLF
63
job in people’s lives and their vision of good jobs for development (see Box 2 on the
methodological details of the focus group discussions).
Box 2. Focus Group Discussions: The Ukrainian Case Study
The case-study in Ukraine was conducted with the focus-group method and in-depth interviews. The research was
aimed at collection of qualitative data recording the attitudes of specific groups in Ukraine toward jobs, producing
a description of the general vision of a job, its social implications, and the core problems from various people’s
perspectives. The main groups for analyzing differences in people’s evaluation of the situation with respect to jobs
were formed depending on location (urban and rural areas), employment status (employed vs. unemployed),
informality (employed in the informal economy vs. formally employed workers), age (young vs. upper-middle
aged people), and skill level (highly skilled vs. lower skilled).
Geographical location covered the differences in structure of the labor market and infrastructural development in
four localities of Ukraine:
Eastern (Donetsk and the region): Heavy industry region with a higher concentration of population, a
higher level of working class rebels—cool-mining protests and large factory strikes to protect job rights—
and mostly regular salary payments.
Western (Lviv and the region): Concentrated service economy in cities and agricultural rural areas with
the lowest employment rates.
Southern (Autonomic Republic of Crimea): Predominantly seasonal jobs of three types—resort-based
employment, agricultural employment, and self-employment in non-agricultural sectors.
Kyiv (multi-industrial capital city): The highest wage level and the highest ratio of internal labor
migration.
The fieldwork was done by the Kyiv International Institute of Sociology in March-April 2012 (Table A.6 in the
Annex). Overall, 17 focus-group discussions (157 informants participated) and six in-depth interviews were
conducted. The core questions discussed focused on the employment situation in Ukraine, the meaning of a good
job, people’s appraisal of the availability and access to jobs, the place of employment within people’s value
orientations, the role of jobs and employment in social inclusion, and survival strategies and cooperation in
different social groups and within families and across generations.
A significant share of the informants recruited for focus-group discussions (FGDs) were those who are employed
informally (with no written contract; 46 of 163) or are non-registered self-employed (13 of 163) as well as those
working part-time from time to time and not registered as unemployed (58 of 163). We have targeted these groups
because this part of the economically active population is typically not included in representative sociological
surveys, but it is a significant part of the informal economy in Ukraine.
The other part of the FGD participants presented the white part of the economy in all four regional employment
locations: 32 of 163 informants had an official employment contract (marked in the official employment history or
trudova), representing the recently graduated youth in the IT sector (Lviv), engineering (in Donetsk), and
sociology (in Kyiv), as well as highly skilled professionals (Kyiv) and those employed in a mono-industrial town
(Ukrainsk, Donetsk region). One group consisted of youth aged 20-25 who were neither in education nor in
employment (in village Vidnyky in Lviv region); it screened their attitudes and opinions about jobs and further life
plans.
Besides, there were six in-depth interviews with private recruiting agency managers (two in Lviv, two in Donetsk,
and two in Simferopol).
125. In general, the main findings from the field research support the previous data from the
quantitative analysis. Widespread informal employment contributes to violation of core worker
rights in such aspects as job security, timely and reasonable remuneration for work done, access
to fringe benefits, age and gender equality, getting a first job for youth, and employment of
individuals according to their skills and qualifications. In addition, there are several schemes for
64
cheating and violation of basic rights used by employers even in the formal sector, as
documented by numerous examples given by the FGD participants. Bribery and other forms of
corruption are also quite widespread phenomena in the Ukrainian labor market: in order to get a
lucrative job in the public sector (local authorities, tax administration, internal affairs, railway,
etc.), one must pay a sizeable bribe or trade in favors. Furthermore, a high incidence of
corruption takes place in those agencies that are responsible for the rule of law in Ukraine. This
makes it impossible to overcome the corruptive schemes in access to jobs and government
subsidies (both direct and indirect). Existing unfairness in the labor market, which is amplified
by widespread corruption and informal schemes, is one of the biggest threats to trust, civic
engagement, and therefore social cohesion in Ukraine. This situation increases the power of local
networks of communication as a guarantee for contract enforcement and produces distrust in
formal rules and procedures. Individualistic survival strategies do not allow individuals to see the
broad perspective on jobs for development and do not help to produce a positive scenario in the
Ukrainian labor market.
126. In all the FGDs, the informants pointed out that a good job in Ukraine is a highly important
issue but it is a rather scarce phenomenon. The dilemma is that getting a job is not extremely
difficult, but being paid for the work done is a big problem. This is very much in line with the
data from the Sociological Monitoring survey, which shows that to get any job is rather easy, but
to get a properly paid job is a big problem in most of the regions in Ukraine (Figure 2.10).
Unfairness in interactions and mutual distrust and non-enforcement of agreements, both written
and oral, run through all spheres of the Ukrainian economy, including the labor market.
127. A good job: Individual applications. The first priority in describing the meaning and
motivation for a good job in all locations in Ukraine is related to remuneration: salary should be
high and stable, and most importantly it should be paid in the agreed amount and time. The latter
issue was particularly highlighted by informally employed and unemployed informants. Highly-
skilled professionals, as well as those who recently graduated from universities, emphasized that
the salary must be high enough to meet all the worker’s needs and to leave room for self-
development and self-realization, social competences, and recreation. Almost all participants in
the FGDs highlighted that the salary for a good job must be official (i.e., declared) and all taxes
must be paid. However when informants were asked to choose whether (1) to get a larger salary
that is undeclared or (2) to get half the salary but officially, most preferred the former option.
The first reason for this choice is lack of trust in the budget allocation and income redistribution
procedures used by the Ukrainian government. The second is the low level of salaries, which
must cover not only physical surviving, but also all of the household’s needs. And the third
reason is that people need extra money to cover intergenerational transfers, i.e., to support
children or parents with low salaries or pensions.
128. The official (written) type of labor contract is the next most important feature for the
employed in Ukraine. It was very often highlighted that a good job is the one with a signed
contract, not only “on paper” but strictly enforced. It provides proper social protection (with all
employment records and official taxes for future pension calculation), guarantees payment of
salary, and is a full-time job.
129. In many cases discussed by the different groups in all the locations, the respondents gave
examples on how to get a good job in the public sector: a bribe must be paid, especially in
medicine, state administration, police, prosecutor's office, customs, security (the system of
internal affairs), and railways. The situation with the need to pay bribes for getting stable
65
employment in the public sector reproduces the system of bribery and corruption, because the
largest privilege of working in this sector is the possibility to get additional income from
informal transfers (bribes, presents, and social capital conversion—information and the
possibility to resolve problems using one’s own position or the positions of other connected
bureaucrats). Participants in the FGDs pointed out that it is impossible to change this situation
from the people’s side, because it is a part of the state administration system, which is making
the rules and is built in a way to go around the laws as much as possible.
130. Using social network is the most efficient way to get a job and have some security for
getting payment. All the participants in the FGDs pointed out that the most realistic and
widespread way to get a good job (and to get any job) is through friends and acquaintances,
including former colleagues and bosses. All the other ways are much less efficient and provide
fewer guaranties of decent job relations and fair (or any) payment.
131. The lack of a guarantee for being paid for the work done was the most discussed problem
among all the FGDs, and there is no way to protect this core worker right both in case of official
(written) and oral employment agreement. The respondents also gave a lot of examples of
widespread schemes involving probation time for a position (one-to-two months) with low or no
salary followed by dismissal and replacement by new employees within the same scheme. The
other scheme used by employers in retail trade (shops and markets) is to create a shortfall and
take it from employees’ salaries, so the salary is not paid because there is a shortfall, and the next
employee is hired.
132. Gender equality in the workplace is one of the features of good jobs that was discussed in
the FGDs. Violation of women’s basic rights was frequently mentioned by youth at the early
stages of their careers, who provided examples from their lives and their nearest networks.
Young female participants pointed out that sexual harassment is considered almost a norm in
vertical job relations, and that women have no recourse to prosecution. Informal job contracts do
not provide any social security to young female workers in case of sickness or pregnancy, and
the prejudice of employers toward young women who already have small children or will
probably have them in the future is a big obstacle to getting a good job in the formal sector.
133. The FGD participants in all the regions stated that the Public Employment Service (PES) is
not efficient in placing workers in good jobs. First, firms are obliged to provide information on
vacancies, but they are not interested in hiring people for those vacancies. Second, the vacancies
provided by the PES are located in the low-paid segment of public enterprises, providing full-
time employment at a very low wage. Third, respondents gave examples of oral agreements
between the PES and firms: the PES sends a jobseeker to a firm to fill a vacancy, but this
jobseeker must pay some part the first salary to the PES officer for getting a job, even though
he/she can be fired in the near future because of collusion between the PES officer and employer;
then the PES officer sends other jobseeker to the same firm, gets a part of his/her salary and so
on.
134. As regards private recruiting agencies, FGD participants who had an experience using their
services (for aged 40+, mass professions) also gave examples of how private recruiting agencies
cheat with vacancies a lot, as they are mainly interested in getting paid but not in giving jobs.
From the viewpoint of private recruiting agency representatives in all three locations, they are
efficient for searching for jobs for highly-skilled employees, they work with official employment
contracts only, and they try to make a “black list” for cheating companies. But they have nothing
66
to do with the scheme of probation, when a job starts at an agreed low wage in the beginning and
is supposed to pay a much higher wage thereafter. When the probation time finishes, the
employee is fired for this or that reason and a new employee is hired under the same conditions.
135. Coping strategies to get better jobs. Family relations and the closest network of relatives
and friends are the main source of social support in case of unemployment, disease, and other life
difficulties. This point was highlighted within the course various questions that were discussed:
from the means to get a job to the possibility of surviving in the case of losing a job and a salary.
136. Labor migration strategies in different locations are different. And attitudes toward labor
migration are different depending on the individual’s age. Middle-aged and older generations
have some experience with international labor migration. They pointed out that, due to the
economic crisis, the situation in Europe has changed, and wages there are no longer high enough
for migrant workers to live there and remit money to support family at home. So now they see
more advantages in staying at home, caring for family, and overcoming the difficulties in place.
Younger people would like to use temporary labor migration in order to develop their
professionalism, to see other countries, and to earn more money. However, few participants in
the FGDs had concrete plans for labor migration, i.e., they pointed out that they had checked
some programs and potential places for migration, learned a foreign language, contacted friends
who had migrated to work abroad, etc. Mostly the discussion focused on describing the
difficulties and obstacles to international labor migration rather than its advantages or plans to
migrate. Youth (university graduates) in the Donetsk FGD were less oriented toward labor
migration than those in Lviv and Kyiv. Some highly-skilled professionals (FGD 10 in Kyiv)
reported that they plan to emigrate as soon as they get a proper job offer abroad, and the main
reason for their emigration intentions was to give their children a better education and better
prospects by living in a more civilized society (in Europe, Canada, or Australia).
137. Participants in the FGDs mentioned several reasons for labor migration within Ukraine.
The first one is lack of employment opportunities in their places of residence. The second reason
is that the salary is higher in other cities for the same jobs available in their own place. The third
reason (discussed in groups with youth) was to see the large, attractive cities of Ukraine and to
live there for some time. Almost all the FGD participants considered Kyiv as the most attractive
city for getting a good (highly paid) job. They also considered Donetsk and Kharkiv to be
possible destinations for labor migrants from the Donetsk region, but only if there were some
relatives and friends who could help with accommodations and support for getting payment for
the work done.
138. High migration costs (i.e., shelter, food, and travel) and the high risk of not receiving
correct payment or not being paid for work done are the two predominant reasons for not
considering labor migration within Ukraine as a strategy for getting a better job. For unemployed
and informally employed people of both sexes, family is the most important source of support,
but resources to move to some other place in Ukraine are very limited. Furthermore, the labor
market situation is approximately the same all over Ukraine. Many individuals are the local
unemployed, and expected net benefits from migration are not always positive due to small wage
differentials and relatively high migration costs.
139. “Social agreement” between youth and older individuals. Three main points came up in
the discussions about contributions to the Pension Fund and the intergenerational “social
agreement.” First, it was obvious for the majority of all FGD participants that contributions to
67
the Public Pension Fund are necessary to support the current generation of the elderly, and the
participants are ready to pay it. But it was mentioned in almost every discussion that there is no
trust in the state or in bureaucrats; there was no transparency in income redistribution; and that
pension provision was inadequate. Given these concerns, people who have under-declared
income from informal employment are ready to support directly their relatives rather than
contribute to the Public Pension Fund. Second, in most cases social support and protection come
from family and intergenerational support. But the real problem in Ukraine is that the older
generation of parents is able to support their children in difficult situations, especially in cases of
unemployment or temporary or casual jobs, much more often than children can support their
retired parents. This is because the latter receive pensions that are paid on time and in the full
amount, and their monthly expenditures are usually much lower.
140. Third, in most cases, young people agree to support the older generation in the future, both
by direct transfers to their parents and relatives and through the necessary contributions to the
Public Pension Fund. But as a rational strategy for themselves, they would prefer to save money,
if such problems as high inflation, monetary reforms, changes in the pension law, instability in
the banking system, and general uncertainty did not exist in Ukraine. Another problem that is
highlighted by unemployed youth is that pensions provided by the Public Pension Fund are very
low and do not provide adequate means for subsistence. This forces pensioners to keep working
even after reaching the official retirement age and therefore limits the number of jobs for the
youth.
141. Conclusions. This section has discussed the issue of good jobs and employment situations
in four locations in Ukraine and among people with different labor market experiences. The
FGDs revealed several problem areas that have an impact on individuals and the social
development of Ukraine. In different social milieus, people emphasized that good jobs would
ensure the self-realization of the person, promote education and skills development, provide
career growth opportunities, and help build communication and social networks. But inadequate
returns to education, talent, and skills, and the generally low level of the quality of
communication (with an increase in the informal economy, corruption, and bribery) have caused
the majority of the FGD participants to have a pessimistic view of social and economic
development in Ukraine. These are some of the reasons for high intentions to emigrate among
younger and better educated specialists.
142. A considerable share of the FGD discussions focused on the informal economy, although it
was not the primary focus of this research. The topics of concern within the FGDs—i.e.,
employment strategies, the definition of a good job, internal labor migration, social protection,
etc.—raised the issues of informal practices and mechanisms for their operation. Many
participants in the FGDs demonstrated high respect for the law and talked about the need to live
according to the laws (payment of taxes; employment according to skills, qualifications, and
experience, and not by relationships or bribes; and formal employment with an agreed salary).
But all of them highlighted that the bureaucratic system in Ukraine is corrupt from the top to the
bottom, and it does not provide incentives for behaving well.
143. The highest level of mutual support is rooted in social relations among the generations, and
the social capital of families and close friends is the most important social protection in all
situations related to job loss, finding employment, and relationships with employers. The level of
dissatisfaction is rather high, but the level of readiness to collectively protest is fairly low. The
low readiness to protest, as was argued by the participants, is based on their previous experience
68
in labor conflicts and protests (like the situation with non-payment of wages), which appeared to
be ineffective and led to dismissal of the most active participants of the protest.
144. People aged 40 years and older highlighted the difficulties in finding a job that matched
their experience and skills because of some implicit age threshold. Representatives of private
employment agencies also pointed out age as a barrier to official employment.
145. A big problem in employment-related social relationships is the lack of trust and mutual
respect and non-enforcement of contracts, which provoke a high level of abuse and unjust labor
relations. People deal with this by relying on close social networks. In the long run, this produces
informal networks of close relationships with distancing from formal rules and “the others” not
included in the networks. Such a low level of connection with the wider society reproduces
divisions between “us” and “the others” with the same type of unfair relations to “the others” not
included in the close networks, which reproduces a low level of trust in the generalized others.
146. Strong and weak social connections that compose bridging and bonding social capital19
have their own characteristics in Ukraine. They are strong within local, close networks of
relatives and friends. At the same time, there is lack of trust in social institutions and the wider
society. This provides the grounds for double institutionalization: formal employment is valued,
but bureaucratic burden, high taxes, and corruptive schemes reproduce the social background for
the growth of the informal economy. Taking into account people’s strong opinion that it is the
government's responsibility to provide opportunities for jobs, there is an urgent need for reform
of the institutional setting in Ukraine and improvement in the fairness of the labor market and
other spheres of life in order to make society more cohesive.
5.3. Jobs and social cohesion: Development perspective and aging
147. Social identity and societal development. Jobs include people in communicative
networks that share common values. Having a good job promotes more tolerant values; non-
discriminating attitudes toward gender, age, and ethnicity; and improvement in the subjective
well-being of a jobholder and his or her close network. At the individual level, a full-time job
shapes people’s time and effort, the motivations and norms of interactions, patterns of social
participation, and mobility. It also has accumulative effects in the wider society, promoting
social cohesion or cleavages through the connection of social identity to social participation and
sharing norms of legitimate behavior for concrete groups (professional groups, age groups, etc.)
in the society. The social contract between generations (youth and the elderly) in Ukraine is
grounded in the shared perception of the necessity of mutual support, both at the individual level
(support for relatives) and as generalized support (through tax to the Pension Fund). However, as
to its practical implementation, generalized support is legitimized only at the level of good job
holders, excluding informal jobs (oral employment contracts) and low-paid workers. So in the
development perspective, the crucial issues for the aging society in Ukraine are:
To maintain social support values through shifting informal employment to more
official and secure jobs.
19
According to Putnam (2000), bridging social capital is inclusive, and bonding social capital is exclusive. The
difference is in the capacity of bonding social capital to develop strong in-group identities for more homogenous
groups and hence lead to cleavages between them; bridging social capital is aimed at more heterogenic group
identity, outward-looking networks that encompass people across diverse social cleavages.
69
To use more efficiently the professional capital of unemployed, pre-pension, older
people by implementing an anti-ageism policy in employment, career promotion, and
dismissal.
To provide transparency in the dissemination of information about vacancies and
dismissal policies, promoting anti-discriminative norms of interpersonal and inter-
group behavior at the level of state and private employers (firms, companies,
organizations), and especially in state bodies (internal affairs, tax offices, customs,
police, security, etc.).
148. Social networks. Employed people affect the subjective well-being of their relatives,
colleagues, and friends by influencing values, attitudes, and behaviors. The ability to develop
new network connections deteriorates with age, especially given the decreasing propensity to
relocate to a new place or find a new job. However, networking and mobility are important for
both social cohesion and job search. As a result, an aging population with limited willingness to
relocate and start new connections, even within the personal environment, will face fewer
choices for personal and professional development. At the same time, social networks among the
elderly are smaller in size, more stable, and tend to pursue more conservative values. In addition,
connections between such networks tend to be weaker. From the development point of view,
extreme conservatism has a rather adverse effect, since even the most necessary changes will
face greater opposition and will be difficult to implement.
149. The aging of the population and the resulting demographic pressure on the labor supply
call for more active inclusion of diverse social groups into the labor force. Among the most
obvious examples are young females, the disabled, and representatives of ethnic minorities, but
one can also think of attracting foreigners to substitute for aging labor. Currently, networks of
different ethnic groups are mostly closed and rarely mix in Ukraine. For example, there is a
phenomenon of ethnic entrepreneurship in which representatives of the same ethnic minorities
tend to work and live in compact neighborhoods. This finding is robust across regions,
occupations, levels of qualifications, and other job-related characteristics. The only exception is
in large cities, where different groups’ representatives mix geographically, but social groups are
still relatively homogenous. Strong social networks within established groups may prevent
representatives of outside groups from penetration and, hence, establishing new networks or even
expanding the incumbent ones. At the same time, possible synergy effects from expanding these
networks may potentially have positive effects for productivity, generating more social inclusion
and social cohesion in general.
150. Fairness. The most important background for social cohesion is mutual trust based on
fairness that mediates relationships from the interpersonal to institutional levels. The low level of
social trust is a principal feature in Ukrainian society that resulted from the post-USSR
transformation. It is rooted in the double institutionalization and double consciousness, which
produced a high level of distancing of people from the official state bodies. It produced a low
level of trust in social institutions and a high level of trust in the nearest networks of
communication. Such a combination creates the grounds for empowering the informal society
and economy. The corrupted state bodies that reproduce the informal economy receive the low
level of trust and support from the society as a feedback. A low level of trust both in employers
and economic institutions (tax authorities, the Pension Fund, trade unions, etc.) is a serious
obstacle to the development of an effective market economy in Ukraine.
70
151. As long as the number of high-quality jobs in the primary labor market (according to the
labor-market segmentation theory) is restricted, with limited growth perspectives, there is severe
competition for the available jobs. If the labor market is large, as in large cities and
agglomerations, access to jobs is mostly skill and merit-based. In smaller markets, access to such
jobs is granted predominantly via informal networks, based on personal or family connections, or
on a privilege basis. The job markets in some sectors (civil service, tax administration, education,
health care, railroads, etc.) can be so closed that it is impossible to enter them without having
very strong connections with "insiders" or paying bribes that exceed the monthly salary by many
times, regardless of educational credentials or personal achievements.
152. Such invisible barriers—like a "glass ceiling"—prevent large numbers of skilled and well-
performing workers from obtaining and securing the most prestigious and better-paid jobs,
bringing about frustration and social deprivation. At the macro level, the self-sustained system of
restricted and unfair access to good jobs has adverse effects on the development of human capital
and productivity growth, because the incentives to obtain better education and to work more
productively vanish due to the lack of merit-based recruitment. Furthermore, if people, having no
other alternatives, do choose to give a bribe or trade in influence to get a job in the primary labor
market, corruption is sustained and the system reproduces itself, with all its detrimental
development effects.
153. Young people without the necessary connections often start their careers in the secondary
labor market, where jobs are less secure and working conditions and pay are generally poorer.
They are forced to take up these bad jobs in preference to unemployment, considering such
positions as temporary. Although these jobs may provide the necessary general-purpose training
and a network of contacts, they rarely serve as ports of entry to better jobs in reality. Hence, the
inequality in access to good jobs does not disappear, and most workers remain trapped in
secondary jobs. The same applies to high-productivity workers from older age cohorts who were
displaced from their previous jobs in the primary labor market and were sorted into the
secondary labor market because of stringent budget constraints, on the one hand, and widespread
age discrimination in the primary market, on the other hand.
71
6. Good jobs for development and possible trade-offs across the three transformations: The
Ukrainian context
6.1. Good jobs for development: Examples
154. As our analysis in the previous sections shows, addressing the jobs challenge in an aging
society requires increasing productivity, the labor force participation rate, and the mobility of
workers. Without substantial productivity gains, which would be expected if enterprises
restructured strategically, the investment climate improved, and human capital enhanced by the
responsive VET system, the living standards of Ukrainians might rapidly decline, and the
indicators of social cohesion, which are already low in Ukraine, may become even worse. In
order to cushion the Ukrainian economy and society against shortfalls in the supply of labor and
the increased burden of the aging population, it is particularly important to create more jobs that
have large development pay-offs and positively contribute to living standards, productivity, and
social cohesion.
155. Taking into account the recent developments in the Ukrainian labor market, we suggest
several examples of good jobs for development that are likely to provide high value for society
due to positive spillovers. These examples are based on the argument that the following are key
to addressing the possible constraints caused by aging through increasing productivity and
participation: (i) to bring out learning spillovers (e.g., from FDI or cross-border movement of
workers); (ii) to raise the activity and productivity levels of underemployed categories of the
population, including rural residents, youth, women with small children, the elderly, return
migrants, and residents of backward regions; (iii) to enhance innovation and entrepreneurship;
and (iv) to improve the health status of the younger generations not only through improvements
in lifestyles and health care, but also through investment in environmentally-friendly and energy-
saving technologies.
156. Example #1: Companies with FDI (mostly multinational enterprises) bring to Ukraine not
only advanced technological and managerial knowledge, but also Western standards of work
ethics and corporate social responsibility, which are very important for an economy in transition.
Foreign companies usually pay higher salaries that are officially declared, and therefore they
contribute disproportionately to the budget, the Pension Fund, and social insurance funds.
Moreover, they usually provide more fringe benefits to their employees, support basic workers'
rights, comply with Ukrainian employment protection legislation and environmental standards,
envisage more training and employment opportunities for youth, demonstrate tolerance for
socially vulnerable groups, and therefore provide more grounds for trust and social cohesion than
domestic firms. These amenities spill over to the rest of the economy, particularly export-
oriented companies, through horizontal and vertical linkages and knowledge diffusion by
demonstration effects and movement of employees. In addition, companies with FDI have direct
and indirect effects on the economic development of Ukraine through their increased ability to
attract further capital via agglomeration effects, increasing the pace of financial sector
development, encouraging specialization and export diversification, and putting external
discipline on the Ukrainian government. Foreign companies may also be a potential source of
"greening" effects as they directly transfer more energy-efficient and environmentally friendly
technologies and indirectly facilitate spillovers to domestic firms. Therefore, more jobs created
in such companies are likely to boost productivity and economic growth, provide sufficient
“absorptive capacity,” and improve living standards of Ukrainian population.
72
157. However, market and natural resource-seeking factors still prevail among foreign investors
in Ukraine, leaving such factors as looking for labor-productivity advantages or access to local
research and technological expertise (efficiency-seeking factors) as much less important.
Furthermore, these companies are less likely to enter backward areas because of poor
infrastructure and low human capital stock, and are reluctant to work with local suppliers. There
are also still strong barriers to the operation of foreign firms in Ukraine. The most important
problems faced by foreign investors are the high level of corruption, the ambiguity of the legal
system, bureaucracy, political and economic instability, weak contract enforcement, and lack of
implementation of investment policy legislation (Kudina and Jakubiak, 2008; OECD, 2011b and
2012).
158. Example #2: Agricultural (small and middle-size farmers) and non-agricultural firms
creating all-year jobs for rural workers in the formal sector may contribute to higher living
standards in rural areas; to productivity gains in agriculture and the allied food processing
industry through economies of scale; and to better human development outcomes in agrarian
regions through higher taxes paid to local budgets that can be spent on schools, hospitals, and
public infrastructure and through incentives for highly educated rural youth to return to their
homes.20
In view of Ukraine's comparative advantage in agriculture (an abundance of high-
quality agricultural land, favorable climatic conditions, and low labor costs) and the expected
increase in global demand for food, agricultural business is one the three high-potential sectors
for investment and development defined by the OECD Sector Competitiveness Strategy for
Ukraine (2012).
159. But creation of good jobs by small and middle-size farmers is hampered by the ongoing
processes of capitalization and land consolidation, with the dominance of domestic, vertically
integrated and export-oriented "agro-holdings," which are primarily specialized in crop
production (grain, sunflower seeds, rape seeds, and corn) and poultry farming. The major
concern for small and medium-size farmers is the difficulty in accessing external finance; this
limits their ability to invest in fixed assets, such as machinery and storage facilities, and to buy
high-quality inputs, such as seeds, fertilizers, livestock, and feed. Strategic investment in
agriculture, including foreign investment, is discouraged by existing limitations on ownership of
agricultural land and usage of land assets as collateral, ad hoc implementation of export quotas
on selected cultures, and increasing state interventions in the agricultural business (OECD,
2012). The other sector challenges are poor yields and low quality of products (particularly of
milk, with 80 percent of production coming from households that own fewer than five cows,
which do not match the quality standards of neighboring countries), monopolized market
structure in storage and distribution, and lack of technical skills in the field of agronomy,
financial literacy, and entrepreneurship abilities.
160. Example #3: Jobs created by small entrepreneurs among return migrants may also be
good in the development sense because they are likely to increase employment levels (the
working-age population would return to Ukraine for employment and not for retirement as
usual), to boost productivity and investment in backward areas (through the productive use of
accumulated earnings and new skills brought from abroad), to improve collective decision
making, and to change the attitudes and voting behavior of their neighborhood by "remitting"
democratic values and attitudes from abroad. Entrepreneurship among return migrants is more
20
See a detailed analysis of demographic changes and the problems of the rural population in Ukraine in
Skryzhevska and Karacsonyi (2012).
73
likely to be "opportunity entrepreneurship" by nature, i.e., based on new business ideas and profit
opportunities, rather than "necessity entrepreneurship" in which individuals are forced to create
small businesses due to lack of wage employment as often happens in Ukraine. Entrepreneurship
created from opportunity rather than necessity is expected to generate higher knowledge
spillovers and attract further capital via agglomeration and cluster effects (EBRD, 2011).
Therefore, it is likely to have a more positive impact on the living standards of the population
and on economic growth than "necessity entrepreneurship." Another positive externality from
such business start-ups by returnees is that they set an example for other migrants who stay
abroad for a long time and are afraid of coming back to their home country because of
uncertainty about their work after return to Ukraine. The return of such migrants, seen as "the
agents of development and innovation," is particularly important for Ukraine's development,
given the challenges of its aging and shrinking population.
161. A major factor that is frequently mentioned by migrants during in-depth interviews and
focus group discussions is the invisible barriers, particularly in small towns and villages, created
by public agencies (police, tax authorities, public administration, sanitary service, etc.), local
competitors, and business rackets. These barriers are seen as more important among return
migrants than among other Ukrainians, probably because migrants working in market economies
get used to civilized business conduct and a business-friendly environment, and because they
lose the necessary social connections in Ukraine, which are very important for successful start-
up.21
In addition, opportunity entrepreneurs are probably "more likely to attract the attention of
corrupt officials since they are more worthwhile targets for extracting bribes" (EBRD, 2011, p.
86).
162. Example #4: New jobs in the start-up companies generating "green" energy (wind and
solar power plants) in rural or mountain areas with low productive land or unfavorable climate
may be used as an alternative to employment in agriculture and small-scale activities. For
example, four solar power plants were recently launched in the villages of Rodnikovoe,
Okhotnykovo, Perovo, and Mityaevo in the Crimean AR; two wind power projects are under
realization in the coastal area of the Azov Sea in Zaporizhia and Donetsk oblasts; and the first
bio gas plant was launched in Cherkasy oblast. Such jobs produce positive externalities through
reducing greenhouse gas emissions and through vertical linkages with local suppliers, and are
likely to increase productivity and employment growth in the allied industries.22
Furthermore,
peoples' involvement in such socially important jobs gives them the feeling that they are
contributing to the "greener" future of Ukraine and better health for future generations. In view
of the fact that Ukraine is one of the most energy-intensive economies in the world, development
of renewable and environment-friendly energy resources, along with improvements in energy
efficiency in the manufacturing sector and energy savings in all sectors, are high on the country’s
policy agenda.
21
According to the EBRD-World Bank Life in Transition Survey in 2010, 11.5 percent of all adult Ukrainian
respondents had ever tried to set up a business but 53.5 percent of them failed. Of those who failed, 49.5 percent
listed "lack of capital" as the main reason for not managing to set up a business, and 25.6 percent mentioned "too
much bureaucracy/ red tape," 18.9 percent mentioned "change in personal situation," 2.7 percent mentioned
"competitors threatened me," 2.1 percent mentioned "couldn't afford the bribes," and 1.2 percent mentioned
"couldn't afford protection payments." 22
According to the CEO of Activ Solar, Kaveh Ertefai, four large-scale solar photovoltaic power stations installed
by his company in Crimea in 2011-2012 are able to save around 230,000 tons of carbon emissions each year on the
peninsula (http://activsolar.at/). In 2008, Activ Solar launched a comprehensive modernization program for its
semiconductor plant based in Zaporizhia, with a long history of polysilicon production dating back to 1964.
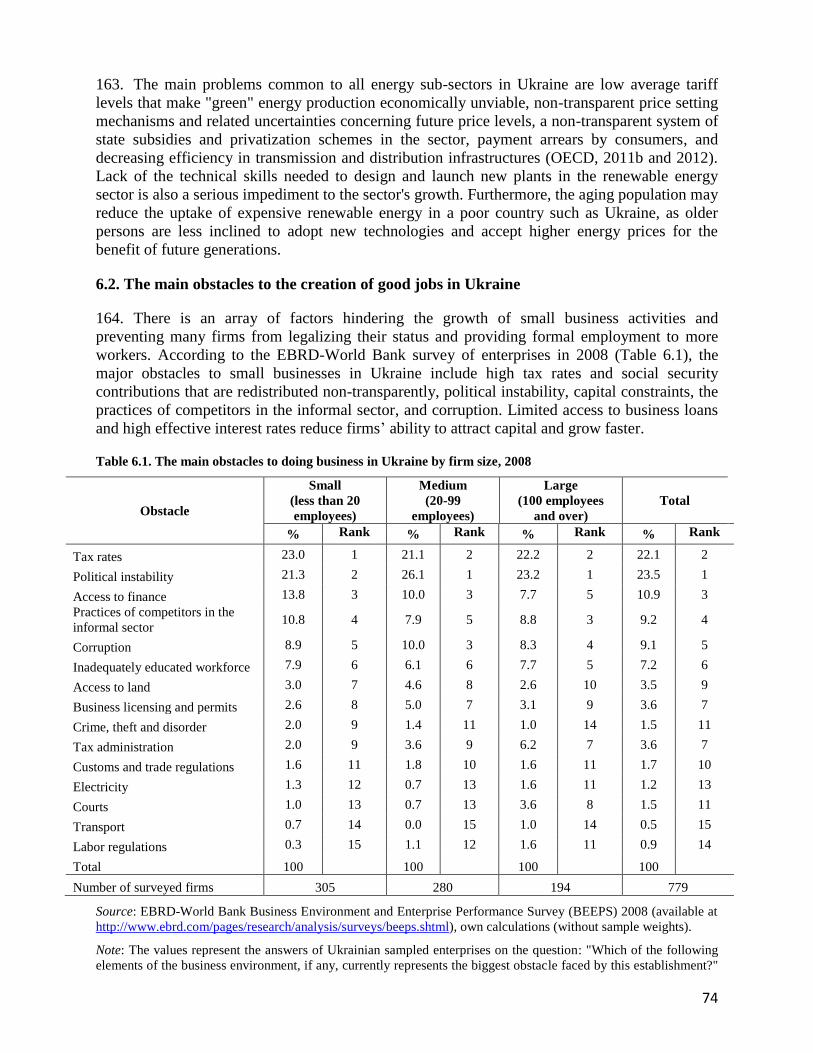
74
163. The main problems common to all energy sub-sectors in Ukraine are low average tariff
levels that make "green" energy production economically unviable, non-transparent price setting
mechanisms and related uncertainties concerning future price levels, a non-transparent system of
state subsidies and privatization schemes in the sector, payment arrears by consumers, and
decreasing efficiency in transmission and distribution infrastructures (OECD, 2011b and 2012).
Lack of the technical skills needed to design and launch new plants in the renewable energy
sector is also a serious impediment to the sector's growth. Furthermore, the aging population may
reduce the uptake of expensive renewable energy in a poor country such as Ukraine, as older
persons are less inclined to adopt new technologies and accept higher energy prices for the
benefit of future generations.
6.2. The main obstacles to the creation of good jobs in Ukraine
164. There is an array of factors hindering the growth of small business activities and
preventing many firms from legalizing their status and providing formal employment to more
workers. According to the EBRD-World Bank survey of enterprises in 2008 (Table 6.1), the
major obstacles to small businesses in Ukraine include high tax rates and social security
contributions that are redistributed non-transparently, political instability, capital constraints, the
practices of competitors in the informal sector, and corruption. Limited access to business loans
and high effective interest rates reduce firms’ ability to attract capital and grow faster.
Table 6.1. The main obstacles to doing business in Ukraine by firm size, 2008
Obstacle
Small
(less than 20
employees)
Medium
(20-99
employees)
Large
(100 employees
and over)
Total
% Rank % Rank % Rank % Rank
Tax rates 23.0 1 21.1 2 22.2 2 22.1 2
Political instability 21.3 2 26.1 1 23.2 1 23.5 1
Access to finance 13.8 3 10.0 3 7.7 5 10.9 3
Practices of competitors in the
informal sector 10.8 4 7.9 5 8.8 3 9.2 4
Corruption 8.9 5 10.0 3 8.3 4 9.1 5
Inadequately educated workforce 7.9 6 6.1 6 7.7 5 7.2 6
Access to land 3.0 7 4.6 8 2.6 10 3.5 9
Business licensing and permits 2.6 8 5.0 7 3.1 9 3.6 7
Crime, theft and disorder 2.0 9 1.4 11 1.0 14 1.5 11
Tax administration 2.0 9 3.6 9 6.2 7 3.6 7
Customs and trade regulations 1.6 11 1.8 10 1.6 11 1.7 10
Electricity 1.3 12 0.7 13 1.6 11 1.2 13
Courts 1.0 13 0.7 13 3.6 8 1.5 11
Transport 0.7 14 0.0 15 1.0 14 0.5 15
Labor regulations 0.3 15 1.1 12 1.6 11 0.9 14
Total 100 100 100 100
Number of surveyed firms 305 280 194 779
Source: EBRD-World Bank Business Environment and Enterprise Performance Survey (BEEPS) 2008 (available at
http://www.ebrd.com/pages/research/analysis/surveys/beeps.shtml), own calculations (without sample weights).
Note: The values represent the answers of Ukrainian sampled enterprises on the question: "Which of the following
elements of the business environment, if any, currently represents the biggest obstacle faced by this establishment?"
75
The values are ordered by their importance (frequency) for small firms. Only one answer was allowed. The answers
"Don’t know" and "Does not apply" are not taken into account.
165. Due to weak enforcement of fairly strict labor regulations, which are widely evaded,
particularly in non-unionized small private firms, and due to the existence of more important
obstacles, labor regulations are viewed by Ukrainian small businessmen as the least significant
obstacle to their firms’ operation and growth. However, the creation of jobs in the formal sector
through violation of key labor regulations (regarding probation time, remuneration, vacation,
sick leave, layoffs, special conditions for women, youth, the disabled, and other vulnerable
categories) is not an optimal outcome as it undermines the rule of law, exposes firms to costly
uncertainty, and leaves workers without adequate protection (World Bank, 2006). Furthermore,
such practices erode the trust of Ukrainians in private businesses and the market economy as a
whole, strengthen nostalgia for the Soviet past, and reinforce people's calls for more jobs created
in the public sector and more state interventions in the private sector.
166. Growth of medium-size and large firms is impeded by similar factors but in a different
order of significance. The major constraint for both medium-size and large firms is political
instability in Ukraine (Table 6.1). And the issue is not so much in the frequently changing
policies or rules as in the different implementation of the same policies and rules by different
governments and fragmentation of the policymaking process in general. Political instability and
uncertainty generate uncertainty about the future course of economic policies (including tax and
exchange rate, inflation, international trade, foreign investment, privatization, industrial,
regional, labor market, and social policies) and the security of property rights (Carmignani,
2003). Weak property rights protection calls for off-shoring a firm’s activities and adversely
affects long-term investment decisions. State capture by narrow interest groups and crony
capitalism, which are widespread in Ukraine, constrain the entry and growth of new firms in the
privileged sectors with high returns and significant state support, and leave the room for
development of small and medium enterprises (SMEs) only in less attractive, low-productivity
sectors.
Box 3. “A targeted investment climate? Should efforts to improve the investment climate ever target the
areas, activities, or firms with the greater potential to create good jobs?”
It has long been recognized that regional development is one of the most important factors for local sustainable
growth, which should ultimately lead to an increase of people’s welfare. To meet this goal, Ukraine established
specific customs and tax regimes for Special (Free) Economic Zones (FEZs) and Territories of Priority Development
(TPD) at the beginning of the century to attract investment, stimulate employment, increase exports, and modernize
infrastructure in specific areas. It was shown that prior to 2005, most FEZs were used for avoiding import excise
taxes by firms registered there rather than for attracting FDI flows, and the overall effect was dubious for most zones
and territories, with several rare exceptions (Vyzhnya and Nizalova, 2006). The productivity of the firms within
those zones has indeed increased, but mostly due to a favorable market position, which was a result of better access
to imported goods and taxation holidays, rather than due to establishing production assets there. The synergy effects
for firms outside those free economic zones as well as the growth effects for the hosting regions were not found to
be significant. Furthermore, the cost of these FEZs and TPDs in terms of tax avoidance amounted to more than 3
percent of GDP annually (OECD, 2011). Recognition of this fact has led to the government's ban on activities of all
FEZs and TPDs in 2005, when all of them were closed and all privileges granted to business entities operating in
these areas have been revoked.
In 2010 the Ukrainian authorities reactivated a special regime in FEZs and TPDs; currently 11 FEZs and 72 TPDs
are again operational in the Crimean AR and 12 oblasts. According to SSSU (2012), 152 investment projects, which
are being realized in eight FEZs and 25 TPDs, are supposed to attract USD 2,091.8 million in total. As of January 1,
2012, USD 1,542.9 million had already been acquired. However, the share of FDI in total investment was only about
76
a third (34 percent), while the rest has been invested from within Ukraine. In 2011, local investors allocated USD
130.8 million (98.7 percent) and foreign investors allocated only USD 1.7 million (1.3 percent).
Whether preferential treatment of firms in FEZs has any spillover effects remains an open question. The government
still has to develop the level playing ground and rules of the game for all potential investors willing to invest via
FEZs or TPDs. At the moment, the differentiated tax and customs treatment is more favorable toward large local
firms, which presents high risks of discretionary behavior and abuse. In addition, local governments sometimes lack
funds to develop necessary infrastructure within FEZs, which makes Ukraine less attractive compared with foreign
counterparts.
The government of Ukraine has recognized the importance of targeted and limited support for the investment
climate and has initiated another piece of legislation that established the rules for Investment Parks. The initiative
was passed as the Law on Industrial Parks in 2012. The idea of the Parks is similar to that of FEZs, but refers to
smaller territorial entities. The Parks are essentially fenced communities with pre-developed elements of public
infrastructure (such as power supply, roads, warehouses, administrative support, etc.). The Parks also have special
investment, taxation, and foreign trade regimes. A number of conceptual plans for industrial parks have been
adopted in 2011-2012 with direct participation of the “Local Investment National Competitiveness” project funded
by USAID.23
Currently, this law is still too new to make any conclusions about its economic effects, but it does
reflect the understanding of the Ukrainian authorities of the need to attract foreign investors by providing certain
special arrangements for them.
Another concept prevailing in the public discourse on economic development is government support for a limited
number of the “priority industries” or even separate firms. The most obvious examples of such industries are
railroads, gas distribution, coal mining, the automotive industry, chemical production, and metallurgy. Many such
firms in Ukraine have been located in company towns. As a result, these firms have been considered “socially
important” because they have traditionally provided employment for the local workforce, often being the only or the
major employer in the area, and major investors in the local infrastructure (such as housing, recreation facilities,
health care and child care establishments, roads and railroads, etc.). After the collapse of the Soviet Union, the
“social” component of such firms was reorganized via a series of privatization deals and spin-offs into separate
establishments, but the firms remained loss-making in the majority of cases without public financing. At the same
time, the socio-demographic situation in the cities where such firms dominated, especially in company towns,
remained tense, which helped the owners of such firms in their lobbying efforts to continue receiving support from
the state. The support is usually provided in the form of market protection from the foreign competition (both tariffs
and nontariff barriers), minimum price guarantees, preferential treatment in government procurement tenders and
VAT refunds, non-transparent privatization schemes, and other forms of softening budget constraints. Such unequal
treatment encourages rent-seeking activities rather than long-term investment, creates excessive monopoly power for
selected firms, and prevents other, more productive firms from entering these markets. From the labor market's side,
such state support maintains natural monopsonies in the local labor markets, associated with lower wages and lower
bargaining power, and hinders effective reallocation of the workforce to more productive firms.
The efforts of the government directed toward creating a special investment climate for potential foreign firms in a
limited number of locations, on the one hand, and preserving state support to a number of domestic firms, on the
other hand, may have induced local economic growth in the short run, which has limited support in the data.
However, such a strategy essentially creates multiple deviations from the most efficient outcome and can hardly be
considered as sustainable in the longer run. As the story with free economic zones suggests, privileges granted on an
ad hoc basis are not guaranteed against the change of the governments and cannot be considered as preserving the
positive investment climate. As a result, individual firms and entire industries have become more concerned with the
search for the proper supporters of the most appropriate legislation among the decision makers rather than with
production activities.
As a possible alternative to the state’s efforts, various programs and projects are supported by international
organizations. One such program was financed by USAID in 2003-2006 and is aimed at local economic
development. The program provided technical assistance to selected municipalities in designing local development
plans. Nizalov (2009) conducted the impact evaluation of the program’s effects on local development. The minimum
time span for the effects to settle in and become visible is at least five years, which makes precise evaluation of the
total impacts a challenging task. Another example of a targeted program is the Women’s Entrepreneurship Training
Program “Start and Improve Your Business” within the framework of the European Union-ILO Project “Gender
Equality in the World of Work" in 2009-2011. It covered over 700 participants in 12 regions of Ukraine and resulted
23
See more at http://linc.com.ua/eng/Reports_&_Publications/Reports/.
77
in new businesses and jobs created by young women.24
The ongoing UNDP project "Through the Aid for Trade"
(from July 2011 until December 2012) is aimed at facilitating international trade on the national and local level by
providing technical assistance to small and medium local businesses throughout the entire business process—from
planning, management, and finance to processing, standards, branding, market access, and productive capacities—
with a view to promote exports.25
According to the Project Progress Report in 2011, the assessment of SMEs and
local authorities’ needs in training for export development through desk-review and surveying was done.
Nevertheless, the efforts of NGOs are insufficient for creating a healthy investment climate in the country and
providing a sufficient number of good jobs.
Ideally the government should follow ten design principles for industrial and investment policy in line with Rodrik
(2004): (i) incentives should be provided only to “new” activities; (ii) there should be clear benchmarks/criteria for
success and failure; (iii) there must be a built-in sunset clause; (iv) public support must target activities, not sectors;
(v) activities that are subsidized must have the clear potential of providing spillovers and demonstration effects; (vi)
the authority for carrying out industrial policies must be vested in agencies with demonstrated competence; (vii) the
implementing agencies must be monitored closely by a principal with a clear stake in the outcomes and who has
political authority at the highest level; (viii) the agencies carrying out promotion must maintain channels of
communication with the private sector; (ix) mistakes that result in “picking the losers” will occur; (x) promotion
activities need to have the capacity to renew themselves, so that the cycle of discovery becomes an ongoing one.
167. A broadening gap between employers’ needs for a skilled workforce with particular
technical and soft skills (such as the ability to learn, flexibility, mobility, effective
communication and decision making, friendliness, etc.) and the quite inflexible supply of
academically trained specialists creates another obstacle for doing business and producing
innovation-intensive products in Ukraine. According to the EBRD-World Bank Business
Environment and Enterprise Performance Survey, 44.6 percent of Ukrainian enterprises of
different sizes surveyed in 2008 (who gave any positive answer) perceived "inadequately
educated workforce" as the major (27.4 percent) or severe (17.2 percent) obstacle to the
operations of their firms. By comparison, the share of employers who considered lack of skilled
workers as the major obstacle in the previous waves of the survey was 13 percent in 2002 and
19.8 percent in 2005. Thus, managers of Ukrainian firms consider inadequate skills to be a
growing constraint during the 2000s. This points to the fact that employers increasingly suffer
from a shortage of skills. According to the World Bank Labor Demand study (2009), the higher
the skill level, the more difficult it is to fill a vacancy, particularly for professionals. But manual
labor requiring a high degree of skill (predominantly craftsmen in construction, mining, and
manufacturing) is in high demand too. This excess demand for some skills coexists with an
overabundance of other skills (i.e., skills mismatch) that gives rise to structural unemployment
and significant wage penalties among workers with obsolete or inadequate skills.
Box 4. “Skills or jobs—what comes first?”
If skills come earlier than jobs, there is a high risk of an increasing skills mismatch and structural unemployment, as
happened in Ukraine during the 2000s when many newly educated young workers as well as displaced workers from
the old (state and privatized) sector were unable to match the skill set of newly-created jobs in the new (private)
sector. And the worst thing is that post-secondary and tertiary education, which is acquired recently and financed
from private funds, does not always provide the chance to succeed. This, in turn, can have a long-lasting adverse
effect on human-capital formation in Ukraine as it reduces the present stock of human capital through skill waste
and also negatively affects the future accumulation of human capital by reducing private incentives to invest in
education. At the same time, high labor turnover, financial challenges, and the absence of incentives such as tax
benefits for employer-provided training inhibit the development of comprehensive on-the-job training programs by
employers, especially in the SME sector.
24
See http://gender.ilo.org.ua/eng/News/WE_Technical_seminar_Eng.aspx and http://gurt.org.ua/biz/about/. 25
See http://www.undp.org.ua/en/projects-list-all/38-prosperity-poverty-reduction-and-mdgs-/1247-aid-for-trade-
project-in-ukraine.
78
At the same time, new business ideas and new jobs may not come to full fruition if the local labor market lacks an
adequately skilled workforce. This can eventually reduce the overall competitiveness of the economy and its
attractiveness to investors, hamper further productivity and employment growth, and hinder the development of the
new modern sector, representatives of which usually form the middle class and struggle the most (but peacefully) for
structural and institutional reforms on Ukraine’s way to a market economy. One could argue that specific skills can
be built among the available workers with some general skills through learning by doing and spillovers from
agglomeration and global integration. But this would be a second best-solution in Ukraine’s case, where the
population is aging and knowledge spillovers between the sectors are limited and very slow.
It would perhaps be more effective to equip people with broad, flexible and transferable skills that enable them to
progress in their working lives (through reforms in the education and training systems, implementation of
comprehensive lifelong learning strategies, and improvement of the inclusiveness of education) but also promote the
creation of more and better jobs in the modern sectors. Such jobs would provide for optimal development of talents
(through improvement of investment and the business climate in general and targeted support in the most promising
sectors). These strategies would help to ensure social security for the population, on the one hand, and a productive
and flexible workforce for business, on the other hand. Key stakeholders in the Ukrainian labor market also need to
strengthen their capacity for forecasting and anticipation of the skill needs and gaps and to improve the matching of
the skills supply with labor market needs. This would require better cooperation between the worlds of work,
education, and training; a developed labor market information system; increased effectiveness of active labor market
policies; and improvement in the image of the Public Employment Service among employers and job seekers. The
European Union agenda “New Skills for New Jobs” initiated in 200826
may be a helpful guide for the Ukrainian
authorities in this respect.
6.3. Possible trade-offs between living standards, productivity, and social cohesion
168. Despite the possible development pay-offs of certain jobs mentioned above, there could be
important trade-offs across the three transformations, i.e., living standards, productivity, and
social cohesion, due to negative spillovers.
169. Productivity—Living Standards. Productivity gains in more competitive enterprises in
privileged sectors or regions may come at the expense of more jobs in less privileged sectors or
regions. For example, foreign and better-off local companies may attract the most productive
resources, leaving local firms without highly skilled workers. They may even displace small
local firms in the domestic market. At the individual level, this means that the benefits of recent
waves of productivity growth and technological innovation may accrue disproportionately to the
most talented and well-educated members of society while leaving the others without jobs and
adequate means of subsistence. Given high migration costs and other barriers to internal
mobility, low-wage workers and the unemployed are likely to be locked in the lagging regions
with high job destruction and low job creation, having no possibility to escape to the regions
with higher wages and better employment opportunities (Kupets, 2012b). Barriers to professional
mobility play a similar role.
170. An uneven distribution of winners and losers from productivity and employment growth
leads to huge regional/sector imbalances and existence of geographic “pockets” of poverty,
deprivation, and social exclusion. In view of persistent demand for Ukrainian workers in Russia,
the European Union, and other countries, the better-off residents of such spatial poverty traps,
who are dissatisfied with their living conditions and future prospects at home, may take
advantage of working abroad.27
As evidence shows, many have migrated for an indefinite period
26
See http://ec.europa.eu/education/news/news1110_en.htm. 27
Although the costs of international migration are usually much greater than the costs of mobility within Ukraine,
people often prefer international migration because of its much higher expected pay-offs, including prospects for
permanent settlement in a developed country with more a secure and comfortable life.
79
of time, hoping to return to Ukraine when income/employment opportunities and the general
quality of life would be much better. Migrants' remittances and earnings improve households’
welfare, help smooth household consumption, and bring some other value for migrants and their
families (the individual perspective) but they still have limited impact on key aspects of
Ukraine's development, including investment, human capital formation, macro-economic
stability, spatial inequality reduction, and political change (Kupets, 2012a).
171. Living Standards—Social Cohesion. The mobility of some categories of the population
(including youth moving from rural areas and small towns to cities for employment, often in the
informal sector; information technology workers and other professionals moving from standard
employment to outsourced or freelance work,28
women moving to work in top management and
politics, and Ukrainians moving to Western countries for temporary employment) for better
living standards for themselves and their families may lead to greater income inequality and to
disruption of traditional social networks as these people may be perceived as parvenus by people
in their former neighborhood. Furthermore, there are not always direct spillovers to poverty
reduction in the case of outsourced and freelance work and informal employment because social
insurance contributions are not made at all or are made at some minimum required level.
172. Social Cohesion—Productivity. Strong social connections and the high capacity of local
communities to engage in collective decision making may come with the non-willingness of their
members to move professionally or territorially for efficiency reasons, so they "do not rise above
the crowd." Anecdotal evidence suggests that the entrenched habits of excessive alcohol
consumption and the "crowd effect" were serious impediments to the launch and further
development of foreign agricultural companies in the Central oblasts of Ukraine. However, more
productive workers are generally more competitive and usually more individualistic. Such
individuals tend to participate in professional networks of similar highly-skilled individuals, but
they find it difficult to mix in other communities. As a result, a natural divide between the
representatives of different cohorts is drawn along the productivity line. At the same time, the
closeness of such professional communities limits the use of “social elevators” as it becomes
more difficult to join this group without specific personal attributes and social connections.
28
According to FES (2011, pp.3-4), the most popular outsourcing services in Ukraine in 2010 were in information
technology (27 percent), legal advice (25 percent), accounting (20 percent), transport (12 percent), and human
resources (6 percent). Ukraine is the leading country in Central and Eastern Europe in terms of the number of
outsourcing firms in the IT sector (850) and the number of professionals working there (14,400 people).
80
Box 5. “Can jobs policies contribute to social cohesion?”
Trust is a cornerstone for interpersonal and social relationships. It is developed through the mutual expectation that
contracts and agreements will be enforced. This is exactly what is missing in the Ukrainian labor market, especially
in its informal part. The compensatory mechanism of overcoming the social shortage in trust lies in the development
of interpersonal relations in closed social networks, which have become the background for corruption in recruiting
personnel, developing ethnic entrepreneurship, and establishing non-transparent procedures for dismissal.
Policy measures aimed at implementation of meritocratic principles for hiring, pay and promotion, ensuring
transparency in employment contracts, and addressing the violation of workers' rights would be a way to increase
trust.
Ageist stereotypes and prejudice are obstacles to attaining greater intergenerational trust and the exchange of
experience between younger and upper-middle aged generations. A way to overcome these obstacles lies in the
promotion of a meritocratic, skill-based approach in recruitment and team building in companies. It would also help
in promoting multi-ethnic human potential.
The most corruption in access to jobs is in the public sector (police, tax authorities, local administration, and
prosecutor offices, etc.), which also controls the rule of law, including enforcement of the employment protection
legislation. This threat to trust could be also overcome through promoting policies of transparency and meritocracy
in the public sector jobs.
The experience of local compact living promotes more conservative attitudes toward other people. This leads to
building strong social networks with a high level of trust and social support, and at the same time increases distrust
in the generalized others, who are out of direct contact. More teamwork on the job would promote better
understanding among different kinds of people with different backgrounds, and could increase tolerance and mutual
trust in the longer run.
The stereotypical division of Ukraine into at least two (Eastern and Western) parts, which is supported from time to
time through mass media, reproduces a high level of prejudice and superstition against compatriots living in other
parts of Ukraine. Internal mobility, including labor mobility, is a way to promote knowledge transfers, overcome
widespread stereotypes, and make the society more cohesive.
81
7. Conclusions
173. Ukraine is a rapidly aging country with an as yet incomplete economic transition and
notable weaknesses in many areas, including the labor market. At first glance, the development
of the Ukrainian labor market would seem beneficial—with a relatively low unemployment rate
despite the deep economic crisis in 2009, fairly quick recovery of employment and activity
levels, and an increase in real wages and job satisfaction. However, there have been many
negative developments, such as net destruction of jobs in the formal sector, labor hoarding
through short-time working arrangements and wage arrears, an increase in non-standard (often
precarious) employment, low returns to education and skills, low occupational and spatial
mobility of the workforce, lack of motivation to work, and unfairness in access to jobs and at
work. These issues add to the problems of low living standards, slow productivity growth, and
low trust, and intensify social risks in Ukraine. Hence, the Ukrainian labor market seems to be in
a bad equilibrium, which is suboptimal from a social point of view: firms create jobs that are not
as good as they should be, many people are forced to take up these jobs whereas others prefer not
to work at all, and existing jobs connect people less than would be socially desirable.
174. An increasing number of idle people of working age relying on social assistance together
with a growing share of the elderly population put social safety nets under significant stress. At
the same time, informal employment and undeclared work, which continue to persist in the
Ukrainian labor market, lead to significant losses of tax revenues and social security
contributions. This situation is especially unwelcome in a time of serious public deficits. Under
such conditions, the government has limited ability to boost employment through reducing the
tax wedge on low/medium wage earners and to improve the quality of the workforce through
public investment in education and health care.
175. This situation calls for a change in the jobs policy approach in Ukraine—away from free-
hand adjustment of the population to the transformation shocks to specific programs and
interventions aimed at creating good jobs that raise living standards, increase aggregate
productivity, and enhance social cohesion and therefore can contribute the most to long-term
societal goals. The jobs-related efforts of the government could be effectively supplemented by
private sector initiative and civil society mobilization. Improvements in the quality of jobs and
fairness in access to them will reward Ukraine with a more solid basis for growth and
development, better living standards and productivity performance, and declining risk of social
unrest. This will be particularly important for counterbalancing the negative impacts of the aging
population.
176. Policymakers should remove obstacles to the creation of such good jobs for development,
minimize the possible side effects, and ensure equal access for all people to these jobs. The
priority task should be to remove market imperfections and government failures, which result in
a status quo that is suboptimal from a social point of view. These include political instability,
excessive red tape, and bureaucratic regulations that inhibit entrepreneurship in new activities
and increase corruption, rent-seeking, weak institutions, uneven market power, weak law and
contract enforcement, an underdeveloped financial system, and poor infrastructure.
177. Another important area for policy interventions is implementing investment programs
targeted at activities that have the clear potential to expand the range of export capabilities of the
Ukrainian economy, provide productivity spillovers, improve living standards, and enhance
social cohesion. The risk of capture by private interests should be minimized through
mechanisms of accountability, transparency, and clear eligibility criteria.
82
178. The current context of an aging society also calls for modernization of the education and
training systems to equip people with broad, flexible, and transferable skills that enable them to
progress in their working lives. Furthermore, this is necessary to facilitate employment prospects
for youth and those who are older than 45 years, previously inactive women who lack adequate
skills, the rural population, etc., through affirmative action and support of mobility. Given the
entpreneurialism, skills, and exposure of Ukrainian migrants to business in the developed world,
who are ready to return home under the right set of circumstances, the government should use
various incentives to encourage their return and entrepreneurship in Ukraine.
179. In order to avoid the skills mismatches and labor underutilization that are especially
unwelcome in an economy with a rapidly shrinking and aging population, it is important to
strengthen cooperation between education and labor market institutions, social partners, and
businesses to better anticipate skills change and provision; balance security and flexibility; fight
informal employment and discriminatory practices; make work in the formal sector more
attractive, particularly for those who are marginally attached; and provide more opportunities for
effective "voice."
83
References
Akulava M., and G. Vakhitova. 2010. "The Impact of FDI on Firms’ Performance across
Sectors: Evidence from Ukraine." KEI Discussion Paper No. 26, Kyiv Economics Institute,
Kyiv.
Babenko, S. 2011. "Comparing the Social Cost of Post-Soviet Transformation of Eastern
Europe’s Borderland (Ukraine, Belarus, Moldova)." Crossroads Digest, No. 6/2011, European
Humanities University.
Bellmann, L., S. Estrin, H. Lehmann, and J. Wadsworth. 1995. "The Eastern German Labour
Market in Transition: Gross Flow Estimates from Panel Data." Journal of Comparative
Economics 20(2): 139-70.
Brück, T., A.M. Danzer, A. Muravyev, and N. Danzer. 2010. "Poverty during Transition:
Household Survey Evidence from Ukraine." Journal of Comparative Economics 38(2): 123-45.
Carmigrnani, F. 2003. "Political Instability, Uncertainty and Economics." Journal of Economic
Surveys 17(1): 1-54.
Constant, A., M. Kahanec, and K.F. Zimmermann. 2011. "The Russian-Ukrainian Earnings
Divide.” Economics of Transition, pp. 1-35.
Coupé, T., and H. Vakhitova. 2011. "Recent Dynamics of Returns to Education in Transition
Countries." KSE Discussion Paper No. 39.
Davis, S., and J. Haltiwanger. 1992. "Gross Job Creation, Gross Job Destruction and
Employment Reallocation." Quarterly Journal of Economics 107(3): 819-63.
Davis, S., and J. Haltiwanger. 1999. "Gross Job Flows." In O. Ashenfelter and D. Card,
Handbook of Labor Economics Vol. 3, Elsevier, pp.2711-2805.
European Bank for Reconstruction and Development (EBRD). 2011. Transition Report 2011.
Crisis and Transition: The People’s Perspective. European Bank for Reconstruction and
Development, London.
European Training Foundation (ETF). 2008. Transition from Education to Work in EU
Neighbouring Countries. Results of an ETF Innovation and Learning Project. ETF, Turin.
European Training Foundation (ETF). 2009. Black Sea Labour Market Reviews - Ukraine
Country Report. ETF, Turin.
Friedrich Ebert Stiftung in Ukraine (FES). 2011. Non-standard Employment in Ukraine: Social
Risks and Counter-strategies of Trade Unions (in Russian: Фонд им. Фридриха Эберта,
представительство в Украине. 2011. Нестандартная занятость в Украине: социальные
риски и контр-стратегии профсоюзов, Киев).
Gorodnichenko, Y., and K. Sabirianova Peter. 2005. "Returns to Education in Russia and
Ukraine: A Semiparametric Approach to Cross-Country Comparative Analysis." Journal of
Comparative Economics 33: 324-50.
International Labour Organization (ILO). 2005. World Employment Report 2004-2005:
Employment, Productivity and Poverty Reduction. ILO, Geneva.
International Labour Organization (ILO). 2011. Decent Work Country Profile: Ukraine. ILO,
Geneva.
84
International Labour Organization (ILO). 2012. World of Work Report 2012: Better Jobs for a
Better Economy. ILO (International Institute for Labour Studies), Geneva.
Kudina, A., and M. Jakubiak. 2008. "The Motives and Impediments to FDI in the CIS." CASE
Network Studies & Analyses No. 370/2008, Centre for Economic and Social Research, Warsaw.
Kupets, O. 2010. Gender Mainstreaming in the Ukrainian Labour Market and the Role of the
Public Employment Service. ILO SRO, Budapest.
Kupets, O. 2011a. Brain Gain or Brain Waste? The Performance of Return Labor Migrants in
the Ukrainian Labor Market. Working Paper No. 11/06E. Economics Education and Research
Consortium (EERC), Kiev. Available at: http://www.eerc.ru/paperinfo/310.
Kupets, O. 2011b. "Average Wages, Labor Productivity and Transition Progress: Empirical
Study of Transition Economies." NAUKMA Scientific Proceedings, Economic studies 120: 43-
49. Available at:
http://www.nbuv.gov.ua/portal/soc_gum/naukma/Econ/2011_120/09_kupets.pdf (in Ukrainian).
Kupets, O. 2012a. The Development and the Side Effects of Remittances in the CIS countries:
The Case of Ukraine. Research Report 2012/02, Consortium for Applied Research on
International Migration (CARIM-East), Florence. Available at: http://www.carim-
east.eu/media/CARIM-East-2012-02.pdf.
Kupets, O. 2012b. "Characteristics and Determinants of Internal Labor Mobility in Ukraine."
Background paper prepared for World Bank Report No. 68824-ECA, "Moving Ukraine
Forward. How a More Mobile Workforce Can Propel Ukraine’s Prosperity."
Lehmann, H., O. Kupets, and N. Pignatti. 2005. "Labour Market Adjustment in Ukraine: An
Overview." Background paper prepared for World Bank Report "Ukraine Jobs Study: Fostering
Productivity and Job Creation."
Lisenkova, K. 2011. "Pension Reform in a Rapidly Ageing Country: The Case of Ukraine."
Scottish Institute for Research in Economics. Discussion Paper No. 2011-37.
Malynovska, O. 2011. Labour Migration: Social Consequences and Political Response.
Analytical Report, National Institute for Strategic Studies, Kyiv. Available at:
http://www.niss.gov.ua/articles/607/ (in Ukrainian: Малиновська О. А. Трудова міграція:
соціальні наслідки та шляхи реагування.—Київ: НІСД).
Nizalov, D. 2009. Economic Impact of Local Economic Development (LED) Project in Ukraine:
Structure of Project Evaluation Study and Preliminary. LED project report.
Nizalova, O., and M. Vyshnya. 2006. “Influence of Economic Zones on Employment and Wage
Growth in Ukraine: Reallocation Effect or Alternative Job Market.” Unpublished manuscript.
Organisation for Economic Co-operation and Development (OECD). 2011a. Perspectives on
Global Development 2012: Social Cohesion in a Shifting World. OECD, Paris.
Organisation for Economic Co-operation and Development (OECD). 2011b. OECD Investment
Policy Reviews: Ukraine 2011. OECD, Paris.
Organisation for Economic Co-operation and Development (OECD). 2012. Ukraine Sector
Competitiveness Strategy. Competitiveness and Private Sector Development, OECD, Paris.
Perelli-Harris, B. 2006. "The Changing Relationship between Parental Leave and Fertility in
Ukraine." Submitted to the European Population Conference Session on Fertility in Liverpool,
United Kingdom.
85
Perelli-Harris, B. 2008. "Ukraine: On the Border between Old and New in Uncertain Times."
Demographic Research 19: 1145-78.
Putnam, R.D. 2000. Bowling Alone: The Collapse and Revival of American Community. New
York: Simon & Schuster.
Raiser, M. 2007. "Are Wages in Ukraine Too Low? And What Could Be Done to Increase
Them?" World Bank Policy Note. Available at:
http://siteresources.worldbank.org/UKRAINEEXTN/ Resources/wages_in_ukraine_eng.pdf.
Rodrik, D. 2004. "Industrial Policy for the Twenty-First Century." CEPR Discussion Paper No.
4767. Centre for Economic Policy Research, London.
Rosenthal, S.S., and W.C. Strange. 2003. "Geography, Industrial Organization, and
Agglomeration." The Review of Economics and Statistics 85(2): 377-93.
Rosenthal, S.S., and W.C. Strange. 2004. "Evidence on the Nature and Sources of
Agglomeration Economies." In J.V. Henderson and J.F. Thisse (ed.), Handbook of Regional and
Urban Economics, Edition 1, Vol. 4, Chapter 49, Elsevier, pp. 2119-71.
Schneider, F., and D.H. Enste. 2000. "Shadow Economies: Size, Causes, and Consequences."
Journal of Economic Literature XXXVIII(March): 77–114.
Sliusarenko, T. 2007. Wage Penalty for Motherhood: Evidence from Ukraine. EERC MA Thesis.
Available at: http://kse.org.ua/uploads/file/library/2007/sliusarenko_2007.pdf.
Shepotylo, O., and V. Vakhitov. 2012. “Services Liberalization and Productivity of
Manufacturing Firms: Evidence from Ukraine.” Policy Research Working Paper Series 5944,
World Bank, Washington, D.C.
Skryzhevska, Y., and D. Karacsonyi. 2012. "Rural Population in Ukraine: Assessing Reality,
Looking for Revitalization." Hungarian geographical Bulletin 61(1): 49-28.
State Statistics Service of Ukraine (SSSU). 2012a. Social Protection of Population in Ukraine.
Statistical Bulletin (in Ukrainian: Державна служба статистики України. 2012. Соціальний
захист населення України: Статистичний бюлетень).
State Statistics Service of Ukraine (SSSU). 2012b. Inflows and Application of Investment into
Special (Free) Economic Zones and Territories of Priority Development of Ukraine within
Investment Projects in 2011. Statistical Bulletin (in Ukrainian: Державна служба статистики
України. 2012. Надходження та освоєння інвестицій у спеціальних (вільних) економічних
зонах та на територіях пріоритетного розвитку України за інвестиційними проектами у
2011 році: Статистичний бюлетень).
Tytell, I., and K. Yudaeva. 2007. "The Role of FDI in Eastern Europe and New Independent
States: New Channels for the Spillover Effect." In Klaus Liebscher, Josef Christl, Peter
Mooslechner, and Doris Ritzberger-Grünwald (eds.), Foreign Direct Investment In Europe.
Edward Elgar Publishing.
Ukrainian Centre for Economic and Political Studies Named after Olexander Razumkov
(UCEPS). 2010. "Problems of Wages and Employment in Assessments of Ukrainian Citizens
and Experts." National Security and Defence 7(118): 90-114. Available at:
http://www.uceps.org/eng/journal.php.
UNDP. 2010. Poverty and Social Impact Analysis of the Economic Crisis in Ukraine. United
Nations Development Programme in Ukraine, Kyiv.
86
United Nations Children’s Fund (UNICEF). 2010. Child Poverty and Disparities in Ukraine.
Libanova E.M. (ed.), Kyiv, Institute for Demography and Social Studies of NAS of Ukraine,
United Nations Children’s Fund (UNICEF), Ukrainian Centre for Social Reforms.
Vakhitov, V., and C. Bollinger. 2010. "Effects of Ownership on Agglomeration Economies:
Evidence from Ukrainian Firm Level Data." Discussion Papers 24, Kyiv School of Economics.
Woolcock, M. 2011. "What Distinctive Contribution Can Social Cohesion Make to Development
Theory, Research, and Policy?" Presentation, OECD International Conference on Social
Cohesion and Development, Paris, France, January.
World Bank. 2005. Ukraine Poverty Assessment: Poverty and Inequality in a Growing Economy.
Report no. 34631-UA, World Bank, Washington, D.C./Kyiv.
World Bank. 2006. Ukraine Jobs Study: Fostering Productivity and Job Creation, Overview.
Report no. 32721-UA, World Bank, Washington, D.C./Kyiv.
World Bank. 2007a. From Red to Gray. The “Third Transition” of Aging Populations in Eastern
Europe and the Former Soviet Union. World Bank, Washington, D.C.
World Bank. 2007b. Ukraine: Poverty Update. World Bank, Washington, D.C./Kyiv.
World Bank. 2009. Ukraine: Labor Demand Study. World Bank, Washington, D.C./Kyiv.
World Bank. 2010. Ukraine Country Economic Memorandum: Strategic Choices to Accelerate
and Sustain Growth. World Bank, Washington, D.C./Kyiv.
World Bank. 2011. World Development Report 2012: Gender Equality and Development. World
Bank, Washington, D.C.
World Bank. 2012. Moving Ukraine Forward. How a More Mobile Workforce Can Propel
Ukraine’s Prosperity. Report No. 68824-ECA. World Bank, Washington, D.C.
Головаха Е., Панина Н. Постсоветская деинституционализация и становление новых
социальных институтов в украинском обществе // Социология: теория, методы, маркетинг.
–2001.—№ 4.—С.10.
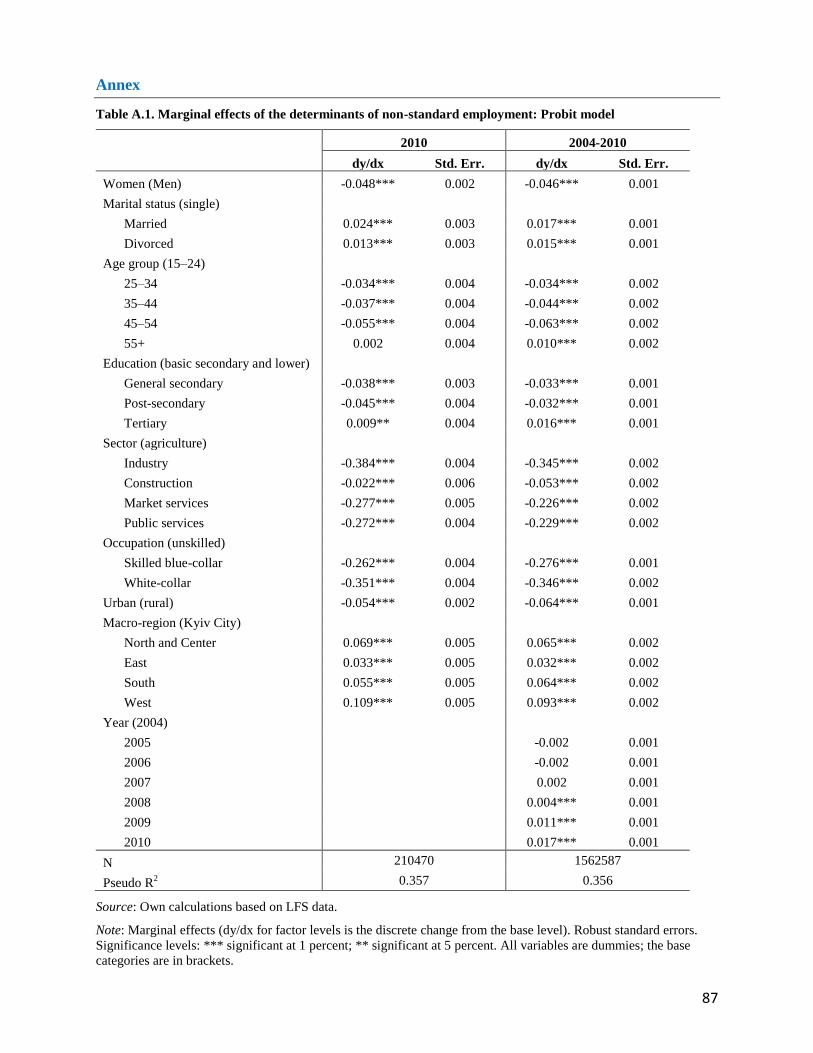
87
Annex
Table A.1. Marginal effects of the determinants of non-standard employment: Probit model
2010 2004-2010
dy/dx Std. Err. dy/dx Std. Err.
Women (Men) -0.048*** 0.002 -0.046*** 0.001
Marital status (single)
Married 0.024*** 0.003 0.017*** 0.001
Divorced 0.013*** 0.003 0.015*** 0.001
Age group (15–24)
25–34 -0.034*** 0.004 -0.034*** 0.002
35–44 -0.037*** 0.004 -0.044*** 0.002
45–54 -0.055*** 0.004 -0.063*** 0.002
55+ 0.002 0.004 0.010*** 0.002
Education (basic secondary and lower)
General secondary -0.038*** 0.003 -0.033*** 0.001
Post-secondary -0.045*** 0.004 -0.032*** 0.001
Tertiary 0.009** 0.004 0.016*** 0.001
Sector (agriculture)
Industry -0.384*** 0.004 -0.345*** 0.002
Construction -0.022*** 0.006 -0.053*** 0.002
Market services -0.277*** 0.005 -0.226*** 0.002
Public services -0.272*** 0.004 -0.229*** 0.002
Occupation (unskilled)
Skilled blue-collar -0.262*** 0.004 -0.276*** 0.001
White-collar -0.351*** 0.004 -0.346*** 0.002
Urban (rural) -0.054*** 0.002 -0.064*** 0.001
Macro-region (Kyiv City)
North and Center 0.069*** 0.005 0.065*** 0.002
East 0.033*** 0.005 0.032*** 0.002
South 0.055*** 0.005 0.064*** 0.002
West 0.109*** 0.005 0.093*** 0.002
Year (2004)
2005
-0.002 0.001
2006
-0.002 0.001
2007
0.002 0.001
2008
0.004*** 0.001
2009
0.011*** 0.001
2010
0.017*** 0.001
N 210470 1562587
Pseudo R2 0.357 0.356
Source: Own calculations based on LFS data.
Note: Marginal effects (dy/dx for factor levels is the discrete change from the base level). Robust standard errors.
Significance levels: *** significant at 1 percent; ** significant at 5 percent. All variables are dummies; the base
categories are in brackets.
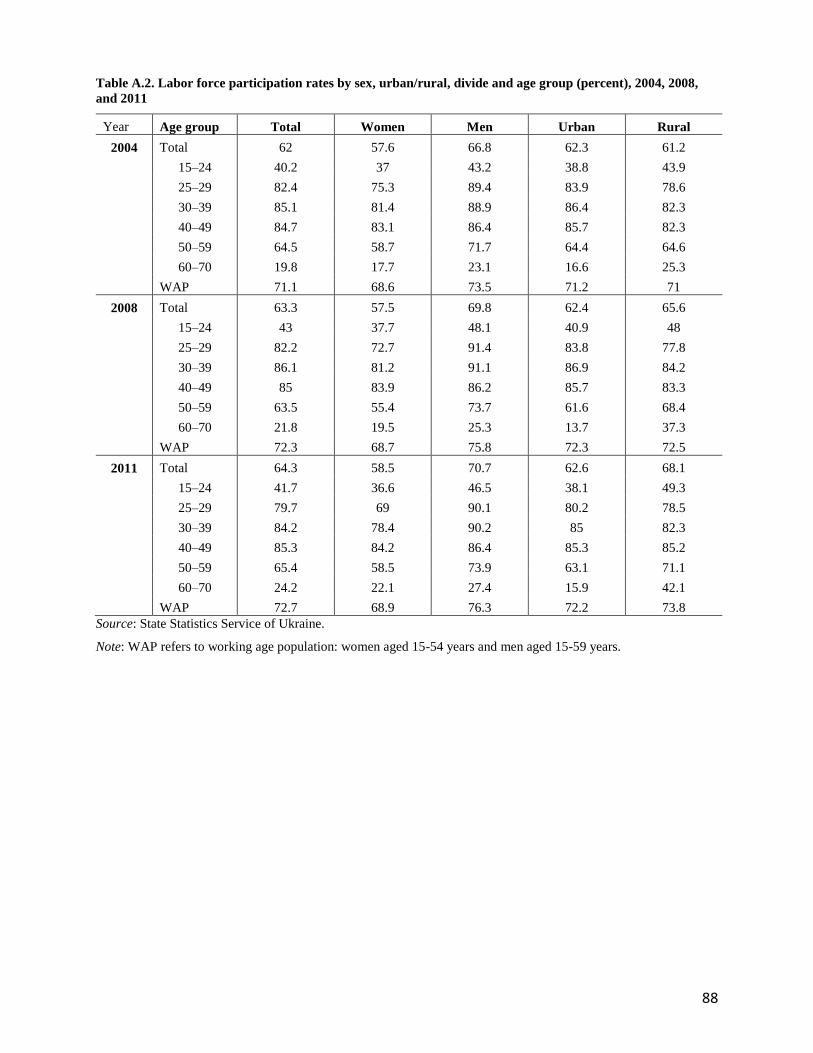
88
Table A.2. Labor force participation rates by sex, urban/rural, divide and age group (percent), 2004, 2008,
and 2011
Year Age group Total Women Men Urban Rural
2004 Total 62 57.6 66.8 62.3 61.2
15–24 40.2 37 43.2 38.8 43.9
25–29 82.4 75.3 89.4 83.9 78.6
30–39 85.1 81.4 88.9 86.4 82.3
40–49 84.7 83.1 86.4 85.7 82.3
50–59 64.5 58.7 71.7 64.4 64.6
60–70 19.8 17.7 23.1 16.6 25.3
WAP 71.1 68.6 73.5 71.2 71
2008 Total 63.3 57.5 69.8 62.4 65.6
15–24 43 37.7 48.1 40.9 48
25–29 82.2 72.7 91.4 83.8 77.8
30–39 86.1 81.2 91.1 86.9 84.2
40–49 85 83.9 86.2 85.7 83.3
50–59 63.5 55.4 73.7 61.6 68.4
60–70 21.8 19.5 25.3 13.7 37.3
WAP 72.3 68.7 75.8 72.3 72.5
2011 Total 64.3 58.5 70.7 62.6 68.1
15–24 41.7 36.6 46.5 38.1 49.3
25–29 79.7 69 90.1 80.2 78.5
30–39 84.2 78.4 90.2 85 82.3
40–49 85.3 84.2 86.4 85.3 85.2
50–59 65.4 58.5 73.9 63.1 71.1
60–70 24.2 22.1 27.4 15.9 42.1
WAP 72.7 68.9 76.3 72.2 73.8
Source: State Statistics Service of Ukraine.
Note: WAP refers to working age population: women aged 15-54 years and men aged 15-59 years.
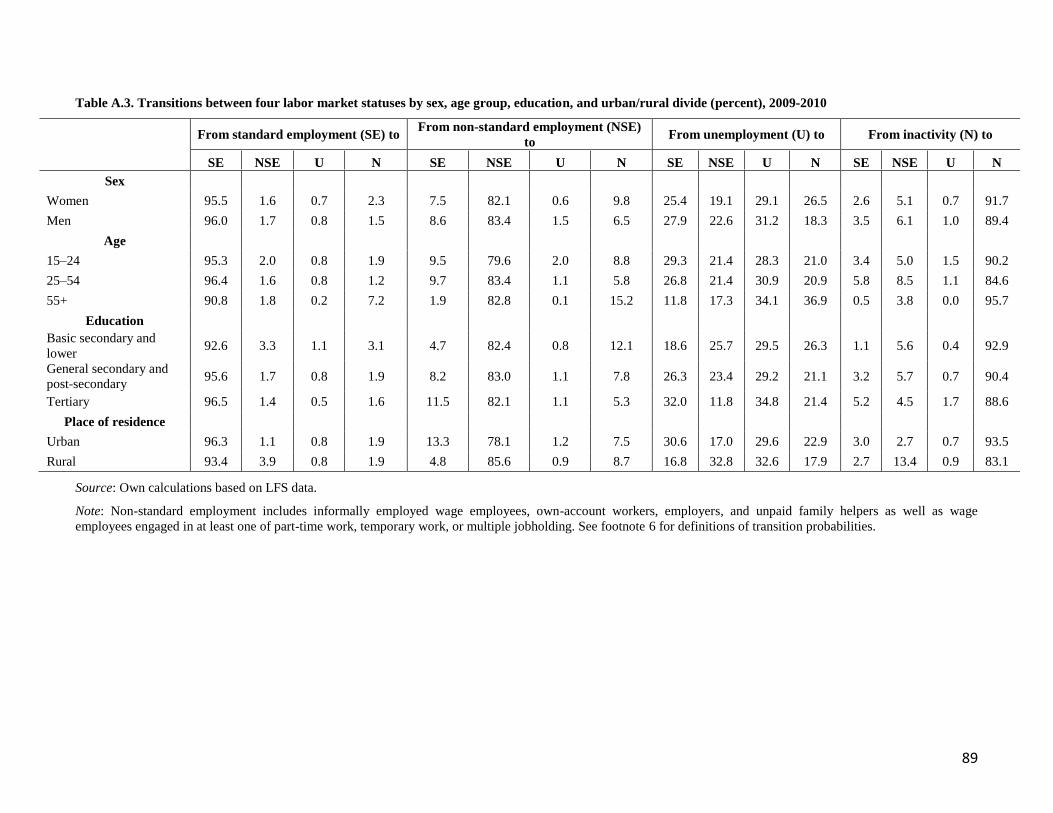
89
Table A.3. Transitions between four labor market statuses by sex, age group, education, and urban/rural divide (percent), 2009-2010
From standard employment (SE) to From non-standard employment (NSE)
to From unemployment (U) to From inactivity (N) to
SE NSE U N SE NSE U N SE NSE U N SE NSE U N
Sex
Women 95.5 1.6 0.7 2.3 7.5 82.1 0.6 9.8 25.4 19.1 29.1 26.5 2.6 5.1 0.7 91.7
Men 96.0 1.7 0.8 1.5 8.6 83.4 1.5 6.5 27.9 22.6 31.2 18.3 3.5 6.1 1.0 89.4
Age
15–24 95.3 2.0 0.8 1.9 9.5 79.6 2.0 8.8 29.3 21.4 28.3 21.0 3.4 5.0 1.5 90.2
25–54 96.4 1.6 0.8 1.2 9.7 83.4 1.1 5.8 26.8 21.4 30.9 20.9 5.8 8.5 1.1 84.6
55+ 90.8 1.8 0.2 7.2 1.9 82.8 0.1 15.2 11.8 17.3 34.1 36.9 0.5 3.8 0.0 95.7
Education
Basic secondary and
lower 92.6 3.3 1.1 3.1 4.7 82.4 0.8 12.1 18.6 25.7 29.5 26.3 1.1 5.6 0.4 92.9
General secondary and
post-secondary 95.6 1.7 0.8 1.9 8.2 83.0 1.1 7.8 26.3 23.4 29.2 21.1 3.2 5.7 0.7 90.4
Tertiary 96.5 1.4 0.5 1.6 11.5 82.1 1.1 5.3 32.0 11.8 34.8 21.4 5.2 4.5 1.7 88.6
Place of residence
Urban 96.3 1.1 0.8 1.9 13.3 78.1 1.2 7.5 30.6 17.0 29.6 22.9 3.0 2.7 0.7 93.5
Rural 93.4 3.9 0.8 1.9 4.8 85.6 0.9 8.7 16.8 32.8 32.6 17.9 2.7 13.4 0.9 83.1
Source: Own calculations based on LFS data.
Note: Non-standard employment includes informally employed wage employees, own-account workers, employers, and unpaid family helpers as well as wage
employees engaged in at least one of part-time work, temporary work, or multiple jobholding. See footnote 6 for definitions of transition probabilities.

90
Table A.4. Job creation and job destruction rates by firm size category
Firm size 2002 2003 2004 2005 2006 2007 2008 2009
Very small (<50) JCR, % 11.24 12.61 13.55 12.84 14.36 13.94 13.30 11.17
JDR, % 20.80 18.57 19.15 17.37 15.23 15.12 17.49 26.70
Small (50 - 100) JCR, % 7.33 8.65 12.13 11.40 11.64 12.36 11.42 6.64
JDR, % 19.06 20.33 16.75 15.11 14.60 13.43 12.48 22.42
Medium (100-500) JCR, % 6.84 7.03 10.09 8.71 9.34 9.25 8.98 5.45
JDR, % 13.52 15.49 13.19 12.27 11.11 11.56 11.05 21.17
Large (500-1000) JCR, % 6.79 9.12 9.31 9.04 6.85 8.53 7.68 5.39
JDR, % 9.76 9.77 10.11 7.01 9.21 7.94 9.18 18.20
Very large (>1000) JCR, % 3.54 3.00 5.62 5.86 3.82 3.21 6.33 2.98
JDR, % 4.37 3.97 3.25 3.42 4.36 5.64 4.34 12.45
Source: Own calculations based on firm-level data.
Note: JCR is job creation rate, and JDR is job destruction rate.
Table A.5. Job creation and job destruction rates by productivity class
Productivity
level 2002 2003 2004 2005 2006 2007 2008 2009
Very low JCR, % 7.41 14.82 7.43 6.97 8.41 5.78 48.44 40.31
JDR, % 33.94 59.56 62.24 63.05 45.13 42.15 37.15 55.93
Low JCR, % 5.1 6.54 8.13 10.32 9.98 9.22 18.14 6.91
JDR, % 16.68 22.55 23.1 22.65 20.09 20.06 17.73 22.27
Average JCR, % 6.22 6 7.44 7.43 6.34 6.37 6.64 5.33
JDR, % 12.48 14.09 13.32 11.69 11.85 12.08 10.78 15.27
High JCR, % 6.54 6.73 9.75 7.35 6.83 7.26 6.36 4.44
JDR, % 7.49 7.88 7.03 6.71 7.35 8 8.37 13.45
Very high JCR, % 10.64 10.5 12.78 12.84 13.12 11.99 11.03 6.5
JDR, % 8.9 8.46 6.13 7.1 7.37 8.06 8.57 17.25
Source: Own calculations based on firm-level data.
Note: Levels of productivity are determined quintiles of total factor productivity estimates for each year. JCR is
job creation rate, and JDR is job destruction rate.
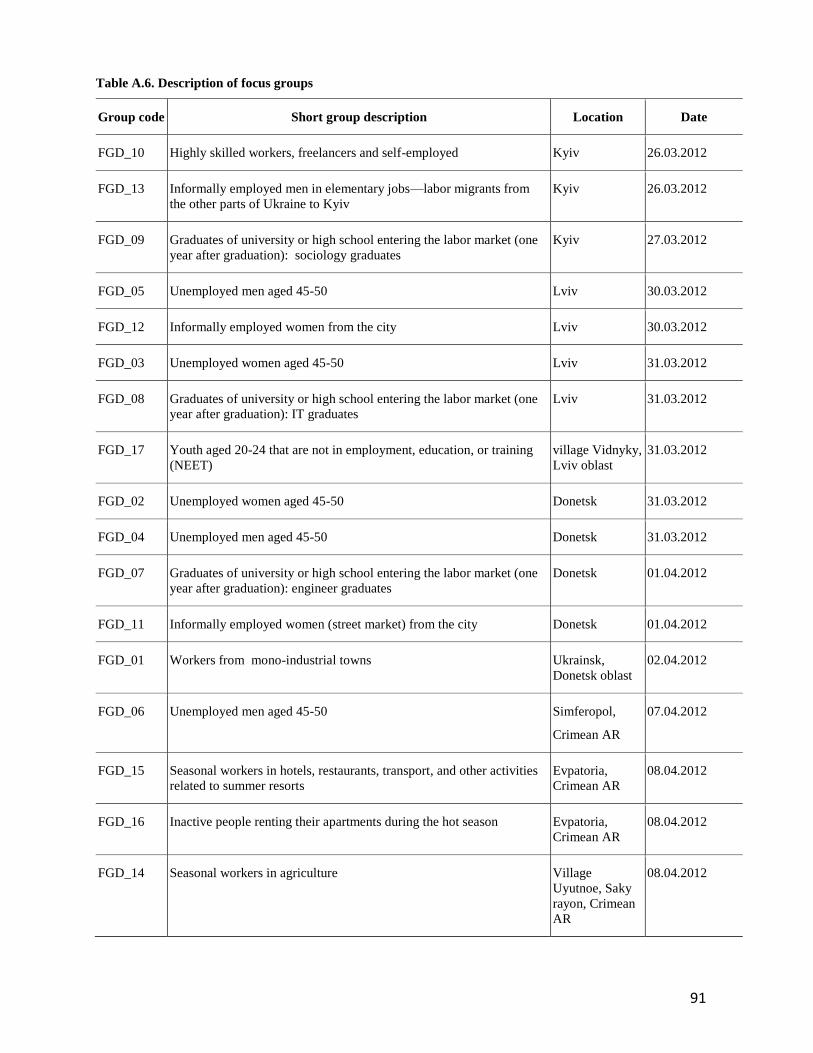
91
Table A.6. Description of focus groups
Group code Short group description Location Date
FGD_10 Highly skilled workers, freelancers and self-employed Kyiv 26.03.2012
FGD_13 Informally employed men in elementary jobs—labor migrants from
the other parts of Ukraine to Kyiv
Kyiv 26.03.2012
FGD_09 Graduates of university or high school entering the labor market (one
year after graduation): sociology graduates
Kyiv 27.03.2012
FGD_05 Unemployed men aged 45-50 Lviv 30.03.2012
FGD_12 Informally employed women from the city Lviv 30.03.2012
FGD_03 Unemployed women aged 45-50 Lviv 31.03.2012
FGD_08 Graduates of university or high school entering the labor market (one
year after graduation): IT graduates
Lviv 31.03.2012
FGD_17 Youth aged 20-24 that are not in employment, education, or training
(NEET)
village Vidnyky,
Lviv oblast
31.03.2012
FGD_02 Unemployed women aged 45-50 Donetsk 31.03.2012
FGD_04 Unemployed men aged 45-50 Donetsk 31.03.2012
FGD_07 Graduates of university or high school entering the labor market (one
year after graduation): engineer graduates
Donetsk 01.04.2012
FGD_11 Informally employed women (street market) from the city Donetsk 01.04.2012
FGD_01 Workers from mono-industrial towns Ukrainsk,
Donetsk oblast
02.04.2012
FGD_06 Unemployed men aged 45-50 Simferopol,
Crimean AR
07.04.2012
FGD_15 Seasonal workers in hotels, restaurants, transport, and other activities
related to summer resorts
Evpatoria,
Crimean AR
08.04.2012
FGD_16 Inactive people renting their apartments during the hot season Evpatoria,
Crimean AR
08.04.2012
FGD_14 Seasonal workers in agriculture Village
Uyutnoe, Saky
rayon, Crimean
AR
08.04.2012
92
Figure A.1. Ecological situation and the state of drinking water sources, 2006
Source: http://www.eco-live.com.ua/sites/default/files/u3/Ukraine_eco_map.jpg, accessed on September 24, 2012.
Note: The color intensity corresponds to soil and air contamination intensity, from green (clean) to brown (excessively contaminated). Shaded areas also indicate various
types of contamination: radioactive, underground water, surface water.


