102
ECOLOGICAL ASSESSMENT OF THE ERSTWHILE CLOSED AREAS OF JODHPUR DISTRICT, RAJASTHAN TECHNICAL REPORT FUNDED BY WILDLIFE CONSERVATION TRUST (WCT) THROUGH RPACS MARCH 2015
| Date post: | 12-Aug-2015 |
| Category: |
Documents |
| Upload: | subhadeep-bhattacharjee |
| View: | 123 times |
| Download: | 5 times |

ECOLOGICAL ASSESSMENT OF THE ERSTWHILE
CLOSED AREAS OF JODHPUR DISTRICT, RAJASTHAN
TECHNICAL REPORT
FUNDED BY
WILDLIFE CONSERVATION TRUST (WCT) THROUGH RPACS
MARCH 2015

PROJECT ADVISORS
DR. G.V. REDDY, APCCF (PF&C), DEPARTMENT OF FORESTS,
GOVERNMENT OF RAJASTHAN
MR. M. S. RATHORE, DCF (WL), JODHPUR, DEPARTMENT OF FORESTS,
GOVERNMENT OF RAJASTHAN
PROJECT FUNDED BY
WILDLIFE CONSERVATION TRUST (WCT), MUMBAI THROUGH
RAJASTHAN PROTECTED AREAS CONSERVATION SOCIETY (RPACS),
JAIPUR
WILDLIFE BIOLOGISTS IN SURVEY TEAM
MR. SUBHADEEP BHATTACHARJEE (PRINCIPAL INVESTIGATOR)
MRS. ZAARA KIDWAI
MR. SANTOSH BHATTARAI
MR. HEMANT BAJPAI
PERSONNEL ASSOCIATED WITH ECOLOGICAL SURVEY FROM FOREST
DEPARTMENT, JODHPUR (WILDLIFE WING)
Kishan Singh Arha (Range Officer), Sagar Ram Bishnoi, Praveen Kumar, Kaluram
Bishnoi, Bhagirath Latiyal, Ramkaran Jat, Shravan Kumar, Hariram Jat, Sajjan Singh,
Bhuraram Bishnoi, Babulal Jat, Bachan Singh, Lal Bharti, Ganga Singh, Tej Singh
and Prakash Sirwi
CITATION
Bhattacharjee, S., Kidwai, Z., Bhattarai, S., Bajpai, H., Rathore, M.S. and Reddy, G.V.
2015. Ecological assessment of the erstwhile closed areas in Jodhpur district,
Rajasthan. Technical report, March 2015, submitted to Department of Forests,
Government of Rajasthan. pp – 87.

ii
CONTENTS
PAGE NO
CONTENTS ii
LIST OF TABLES iii
LIST OF FIGURES iv
LIST OF ANNEXURE vi
ACKNOWLEGEMENT viii
EXECUTIVE SUMMARY ix - xiii
1. INTRODUCTION.......................................................................................... 1-5
2. OBJECTIVES.................................................................................................. 6
3. STUDY AREA................................................................................................. 7 - 12
4. METHODOLOGY......................................................................................... 13 – 21
5. RESULTS......................................................................................................... 22 – 60
6. DISCUSSION................................................................................................. 61 – 68
7. LITERATURE CITED.................................................................................... 69 – 71
8. ANNEXURE.................................................................................................... 72 – 87

iii
LIST OF TABLES
Table
no. Details
Page
no.
1 Location, geographical area and habitat type of all the erstwhile closed areas in
Rajasthan state 3
2 The approximate geographical areas of the six erstwhile closed areas in Jodhpur
district 7
3
Estimated density, biomass, cluster size and other statistical parameters of major
herbivore species in erstwhile closed area Guda Bishnoiyan – Fitkashni of Jodhpur
district
27
4 Estimated density, biomass, cluster size and other statistical parameters of major
herbivore species in erstwhile closed area Sathin of Jodhpur district 28
5 Estimated density, biomass, cluster size and other statistical parameters of major
herbivore species in erstwhile closed area Jamba of Jodhpur district 29
6 Estimated density, biomass, cluster size and other statistical parameters of major
herbivore species in erstwhile closed area Lohawat of Jodhpur district 30
7 Estimated density, biomass, cluster size and other statistical parameters of major
herbivore species in erstwhile closed area Dechu of Jodhpur district 31
8 Estimated density, biomass, cluster size and other statistical parameters of major
herbivore species in erstwhile closed area Doli-Dhawa of Jodhpur district 32
9 Estimated density, biomass, cluster size and other statistical parameters of major
herbivore species in all erstwhile closed areas of Jodhpur district 33
10 Estimated tree density on 10m x 10m quadrat at every 200m interval on each line
transect in different erstwhile closed areas of Jodhpur 46
11 Estimated shrub density on 5m x 5m quadrat at every 200m interval on each line
transect in different erstwhile closed areas of Jodhpur 47
12 Estimated species richness and diversity index for the tree layers analyzed by
program Estimate S in different erstwhile closed areas of Jodhpur 48
13 Estimated species richness and diversity index for the shrub layers analyzed by
program Estimate S in different erstwhile closed areas of Jodhpur 48
14 Estimated importance value index (IVI) for the tree layers analyzed by program
Estimate S across all the erstwhile closed areas of Jodhpur 49
15 Official census results (water hole count) of wildlife carried out by the wildlife
division of Jodhpur district during last 20 years 67
16
Official records of the rescued injured wildlife (mainly herbivores) and their
subsequent fate after treatment by the wildlife division of Jodhpur district during
last seven years
68

iv
LIST OF FIGURES
Figure
no. Details
Page
no.
1 The geographical locations of the six erstwhile closed areas in Jodhpur district 8
2 The locations of line transects laid and walked in all the erstwhile closed areas of
Jodhpur district 14
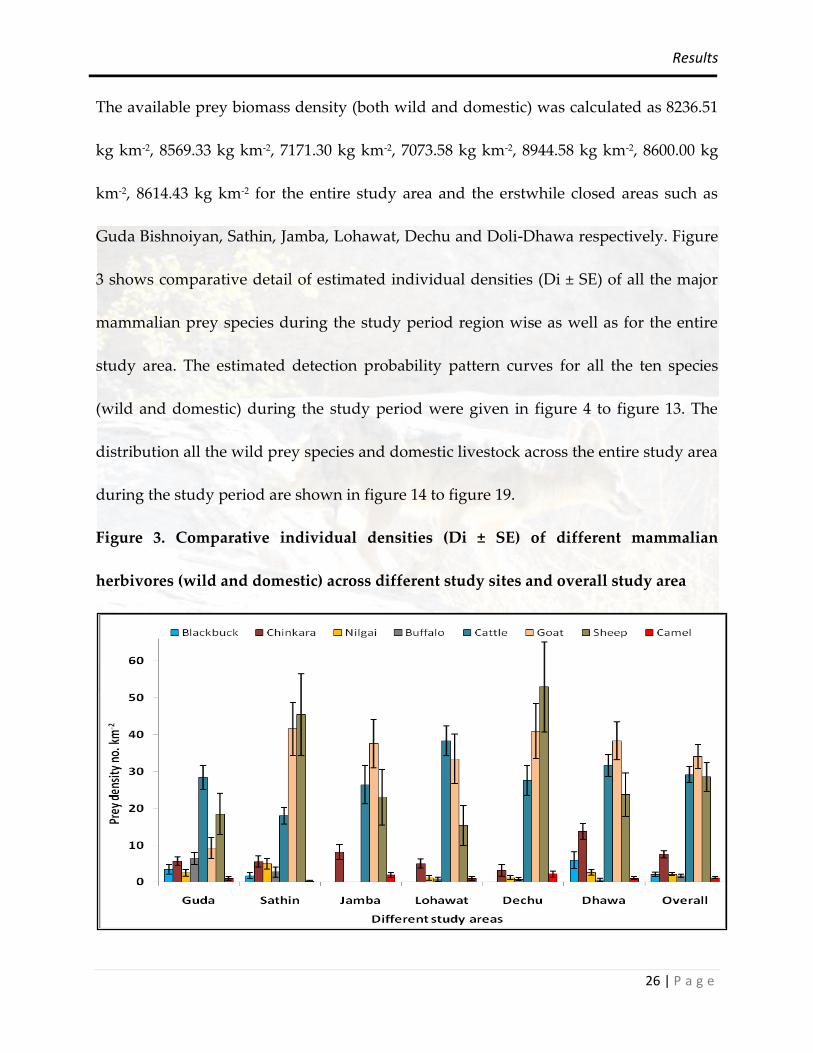
3 Comparative individual densities (Di ± SE) of different mammalian herbivores
(wild and domestic) across different study sites and overall study area 26
4
Detection probability curve of blackbuck generated by DISTANCE 6.0 software
as studied in the erstwhile closed areas of Jodhpur district during January-
February 2015.
34
5
Detection probability curve of chinkara generated by DISTANCE 6.0 software as
studied in the erstwhile closed areas of Jodhpur district during January-February
2015.
34
6
Detection probability curve of nilgai generated by DISTANCE 6.0 software as
studied in the erstwhile closed areas of Jodhpur district during January-February
2015.
35
7
Detection probability curve of peafowl generated by DISTANCE 6.0 software as
studied in the erstwhile closed areas of Jodhpur district during January-February
2015.
35
8
Detection probability curve of grey francolin generated by DISTANCE 6.0
software as studied in the erstwhile closed areas of Jodhpur district during
January-February 2015.
36
9
Detection probability curve of domestic buffalo generated by DISTANCE 6.0
software as studied in the erstwhile closed areas of Jodhpur district during
January-February 2015.
36
10
Detection probability curve of cattle generated by DISTANCE 6.0 software as
studied in the erstwhile closed areas of Jodhpur district during January-February
2015.
37
11
Detection probability curve of domestic goat generated by DISTANCE 6.0
software as studied in the erstwhile closed areas of Jodhpur district during
January-February 2015.
37
12
Detection probability curve of sheep generated by DISTANCE 6.0 software as
studied in the erstwhile closed areas of Jodhpur district during January-February
2015.
38

v
13
Detection probability curve of camel generated by DISTANCE 6.0 software as
studied in the erstwhile closed areas of Jodhpur district during January-February
2015.
38
14 Distribution map of blackbuck as per line transect record in all the erstwhile
closed areas of Jodhpur district 39
15 Distribution map of chinkara as per line transect record in all the erstwhile
closed areas of Jodhpur district 40
16 Distribution map of nilgai as per line transect record in all the erstwhile closed
areas of Jodhpur district 41
17 Distribution map of peafowl as per line transect record in all the erstwhile closed
areas of Jodhpur district 42
18 Distribution map of grey francolin as per line transect record in all the erstwhile
closed areas of Jodhpur district 43
19 Distribution map of domestic livestock as per line transect record in all the
erstwhile closed areas of Jodhpur district 44
20 Estimated percentage response pattern on the issue of status of oran across the
entire study area of Jodhpur district 55
21 Estimated percentage response pattern on the issue of status of wildlife across
the entire study area of Jodhpur district 55
22 Estimated percentage response pattern on the reasons of wildlife depletion
across the entire study area of Jodhpur district 56
23 Estimated percentage response pattern on the reasons of wildlife rejuvenation
across the entire study area of Jodhpur district 56
24 Estimated percentage response pattern on the issue of crop-raiding by wild
herbivores across the entire study area of Jodhpur district 57
25 Estimated percentage response pattern on the legal status of erstwhile closed
areas in Jodhpur 57
26 Estimated percentage response pattern on the decline of major wildlife species
across the entire study area of Jodhpur district 58
27 Estimated percentage response pattern on the major problematic wildlife species
across the entire study area of Jodhpur district 58
28 Estimated percentage response pattern on the reaction time in wildlife rescue
across the entire study area of Jodhpur district 59
29 Estimated percentage response pattern on the initiatives of eco-tourism in
community conservation areas across the entire study area of Jodhpur district 59
30 Estimated percentage response pattern on the relationship between forest
department and local community across the entire study area of Jodhpur district 60

vi
LIST OF ANNEXURE
S. No. Anexxure
no. Details
Page
no.
1 I Map 1. Landmark distribution map of different facilities in the
study area (Banks) 72
2 I Map 2. Landmark distribution map of different facilities in the
study area (Electricity structures) 72
3 I Map 3. Landmark distribution map of different facilities in the
study area (Forest Department structures) 73
4 I Map 4. Landmark distribution map of different facilities in the
study area (Health Facilities) 73
5 I Map 5. Landmark distribution map of different facilities in the
study area (Panchayat Facilities) 74
6 I Map 6. Landmark distribution map of different facilities in the
study area (Police stations) 74
7 I Map 7. Landmark distribution map of different facilities in the
study area (Post Offices) 75
8 I Map 8. Landmark distribution map of different facilities in the
study area (Railway station) 75
9 I Map 9. Landmark distribution map of different facilities in the
study area (Religious places) 76
10 I Map 10. Landmark distribution map of different facilities in the
study area (Education facilities) 76
11 I Map 11. Landmark distribution map of different facilities in the
study area (water sources) 77
12 II Plate 1. Bachelor herd of Black buck at Dhawa 78
13 II Plate 2. Female black buck at a water body in Guda 78
14 II Plate 3. Chinkara female with young ones at Sathin 78
15 II Plate 4. Male Chinkara in Bhakari Lohawat 78
16 II Plate 5. Nilgai herd spotted at Dhawa 79
17 II Plate 6. Female Nilgai in Dechu 79
18 II Plate 7. Pigs spotted at Dhawa 79
19 II Plate 8. Single Pig in Sathin 79
20 II Plate 9. Desert fox in Jamba 80
vii
21 II Plate 10. Desert fox in Sathin 80
22 II Plate 11. Golden jackal in Fitkashini Guda 80
23 II Plate 12. Golden jackal in Dhawa 80
24 II Plate 13. Desert gerbil in Dechu 80
25 II Plate 14. Desert gerbil Dhawa 80
26 II Plate 15. Demoiselle crane at a water body near Guda 81
27 II Plate 16. Long-legged buzzard spotted at Sathin 81
28 II Plate 17. Black crowned sparrow lark at Lohawat 81
29 II Plate 18. Lesser flamingo at Dhawa 81
30 II Plate 19. Shikra spotted in Lohawat 81
31 II Plate 20. Cinereous vulture and Eurasian griffon in Jamba 81
32 II Plate 21. Bhakad (hills) of Phinch village in Dhawa Closed area 82
33 II Plate 22. Rohida habitat (Tecomella undulata) near Chichadli village
in Dhawa Closed area 82
34 II Plate 23. Hilly habitat near Rathkuria village in Sathin Closed area 82
35 II Plate 24. Oran (Community land) of Rudekli village in Guda
Closed area 82
36 II Plate 24. Questionnaire survey in Dhawa 83
37 II Plate 25. Questionnaire survey in Jamba 83
38 II Plate 26. Questionnaire survey in Guda 83
39 II Plate 27. Questionnaire survey in Sathin 83
40 III Data Sheet for Distance Sampling of Prey Species on Line transect
(Data sheet no: 01 / Closed areas / GOR) 84
41 III
Vegetation and disturbance data sheet on a quadrat of 10M x 10M
at every 200M of each line transect (Data sheet no: 02 / Closed
areas / GOR)
85
42 III
Questionnaire Survey to assess Ecological Status of the erstwhile
Closed Areas of the district of Jodhpur, Rajasthan (To be carried
out among 2% population of each village)
86
43 III
Factual data sheet for GPS locations and descriptions of the
geographical features in each village of Closed areas in Jodhpur
(Data Sheet no: 03 / Closed areas / GOR) 87

viii
ACKNOWLEDGEMENT
This project was financially supported by Wildlife Conservation Trust (WCT), Mumbai
through Rajasthan Protected Area Conservation Society (RPACS), Jaipur, Rajasthan for
which we are highly indebted and thankful. As an organization, WCT has shown great
interest in conservation of wildlife which are surviving outside protected areas (PAs) as
well such as in the erstwhile closed areas of Rajasthan. We greatly appreciate such
involvement and initiatives from WCT. We express sincere gratitude to both the project
advisors Dr. G.V. Reddy, APCCF (PF&C) and Mr. M.S. Rathore, D.C.F. Jodhpur (WL)
for guiding and helping us at every stage of the project. We hereby also thank Dr. G.S.
Bhardwaj, CCF Jodhpur (WL) for his cooperation to complete the work conveniently.
We are thankful to Mr. Sangram Singh Katihar, DFO and Mr. Bhagwan Singh, ACF for
their encouragement to this project. Mr. Kishan Singh Arha, Range Officer, Jodhpur
(WL) is especially thanked for all his efforts to organize the logistic support to conduct
this study successfully. We are also grateful to Dr. Mrs. Fatima Sultana, Coordinator,
Department of Wildlife Science, University of Kota, Kota for sharing the sampling
equipment to facilitate the field data collection. All the front line staff of Jodhpur (WL)
division and their family members who helped us in this study are also heartily
thanked for their great hospitality. Finally, we earnestly thank all our family members
and friends who support us in every moment and always sacrifice their happiness by
letting us work for wildlife conservation staying continuously in remote areas.

ix
EXECUTIVE SUMMARY
In the field of wildlife research, conservation and management practices, protected
areas (PAs) are thought to be the cornerstone of all these activities. The protected areas
in India consist of four categories: National Parks (NP) and Wildlife Sanctuaries (WLS)
are the two major categories while Community Conservation Reserves (CCR) and
Conservation Reserves (CR) are the two newly created categories. Rajasthan state has
two National Parks (Keoladeo and Ranthambhore), 25 Wildlife Sanctuaries and four
Conservation Reserves covering total 9485.46 sq. km of land which is roughly about
29% of total forest area or about 2.77% of geographical land under protected areas. The
distribution of these protected areas is rather skewed, most of them are confined to east
of Aravalli Hill range with exception of Desert National Park (Jaisalmer) and Tal
Chhapper (Churu) on the western side of the state.
Until 2002 amendment of Wildlife Protection Act (WPA 1972), Rajasthan had a unique
category of protected area viz. Closed Area (CA). The closed areas were wildlife rich
areas, declared under section 37 of WPA 1972 to provide protection to mega-fauna of
that place during their breeding season. During 1980’s Rajasthan state government had
notified about 14,689.71 sq. km of geographical land by marking 33 Closed Areas (CA)
in 17 districts to forbid hunting during the breeding season of the wild ungulates. Out
of these 33 CAs, 25 are located in the western part of Rajasthan in contrary to the
locations of the conventional PAs which are mostly confined to eastern part of the state.

x
There were six closed areas situated in Jodhpur district such as Guda Bishnoiyan -
Fitkashni, Sathin, Jamba, Lohawat, Dechu and Doli-Dhawa which cover 98 villages in
total. The 2002 WPA amendment, prohibited hunting throughout the country
irrespective of the season, thus rendering section 37 redundant which was subsequently
repealed.
Along with the lost legal status, these areas are data deficient on conservation values,
scientifically estimated population parameters of major wildlife species with no proper
assessment of perception of the local communities towards conservation initiatives.
Therefore, it was urgent to understand ecological status of these closed areas, so that
efforts can be delivered to convert potential closed areas into CR or CCR. The present
study is a preliminary scientific base line survey conducted in short period (two
months) to understand the abundance, distribution of the herbivores (wild and
domestic) using distance sampling based line transects, vegetation quadrats to evaluate
their habitat conditions and questionnaire surveys to assess the perception of local
communities towards wildlife conservation and management strategies.
A total effort of 1461 km on 130 line transects resulting in a total of 390 walks or
temporal replicates was delivered to estimate the abundance of prey species (wild and
domestic). Simultaneously 2515 habitat plots were also sampled to estimate the density,
diversity, richness and dominance of the vegetation layers (tree and shrub layers). In
total, 13 potential prey species were recorded on line transects. These were four wild

xi
ungulate species (blackbuck, chinkara, nilgai and wild pig), two small mammal (Indian
rufous tailed hare and Indian desert hare), five domestic livestock (cattle, buffalo, goat,
sheep and Indian camel) and two birds (peafowl and grey francolin). We have also
recorded the information on four wild canid species such as Indian grey wolf, golden
jackal, Indian fox and desert fox during the transect walks.
Chinkara was estimated as most abundant with highest density (Di ± SE) as 7.51 ± 0.96
individuals km-2 and an abundance of 29, 070 ± 3716 individuals for the entire study
area (3870.93 km2). Similarly, the individual density (Di ± SE) with an individual
abundance (N) for the entire study area were estimated as 2.08 ± 0.64 km-2; 8052 ± 2477
and 2.11 ± 0.41 km-2; 8167 ± 1587 for blackbuck and nilgai respectively. The estimated
individual density (Di ± SE) summated for all the domestic livestock (cattle, buffalo,
goat, sheep and camel) for overall study area was much higher as 95 km-2 with an
estimated abundance (N) of nearly 3, 66, 197 individuals.
The density of tree and shrub layer in the study area is ecologically very low due to the
aridity. A total of 16 species of trees and 13 species of shrubs were recorded during the
vegetation sampling across the entire study area. The estimated mean densities were
50.26 ± 9.96 SE ha-1 and 343.88 ± 10.48 SE ha-1 for tree and shrub layer respectively while
the mean diversity value was found to be higher for trees (18.3 ± 0.003 SE) compared to
shrubs (13.6 ± 0.005 SE). The mean richness of tree and shrub layers were estimated as
16 ± 0.008 SE and 13 ± 0.014 SE respectively. Prosopis cineraria was found with highest
xii
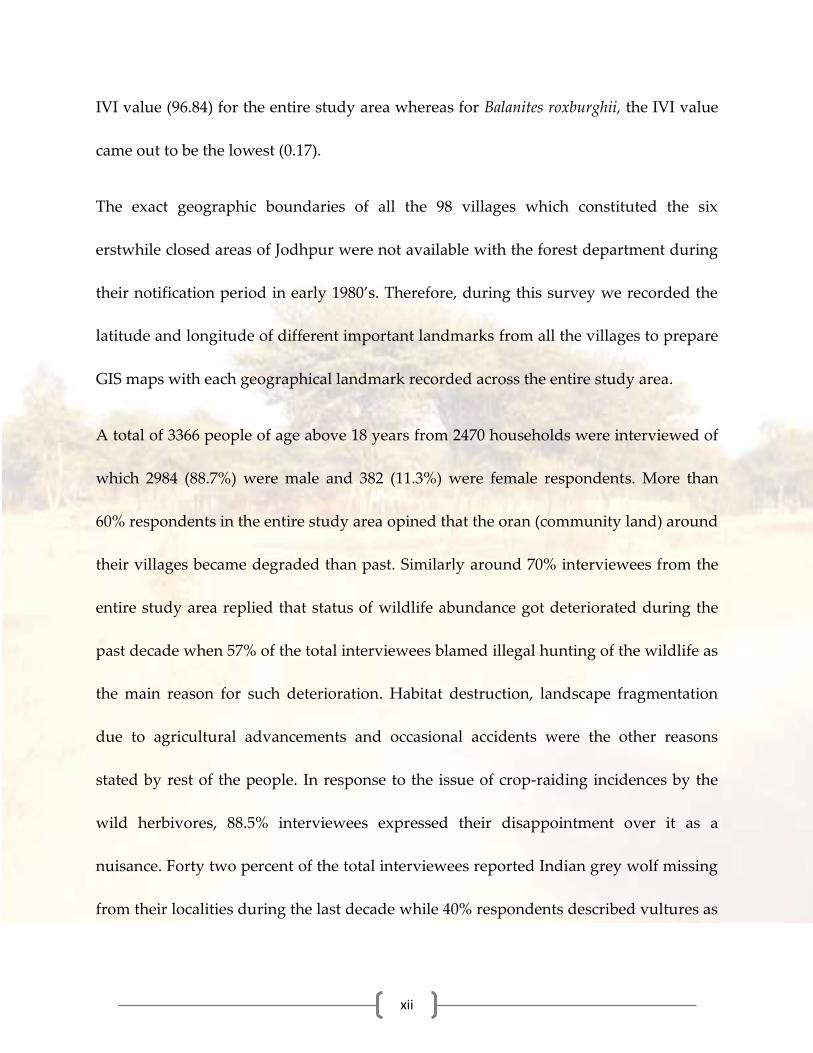
IVI value (96.84) for the entire study area whereas for Balanites roxburghii, the IVI value
came out to be the lowest (0.17).
The exact geographic boundaries of all the 98 villages which constituted the six
erstwhile closed areas of Jodhpur were not available with the forest department during
their notification period in early 1980’s. Therefore, during this survey we recorded the
latitude and longitude of different important landmarks from all the villages to prepare
GIS maps with each geographical landmark recorded across the entire study area.
A total of 3366 people of age above 18 years from 2470 households were interviewed of
which 2984 (88.7%) were male and 382 (11.3%) were female respondents. More than
60% respondents in the entire study area opined that the oran (community land) around
their villages became degraded than past. Similarly around 70% interviewees from the
entire study area replied that status of wildlife abundance got deteriorated during the
past decade when 57% of the total interviewees blamed illegal hunting of the wildlife as
the main reason for such deterioration. Habitat destruction, landscape fragmentation
due to agricultural advancements and occasional accidents were the other reasons
stated by rest of the people. In response to the issue of crop-raiding incidences by the
wild herbivores, 88.5% interviewees expressed their disappointment over it as a
nuisance. Forty two percent of the total interviewees reported Indian grey wolf missing
from their localities during the last decade while 40% respondents described vultures as
xiii
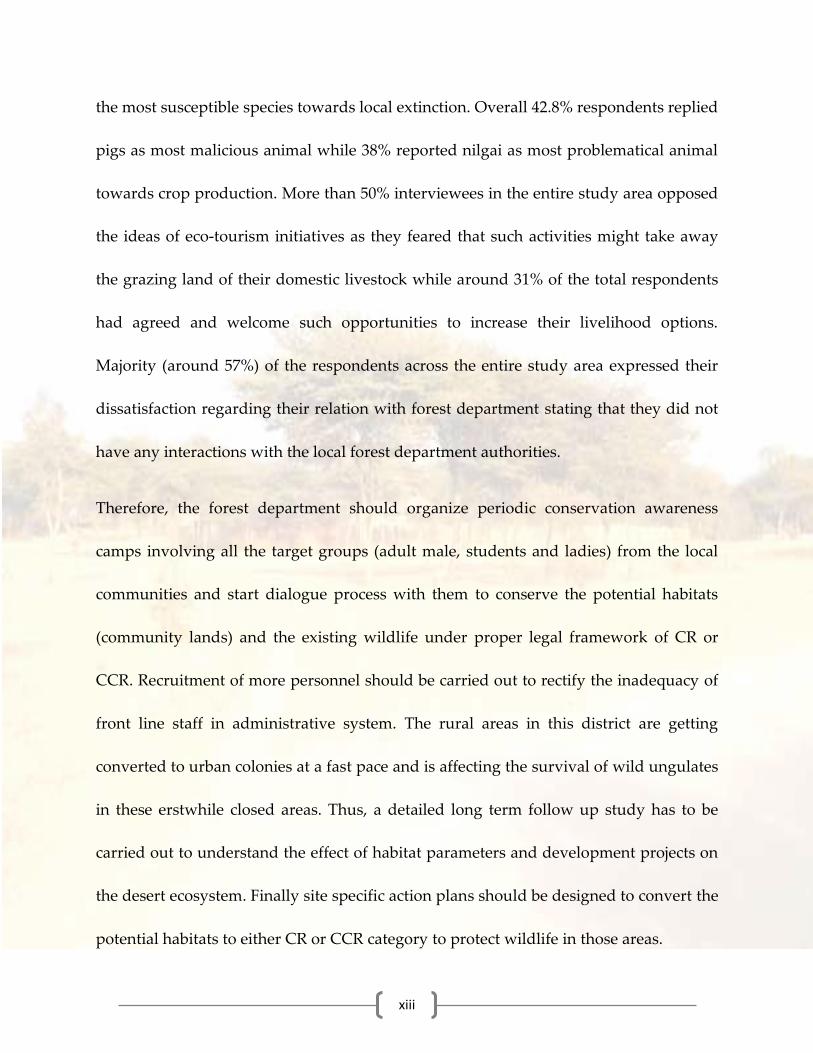
the most susceptible species towards local extinction. Overall 42.8% respondents replied
pigs as most malicious animal while 38% reported nilgai as most problematical animal
towards crop production. More than 50% interviewees in the entire study area opposed
the ideas of eco-tourism initiatives as they feared that such activities might take away
the grazing land of their domestic livestock while around 31% of the total respondents
had agreed and welcome such opportunities to increase their livelihood options.
Majority (around 57%) of the respondents across the entire study area expressed their
dissatisfaction regarding their relation with forest department stating that they did not
have any interactions with the local forest department authorities.
Therefore, the forest department should organize periodic conservation awareness
camps involving all the target groups (adult male, students and ladies) from the local
communities and start dialogue process with them to conserve the potential habitats
(community lands) and the existing wildlife under proper legal framework of CR or
CCR. Recruitment of more personnel should be carried out to rectify the inadequacy of
front line staff in administrative system. The rural areas in this district are getting
converted to urban colonies at a fast pace and is affecting the survival of wild ungulates
in these erstwhile closed areas. Thus, a detailed long term follow up study has to be
carried out to understand the effect of habitat parameters and development projects on
the desert ecosystem. Finally site specific action plans should be designed to convert the
potential habitats to either CR or CCR category to protect wildlife in those areas.

1. INTRODUCTION
Despite unique biodiversity values and conservation oriented traditional agro-pastoral
livelihoods, natural habitats and wildlife species of arid landscape in western India are
facing imminent risk due to our neglect, societal obstinacy and limitations in
management practices. In the field of wildlife conservation and management practices,
protected areas (PAs) are thought to be the cornerstone of conservation. The protected
areas in India consist of four categories: National Parks (NP) and Wildlife Sanctuaries
(WLS) are the two major categories while Community Conservation Reserves (CCR)
and Conservation Reserves (CR) are the two newly created categories.
But it is often anecdotally referred that more wildlife exists outside the protected areas.
Owing to small size, the existing protected areas are not fully capable of protecting all
biodiversity and wildlife. IUCN 2013 guidelines on “Identification and gap analysis of key
biodiversity area targets for comprehensive protected area system” propose to include all
important bird, plant and biodiversity areas to reduce the conservation gaps.
Rajasthan, the largest State in India has about 32,700 sq. km (9.56%) of geographical
land under forests. The natural forests in Rajasthan are primarily dry deciduous forests
and are mostly confined to areas east of Aravalli. Rajasthan has two National Parks
(Keoladeo and Ranthambhore), 25 Wildlife Sanctuaries and four Conservation Reserves
with 9485.46 sq. km of land which is roughly about 29% of forest area or about 2.77% of
geographical land under protected areas. The distribution of these protected areas is
1|P a g e
Introduction
2 | P a g e
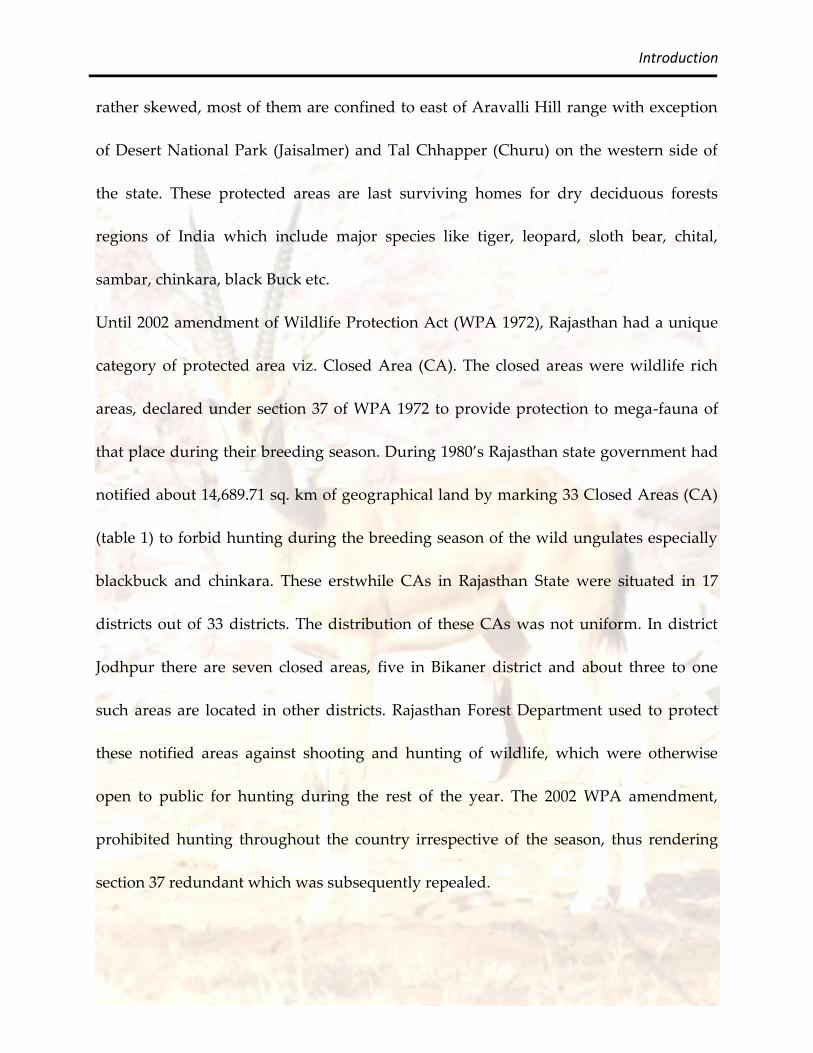
rather skewed, most of them are confined to east of Aravalli Hill range with exception
of Desert National Park (Jaisalmer) and Tal Chhapper (Churu) on the western side of
the state. These protected areas are last surviving homes for dry deciduous forests
regions of India which include major species like tiger, leopard, sloth bear, chital,
sambar, chinkara, black Buck etc.
Until 2002 amendment of Wildlife Protection Act (WPA 1972), Rajasthan had a unique
category of protected area viz. Closed Area (CA). The closed areas were wildlife rich
areas, declared under section 37 of WPA 1972 to provide protection to mega-fauna of
that place during their breeding season. During 1980’s Rajasthan state government had
notified about 14,689.71 sq. km of geographical land by marking 33 Closed Areas (CA)
(table 1) to forbid hunting during the breeding season of the wild ungulates especially
blackbuck and chinkara. These erstwhile CAs in Rajasthan State were situated in 17
districts out of 33 districts. The distribution of these CAs was not uniform. In district
Jodhpur there are seven closed areas, five in Bikaner district and about three to one
such areas are located in other districts. Rajasthan Forest Department used to protect
these notified areas against shooting and hunting of wildlife, which were otherwise
open to public for hunting during the rest of the year. The 2002 WPA amendment,
prohibited hunting throughout the country irrespective of the season, thus rendering
section 37 redundant which was subsequently repealed.

Introduction
3 | P a g e
Table 1. Location, geographical area and habitat type of all the erstwhile closed areas
in Rajasthan state
Sl. No. Name of Area District Area (km2) Type of
habitat
1 Tilora Ajmer 1.42 Desert
2 Gagwana Ajmer 225 Desert
3 Sonkhalia Ajmer 526.81 Desert
4 Barrod Alwar 2.36 Non Desert
5 Jodia Alwar 30 Non Desert
6 Dhorimanna Barmer 680.17 Desert
7 Deshnok Bikaner 25.17 Desert
8 Doytra Bikaner 50.19 Desert
9 Jodvir Bikaner 75.84 Desert
10 Mukam Bikaner 168.82 Desert
11 Bajoo Bikaner 210 Desert
12 Kanak Sagar Bundi 8 Non Desert
13 Menal Chittorgarh 107.96 Non Desert
14 Sawantsar Sagar Churu 70.19 Desert
15 Santhal Sagar Jaipur 3 Non Desert
16 Mehlan Jaipur 150 Non Desert
17 Ram Devra Jaisalmer 3000 Desert
18 Ujala Jaisalmer 3000 Desert
19 Sanchore Jalore 1813.12 Desert
20 Doli Jodhpur 424.76 Desert
21 Fitkashni Jodhpur 5.7 Desert
22 Sathin Jodhpur 242.86 Desert
23 Gudha Bishnoi Jodhpur 418.88 Desert
24 Dechu Jodhpur 666.18 Desert
25 Jamberserwerji Jodhpur 870.24 Desert
26 Lohawat Jodhpur 1242.31 Desert
27 Sorsan Kota 100 Non Desert
28 Jaroda Nagaur 30 Desert
29 Rotu Nagaur 586.2 Desert
30 Jawai Ram Pali 5 Desert
31 Qualji Sawai Madhopur 37.8 Non Desert
32 Ranipura Tonk 87.77 Non Desert
33 Bagdaraha Udaipur 3.42 Non Desert

Introduction
4 | P a g e
Western part of the Rajasthan is arid zone with vast grass lands. The arid zone harbors
varied biodiversity despite harsh climatic conditions and low rainfall, due to the
traditional contribution of the local community and their cultural beliefs. The
geographical area under closed area category was much more than all PAs in the state.
Thus, the closed areas can be developed as safe haven for wildlife outside formally
declared protected area system in Rajasthan. Out of the 33 CAs, 25 are located in the
western part of Rajasthan in contrary to the locations of the conventional PAs which are
mostly confined to eastern part of the state. There were six closed areas situated in
Jodhpur district such as Guda Bishnoiyan - Fitkashni, Sathin, Jamba, Lohawat, Dechu
and Doli-Dhawa which cover 98 villages in total. A few years ago, four villages of Doli-
Dhawa closed area were re-classified to the district administration of Barmer. However,
with the 2002 WPA amendment, the closed areas had lost their legal significance and
relegated to history though there were efforts to convert these closed areas into
community conserved reserves or conservation reserves.
Historically and ecologically the arid agro-grass habitats of Jodhpur district had
supported many wildlife species such as blackbuck Antilope cervicapra, chinkara Gazella
bennettii, Indian grey wolf Canis lupus pallipes, desert fox Vulpes vulpes pusilla, Indian fox
Vulpes bengalensis and Spiny-tailed Lizard Saara hardwickii which are data deficient and
threatened (Dookia 2009; Dutta et al. 2014).

Introduction
5 | P a g e
This ecological survey aimed at generating information on population and habitat
status of the wild herbivore species surviving in the crucial human dominated arid
landscape referred as erstwhile closed areas of Jodhpur district in western Rajasthan.
Official data and records available with the department do not provide details about
conservation values, well documented maps of the closed areas, scientifically estimated
population parameters of major wildlife species and perception of the local
communities towards conservation initiatives. Therefore, there is urgent need to
understand ecological status of these closed areas, so that efforts can be initiated to
preserve these areas for the wildlife surviving in these wilderness areas and also to
convert potential closed areas into community conservation reserves. So far, no study
has been undertaken to evaluate biodiversity, ecology of large mammals in these
landscapes which are outside protected areas (National park or Sanctuary). The CAs of
Rajasthan has therefore great potential to become community conserved wildlife
reserve (CCR) or conservation reserve (CR).

6 | P a g e
2. PROJECT OBJECTIVES
The present study was undertaken to pursue the following objectives -
to estimate current status and distribution of wildlife and habitat conditions of
the closed areas in Jodhpur district,
to mark the historical closed areas and currently potential areas for wildlife
conservation and prepare maps,
to assess key problems and potentials of each of the closed areas in Jodhpur
district,
to understand the perception of the local communities towards wildlife
conservation and present management practices,
to evaluate potentials for converting these CA to CCA or CR depending on the
site suitability and
to recommend proper management interventions according to the respective
conservation values of the closed areas in Jodhpur district.

3. STUDY AREA
The present study was carried out in six erstwhile closed areas viz. “Guda Bishnoiyan
and Fitkashni, Sathin, Jamba, Lohawat, Dechu-Thadiya and Doli-Dhawa” located in
Jodhpur and Barmer districts of Rajasthan. These closed areas were situated around 98
villages, out of which 94 villages are located in Jodhpur district and rest four are
situated in Barmer district. The details of the approximate geographical areas and
locations of all these closed areas are shown in Table 2 and figure 1.
Table 2. The approximate geographical areas of the six erstwhile closed areas in
Jodhpur district
Sl.
No. Name of the Closed Area (CA) District
Approximate
geographical area
as per notification
(in km2)
1 Guda Bishnoiyan and Fitkashni Jodhpur 424.58
2 Sathin Jodhpur 242.86
3 Jamba Jodhpur 870.24
4 Lohawat Jodhpur 1242.31
5 Dechu-Thadiya Jodhpur 666.18
6 Doli-Dhawa Jodhpur and
Barmer 424.76
Total geographical area 3870.93
7|P a g e

Study area
8 | P a g e
Figure 1. The geographical locations of the six erstwhile closed areas in Jodhpur
district
The entire study area falls in Desert Biogeographic Zone (Rodgers et al. 2002). Total
geographical area of Jodhpur district is 22, 850 sq.km and lies between N 26.00o to 27.620
and E 72.92o to 73.87o. This district is situated at an altitude between 250 to 300 meters
above mean sea level. Jodhpur forest division has 201.37 sq. km forest areas, which
represents nearly 1% of the total geographical area of the district. Jodhpur district has
ten sub-districts or tehsils as per revenue administration such as Jodhpur, Osian, Luni,
Study area
9 | P a g e
Shergarh, Bilada, Bhopalgarh, Phalodi, Baap, Balesar and Pipar city and ten Panchayat
Samities such as Mandoor, Luni, bilada, Bhopal garh, Osion, Shergarh, Balesar, Phalodi,
Baap and Babari.
The climate is characterized by very hot summer (temperature rising up to 50oC),
relatively cold winter (temperature dropping below 0oC), and large diurnal temperature
range (Sikka 1997). Water is a limiting factor in this district. From the available records
of all tehsils the annual average rainfall of last ten years is 365 mm which is 22 percent
more than the average annual rainfall of last five decades which was 300.5 mm. This
total rainfall is spread over around 17 rain days. Rainfall pattern is scarce and erratic, at
mean annual quanta of 100-500 mm that decreases from east to west (Pandeya et al.
1977). The Natural rain water drainage of eastern plan lands goes to the Luni and Bandi
seasonal rivers. There is no water shed having clear ridge line except the parts of Tiwari
and Balesar hills.
In many places in the district tube wells and hand pumps have been installed to attain
the drinking water requirement and at places the ground water is also used for
irrigation purpose. Most of the villages have “Nadi and Talav” as per the traditional
source of water which cater the water requirement of human and animal population but
the increasing human and livestock population pressure and encroachments are
becoming the major constraint to this water deprived state . In the recent past the Rajiv

Study area
10 | P a g e
Gandhi Lift Canal which comes from 1050 RD of Indira Gandhi Canal and reaches
Jodhpur via Phalodi, discharges its water into Kaylana and Takhat Sagar lakes. Due to
this water the ground water table of the surrounding areas has raised to a great extend
and the drinking water problem of the Jodhpur city has been solved (Working plan
Jodhpur 2013-14 to 2022-23).
Broad topographical features are gravel plains, rocky hillocks, sand-soil mix, and sand
dunes (Ramesh and Ishwar 2008). In Jodhpur district mainly sedimentary rocks such as
are found in the hilly areas. Some hills have Besalt and Granite rocks. Limestone rocks
are also present in between Pipar to Borunda and Verna hilly areas. Sand stone is
another important sedimentary rock which extends from Jodhpur to Mandore to
Balesar – Tiwari (Working plan Jodhpur 2013-14 to 2022-23).
The vegetation found in Jodhpur district is of Thorny Scrub type, characterized by open
woodland dominated by khejri (Prosopis cineraria), jaal (Salvadora Persica), ber (Zizyphus
mauritiana), dhaak (Butea monosperma), desi babul (Acacial nilotica), khumta (Acacia
senegal), neem (Azadirachta indica), Israeli babul (Acacia tortilis) and roheda (Tecomella
undulata) trees. The scrublands are dominated by Capparis decidua, Zizyphus nummularia,
Salvadora, Calligonum, Leptadenia and Aerva shrubs and grasslands dominated by
dhaman (Cenchrus ciliaris), lapala (Aristida depressa), baru (Sorghum halopense), sewan
(Lasisurus sindicus), Crotalaria and Sewan Lasiurus. In the stony areas thor species

Study area
11 | P a g e
(Euphorbia spp.) are found. The pure forest of khejri, jaal, babul, khumta and neem etc.
have almost being denuded and now these species are mainly found in scattered
position mixed with Prosopis juliflora (Working plan Jodhpur, 2013-14 to 2022-23).
Jodhpur district is very rich in wildlife. Here wildlife species such as chinkara (Gazella
bennettii), blackbuck (Antilope cervicapra), nilgai (Boselaphus tragocamelous), Indian grey
wolf (Canis lupus pallipes), hyena (Hyena hyena), desert cat (Felis silvestris), desert fox
(Vulpes vulpes pusilla), Indian fox (Vulpes bengalensis), golden jackal (Canis aureus), wild
pig (Sus scrofa), mongoose (Herpestes spp.) etc can be seen not only in forest areas but
also in revenue and wastelands. Apart from the above mammalian species, important
bird species such as macqueen’s bustard Chlamydotis macqueenii, cream-coloured courser
Cursorius cursor, sandgrouses Pterocles spp., larks, peafowl, francolins, vultures and
other raptors etc. are also found in this district. In winter season the migratory bird
demoiselle crane (Anthropoides virgo, local name kuranja) can also be seen near water
points like Kheechan. Spiny-tailed lizard (Saara hardwickii) is another important fauna
of this area. Apart from these wild species, large populations of domestic livestock
(cattle Bos indicus, buffalo Bubalus bubalis, goat Capra aegagrus hircus, sheep Ovis aries,
Indian camel Camelus dromedaries and donkey Equus africanus asinus) are also found in
this district (Working plan Jodhpur 2013-14 to 2022-23).

Study area
12 | P a g e
Jodhpur district has mainly 2 types of geographical land - Easterly dry plane land and
Western desert area.
Easterly dry plane land - Mandor, Luni, Bilada and Bhopal garh area lies mainly in the
catchment of Bandi and Luni seasonal rivers. This part of land has slightly sandy, loom
or heavy loamy grounds which has 30 cm to 120 cm soil depth with slightly stony thin
layer. Major native species of this land are khejri, roheda and kheep. Prosopis juliflora is
also found in this area as one of the dominating exotic species.
Western desert area - Western desert areas of the district mainly comprise of the
regions of Osion, Balesar, Shergarh, Phalodi and Baap. Major native species of this land
are similar to eastern part but abundance and distribution of Prosopis juliflora in this
area is greatly observed than the previous area. Most of the areas are sandy and due to
sand storms permanent / temporary sand dunes used to get developed. The western
desert area is inhabited by 85 people km-2 who largely stay in small villages and dhanis
(hamlets with clusters of 2-8 huts) and depend on pastoralism and dry farming for
livelihoods.
The present study was performed by four field survey teams constituted with four
qualified wildlife biologists and well trained front line personnel of Jodhpur forest
department (wildlife wing) during January 2015 to February 2015.

4. METHODOLOGY
4.1 Estimation of current status and distribution of wildlife and habitat conditions of
the closed areas in Jodhpur
Wild and domestic herbivore species availability in the present study was estimated by
line transect method under distance sampling technique (Burnham et al. 1980). This
method had been widely applied to estimate densities of large herbivore species
(mainly ungulates) in different forests in Indian subcontinent (Karanth and Sunquist
1995; Khan et al. 1996; Stoen and Wegge 1996; Biswas and Sankar 2002; Bagchi et al.
2003; Harihar et al. 2009; Bhattacharjee 2014). All the erstwhile closed areas were
divided into 5km x 5km (25 km2) grid layer to follow systematic sampling procedure.
We tried to lay at least one line transect in one grid but our efforts were limited by
logistic constraints in desert landscape and also in the areas fenced by private land
owners. Therefore, we tried to sample the maximum area possible under limited logistic
provisions. A total of 130 line transects of length varying from 2.5 to 4 km. were walked
three times in the morning as well as in the afternoon time (at least once in the morning
and twice in the afternoon or vice versa) by four teams of qualified wildlife biologists
and well trained forest department staff during the study period (January 2015 to
February 2015) (Figure 2). The total transects length in the entire study area was 488.5
km. For each line transect, the beginning and end point coordinates (Latitude and
Longitude) were recorded by a handheld GARMIN-72 Global Positioning System. The
13|P a g e

Methodology
14 | P a g e
bearings of each of the line transect were also measured using look through magnetic
compass (Suunto KB 20). The broad vegetation types and terrain types in which each
transect was laid, were also recorded. Record was kept for all wild ungulates, domestic
livestock, hare and two birds such as peafowl and grey francolin that were seen during
the walk.
Figure 2. The locations of line transects laid and walked in all the erstwhile closed
areas of Jodhpur district

Methodology
15 | P a g e
On every walk the following information were noted:
Species identity: Data on each species was collected separately on each transect walk.
Group size: An individual animal or more than one animal of the same species within
30 m to each other were considered to be a single group.
Age and sex composition: Whenever any individual or group was observed the broad
age category and gender of the individuals comprising that group were also collected.
Radial distance: Bushnell made Laser Range Finder was used to measure the radial
distance of the animal. In case of a herd, distance to the centre of the herd was recorded.
Sighting angle: Magnetic look through compass (Suunto KB 20) was used to find the
bearing of the animal seen with respect to the transect line from the initial point of
observation. In case of the herd, the angle between the point of the observation and the
centre of herd was recorded.
Program DISTANCE 6.0 (Thomas et al. 2009) was used to estimate the density of prey
species. The data after imported into DISTANCE 6.0 was primarily examined by
assigning very small intervals to the perpendicular distance classes. Next on the basis of
the general distribution of the data, suitable cut points were chosen to optimize the fit of
the model. The best model was selected on the basis of the lowest Akaike Information
Criterion (AIC) (Burnham et al. 1980; Buckland et al. 1993).
The number of individuals in each species per unit area multiplied by the average
weight for the species gives an estimate of the biomass for the area (Schaller 1967). In

Methodology
16 | P a g e
the present study, the biomass estimation was done by multiplying the density
(density/km2) of each prey species in the respective closed areas by their average body
weight (Sankar and Johnsingh 2002; Bhattacharjee 2014). The following assumptions
were made for the line transect sampling in the present study:
1. The animals were randomly and independently distributed in the study area
2. The sighting of one animal was independent of the sighting of another.
3. No animal was counted more than once.
4. Animals were fixed at the initial sighting position and did not move before being
counted and distance to them from the transect being measured.
5. The response behaviors of the prey population as a whole did not substantially
change in the course of walking a line transect.
6. The individuals were homogeneous with regard to their responsive behavior,
regardless of sex, age etc.
7. The probability of an animal being seen , given that it was a right angle distance y
from the line transect path (irrespective of which side of path it is on ) , was a simple
function g(y) , say of y , such that g(0) =1( i.e. probability 1 of seeing an animal on the
path ).
8. Animals directly on the line were never being missed.
9. Distances and angles were always measured accurately.
(After Seber 1982; Burnham et al. 1980; Buckland et al. 2001)

Methodology
17 | P a g e
In Jodhpur, due to its high aridity in nature, distribution of prey species could not be
treated as random especially in summer when the animals tend to concentrate around
water sources. However by placing the line transects randomly in every representative
landuse-landcover and terrain types in all the erstwhile closed areas, the first
assumption was not violated as well as we chose the winter season as sampling period
when animals seem to be randomly distributed irrespective of water availability. There
was very little chance of violating the other four assumptions in Jodhpur where
substantially open habitat conditions permit easy detection and accurate measurement
of data. These transects were walked three times in total covering both early morning
time from 700 hours to 1030 hours and also at least once in the afternoon from 1430
hours to 1800 hours to avoid any temporal bias in detection of animals due to their
activity patterns and also to reduce the error in estimating the herbivore abundance.
GPS locations of each sighting was also recorded to subsequently prepare an animal
distribution map for each species sighted and recorded during the transect walks.
Vegetation sampling: To obtain the density, diversity and dominance parameters of the
vegetation layers (trees and shrubs), at each 200 m point on each line transects, 10m x
10m and 5m x 5m quadrats were laid to enumerate the tree and shrub layer respectively
(Cox 1990). Sampling with quadrats (plots of a standard size) can be used for most plant
communities (Cox 1990). A quadrat delimits an area in which vegetation cover can be
estimated, plants counted, or species listed. Therefore, at each 10m x 10m quadrat we

Methodology
18 | P a g e
recorded the tree species and the no. of individuals present within that area. At the
same time GBH of all the individual trees recorded to estimate the species dominance
(Kent and Coker 1992). Similarly, within the 5m x 5m quadrat shrubs are counted and
their specific identity was noted down. Thus, a total of 2515 sample quadrat plots were
laid in all the erstwhile closed areas to estimate the above mentioned parameters for the
evaluation of density, diversity and dominance of trees as well as density and diversity
of shrubs in Jodhpur district. Sobs richness is the total number of species observed in a
sample, or in a set of samples. On the other hand, diversity of species is calculated by
the formula (Chao 1984; Colwell and Coddington 1994):
Where “Sobs” is the number of species in the sample, F1 is the number of singletons (i.e.,
the number of species with only a single occurrence in the sample) and F2 is the number
of doubletons (the number of species with exactly two occurrences in the sample). For
calculating dominance of trees and shrubs, density of trees and shrub species was
calculated in per hectare. Dominance of a species is determined by the value of the
basal cover. Finally importance value indexes (IVI) of each tree species were estimated
(Curtis 1959) for the entire study area of Jodhpur district. In Quadrat Sampling, the
following formulae were used to estimate the vegetation layers:

Methodology
19 | P a g e
Density = Total no. of individuals of a particular species / total area sampled
Relative Density = species density / total density for all species x 100
Frequency = no. of quadrats in which a particular species occur / total no. of quadrats
sampled
Relative Frequency = species frequency / total of frequency values for all species x 100
Dominance (Basal Area) = sum of the basal area of each tree of a species from all plots /
the total area of all of the measured plots
Relative Dominance = Basal area of a given species / the sum of the basal areas of all of
the species x 100
Importance Value = Relative frequency + Relative density + Relative dominance for each
species
A software ‘EstimateSWin750’ (Colwell 1997) was used to estimate diversity and
richness of trees and shrubs.
4.2 Marking of the historical closed areas and currently potential areas for wildlife
conservation in GIS domain and preparation of maps
Geographical locations (latitude, longitude and altitude) of important landmarks
(Government offices, hospital, schools, temples, water point etc.) and indications of
habitat fragmentations such as major roads, railway tracks and barbed wire fencing
around the agricultural fields were recorded using a handheld GARMIN-72 Global
Positioning System. Later on, these locations were plotted on GIS (Geographical
Information System) domain to prepare suitable layers of each landmark classes as well
as fragmented habitats which were not available for the wild herbivores any more
Methodology
20 | P a g e
causing discontinuation or fragmentation in the landscape. These maps would be
helpful for identifying the threats arising in this district showing the lost habitats as
well as remaining potential habits for the wildlife conservation.
4.3 Assessment of the key problems and potentials of each of the closed areas in
Jodhpur district and understanding the perception of the local communities towards
wildlife conservation and present management practices
Socio-economic semi-structured questionnaire survey was carried out to assess the key
problems and potentials of each of the closed areas in Jodhpur district and also to
understand the perception of the local communities towards wildlife conservation and
present management practices. Except two villages in Guda area which were entirely
urbanized by Jodhpur Development Authority (JDA), Other 96 villages around all the
six erstwhile closed areas were surveyed during the study period. Two percent of adult
human population (age more than 18 years) from each village was interviewed with
both open and closed ended questions to understand their perception towards wildlife
conservation and related issues. From these interviews, the key problems and potentials
of each of the closed areas were also tried to identify to help the management decisions.
The questionnaire consisted of three main sections: basic demographic and socio-
economic information about the interviewed person; questions related to attitude
towards present status of wildlife, forest and the earlier legal status of closed areas and
questions related to perceptions towards the conservation measures to mitigate human-

Methodology
21 | P a g e
wildlife conflict issues including their opinion on the present conflict management
system. The response of the local communities about the conservation scenarios and
management issues were binomially coded with 0 and 1. Thereafter, bootstrapping with
fifty thousand iterations were also carried out for each component to obtain a 95%
confidence interval for the mean of each response from the respondents using “boot”
function of the software R (R Development Core Team 2006).

5. RESULTS
5.1 Estimation of current status and distribution of wildlife and habitat conditions of the
closed areas in Jodhpur
A total of 130 line transects (spatial replicates of length ranging from 2.5 km to 4 km;
figure 2) were walked three times in both morning and afternoon (at least once in the
morning and twice in the afternoon or vice versa) to understand the status and
distribution of the major herbivores (both wild and domestic) as well the habitat
conditions were also evaluated using 10m x 10m quadrat plots for tree layer and 5m x
5m quadrat plots for shrub layers at every 200m interval on each line transect. The total
effort on 130 line transects was 1461 km resulting in a total 390 walks or temporal
replicates. Simultaneously 2515 habitat plots were also sampled to estimate the density,
diversity, richness and dominance of the vegetation layers (tree and shrub layers).
In total, 13 potential prey species were recorded on line transects. These were four wild
ungulate species (blackbuck, chinkara, nilgai and wild pig), two small mammal (both
Indian rufous tailed hare Lepus nigricollis ruficaudatus and Indian desert hare Lepus
nigricollis dayanus) (Menon 2014), five domestic livestock (cattle, buffalo, goat, sheep and
Indian camel) and two birds (peafowl Pavo cristatus and grey francolin Francolinus
pondicerianus). We have also recorded the observations of wild carnivores during
transect walks. Four wild canid species such as Indian grey wolf, golden jackal, Indian
fox and desert fox were observed and recorded during the transect walk. Only a total of
22 |P a g e 22 |P a g e
Results
23 | P a g e
three observations for each of wild pigs and hare could be recorded during the study
and therefore these three species could not be included in distance sampling protocol
due to inadequacy of information to estimate their population parameters.
The details of the population estimation results for eight mammalian species and two
avian species for each of the erstwhile closed area and also for the entire study area,
such as the recorded total number of observations, estimated cluster size, group
encounter rate and density of different prey species are given in tables 3 to table 9. Since
cluster size is an ecological parameter for a particular species therefore detection
function was kept identical for one individual species throughout all the erstwhile
closed areas as well as for the entire study area which had similar habitat conditions
and detectability profile.
Out of six erstwhile closed areas, blackbuck was recorded in three places such as Guda
Bishnoiyan – Fitkashni, Sathin and Doli-Dhawa. Nilgai was not directly seen on the line
transects laid in Jamba closed area whereas their presence was confirmed in that area
from their pellets and dung sites. Except this, nilgai was recorded on line transects in
other five erstwhile closed areas. Chinkara, peafowl, grey francolin and other domestic
livestock were observed on line transects in all the six erstwhile closed areas except no
buffalo was seen in Jamba closed area.
Among all the wild prey species, chinkara was estimated as most abundant with
highest density (Di ± SE) as 7.51 ± 0.96 individual km-2 for the entire study area. The

Results
24 | P a g e
mean cluster size estimated for chinkara was 4.93 and the best fitted detection function
model selected was half normal with model adjustment of hermite polynomial-4. The
individual densities (Di ± SE) of chinkara were estimated as 5.66 ± 1.19 km-2, 5.58 ± 1.47
km-2, 8.17 ± 2.00 km-2, 5.03 ± 1.22 km-2, 3.19 ± 1.54 km-2 and 13.80 ± 2.13 km-2 in the
erstwhile closed areas such as Guda Bishnoiyan, Sathin, Jamba, Lohawat, Dechu and
Doli-Dhawa respectively.
The individual density (Di ± SE) of blackbuck for the entire study area was estimated as
2.08 ± 0.64 km-2 whereas it ranged from 1.70 ± 0.83 km-2 to 3.47 ± 1.35 km-2 to 5.95 ± 2.30
km-2 in the erstwhile closed areas such as Sathin, Guda Bishnoiyan and Doli-Dhawa
respectively. The mean cluster size of blackbuck was estimated as 7.94 and the best
fitted detection function for this species was uniform with the model adjustment term
simple polynomial 2. The estimated individual density of nilgai for the overall study
area was 2.11 ± 0.41 km-2 with region wise densities such as 2.47 ± 0.86 km-2, 4.97 ± 1.39
km-2, 1.14 ± 0.63 km-2, 1.18 ± 0.59 km-2 and 2.66 ± 0.74 km-2 estimated in Guda
Bishnoiyan, Sathin, Lohawat, Dechu and Doli-Dhawa respectively. Half normal was
selected as best fitted detection model for nilgai with the estimated mean cluster size of
4.54 throughout the study area.
The mean cluster size of peafowl was estimated as 5.65 throughout the study area
whereas the best fitted detection model for this species was uniform with model
adjustment term of cosine 1. The overall individual density (Di ± SE) of peafowl for the

Results
25 | P a g e
entire study area was estimated as 3.35 ± 0.60 km-2 whereas the region wise estimated
densities of the same were 4.78 ± 1.79 km-2, 4.18 ± 1.49 km-2, 0.27 ± 0.27 km-2, 0.76 ± 0.36
km-2, 3.51 ± 0.88 km-2 and 5.78 ± 1.47 km-2 in the erstwhile closed areas such as Guda
Bishnoiyan, Sathin, Jamba, Lohawat, Dechu and Doli-Dhawa respectively. The
individual densities (Di ± SE) of grey francolin were estimated for the overall study area
as well as for all the six erstwhile closed areas such as Guda Bishnoiyan, Sathin, Jamba,
Lohawat, Dechu and Doli-Dhawa as 3.42 ± 0.66 km-2, 5.66 ± 1.38 km-2, 6.73 ± 1.68 km-2,
0.81 ± 0.57 km-2, 3.18 ± 1.19 km-2, 4.93 ± 1.50 km-2 and 0.93 ± 0.57 km-2 respectively. Half
normal was the best fitted detection model for grey francolin with the model
adjustment term cosine 2 whereas the estimated mean cluster size for this species was
2.36.
Except buffalo and camel, the overall estimated individual densities (Di ± SE) of other
domestic livestock species (cattle, goat and sheep) were much higher in each closed area
site as well as in the entire study area than the wild herbivores. The overall estimated
individual densities (Di ± SE) of the domestic livestock species such as buffalo, cattle,
goat, sheep and camel were 1.70 ± 0.44 km-2, 29.13 ± 2.19 km-2, 34.05 ± 3.26 km-2, 28.49 ±
4.02 km-2 and 1.18 ± 0.32 km-2 respectively. Half normal was selected as the best fitted
detection model for all five domestic livestock species whereas for camel, cosine 2 was
used as detection model adjustment term.
Results
26 | P a g e
The available prey biomass density (both wild and domestic) was calculated as 8236.51
kg km-2, 8569.33 kg km-2, 7171.30 kg km-2, 7073.58 kg km-2, 8944.58 kg km-2, 8600.00 kg
km-2, 8614.43 kg km-2 for the entire study area and the erstwhile closed areas such as
Guda Bishnoiyan, Sathin, Jamba, Lohawat, Dechu and Doli-Dhawa respectively. Figure
3 shows comparative detail of estimated individual densities (Di ± SE) of all the major
mammalian prey species during the study period region wise as well as for the entire
study area. The estimated detection probability pattern curves for all the ten species
(wild and domestic) during the study period were given in figure 4 to figure 13. The
distribution all the wild prey species and domestic livestock across the entire study area
during the study period are shown in figure 14 to figure 19.
Figure 3. Comparative individual densities (Di ± SE) of different mammalian
herbivores (wild and domestic) across different study sites and overall study area

Results
27 | P a g e
Table 3. Estimated density, biomass, cluster size and other statistical parameters of major herbivore species in
erstwhile closed area Guda Bishnoiyan – Fitkashni of Jodhpur district
Category / Prey species Wild prey species Domestic Livestock
Blackbuck Chinkara Nilgai Peafowl Grey Francolin
Buffalo Cattle Goat Sheep Camel
No. of spatial replicates (Line Transect)
23 23 23 23 23 23 23 23 23 23
Total no of walk 69 69 69 69 69 69 69 69 69 69
Effort (L) km 202.5 202.5 202.5 202.5 202.5 202.5 202.5 202.5 202.5 202.5
Total no of observation 17 45 17 18 14 24 73 10 12 4
Individual Density (Di) / km2 3.47 5.66 2.47 4.78 5.66 6.40 28.36 9.17 18.41 0.95
Di Standard Error (± SE) 1.35 1.19 0.86 1.79 1.38 1.60 3.34 2.82 5.62 0.45
Biomass (kg / km2) 121.45 67.92 444.60 16.25 1.53 1747.20 5104.80 206.33 460.25 399.00
Di Coefficient of variation (% CV) 38.76 20.97 34.94 37.44 24.36 25.12 11.78 30.77 30.54 47.87
Di - 95% Confidence Interval 1.62 - 7.44 3.71 - 8.63
1.23 - 4.96
2.27 - 10.09
3.50 - 9.18 3.91 - 10.47
22.36 - 35.97
4.93 - 17.05
9.96 - 34.02
0.38 - 2.39
Group Density (Ds) / km2 0.44 1.29 0.54 0.85 2.40 1.26 3.00 0.49 0.54 0.11
Ds Standard Error (± SE) 0.16 0.27 0.19 0.31 0.54 0.26 0.32 0.15 0.16 0.05
Ds Coefficient of variation (% CV) 36.00 20.68 34.04 36.62 22.48 20.91 10.78 30.47 30.07 45.61
Cluster Size (Mean) 7.94 4.39 4.54 5.65 2.36 5.09 9.46 18.92 33.93 8.42
Standard Error (± SE) 1.14 0.15 0.36 0.44 0.22 0.71 0.45 0.80 1.80 1.22
Detection probability (p) 0.60 0.48 0.38 0.50 0.29 0.45 0.43 0.42 0.34 0.31
Goodness of fit (chi2 - p) 0.63 0.77 0.54 0.91 0.94 0.40 0.61 0.57 0.69 0.88
Effective Strip Width (ESW) (m) 96.03 86.33 77.23 52.50 14.41 47.11 60.15 50.96 54.61 87.56
Group encounter rate / km 0.08 0.22 0.08 0.09 0.07 0.12 0.36 0.05 0.06 0.02
Model Uniform Half normal
Half normal
Uniform Half normal Half
normal Half
normal Half
normal Half
normal Half
normal
Model adjustment term Simple polynomial - 2
Hermite polynomial - 4
Cosine -1
Cosine - 2
Cosine - 2

Results
28 | P a g e
Table 4. Estimated density, biomass, cluster size and other statistical parameters of major herbivore species in
erstwhile closed area Sathin of Jodhpur district
Category / Prey species
Wild prey species Domestic Livestock
Blackbuck Chinkara Nilgai Peafowl Grey
Francolin Buffalo Cattle Goat Sheep Camel
No. of spatial replicates (Line Transect)
19 19 19 19 19 19 19 19 19 19
Total no of walk 57 57 57 57 57 57 57 57 57 57
Effort (L) km 219 219 219 219 219 219 219 219 219 219
Total no of observation 9 48 37 17 18 11 50 49 32 1
Individual Density (Di) / km2 1.70 5.58 4.97 4.18 6.73 2.71 17.96 41.53 45.39 0.22
Di Standard Error (± SE) 0.83 1.47 1.39 1.49 1.68 1.34 2.23 7.08 11.03 0.22
Biomass (kg / km2) 59.50 66.96 894.60 14.21 1.82 739.83 3232.80 934.43 1134.75 92.40
Di Coefficient of variation (% CV) 48.88 26.26 27.94 35.73 24.97 49.26 12.41 17.05 24.30 101.90
Di - 95% Confidence Interval 0.65 - 4.43 3.27 - 9.52 2.83 - 8.74
2.03 - 8.59
4.09 - 11.07
1.04 - 7.10
13.95 - 23.13
29.29 - 58.90
27.67 - 74.47
0.04 - 1.28
Group Density (Ds) / km2 0.22 1.27 1.09 0.74 2.85 0.53 1.90 2.20 1.34 0.03
Ds Standard Error (± SE) 0.10 0.33 0.29 0.26 0.66 0.25 0.22 0.36 0.32 0.03
Ds Coefficient of variation (% CV) 46.72 26.03 26.81 34.87 23.14 47.26 11.46 16.51 23.71 100.86
Cluster Size (Mean) 7.94 4.39 4.54 5.65 2.36 5.09 9.46 18.92 33.93 8.42
Standard Error (± SE) 1.14 0.15 0.36 0.44 0.22 0.71 0.45 0.80 1.80 1.22
Detection probability (p) 0.60 0.48 0.38 0.50 0.29 0.45 0.43 0.42 0.34 0.31
Goodness of fit (chi2 - p) 0.63 0.77 0.54 0.91 0.94 0.40 0.61 0.57 0.69 0.88
Effective Strip Width (ESW) (m) 96.03 86.33 77.23 52.50 14.41 47.11 60.15 50.96 54.61 87.56
Group encounter rate / km 0.04 0.22 0.17 0.08 0.08 0.05 0.23 0.22 0.15 0.01
Model Uniform Half normal Half
normal Uniform
Half normal
Half normal
Half normal
Half normal
Half normal
Half normal
Model adjustment term Simple
polynomial - 2 Hermite
polynomial - 4 Cosine -1 Cosine - 2
Cosine - 2

Results
29 | P a g e
Table 5. Estimated density, biomass, cluster size and other statistical parameters of major herbivore species in
erstwhile closed area Jamba of Jodhpur district
Category / Prey species
Wild prey species Domestic Livestock
Blackbuck Chinkara Nilgai Peafowl Grey
Francolin Buffalo Cattle Goat Sheep Camel
No. of spatial replicates (Line Transect) 17 17 17 17 17 17 17 17 17 17
Total no of walk 51 51 51 51 51 51 51 51 51 51
Effort (L) km 202.5 202.5 202.5 202.5 202.5 202.5 202.5 202.5 202.5 202.5
Total no of observation N.R. 65 N.R. 1 2 N.R. 68 41 15 8
Individual Density (Di) / km2 N.R. 8.17 N.R. 0.27 0.81 N.R. 26.42 37.58 23.01 1.90
Di Standard Error (± SE) N.R. 2.00 N.R. 0.27 0.57 N.R. 5.23 6.57 7.60 0.73
Biomass (kg / km2) N.R. 98.04 N.R. 0.92 0.22 N.R. 4755.60 845.55 575.25 798.00
Di Coefficient of variation (% CV) N.R. 24.46 N.R. 100.38 69.89 N.R. 19.81 17.47 33.03 38.29
Di - 95% Confidence Interval N.R. 4.95 - 13.49 N.R. 0.05 - 1.56
0.21 - 3.05
N.R. 17.53 - 39.83
26.21 - 53.90
11.71 - 45.20
0.89 - 4.04
Group Density (Ds) / km2 N.R. 1.86 N.R. 0.05 0.34 N.R. 2.79 1.99 0.68 0.23
Ds Standard Error (± SE) N.R. 0.45 N.R. 0.05 0.24 N.R. 0.54 0.34 0.22 0.08
Ds Coefficient of variation (% CV) N.R. 24.21 N.R. 100.07 69.26 N.R. 19.23 16.95 32.60 35.44
Cluster Size (Mean) N.R. 4.39 N.R. 5.65 2.36 N.R. 9.46 18.92 33.93 8.42
Standard Error (± SE) N.R. 0.15 N.R. 0.44 0.22 N.R. 0.45 0.80 1.80 1.22
Detection probability (p) N.R. 0.48 N.R. 0.50 0.29 N.R. 0.43 0.42 0.34 0.31
Goodness of fit (chi2 - p) N.R. 0.77 N.R. 0.91 0.94 N.R. 0.61 0.57 0.69 0.88
Effective Strip Width (ESW) (m) N.R. 86.33 N.R. 52.50 14.41 N.R. 60.15 50.96 54.61 87.56
Group encounter rate / km N.R. 0.32 N.R. 0.01 0.01 N.R. 0.34 0.20 0.07 0.04
Model N.R. Half normal N.R. Uniform Half
normal N.R.
Half normal
Half normal
Half normal Half
normal
Model adjustment term N.R. Hermite
polynomial - 4 N.R.
Cosine -1
Cosine - 2 N.R.
Cosine - 2
(N.R. – Not Recorded)

Results
30 | P a g e
Table 6. Estimated density, biomass, cluster size and other statistical parameters of major herbivore species in
erstwhile closed area Lohawat of Jodhpur district
Category / Prey species
Wild prey species Domestic Livestock
Blackbuck Chinkara Nilgai Peafowl Grey
Francolin Buffalo Cattle Goat Sheep Camel
No. of spatial replicates (Line Transect) 24 24 24 24 24 24 24 24 24 24
Total no of walk 72 72 72 72 72 72 72 72 72 72
Effort (L) km 283.5 283.5 283.5 283.5 283.5 283.5 283.5 283.5 283.5 283.5
Total no of observation N.R. 56 11 4 11 4 138 51 14 6
Individual Density (Di) / km2 N.R. 5.03 1.14 0.76 3.18 0.80 38.30 33.39 15.34 1.02
Di Standard Error (± SE) N.R. 1.22 0.63 0.36 1.19 0.57 4.09 6.75 5.40 0.49
Biomass (kg / km2) N.R. 60.36 205.20 2.58 0.86 218.40 6894.00 751.28 383.50 428.40
Di Coefficient of variation (% CV) N.R. 24.28 55.07 47.97 37.39 71.35 10.68 20.20 35.18 48.45
Di - 95% Confidence Interval N.R. 3.08 - 8.20 0.40 - 3.30
0.30 - 1.94
1.52 - 6.64
0.21 - 2.98
30.91 - 47.45
22.17 - 50.29
7.60 - 30.96
0.40 - 2.59
Group Density (Ds) / km2 N.R. 1.14 0.25 0.13 1.35 0.16 4.05 1.77 0.45 0.12
Ds Standard Error (± SE) N.R. 0.28 0.14 0.06 0.49 0.11 0.39 0.35 0.16 0.05
Ds Coefficient of variation (% CV) N.R. 24.03 54.50 47.33 36.19 69.98 9.57 19.74 34.77 46.22
Cluster Size (Mean) N.R. 4.39 4.54 5.65 2.36 5.09 9.46 18.92 33.93 8.42
Standard Error (± SE) N.R. 0.15 0.36 0.44 0.22 0.71 0.45 0.80 1.80 1.22
Detection probability (p) N.R. 0.48 0.38 0.50 0.29 0.45 0.43 0.42 0.34 0.31
Goodness of fit (chi2 - p) N.R. 0.77 0.54 0.91 0.94 0.40 0.61 0.57 0.69 0.88
Effective Strip Width (ESW) (m) N.R. 86.33 77.23 52.50 14.41 47.11 60.15 50.96 54.61 87.56
Group encounter rate / km N.R. 0.20 0.04 0.01 0.04 0.02 0.49 0.18 0.05 0.02
Model N.R. Half normal Half
normal Uniform
Half normal
Half normal
Half normal
Half normal
Half normal
Half normal
Model adjustment term N.R. Hermite
polynomial - 4 Cosine -1 Cosine - 2
Cosine -
2
(N.R. – Not Recorded)

Results
31 | P a g e
Table 7. Estimated density, biomass, cluster size and other statistical parameters of major herbivore species in
erstwhile closed area Dechu of Jodhpur district
Category / Prey species
Wild prey species Domestic Livestock
Blackbuck Chinkara Nilgai Peafowl Grey
Francolin Buffalo Cattle Goat Sheep Camel
No. of spatial replicates (Line Transect) 17 17 17 17 17 17 17 17 17 17
Total no of walk 51 51 51 51 51 51 51 51 51 51
Effort (L) km 199.5 199.5 199.5 199.5 199.5 199.5 199.5 199.5 199.5 199.5
Total no of observation N.R. 25 8 13 12 3 70 44 34 9
Individual Density (Di) / km2 N.R. 3.19 1.18 3.51 4.93 0.77 27.61 40.94 52.94 2.17
Di Standard Error (± SE) N.R. 1.54 0.59 0.88 1.50 0.44 4.05 7.38 12.21 0.83
Biomass (kg / km2) N.R. 38.28 212.40 11.93 1.33 210.21 4969.80 921.15 1323.50 911.40
Di Coefficient of variation (% CV) N.R. 48.11 49.56 25.11 30.44 57.03 14.68 18.02 23.07 38.44
Di - 95% Confidence Interval N.R. 1.22 - 8.35 0.44 - 3.16
2.10 - 5.86
2.67 - 9.08
0.25 - 2.31
20.4 - 35.36
28.23 - 59.39
32.99 - 84.97
1.02 - 4.63
Group Density (Ds) / km2 N.R. 0.73 0.26 0.62 2.09 0.15 2.92 2.16 1.56 0.26
Ds Standard Error (± SE) N.R. 0.35 0.13 0.15 0.60 0.08 0.41 0.38 0.35 0.09
Ds Coefficient of variation (% CV) N.R. 47.99 48.93 23.87 28.95 55.30 13.89 17.51 22.45 35.59
Cluster Size (Mean) N.R. 4.39 4.54 5.65 2.36 5.09 9.46 18.92 33.93 8.42
Standard Error (± SE) N.R. 0.15 0.36 0.44 0.22 0.71 0.45 0.80 1.80 1.22
Detection probability (p) N.R. 0.48 0.38 0.50 0.29 0.45 0.43 0.42 0.34 0.31
Goodness of fit (chi2 - p) N.R. 0.77 0.54 0.91 0.94 0.40 0.61 0.57 0.69 0.88
Effective Strip Width (ESW) (m) N.R. 86.33 77.23 52.50 14.41 47.11 60.15 50.96 54.61 87.56
Group encounter rate / km N.R. 0.13 0.04 0.07 0.06 0.01 0.35 0.22 0.17 0.05
Model N.R. Half normal Half
normal Uniform
Half normal
Half normal
Half normal
Half normal
Half normal
Half normal
Model adjustment term N.R. Hermite
polynomial - 4 Cosine -1 Cosine - 2
Cosine -
2
(N.R. – Not Recorded)

Results
32 | P a g e
Table 8. Estimated density, biomass, cluster size and other statistical parameters of major herbivore species in
erstwhile closed area Doli-Dhawa of Jodhpur district
Category / Prey species
Wild prey species Domestic Livestock
Blackbuck Chinkara Nilgai Peafowl Grey
Francolin Buffalo Cattle Goat Sheep Camel
No. of spatial replicates (Line Transect) 30 30 30 30 30 30 30 30 30 30
Total no of walk 90 90 90 90 90 90 90 90 90 90
Effort (L) km 354 354 354 354 354 354 354 354 354 354
Total no of observation 51 192 32 38 4 4 142 73 27 8
Individual Density (Di) / km2 5.95 13.80 2.66 5.78 0.93 0.61 31.56 38.28 23.69 1.05
Di Standard Error (± SE) 2.3 2.13 0.74 1.47 0.57 0.38 2.94 5.19 5.90 0.47
Biomass (kg / km2) 208.25 165.60 478.80 19.65 0.25 166.53 5680.80 861.30 592.25 441.00
Di Coefficient of variation (% CV) 38.56 15.46 27.97 25.37 61.08 62.10 9.32 13.54 24.92 44.89
Di - 95% Confidence Interval 2.81 - 12.62 10.15 - 18.78 1.53 - 4.63
3.48 - 9.57
0.29 - 2.91
0.19 - 1.95
26.22 - 37.98
29.19 - 50.21
14.41 - 38.96
0.44 - 2.49
Group Density (Ds) / km2 0.75 3.14 0.59 1.02 0.39 0.12 3.34 2.02 0.70 0.12
Ds Standard Error (± SE) 0.27 0.47 0.16 0.25 0.24 0.07 0.27 0.26 0.17 0.05
Ds Coefficient of variation (% CV) 35.78 15.07 26.84 24.14 60.36 60.52 8.02 12.86 24.34 42.48
Cluster Size (Mean) 7.94 4.39 4.54 5.65 2.36 5.09 9.46 18.92 33.93 8.42
Standard Error (± SE) 1.14 0.15 0.36 0.44 0.22 0.71 0.45 0.80 1.80 1.22
Detection probability (p) 0.6 0.48 0.38 0.50 0.29 0.45 0.43 0.42 0.34 0.31
Goodness of fit (chi2 - p) 0.63 0.77 0.54 0.91 0.94 0.40 0.61 0.57 0.69 0.88
Effective Strip Width (ESW) (m) 96.03 86.33 77.23 52.50 14.41 47.11 60.15 50.96 54.61 87.56
Group encounter rate / km 0.14 0.54 0.09 0.11 0.01 0.01 0.40 0.21 0.08 0.02
Model Uniform Half normal Half
normal Uniform
Half normal
Half normal
Half normal
Half normal
Half normal
Half normal
Model adjustment term Simple
polynomial - 2 Hermite
polynomial - 4 Cosine -1 Cosine - 2
Cosine - 2

Results
33 | P a g e
Table 9. Estimated density, biomass, cluster size and other statistical parameters of major herbivore species in all
erstwhile closed areas of Jodhpur district
Category / Prey species
Wild prey species Domestic Livestock
Blackbuck Chinkara Nilgai Peafowl Grey
Francolin Buffalo Cattle Goat Sheep Camel
No. of spatial replicates (Line Transect)
130 130 130 130 130 130 130 130 130 130
Total no of walk 390 390 390 390 390 390 390 390 390 390
Effort (L) km 1461 1461 1461 1461 1461 1461 1461 1461 1461 1461
Total no of observation 77 431 1005 91 61 46 541 268 134 36
Individual Density (Di) / km2 2.08 7.51 2.11 3.35 3.42 1.70 29.13 34.05 28.49 1.18
Di Standard Error (± SE) 0.64 0.96 0.41 0.60 0.66 0.44 2.19 3.26 4.02 0.32
Biomass (kg / km2) 72.80 90.12 379.80 11.39 0.92 464.10 5243.40 766.13 712.25 495.60
Di Coefficient of variation (% CV) 30.91 12.80 19.20 17.76 19.44 26.12 7.53 9.58 14.10 26.93
Di - 95% Confidence Interval 1.15 - 3.77 5.84 - 9.65 1.45 - 3.08
2.37 - 4.74
2.34 - 5.00
1.02 - 2.82
25.13 - 33.77
28.22 - 41.09
21.62 - 37.55
0.70 - 2.00
Group Density (Ds) / km2 0.26 1.71 0.47 0.59 1.45 0.33 3.08 1.80 0.84 0.14
Ds Standard Error (± SE) 0.07 0.21 0.08 0.10 0.25 0.07 0.18 0.15 0.11 0.03
Ds Coefficient of variation (% CV) 27.37 12.32 17.52 15.96 17.01 22.11 5.84 8.57 13.05 22.69
Cluster Size (Mean) 7.94 4.39 4.54 5.65 2.36 5.09 9.46 18.92 33.93 8.42
Standard Error (± SE) 1.14 0.15 0.36 0.44 0.22 0.71 0.45 0.80 1.80 1.22
Detection probability (p) 0.63 0.48 0.38 0.50 0.29 0.45 0.43 0.42 0.34 0.31
Goodness of fit (chi2 - p) 0.97 0.77 0.54 0.91 0.94 0.40 0.61 0.57 0.69 0.88
Effective Strip Width (ESW) (m) 100.57 86.33 77.23 52.50 14.41 47.11 60.15 50.96 54.61 87.56
Group encounter rate / km 0.05 0.30 0.07 0.06 0.04 0.03 0.37 0.18 0.09 0.03
Model Uniform Half normal Half
normal Uniform
Half normal
Half normal
Half normal
Half normal
Half normal
Half normal
Model adjustment term Simple
polynomial - 2 Hermite
polynomial - 4 Cosine -1 Cosine - 2
Cosine - 2

Results
34 | P a g e
Figure 4. Detection probability curve of blackbuck generated by DISTANCE 6.0
software as studied in the erstwhile closed areas of Jodhpur district during January-
February 2015.
Figure 5. Detection probability curve of chinkara generated by DISTANCE 6.0
software as studied in the erstwhile closed areas of Jodhpur district during January-
February 2015.
0.0
0.1
0.2
0.3
0.4
0.5
0.6
0.7
0.8
0.9
1.0
0 20 40 60 80 100 120 140 160
Perpendicular distance in meters
0.0
0.1
0.2
0.3
0.4
0.5
0.6
0.7
0.8
0.9
1.0
0 20 40 60 80 100 120 140 160 180
Perpendicular distance in meters

Results
35 | P a g e
Figure 6. Detection probability curve of nilgai generated by DISTANCE 6.0 software
as studied in the erstwhile closed areas of Jodhpur district during January-February
2015.
Figure 7. Detection probability curve of peafowl generated by DISTANCE 6.0
software as studied in the erstwhile closed areas of Jodhpur district during January-
February 2015.
0.0
0.1
0.2
0.3
0.4
0.5
0.6
0.7
0.8
0.9
1.0
0 20 40 60 80 100 120 140 160 180 200
Perpendicular distance in meters
0.0
0.1
0.2
0.3
0.4
0.5
0.6
0.7
0.8
0.9
1.0
0 20 40 60 80 100 120
Perpendicular distance in meters
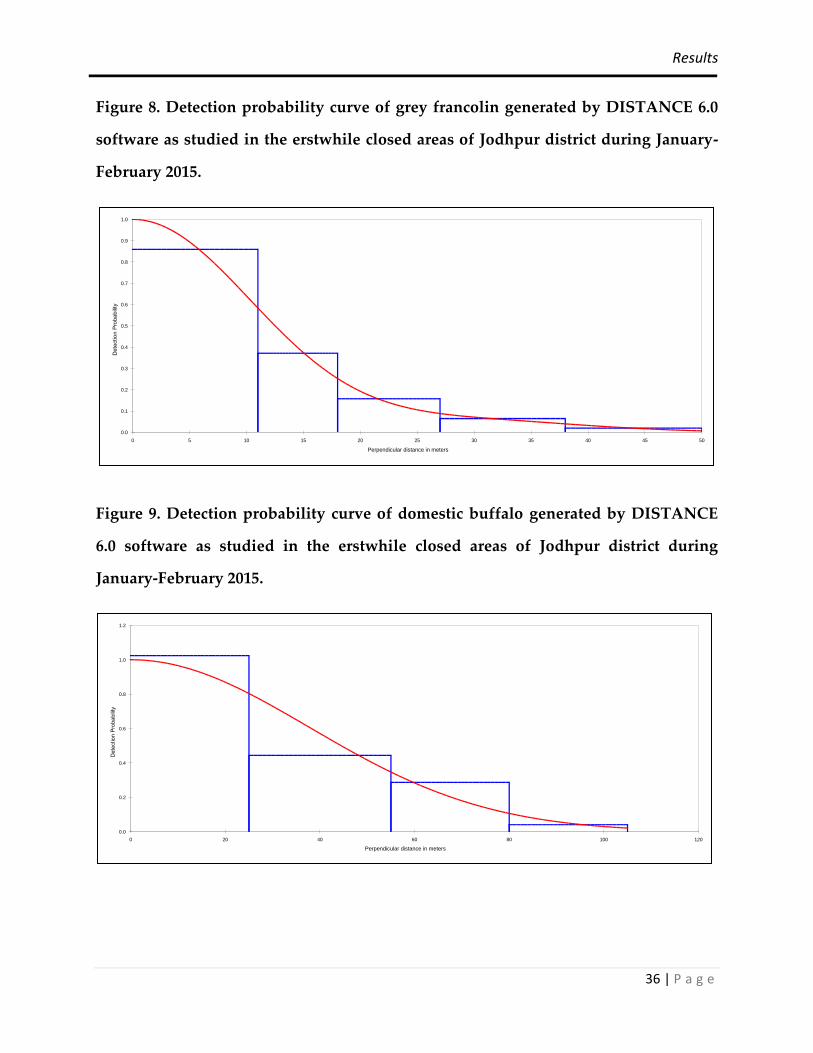
Results
36 | P a g e
Figure 8. Detection probability curve of grey francolin generated by DISTANCE 6.0
software as studied in the erstwhile closed areas of Jodhpur district during January-
February 2015.
Figure 9. Detection probability curve of domestic buffalo generated by DISTANCE
6.0 software as studied in the erstwhile closed areas of Jodhpur district during
January-February 2015.
0.0
0.1
0.2
0.3
0.4
0.5
0.6
0.7
0.8
0.9
1.0
0 5 10 15 20 25 30 35 40 45 50
Perpendicular distance in meters
0.0
0.2
0.4
0.6
0.8
1.0
1.2
0 20 40 60 80 100 120
Perpendicular distance in meters

Results
37 | P a g e
Figure 10. Detection probability curve of cattle generated by DISTANCE 6.0 software
as studied in the erstwhile closed areas of Jodhpur district during January-February
2015.
Figure 11. Detection probability curve of domestic goat generated by DISTANCE 6.0
software as studied in the erstwhile closed areas of Jodhpur district during January-
February 2015.
0.0
0.1
0.2
0.3
0.4
0.5
0.6
0.7
0.8
0.9
1.0
0 20 40 60 80 100 120 140
Perpendicular distance in meters
0.0
0.1
0.2
0.3
0.4
0.5
0.6
0.7
0.8
0.9
1.0
0 20 40 60 80 100 120
Perpendicular distance in meters

Results
38 | P a g e
Figure 12. Detection probability curve of sheep generated by DISTANCE 6.0 software
as studied in the erstwhile closed areas of Jodhpur district during January-February
2015.
Figure 13. Detection probability curve of camel generated by DISTANCE 6.0 software
as studied in the erstwhile closed areas of Jodhpur district during January-February
2015.
0.0
0.1
0.2
0.3
0.4
0.5
0.6
0.7
0.8
0.9
1.0
0 20 40 60 80 100 120 140 160
Perpendicular distance in meters
0.0
0.1
0.2
0.3
0.4
0.5
0.6
0.7
0.8
0.9
1.0
0 50 100 150 200 250 300
Perpendicular distance in meters

Results
39 | P a g e
Figure 14. Distribution map of blackbuck as per line transect record in all the
erstwhile closed areas of Jodhpur district

Results
40 | P a g e
Figure 15. Distribution map of chinkara as per line transect record in all the erstwhile
closed areas of Jodhpur district

Results
41 | P a g e
Figure 16. Distribution map of nilgai as per line transect record in all the erstwhile
closed areas of Jodhpur district

Results
42 | P a g e
Figure 17. Distribution map of peafowl as per line transect record in all the erstwhile
closed areas of Jodhpur district
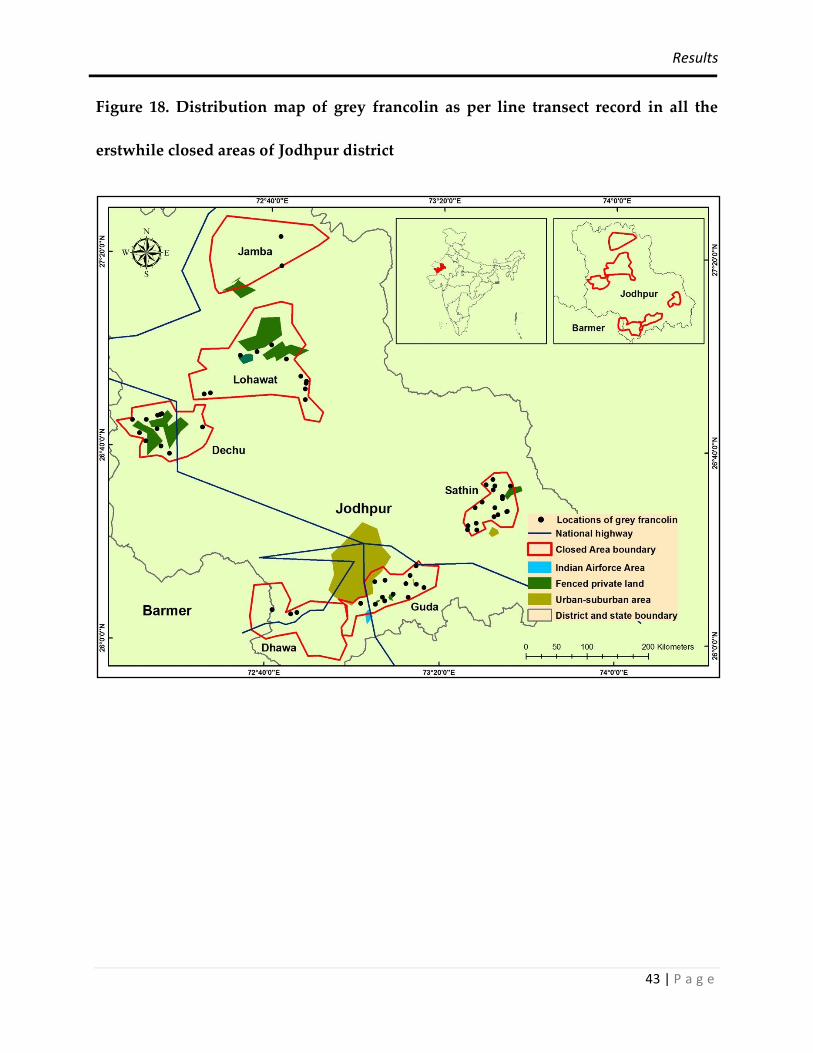
Results
43 | P a g e
Figure 18. Distribution map of grey francolin as per line transect record in all the
erstwhile closed areas of Jodhpur district

Results
44 | P a g e
Figure 19. Distribution map of domestic livestock as per line transect record in all the
erstwhile closed areas of Jodhpur district

Results
45 | P a g e
Results of habitat conditions (Vegetation Sampling):
The density of tree layer in the study area is ecologically very low due to the arid nature
of the soil. A total of 16 species of trees and 13 species of shrubs were encountered
during the vegetation sampling across the entire study area covering all 2515 quadrats.
The observed mean tree density (50.26 ± 9.96 SE ha-1) was lower than the mean shrub
density (343.88 ± 10.48 SE ha-1), though the mean diversity value was found to be higher
for trees (18.3 ± 0.003 SE) compared to shrubs (13.6 ± 0.005 SE). The detail of the density
estimates of the tree and shrub layers across all the six erstwhile closed areas as well as
for the entire study area are given in table 10 and table 11 respectively. The sobs (‘Mao
Tau’ Colwell et al. 2004) richness and Chao diversity index values (Chao 1984) of each
category of vegetation (trees and shrubs) were given in tables 12 and 13. The mean
richness of tree and shrub layers were estimated as 16 ± 0.008 SE and 13 ± 0.014 SE
respectively. Prosopis cineraria was found to be the most dominant species with GBH of
individuals within class interval of mostly 70-90 cm followed by Pongamia pinnata,
Albizia lebbeck, Acacia nilotica and Azadirachta indica in descending order. Simultaneously
Prosopis cineraria was found the highest IVI value (96.84) for the entire study area
whereas for Balanites roxburghii the IVI value came out to be the lowest (0.17). Details of
IVI for all the tree species are discussed in table 14.

Results
46 | P a g e
Table 10. Estimated tree density on 10m x 10m quadrat at every 200m interval on each line transect in different
erstwhile closed areas of Jodhpur
Species / Study sites
Guda
Bishnoiyan Dechu Dhawa Jamba Lohawat Sathin Overall
D
(ha-1) SE
D
(ha-1) SE
D
(ha-1) SE
D
(ha-1) SE
D
(ha-1) SE
D
(ha-1) SE
D
(ha-1) SE
Acacia nilotica 3.10 0.91 N.R. N.R. 9.18 1.59 0.30 0.02 2.54 0.84 4.66 1.10 3.26 0.74
Acacia senegal 0.24 0.24 1.51 0.67 0.17 0.17 N.R. N.R. 0.63 0.37 N.R. N.R. 0.20 0.24
Acacia tortilis N.R. N.R. 2.11 0.79 0.51 0.29 8.01 1.48 9.09 1.32 7.67 1.39 4.29 0.88
Albizia lebbeck N.R. N.R. 3.01 0.94 6.46 1.15 N.R. N.R. 7.40 1.20 6.30 1.27 4.02 0.76
Azadirachta indica 0.48 0.34 4.52 1.14 7.82 1.58 N.R. N.R. 7.19 1.19 1.10 0.55 3.26 0.80
Balanites egyptiaca 0.48 0.34 N.R. N.R. 0.17 0.17 N.R. N.R. N.R. N.R. N.R. N.R. 0.12 0.08
Balanites roxburghii 0.24 0.24 N.R. N.R. N.R. N.R. N.R. N.R. N.R. N.R. N.R. N.R. 0.04 0.04
Capparis decidua N.R. N.R. N.R. N.R. N.R. N.R. 8.01 1.48 N.R. N.R. N.R. N.R. 5.45 0.25
Pongamia pinnata N.R. N.R. 3.01 0.94 7.14 1.37 N.R. N.R. 13.95 1.59 N.R. N.R. 4.69 0.65
Prosopis cineraria 29.12 2.42 26.51 2.43 7.48 1.09 7.42 1.43 14.59 1.62 22.74 2.23 12.49 1.87
prosopis juliflora 3.82 1.11 N.R. N.R. N.R. N.R. N.R. N.R. 0.42 0.30 0.27 0.02 0.44 0.24
Salvadora oleoides 0.48 0.34 4.22 1.10 2.72 0.86 1.48 0.66 0.85 0.42 N.R. N.R. 1.67 0.56
Salvadora persica 1.91 0.67 7.23 1.42 11.56 1.91 0.89 0.51 N.R. N.R. 0.55 0.39 2.74 0.82
Tecomella undulata 1.91 0.67 0.90 0.52 15.65 2.19 5.04 1.19 0.42 0.30 2.47 0.81 4.21 0.95
Zizyphus jujube 0.48 0.34 N.R. N.R. N.R. N.R. N.R. N.R. N.R. N.R. 4.66 1.17 0.64 0.25
Zizyphus mauritiana 4.77 1.15 3.92 1.07 5.44 1.00 N.R. N.R. 2.75 0.75 3.29 1.01 2.74 0.83
(D – Density per hectare; N.R. – Not Recorded; SE – Standard Error)

Results
47 | P a g e
Table 11. Estimated shrub density on 5m x 5m quadrat at every 200m interval on each line transect in different
erstwhile closed areas of Jodhpur
Species / Study sites
Guda
Bishnoiyan Dechu Dhawa Jamba Lohawat Sathin Overall
D
(ha-1) SE
D
(ha-1) SE
D
(ha-1) SE
D
(ha-1) SE
D
(ha-1) SE
D
(ha-1) SE
D
(ha-1) SE
Aerva javanica 3.82 2.70 314.46 30.43 213.92 42.39 1515.73 106.77 601.27 69.06 169.86 38.79 83.02 48.35
Balanites roxburghii 7.64 2.68 N.R. N.R. 3.40 1.79 N.R. N.R. N.R. N.R. 9.86 4.22 2.86 1.45
Calotropis procera 110.74 17.57 220.48 27.68 140.58 17.08 144.81 21.72 145.45 13.95 107.40 16.56 71.09 19.09
Capparis decidua 130.79 16.17 37.35 6.84 86.93 8.82 98.52 16.58 43.97 7.10 52.60 11.70 47.55 11.20
Cassia angustifolia N.R. N.R. N.R. N.R. N.R. N.R. N.R. N.R. 102.33 24.27 N.R. N.R. 6.34 4.05
Cassia tora N.R. N.R. N.R. N.R. N.R. N.R. N.R. N.R. 4.23 1.05 N.R. N.R. 0.32 0.17
Crotalaria burhia N.R. N.R. 4.82 2.40 N.R. N.R. 5.93 3.13 136.15 8.81 77.81 8.30 38.01 3.77
Flacourtia seperia 1.91 1.91 N.R. N.R. 12.22 8.70 N.R. N.R. 8.46 2.65 N.R. N.R. 2.23 2.21
Leptadenia pyrotechnica N.R. N.R. 26.51 9.23 N.R. N.R. 54.60 11.13 21.99 8.15 78.90 20.70 11.61 8.20
Prosopis cineraria 1.91 1.91 N.R. N.R. N.R. N.R. N.R. N.R. N.R. N.R. N.R. N.R. 1.16 0.32
Maytenus emerginata 391.41 45.77 60.24 13.24 100.51 16.54 16.62 7.46 61.73 12.49 135.89 29.53 42.78 20.84
Salvadora persica 2.86 2.13 N.R. N.R. 4.07 1.92 5.93 2.64 2.54 1.89 16.44 7.63 3.18 2.70
Zizyphus nummularia 105.97 21.87 14.46 5.34 61.80 8.58 74.78 12.42 21.14 5.85 176.44 29.49 33.72 13.92
(D – Density per hectare; N.R. – Not Recorded; SE – Standard Error)

Results
48 | P a g e
Table 12. Estimated species richness and diversity index for the tree layers analyzed
by program Estimate S in different erstwhile closed areas of Jodhpur
Sl.
No. Closed Area
Sobs
Richness
Standard
Error (SE)
Shannon
Mean
Chao
diversity
Standard
Error (SE)
1 Guda Bishnoiyan
- Fitkashni 12 0.033 1.42 12.2 0.03
2 Dechu 10 0.09 1.44 11.7 0.07
3 Doli-Dhawa 12 0.039 2.19 13.28 0.093
4 Jamba 7 0.0065 1.62 8.3 0.025
5 Lohawat 11 0.006 1.92 13 0.044
6 Sathin 10 0.03 1.77 11.3 0.013
7 Overall 16 0.0076 2.35 18.3 0.003
Table 13. Estimated species richness and diversity index for the shrub layers
analyzed by program Estimate S in different erstwhile closed areas of Jodhpur
Sl.
No. Closed Area
Sobs
Richness
Standard
Error (SE)
Shannon
Mean
Chao
diversity
Standard
Error (SE)
1 Guda Bishnoiyan
- Fitkashni 9 0.94 1.52 10.2 0.024
2 Dechu 7 0.23 1.32 7.5 0.03
3 Doli-Dhawa 8 0.08 1.66 9.2 0.062
4 Jamba 8 1.2 1.55 8.7 0.034
5 Lohawat 11 0.2 1.85 12.1 0.05
6 Sathin 9 0.15 1.97 9.7 0.032
7 Overall 13 0.0138 1.84 13.6 0.005

Results
49 | P a g e
Table 14. Estimated importance value index (IVI) for the tree layers analyzed by
program Estimate S across all the erstwhile closed areas of Jodhpur
Species / Parameters
Relative
Density
Relative
Frequency
Relative
Dominance IVI
Prosopis cineraria 31.48422 24.84177 40.51195 96.83794
Acacia tortilis 11.207 8.544304 6.13098 25.88229
Pongamia pinnata 8.187037 9.335443 7.916602 25.43908
Albizia lebbeck 8.084545 7.990506 7.818548 23.8936
Tecomella undulata 7.674549 8.386076 5.470403 21.53103
Capparis decidua 3.414752 10.83861 6.363214 20.61657
Azadirachta indica 6.602329 6.487342 6.770914 19.86058
Acacia nilotica 4.782903 6.487342 7.617278 18.88752
Salvadora persica 5.425749 5.458861 4.273107 15.15772
Zizyphus mauritiana 5.85815 5.458861 2.848738 14.16575
Salvadora oleoides 2.949599 3.322785 2.601022 8.873406
Zizyphus jujube 2.138627 1.265823 0.495433 3.899882
Prosopis juliflora 1.128487 0.870253 0.737988 2.736728
Acacia senegal 0.856023 0.39557 0.258038 1.509631
Balanites egyptiaca 0.159467 0.237342 0.13934 0.536149
Balanites roxburghii 0.046557 0.079114 0.046447 0.172118

Results
50 | P a g e
5.2 Marking of erstwhile closed areas in GIS domain
The exact boundaries of all the 98 villages which constituted the six erstwhile closed
areas were not available with the forest department during their notification period in
early 1980’s. Therefore, during this survey we recorded the latitude and longitude of
different important landmarks such as schools, hospitals, water points, banks, post
offices, forest chowkies, police stations etc. situated in each village with hand help
Garmin 72 GPS device. Wherever we could find the boundary pillars of the villages we
recorded those locations as well. Thereafter, those locations were plotted in GIS
domain, projected in UTM (Universal Transverse Mercator) scale and finally joined to
prepare the periphery of each erstwhile closed areas. Separate maps were prepared
consisting of each of the geographical landmark recorded across the entire study area
(all the maps are enclosed as annexure at the end of the report Map 01-19).
5.3 Results of Socio-economic survey:
A total of 2470 households were surveyed during the study and 3366 people were
interviewed out of which 2984 (88.7%) were male and 382 (11.3%) were female
respondent. All the interviewees were above the age of 18 years. Except respondents of
guda Bishnoiyan and sathin closed areas, majority of interviewees from all other places
replied that the status of the oran (community land) around their villages was degraded
than past. Overall more than 60% respondents in the entire study area also opined the

Results
51 | P a g e
same. The comparative status of percentage response pattern on the issue of status of
oran is shown in figure 20.
On the issue of status of wildlife abundance nearly 70% (69.34%) from the entire study
area replied that it got deteriorated than the past 15 to 20 years. Except the interviewees
of Jamba, majority people from all other erstwhile closed areas opined in the same
pattern. The comparative status of percentage response pattern on the issue of status of
wildlife abundance in present w.r.t. the 15-20 years back across all the study sites is
shown in figure 21.
When the people who opined that the abundance of wildlife in present was reduced
than past days were further asked to indicate the probable cause of such degradation,
more than 57% of people blamed illegal hunting of the wildlife as the main reason.
Similar pattern of response were observed across all the six erstwhile closed areas.
Among other reasons of deterioration of wildlife status in the study area, issues such as
habitat destruction, habitat fragmentation due to modern agricultural practices and
accidents due to motor vehicles and domestic dogs were also reported by the
interviewees. The comparative percentage response pattern to indicate the probable
reasons of wildlife status deterioration in present time w.r.t. the earlier 15-20 years
period across all the study sites is shown in figure 22. Inversely, when the people who
opined that the abundance of wildlife in present got increased than past days were

Results
52 | P a g e
further asked to indicate the probable cause of such augmentation, more than 40% of
people replied more provision of food for the wild herbivores with the advancement of
agriculture as the main reason. Around 32% of such respondents also opined better
availability of water in Jodhpur district at present and more than 27% people thought
that with better protection measures from both community and government agencies
(forest and police department) had increased the abundance of wildlife in the study
area. Detail of percentage response pattern to indicate the probable reasons of wildlife
status augmentation is shown in figure 23.
In response to the issue of crop-raiding incidences by the wild herbivores, 88.5%
interviewees expressed their disappointment over it as a nuisance to their agricultural
practices whereas only six percent people accepted it as natural phenomenon and rest
five percent found it tolerable. The trend of response was identical across all the study
sites as it is shown in figure 24. When the interviewees were asked about how they have
felt for legal status of erstwhile closed areas, 68% people replied that they did not like
their surroundings to be declared as closed areas whereas only 11% of them accepted it
well and rest 20% people stayed neutral being unwilling to comment on this. The
patterns of the response on this issue across all the six erstwhile closed areas are shown
in figure 25.

Results
53 | P a g e
Results of our questionnaire survey revealed that 42% of the total interviewees reported
Indian grey wolf missing from their localities during the last decade while 40%
respondents described vultures as the most susceptible species towards local extinction.
Species such as hyena, jackal and Indian fox were also reported missing across the
entire study area by ten percent, five percent and two percent interviewees respectively.
The trend of responses in this issue across all the six erstwhile closed areas are shown in
figure 26.
Except Jamba and Lohawat areas, pigs were reported as the most problematic animal
followed by nilgai, chinkara, blackbuck and rats to damage the agricultural fields.
Overall 42.8% respondents replied pigs as most malicious animal while 38% reported
nilgai as most problematical animal towards crop production. The detail of response
pattern by the interviewees on this issue across all the study sites are given in figure 27.
The results of our survey showed that in the overall study area, 53% people were
prompt in rescuing the injured wildlife whereas 36.5% people took much time to decide
about the rescue operations. The rest ten percent people were found to be uninterested
in rescuing the injured animals. Amongst all the six study sites, highest proportion of
86% and 53% of all interviewees were keen to rescue the injured wildlife immediately in
Sathin and Lohawat areas respectively. The detail of the response regarding this issue
across all the study sites are shown in figure 28.
Results
54 | P a g e
Regarding the initiatives of eco-tourism as an option of simultaneous livelihood
generation for the local communities and conservation of wildlife, more than 50%
interviewees in the entire study area opposed such ideas as they feared that such
initiative might take away the grazing land of their domestic livestock. Around 31% of
the total respondents in the entire study area had agreed and welcome eco-tourism
initiatives as they thought it would increase their livelihood opportunities whereas rest
18.7% people stayed neutral to this issue. The details of the response patterns of the
interviewees across all the erstwhile closed areas are given in figure 29.
Finally when the interviewees were asked about their relationship with the forest
department, except respondents of Guda and Sathin areas, majority of the other four
erstwhile closed areas expressed their dissatisfaction stating that they did not have any
interactions with the local forest department authorities. Overall more than 57% of the
interviewees across all the six study sites expressed negative feedback regarding their
relationship with the forest department while 26.4% people had positive relationship
with the forest department. Rest 16% people had replied that they had an indifferent
relationship with the forest department. The details of the responses regarding this
issue across all the six study sites are shown in figure 30.

Results
55 | P a g e
Figure 20. Estimated percentage response pattern on the issue of status of oran across
the entire study area of Jodhpur district
Figure 21. Estimated percentage response pattern on the issue of status of wildlife
across the entire study area of Jodhpur district

Results
56 | P a g e
Figure 22. Estimated percentage response pattern on the reasons of wildlife depletion
across the entire study area of Jodhpur district
Figure 23. Estimated percentage response pattern on the reasons of wildlife
rejuvenation across the entire study area of Jodhpur district

Results
57 | P a g e
Figure 24. Estimated percentage response pattern on the issue of crop-raiding by wild
herbivores across the entire study area of Jodhpur district
Figure 25. Estimated percentage response pattern on the legal status of erstwhile
closed areas in Jodhpur

Results
58 | P a g e
Figure 26. Estimated percentage response pattern on the decline of major wildlife
species across the entire study area of Jodhpur district
Figure 27. Estimated percentage response pattern on the major problematic wildlife
species across the entire study area of Jodhpur district
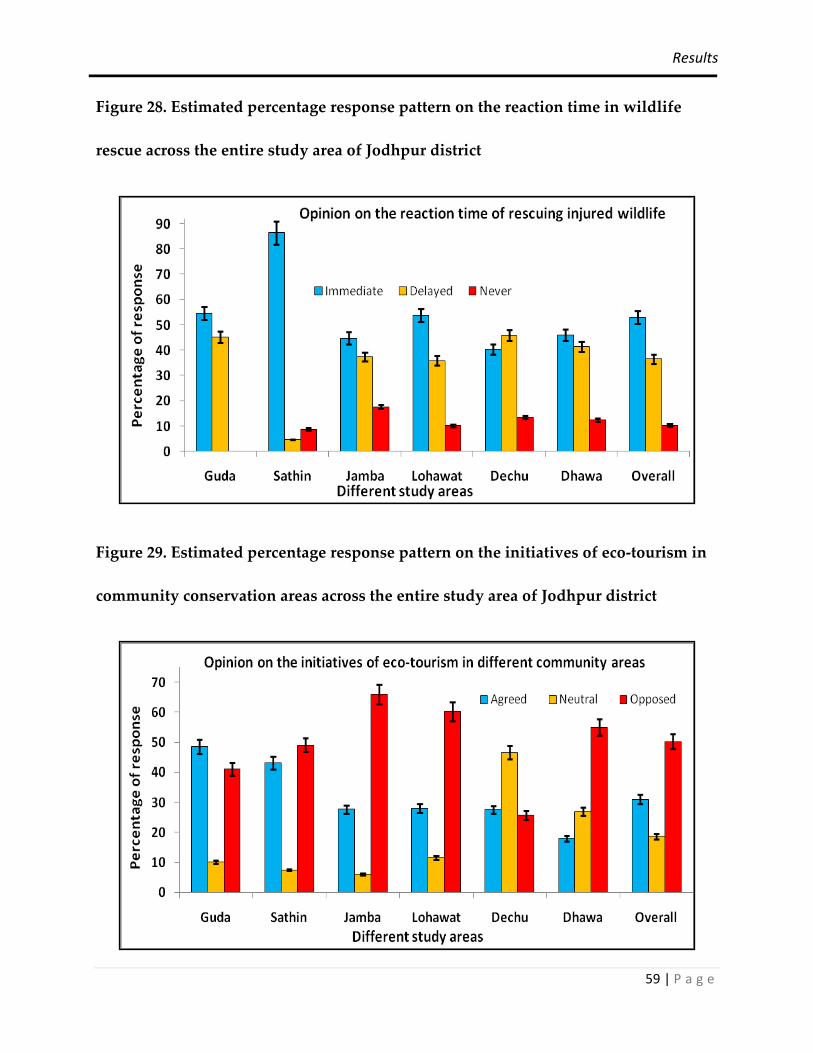
Results
59 | P a g e
Figure 28. Estimated percentage response pattern on the reaction time in wildlife
rescue across the entire study area of Jodhpur district
Figure 29. Estimated percentage response pattern on the initiatives of eco-tourism in
community conservation areas across the entire study area of Jodhpur district

Results
60 | P a g e
Figure 30. Estimated percentage response pattern on the relationship between forest
department and local community across the entire study area of Jodhpur district

6. DISCUSSION & RECOMMENDATIONS
6.1 Ecological Issues
The present study is a preliminary scientific base line survey conducted in short
period (two months) to understand the abundance, distribution of the herbivores (wild
and domestic) using distance sampling based line transects, vegetation quadrats to
evaluate their habitat conditions and also the perception of local communities towards
erstwhile closed areas and to assess the potentials for future conversion to community
conserved areas or look at other aspects vital for conservation of biological value in
these areas.
The estimated Abundance of wild ungulate species in the study area is quite high
having almost no well established protection mechanism in place. The density and
diversity of both tree and shrub layers in this arid ecosystem was naturally much less
than it was estimated in the semi-arid landscape of Sariska Tiger Reserve, Alwar,
Rajasthan by Kidwai 2013. The official census data of Jodhpur during last 20 years and
rescue operation data of last seven years showed decline and high rate of mortality in
the wild herbivore population (Table 15 and 16). Therefore, within naturally low
productive desert ecosystem if this trend continues, the future will be very bleak for
the wildlife in this region. Studies such as Dookia 2009 and Dutta et al. 2014 also
showed the similar concern of population decline in wild ungulates of desert
ecosystem as well as rapid reduction in natural habitats.
61 |P a g e

Discussion and recommendations
62 | P a g e
During this study it was recorded that the natural habitats of desert wild ungulates in
both Guda Bishnoiyan and Doli-Dhawa erstwhile closed areas were converted into
commercial and residential complexes under the urbanization projects of Jodhpur
Development Authority (JDA). The rural areas in this district are getting converted to
urban colonies at a fast pace and is affecting the very survival of these closed areas.
With the agricultural advancements and extraction of ground water with powerful
bore wells and pump sets, the cropping pattern of desert is getting changed from one
crop in monsoon (kharif) to both ravi (winter) and kharif crop patterns. Therefore,
many of the private land owners started erecting tall barbwire fencing around their
crop field to protect from crop-raiding incidences. Wherever the ground water is sweet
(non-saline) in nature, tall barbwire fencing is a common phenomenon (maximum
observed in Lohawat, Dechu and Sathin areas) causing landscape fragmentation and
permanent restriction in the movement and feeding patterns of the wild ungulates
leaving very little space for them to survive.
Therefore, as a blessing in disguise, wherever the underground water is saline (in
Guda Bishnoiyan, Dhawa and Jamba areas) the crop pattern is still single (only
monsoon – kharif crops) and subsequently agricultural fields are non-fenced. Thus,
landscape continuity is not broken down for the movements, reproduction and feeding
activities of the wild herbivores of desert.

Discussion and recommendations
63 | P a g e
Four species of wild canids (Indian grey wolf, golden jackal, Indian fox and desert fox)
and one lesser cat (desert cat) species are found in Jodhpur district whose ecology,
behavior or population status were never studied. Long term studies should be
designed to understand the ecology of these data deficient wild carnivores and their
interaction with the surrounding environment.
6.2 Social Issues
As per the socio-economic survey results, local communities pointed out illegal hunting
practice as one of the major reasons of deterioration of wildlife population in Jodhpur
along with habitat destruction and fragmentation. In spite of community prohibition,
sporadic hunting events of blackbuck and chinkara are still occurring in places where
majority of non-vegetarian communities are residing.
Official records of Jodhpur wildlife division further showed that the threat of group
hunting incidences of wild ungulates from domestic pet dogs of the agrarian
communities and other stray dogs in the village is increasing during last decade. But
rural people in some of the areas specifically in Guda Bishnoiyan, Doli-Dhawa and
Jamba areas are still in support of conserving these wild herbivores.
More than 42% respondents in the entire study area replied that their agricultural crops
are heavily damaged by pigs. Some opined it as wild pigs and some as farm pigs. This
issue should be critically addressed to reveal the genetic identification of these pigs to
understand their legal status so that proper management interventions can be executed.

Discussion and recommendations
64 | P a g e
More than 57% of the respondents across the entire study area replied that their
relationship with forest department is not satisfactory and they have not received any
kind of awareness exposure or conservation dialogue from the concerned authorities of
forest department.
During our field work we recorded presence of one or two forest guards in each of
these closed areas. Compared to the vast geographical area, these closed areas are
highly understaffed, probably this may be main reason for lack of any meaningful
dialogue or communication with the local communities. After 2003 Wildlife protection
Act amendment forest department did not have any management role of these closed
areas, except for occasional animal rescue tasks. Therefore, periodic meetings of
apposite authorities of forest department with the rural communities and workshops or
field exposures on wildlife conservation should be held at least in the priority sites to
increase the awareness and gain conservation support from the local community.
6.3 Closed area wise recommendations
Guda Bishnoiyan – Large areas of community lands (oran and gauchar) are
available in Bisalpur, Rudekli and Guda Bishnoi villages under this erstwhile closed
area. The status of wildlife in this area is still favorable but conversion of land use is a
major threat in this area. The potential areas should be conserved as Conservation
Reserve (CR) or Community Conservation Reserve (CCR) for long term survival of the
desert wildlife.

Discussion and recommendations
65 | P a g e
Sathin – Presence of Indian grey wolf was recorded near Burchha and Sargiya
khurd villages of this erstwhile closed area. Large areas of community lands (oran and
gauchar) are available near these villages as well.
Jamba – Large population of desert fox is present in this erstwhile closed area.
The local bishnoi community are willing to support wildlife conservation activities.
Potential community lands (oran and gauchar) are available near chakhu, motai and
balasar villages under this closed area which can be developed as CR or CCR.
Lohawat – all year long agricultural practices within fenced private lands have
fragmented the natural landscape. Incidences of wildlife injury and mortality is also
quite high in this erstwhile closed area. Still there are potential habitats left in Bhakari,
Jeriya and Munjasar villages to support long term survival of desert wildlife.
Dechu – Extension of fenced private lands are maximum in this area resulting in
reduction in wild herbivore population. Yet, Lodta hirada sot, Thadiya and sagran
villages in this erstwhile closed area has potential for long term wildlife conservation.
The Thadiya village is an ideal area to study the ecology of spiny tailed lizard.
Doli Dhawa – the most potential erstwhile closed area among all six in Jodhpur
as per the wild herbivore population, availability of natural habitats and conservation
support from community as well. The salinity of ground water does not allow year long
agriculture therefore possibility of landscape fragmentation is least. The only threat is
the expansion of Jodhpur city under the projects of JDA. Hirno ka tanka area,

Discussion and recommendations
66 | P a g e
community areas in Godawas and Chicharli villages in this erstwhile closed area can be
the potential places for developing CR or CCR.
6.4 General Recommendations for management practices across all closed areas:
Deployment of frontline staff is the major step for any management initiatives. But
during the study, severe dearth of deputation and allocation of front line staff in each of
the closed areas was observed compared to any protected area of India. It was observed
that the wildlife monitoring work for the entire Jodhpur district (22,500 km2 area) was
managed by just one range officer. Recruitment of more front line staff should be
carried out to rectify the inadequacy in administrative system.
A detailed long term follow up study has to be carried out to understand the effect of
habitat parameters and development projects on the desert ecosystem and finally site
specific action plans should be designed to conserve the potential habitats and the
existing wildlife under proper legal framework of CR or CCR.
Development of infrastructure for better treatment and cure of the rescued wildlife is
also a need of this area. Engagement of veterinary practitioners and development of
animal shelters are highly required. The induction process of the under-developed
rescue centre in Khejadli village of Guda Bishnoiyan closed area should be given
highest priority and pursued earliest possible.
The annual wildlife census techniques (waterhole census) used by the Jodhpur
wildlife division is quite out dated. Initiation of science based wildlife monitoring

Discussion and recommendations
67 | P a g e
census operation (distance sampling based line transect) and capacity building
programs should be organized to revise the skills of the front line staff.
The forest department should organize periodic conservation awareness camps
involving all the target groups (adult male, students and ladies) from the local
communities and start dialogue process with them, so that whatever wildlife surviving
in these erstwhile closed areas can be saved.
Table 15. Official census results (water hole count) of wildlife carried out by the
wildlife division of Jodhpur district during last 20 years
Sl. No. Year Blackbuck Chinkara Nilgai Wolf Fox jackal
1 1995 3173 2707 548 11 14 17
2 1996 3426 5449 348 2 14 19
3 1997 3308 3644 723 3 32 30
4 1998 3873 5768 781 11 31 87
5 1999 3565 7336 1348 11 56 70
6 2000 0 0 98 8 0 61
7 2001 NR NR NR NR NR NR
8 2002 8927 36513 3186 179 633 3
9 2003 2307 5333 266 0 59 0
10 2004 3888 7454 589 9 20 118
11 2005 2488 9495 806 4 105 NR
12 2006 NR NR NR NR NR NR
13 2007 1305 3659 323 3 37 56
14 2008 1354 3956 465 0 27 17
15 2009 1126 3489 498 5 16 115
16 2010 1197 4463 701 1 24 96
17 2011 1883 7682 1087 2 13 137
18 2012 2784 7806 1848 0 50 76
19 2013 2795 7824 1859 2 35 84
20 2014 2117 5190 1420 7 63 99
(NR – Not Recorded)

Discussion and recommendations
68 | P a g e
Table 16. Official records of the rescued injured wildlife (mainly herbivores) and
their subsequent fate after treatment by the wildlife division of Jodhpur district
during last seven years
Sl.
No. Period
Total Rescued
wildlife (herbivores)
No. of animals
survived
No. of
animals died
1 April 2008 -
March 2009 362 70 292
2 April 2009 -
March 2010 621 114 507
3 April 2010 -
March 2011 1008
216 792
4 April 2011 -
March 2012 678 236 442
5 April 2012 -
March 2013 862 238 624
6 April 2013 -
March 2014 641 139 502
7 April 2014 -
January 2015 907 178 729
Total 5079 1191 3888
LITERATURE CITED
Bagchi S. Goyal S.P. and Sankar K. 2003. Prey abundance and prey selection by tigers
(Panthera tigris) in a semi-arid, dry deciduous forest in western India. Journal of
Zoology (London). 260, pp. 285-290.
Bhattacharjee S. 2014. Prey selection, ranging pattern and habitat utilization of the
reintroduced tigers (Panthera tigris tigris L.) in Sariska Tiger Reserve, western India.
PhD Thesis submitted to Saurashtra University, Rajkot, Gujarat. June 2014.
Biswas S. and Sankar K. 2002. Prey abundance and food habits of tigers (Panthera tigris
tigris) in Pench National Park, Madhya Pradesh. Journal of Zoology (London). 256, pp.
411-420.
Buckland S.T., Anderson D.R., Burnham K.P. and Laake, J.L. 1993. Distance Sampling:
Estimating Abundance of Biological Populations. Chapman and Hall, London. pp. 446.
Buckland S.T., Anderson D.R., Burnham K.P., Laake J.L., Borchers D.L., and Thomas L.
2001. Introduction to Distance Sampling. London: Oxford University Press.
Burnham K.P., Anderson D.R., and Laake J.L. 1980. Estimation of density from line
transect sampling of biological populations. Wildlife Monographs 72, pp. 1-202.
Chao A. 1984. Non-parametric estimation of the number of classes in a population.
Scandinavian Journal of Statistics, 11, pp. 265–270.
Colwell R.K. and Coddington J.A. 1994. Estimating terrestrial biodiversity through
extrapolation. PhilosophicalTransactions of the Royal Society B: Biological Sciences, 345,
pp. 101-118.
Colwell R. 1997. Estimates: Statistical estimation of species richness and shared species
from samples. Version 7.5. User’s guide and application published online.
[URL:http://viceroy.eeb.uconn.edu/estimates]
Colwell R.K., Mao C.X. and Chang J. 2004. Interpolating, extrapolating, and comparing
incidence-based species accumulation curves. Ecology, 85, pp. 2717–2727.
69 |P a g e

Literature cited
70 | P a g e
Cox G. 1990. Laboratory manual of general ecology 6th Ed. Dubuque, Iowa: WIlliam C.
Brown.
Curtis J. T. 1959. The vegetation of Wisconsin. In: An Ordination of Plant Communities,
Wisconsin Press, Madison.
Dookia S. 2009. Conservation of Indian Gazelle or Chinkara through community
support in Thar Desert of Rajasthan, India.
Dutta S., Bhardwaj G.S., Bhardwaj D.K., Jhala Y.V. 2014. Status of Great Indian Bustard
and Associated Wildlife in Thar. Wildlife Institute of India, Dehradun and Rajasthan
Forest Department, Jaipur.
Harihar A., Pandav B and Goyal S.P. 2009. Density of leopard (Panthera pardus) in
Chilla Range of Rajaji National Park, Uttarakhand, India. Mammalia 73, pp. 68-71.
IUCN 2013. IUCN Red List of Threatened Species. Version 2013.1.
<www.iucnredlist.org>.
Karanth K.U. and Sunquist M.E. 1995. Prey selection by tiger, leopard and dhole in
tropical forests. Journal of Animal Ecology 64, pp. 439-450.
Kent M. and Coker P. 1992. Vegetation Description and Analysis, A Practical Approach.
John Wiley and Sons, NY, pp. 167-169.
Khan J.A., Chellam R., Rodgers W.A., and Johnsingh A.J.T. 1996. Ungulate Densities
and Biomass in the Tropical Dry Deciduous Forests of Gir, Gujarat, India. Journal of
Tropical Ecology 12, pp. 149-162.
Kidwai Z. 2013. Vegetation structure and composition in core area of Sariska National
Park, Rajasthan. Indian Forester, 139 (7), pp. 636-644.
Menon V. 2014. Indian Mammals. A field Guide. Hachette Book Publishing India Pvt.
Ltd. Gurgaon, India.
Pandeya S.C., Sharma S.C., Jain H.K., Pathak S.J., Palimal K.C., Bhanot V.M., 1977. The
Environment and Cenchrus Grazing Lands in Western India. Final Report.
Department of Biosciences, Saurasthra University, Rajkot, India.

Literature cited
71 | P a g e
R Development Core Team R: a language and environment for statistical computing. In
R Development Core Team 2006 Vienna, Austria: R Development Core
Team http://www.R-project.org
Ramesh M. and Ishwar N.M., 2008. Status and distribution of the Indian spiny-tailed
lizard Uromastyx hardwickii in the Thar Desert, western Rajasthan., pp. 48. Group for
Nature Preservation and Education, India.
Rodgers W.A., Panwar H.S., Mathur V.B., 2002. Wildlife Protected Area Network in
India: A Review (Executive Summary). Wildlife Institute of India, Dehradun.
Sankar K., and Johnsingh A. J. T., 2002. Food habits of tiger (Panthera tigris) and leopard
(Panthera pardus) in Sariska Tiger Reserve, Rajasthan, India, as shown by scat
analysis. Mammal 66(2), pp. 285-289.
Seber G. A. F., 1982. The estimation of animal abundance and related parameters.
Second ed. Macmillan Publ. Co. Inc., New York, USA. pp. 654.
Schaller G. B., 1967. The Deer and the Tiger. A study of Wildlife in India. The University
of Chicago Press, Chicago. pp. 370.
Sikka, D.R., 1997. Desert Climate and its Dynamics. Current Science 72, 35-46.
Stoen O.G. and Wegge P. 1996. Prey selection and prey removal by tiger (Panthera tigris)
during the dry season in lowland Nepal. Mammalia 60, pp.363–373
The Wildlife Protection Act 1972. Amendment 2013. Ministry of Environment and
Forests.
Thomas L., Laake J., Rexstad E., Strindberg S., Marques F., Buckland S., Borchers D.,
Anderson D., Burnham K., Burt M., Hedley S., Pollard J., Bishop J. and Marques T.,
2009. Distance 6.0. Release 1.
Working plan Jodhpur 2013-14 to 2022-23. Forest Division Jodhpur. Prepared by Mr. M.
S. Rathore. Directed by Mr. S. K. Jain and Mr. A. K. Singh. Project advisor Mr. A. C.
Chaubey, PCCF, Department of Forests, Government of Rajasthan.

Annexure
72 | P a g e
ANNEXURE I
Map 1. Landmark distribution map of different facilities in the study area (Banks)
Map 2. Landmark distribution map of different facilities in the study area (Electricity
structures)

Annexure
73 | P a g e
Map 3. Landmark distribution map of different facilities in the study area (Forest
Department structures)
Map 4. Landmark distribution map of different facilities in the study area (Health
Facilities)

Annexure
74 | P a g e
Map 5. Landmark distribution map of different facilities in the study area (Panchayat
Facilities)
Map 6. Landmark distribution map of different facilities in the study area (Police
stations)

Annexure
75 | P a g e
Map 7. Landmark distribution map of different facilities in the study area (Post
Offices)
Map 8. Landmark distribution map of different facilities in the study area (Railway
station)

Annexure
76 | P a g e
Map 9. Landmark distribution map of different facilities in the study area (Religious
places)
Map 10. Landmark distribution map of different facilities in the study area
(Education facilities)

Annexure
77 | P a g e
Map 11. Landmark distribution map of different facilities in the study area (water
sources)

Annexure
78 | P a g e
ANNEXURE II
Plate 1. Blackbuck bachelors’ herd of at Dhawa Plate 2. Blackbuck females at a water body in Guda
Plate 3. Chinkara females with fawns at Sathin Plate 4. Male chinkara in Bhakari Lohawat

Annexure
79 | P a g e
Plate 5. Nilgai herd spotted at Dhawa Plate 6. Nilgai females in Dechu
Plate 7. Pigs spotted at Dhawa Plate 8. Boar spotted in Sathin

Annexure
80 | P a g e
Plate 9. Desert fox in Jamba Plate 10. Desert fox in Sathin
Plate 11. Golden jackal in Fitkashini Guda Plate 12. Golden jackal in Dhawa
Plate 13. Desert gerbil in Lohawat Plate 14. Desert gerbil Dechu

Annexure
81 | P a g e
Plate 15. Demoiselle crane at a water body near Guda Plate 16. Long-legged buzzard spotted at Sathin
Plate 17. Black crowned sparrow lark at Lohawat Plate 18. Lesser flamingo at Dhawa
Plate 19. Shikra spotted in Lohawat Plate 20. Cinereous vulture and Eurasian
griffon in Jamba

Annexure
82 | P a g e
Plate 21. Bhakad (hills) of Phinch village in Dhawa Closed area
Plate 22. Rohida habitat (Tecomella undulata) near Chichadli village in Dhawa Closed area
Plate 23. Hilly habitat near Rathkuria village in Sathin Closed area
Plate 24. Oran (Community land) of Rudekli village in Guda Closed area

Annexure
83 | P a g e
Plate 25. Questionnaire survey in Dhawa Plate 26. Questionnaire survey in Jamba
Plate 27. Questionnaire survey in Guda Plate 28. Questionnaire survey in Sathin

Annexure
84 | P a g e
ANNEXURE III
Project Title: Ecological Status survey of the erstwhile Closed Areas of the district of Jodhpur, Rajasthan
Data Sheet for Distance Sampling of Prey Species on Line transect (Data sheet no: 01 / Closed areas / GOR) Transect ID: Observers: Weather condition:
Transect Length: Date: Start GPS: End GPS:
Transect Bearing: Start time: End time: Village name and Tehsil:
Sl. No.
Species Total no. of animals Sighting Angle
(degree)
Walk Bearing (degree)
Angular sighting distance (Meter)
Major Vegetation
Type* (10 m radius)
Major Terrain Type**
(10 m radius)
Remarks / GPS Locations of wild herbivores and small –
medium wild carnivores (whenever sighted)
M F JU UNID TOTAL
1
2
3
4
5
6
7
8
9
10
Species to be recorded: Nilgai, Chinkara, Black buck, Wild pig, Hare, Common Langur, Rhesus Macaque, Livestock – Cattle, Buffalo, Goat, Sheep, Camel, donkey etc., Peafowl and
Francolins and any other large birds. M - male, F - Female, JU - Juvenile, UNID – Unidentified *Vegetation type: 1) Acacia mixed forest, 2) Prosopis cineraria (Khejri) dominated forests, 3) Prosopis juliflora
thickets and 4) Scrub land **Terrain type: 1) Flat, 2) Gentle slope, 3) Sand dunes, 4) Rocky areas.
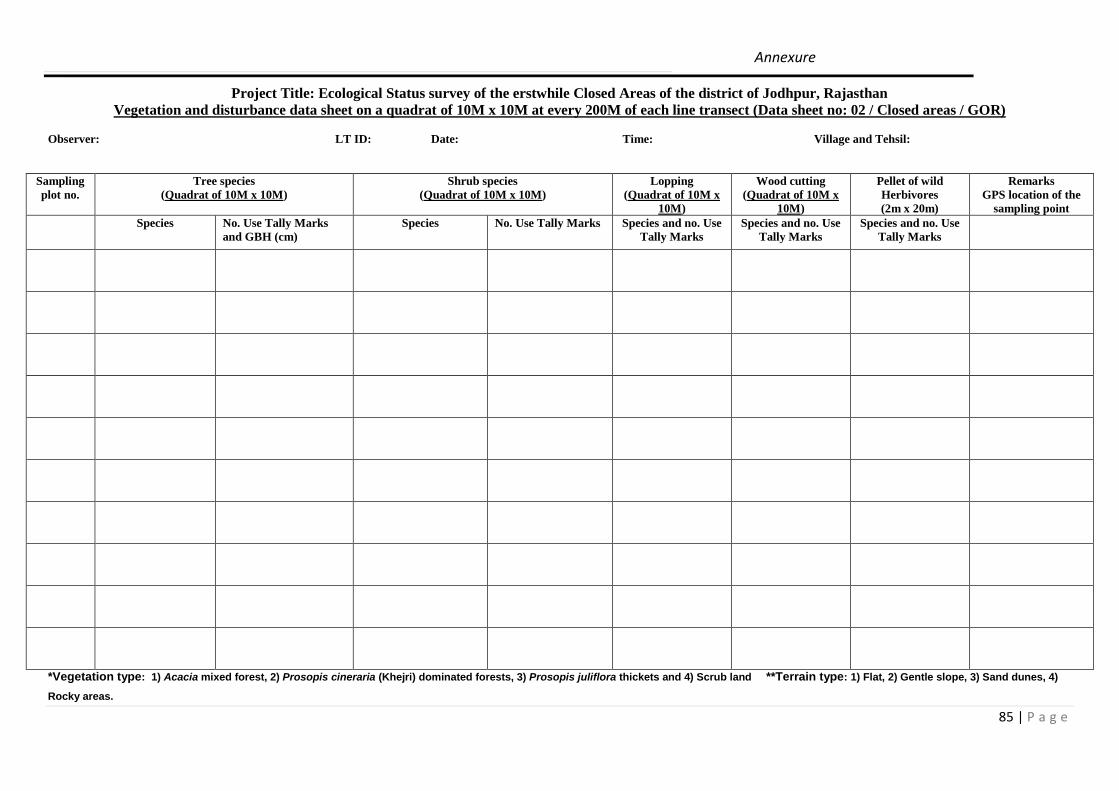
Annexure
85 | P a g e
Project Title: Ecological Status survey of the erstwhile Closed Areas of the district of Jodhpur, Rajasthan
Vegetation and disturbance data sheet on a quadrat of 10M x 10M at every 200M of each line transect (Data sheet no: 02 / Closed areas / GOR)
Observer: LT ID: Date: Time: Village and Tehsil:
Sampling
plot no.
Tree species
(Quadrat of 10M x 10M)
Shrub species
(Quadrat of 10M x 10M)
Lopping
(Quadrat of 10M x
10M)
Wood cutting
(Quadrat of 10M x
10M)
Pellet of wild
Herbivores
(2m x 20m)
Remarks
GPS location of the
sampling point
Species No. Use Tally Marks
and GBH (cm)
Species No. Use Tally Marks Species and no. Use
Tally Marks
Species and no. Use
Tally Marks
Species and no. Use
Tally Marks
*Vegetation type: 1) Acacia mixed forest, 2) Prosopis cineraria (Khejri) dominated forests, 3) Prosopis juliflora thickets and 4) Scrub land **Terrain type: 1) Flat, 2) Gentle slope, 3) Sand dunes, 4)
Rocky areas.

Annexure
86 | P a g e
Questionnaire Survey to assess Ecological Status of the erstwhile Closed Areas of the district of Jodhpur,
Rajasthan (To be carried out among 2% adult population (> 18 years of age) of each village)
1. Name of the respondent:
2. Father / Husband’s name:
3. Age and sex:
4. Address: Village and Tehsil name:
5. Education: a. Illiterate, b. Primary, c. Secondary (X), d. Senior secondary (XII), e. College / University
6. Area of the land owned and land quality whether fertile lands or unfertile:
7. Which and how much crops do you grow in a year?
8. Livestock holding (Species and no.)
9. Feeding practice of the livestock: a) Stall feeding, b) Free grazing, c) guarded grazing, d) any other
10. Source of livelihood: a) Agriculture, b) Animal husbandry, c) Employment/ Labour work, d)Other specify
11. Do you know about any Oran near your village? Yes / No If yes – name and app. Area
12. Status of the known Oran – a) Getting better, b) As it is or c) Degraded than past
13. Status of agriculture in present days - a) Reduced, b) As it is or c) Increased
14. Past irrigation measures:
15. Present irrigation measure: Bore well / canal / other – specify -
16. Major wildlife species seen in the present around the village and its’ effect on rural life –
17. Wildlife species missing in the present or severely declined in no. –
18. Change in wildlife status - a) Getting better, b) As it is or c) Declined than past
19. What are the probable indicators of change?
20. Do you know about any hunting incident in this region? (yes / no) if yes describe briefly
21. How is the relation with forest department? a) poor, b) Fair or c) Good
22. Are you aware of the problem of wild herbivores getting stuck in artificial fencing? Yes / no if yes
23. What do you think about artificial fencing? a) It’s highly required, b) It’s ok or c) It’s not required
24. How do you react to rescue any injured wild animal? a) immediately, b) after a while or c) never
25. Do you know about Eco-tourism initiatives? Yes / no if yes is it good / fair / bad
26. What do you think about crop raiding? a) It’s well accepted, b) It’s tolerable or c) It’s a nuisance
27. Are you aware of the earlier status of closed areas? Yes / no if yes was it accepted as good / fair / bad
28. Can anything be done to develop this area for wildlife conservation?
29. Any other remark on mintaining the ecological / cultural values of this area –
Name of the interviewer: Date

Annexure
87 | P a g e
Project Title: Ecological Status survey of the erstwhile Closed Areas of the district of Jodhpur, Rajasthan
Factual data sheet for GPS locations and descriptions of the geographical features in each village of Closed
areas in Jodhpur (Data Sheet no: 03 / Closed areas / GOR)
Observer: Date: Village and Tehsil:
Sl no. Geographical Features GPS location (Lat and Long) Brief Description
1 School (s)
2 Panchayat Bhawan
3 Hand pump (s)
4 Well (s)
5 Religious place (s)
6 Historical monument / Ruin
7 Bank / Post Office
8 Water hole / pond / tank
9 Village boundary pillar (s)
10 Electric Pillar (s)
11 Forest Department Property
12 Police or Railway Station (s)
13 Any other important structure

Bhattacharjee, S., Kidwai, Z., Bhattarai, S., Bajpai, H., Rathore, M.S. and Reddy, G.V. 2015.
Ecological assessment of the erstwhile closed areas in Jodhpur district, Rajasthan. Technical
report, March 2015, submitted to Department of Forests, Government of Rajasthan. pp – 87


