36
John Hancock Blue Chip Growth Fund Semiannual report 2/28/18
| Date post: | 13-Jun-2018 |
| Category: |
Documents |
| Upload: | nguyenkhanh |
| View: | 218 times |
| Download: | 0 times |

JOBNAME: No Job Name PAGE: 3 SESS: 39 OUTPUT: Tue Apr 24 19:49:59 2018 SUM: 0A641795/qaJobz/JohnHancock/shareholder_2015/JH457BlueChipGrowth/JH457_Blue_Chip_Growth_SA
John HancockBlue Chip Growth Fund
Semiannual report 2/28/18
JOBNAME: No Job Name PAGE: 4 SESS: 39 OUTPUT: Tue Apr 24 19:49:59 2018 SUM: 43AE42AF/qaJobz/JohnHancock/shareholder_2015/JH457BlueChipGrowth/JH457_Blue_Chip_Growth_SA
Dear shareholder,
Markets around the world experienced a meaningful rise in volatility in the last few weeks of thereporting period. Stocks declined as investors reacted to higher bond yields and the prospect ofrising inflation, even if that inflation was rising from historically low levels. While some in theasset management community believe the sell-off will be temporary, it’s likely that the era ofextremely low volatility is behind us for the time being.
Ultimately, the asset prices are underpinned by fundamentals, and those continue to appearsupportive. There was no shortage of good economic news to report as 2017 came to a close.Unemployment remained close to historic lows, consumer confidence rose, and the housingmarket continued to notch steady gains. One moderating factor was the U.S. Federal Reserve’ssteady tightening of monetary policy. While higher interest rates alone may not cause theeconomy to pull back, markets will be closely attuned to any sign of policymakers quickening thepace of interest-rate increases in the year ahead.
Your best resource in unpredictable markets is your financial advisor, who can help position yourportfolio so that it’s sufficiently diversified to meet your long-term objectives and to withstandthe inevitable turbulence that accompanies investing in any market cycle.
On behalf of everyone at John Hancock Investments, I’d like to take this opportunity to welcomenew shareholders and to thank existing shareholders for the continued trust you’ve placed in us.
Sincerely,
Andrew G. ArnottPresident and CEO,John Hancock InvestmentsHead of Wealth and Asset Management,United States and Europe
This commentary reflects the CEO’s views, which are subject to change at any time. Investing involves risks, including the potential loss ofprincipal. Diversification does not guarantee investment returns and does not eliminate risk of loss. For more up-to-date information,please visit our website at jhinvestments.com.
A message to shareholders
JOBNAME: No Job Name PAGE: 5 SESS: 39 OUTPUT: Tue Apr 24 19:49:59 2018 SUM: 7C150432/qaJobz/JohnHancock/shareholder_2015/JH457BlueChipGrowth/JH457_Blue_Chip_Growth_SA
John HancockBlue Chip Growth Fund
Table of contents
2 Your fund at a glance
4 Discussion of fund performance
8 A look at performance
10 Your expenses
12 Fund’s investments
17 Financial statements
20 Financial highlights
24 Notes to financial statements
31 More information
SEMIANNUAL REPORT | JOHN HANCOCK BLUE CHIP GROWTH FUND 1
JOBNAME: No Job Name PAGE: 6 SESS: 39 OUTPUT: Tue Apr 24 19:49:59 2018 SUM: 7084062E/qaJobz/JohnHancock/shareholder_2015/JH457BlueChipGrowth/JH457_Blue_Chip_Growth_SA
INVESTMENT OBJECTIVE
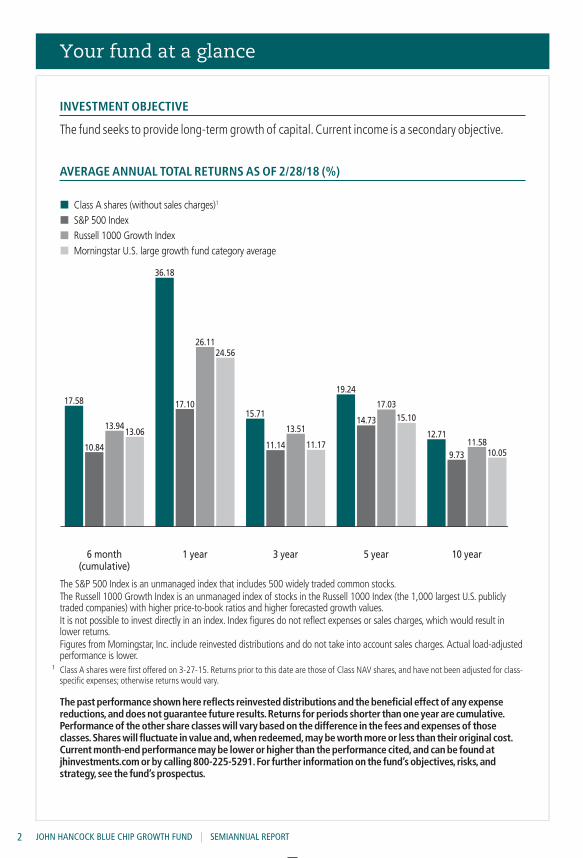
The fund seeks to provide long-term growth of capital.Current income is a secondary objective.
AVERAGE ANNUAL TOTAL RETURNS AS OF 2/28/18 (%)
�
�
�
�
Class A shares (without sales charges)1
S&P 500 IndexRussell 1000 Growth IndexMorningstar U.S. large growth fund category average
5 year3 year6 month(cumulative)
1 year 10 year
15.10
10.05
17.58
13.9413.06
24.56
11.1710.84
36.18
17.10
26.11
15.71
11.14
19.24
14.73
12.71
9.73
13.51
17.03
11.58
The S&P 500 Index is an unmanaged index that includes 500 widely traded common stocks.The Russell 1000 Growth Index is an unmanaged index of stocks in the Russell 1000 Index (the 1,000 largest U.S. publiclytraded companies) with higher price-to-book ratios and higher forecasted growth values.It is not possible to invest directly in an index. Index figures do not reflect expenses or sales charges, which would result inlower returns.Figures from Morningstar, Inc. include reinvested distributions and do not take into account sales charges. Actual load-adjustedperformance is lower.
1 Class A shares were first offered on 3-27-15. Returns prior to this date are those of Class NAV shares, and have not been adjusted for class-specific expenses; otherwise returns would vary.
The past performance shown here reflects reinvested distributions and the beneficial effect of any expensereductions,and does not guarantee future results.Returns for periods shorter than one year are cumulative.Performance of the other share classes will vary based on the difference in the fees and expenses of thoseclasses.Shares will fluctuate in value and,when redeemed,may be worth more or less than their original cost.Current month-end performance may be lower or higher than the performance cited,and can be found atjhinvestments.com or by calling 800-225-5291.For further information on the fund’s objectives,risks,andstrategy,see the fund’s prospectus.
Your fund at a glance
JOHN HANCOCK BLUE CHIP GROWTH FUND | SEMIANNUAL REPORT2
JOBNAME: No Job Name PAGE: 7 SESS: 39 OUTPUT: Tue Apr 24 19:49:59 2018 SUM: 7CCBAFE6/qaJobz/JohnHancock/shareholder_2015/JH457BlueChipGrowth/JH457_Blue_Chip_Growth_SA
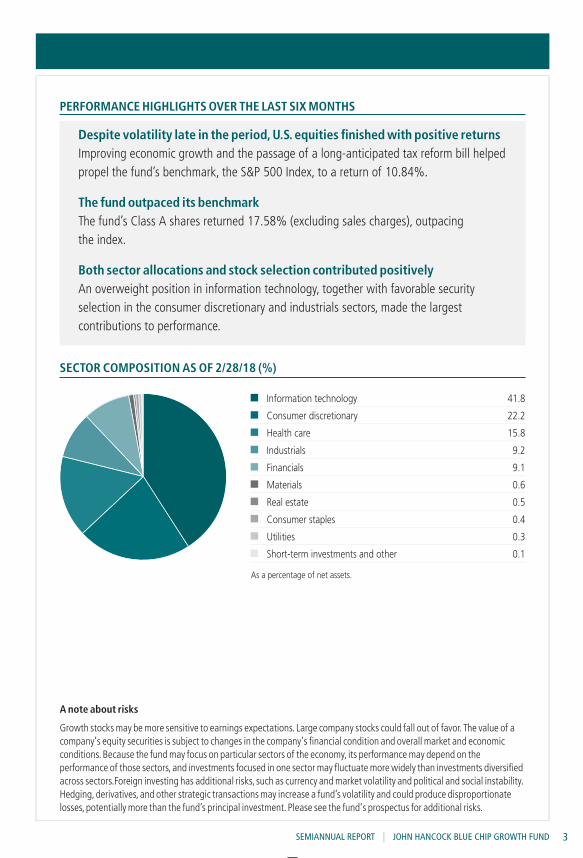
PERFORMANCE HIGHLIGHTS OVER THE LAST SIX MONTHS
Despite volatility late in the period, U.S. equities finished with positive returnsImproving economic growth and the passage of a long-anticipated tax reform bill helpedpropel the fund’s benchmark, the S&P 500 Index, to a return of 10.84%.
The fund outpaced its benchmarkThe fund’s Class A shares returned 17.58% (excluding sales charges), outpacingthe index.
Both sector allocations and stock selection contributed positivelyAn overweight position in information technology, together with favorable securityselection in the consumer discretionary and industrials sectors, made the largestcontributions to performance.
SECTOR COMPOSITION AS OF 2/28/18 (%)
Information technology
Consumer discretionary
Health care
Industrials
Financials
Materials
Real estate
Consumer staples
Utilities
Short-term investments and other
As a percentage of net assets.
41.8
22.2
15.8
9.2
9.1
0.6
0.5
0.4
0.3
0.1
A note about risks
Growth stocks may be more sensitive to earnings expectations. Large company stocks could fall out of favor. The value of acompany’s equity securities is subject to changes in the company’s financial condition and overall market and economicconditions.Because the fund may focus on particular sectors of the economy, its performance may depend on theperformance of those sectors, and investments focused in one sector may fluctuate more widely than investments diversifiedacross sectors.Foreign investing has additional risks, such as currency and market volatility and political and social instability.Hedging,derivatives, and other strategic transactions may increase a fund’s volatility and could produce disproportionatelosses, potentially more than the fund’s principal investment. Please see the fund’s prospectus for additional risks.
SEMIANNUAL REPORT | JOHN HANCOCK BLUE CHIP GROWTH FUND 3
JOBNAME: No Job Name PAGE: 8 SESS: 39 OUTPUT: Tue Apr 24 19:49:59 2018 SUM: 637D8070/qaJobz/JohnHancock/shareholder_2015/JH457BlueChipGrowth/JH457_Blue_Chip_Growth_SA
Can you describe the market environment
during the six months ended
February 28, 2018?
Despite a sharp increase in volatility in the final
month of the period, the fund’s benchmark, the
S&P 500 Index, posted a robust gain. Several
factors played a role in the rally. First, economic growth continued to accelerate in both the United
States and the world as a whole,which provided a highly favorable backdrop for investor sentiment.
In addition, corporate profits came in above expectations throughout the second half of the year,
contributing to an improvement in earnings estimates for 2018.Not least, the markets were aided
by the passage of a sweeping tax reform plan in late 2017. The bill reduced the corporate tax rate to
21%,providing a further boost to the earnings outlook for the year ahead.
These developments,while generally positive for the stock market, also fueled concerns that the
U.S. Federal Reserve (Fed) would have to take a more aggressive approach to raising interest rates.
This worry, together with the resulting increase in bond yields, led to a sharp downturn in stocks in
early February.However, losses moderated in the final weeks of the period, as concerns eased and
the market found support from investors seeking to capitalize on equity valuations that had become
more attractive following the sell-off.
How did the fund perform?
The fund outperformed its benchmark and its Morningstar peer group average during the period. It
also outpaced its benchmark and peers over the one-, three-, five-, and 10-year periods.Both stock
selection and sector allocations contributed to outperformance.
What aspects of the fund’s sector allocations helped and hurt relative performance?
The portfolio’s overweight position in the information technology sector made the largest
contribution to results.We maintained a significant weighting in technology, as we continued to
Discussion of fund performance
An interview with Portfolio Manager Larry J. Puglia, CFA, CPA, T. Rowe
Price Associates, Inc.
Larry J. Puglia, CFA, CPA
Portfolio Manager
T. Rowe Price
JOHN HANCOCK BLUE CHIP GROWTH FUND | SEMIANNUAL REPORT4
JOBNAME: No Job Name PAGE: 9 SESS: 39 OUTPUT: Tue Apr 24 19:49:59 2018 SUM: CF09F3A0/qaJobz/JohnHancock/shareholder_2015/JH457BlueChipGrowth/JH457_Blue_Chip_Growth_SA
find attractive opportunities in
companies with innovative business
models and the ability to take advantage
of transformational change. In addition,
we favored companies with durable
business models that address large and
growing markets, including internet
search and advertising, electronic payment processing, and social connectivity.We also emphasized
companies that will benefit from secular demand for public cloud computing services.
The fund’s underweight positions in more defensive and/or interest-rate-sensitive sectors that
lagged—such as consumer staples, utilities, and real estate—was an additional positive.
Conversely, an underweight in the financials sector—which surged following the passage of
sweeping tax reform legislation by Congress—weighed on results. The substantial cut in corporate
taxes is expected to be especially positive for the financials sector,where many firms are subject to
high tax rates. In addition, an increase in longer-term U.S. Treasury yields boosted the outlook for
banks’ lending margins.
How did stock selection influence performance?
Stock selection added the most value in the consumer discretionary sector. Shares of Amazon.com,
Inc. rose after the company released a strong earnings report that handily beat both consensus
expectations and previous management guidance. The company’s results were impressive across
“Despite a sharp increase in
volatility in the final two
months of the period, the fund’s
benchmark, the S&P 500 Index,
posted a robust gain.”
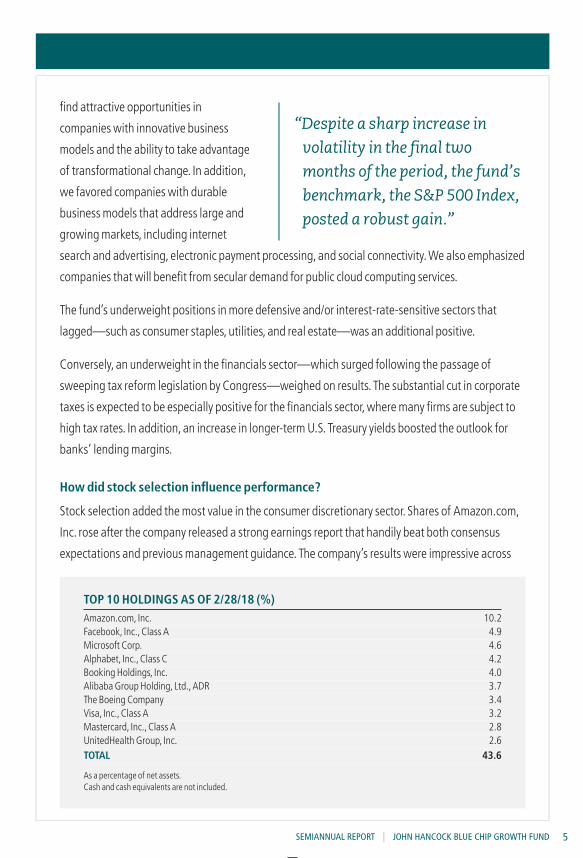
TOP 10 HOLDINGS AS OF 2/28/18 (%)Amazon.com, Inc. 10.2Facebook, Inc.,Class A 4.9Microsoft Corp. 4.6Alphabet, Inc.,Class C 4.2Booking Holdings, Inc. 4.0Alibaba Group Holding, Ltd.,ADR 3.7The Boeing Company 3.4Visa, Inc.,Class A 3.2Mastercard, Inc.,Class A 2.8UnitedHealth Group, Inc. 2.6TOTAL 43.6
As a percentage of net assets.Cash and cash equivalents are not included.
SEMIANNUAL REPORT | JOHN HANCOCK BLUE CHIP GROWTH FUND 5
JOBNAME: No Job Name PAGE: 10 SESS: 39 OUTPUT: Tue Apr 24 19:49:59 2018 SUM: 5672ED0F/qaJobz/JohnHancock/shareholder_2015/JH457BlueChipGrowth/JH457_Blue_Chip_Growth_SA
the board,with improving profitability and accelerating revenue growth.We continue to hold the
stock on the belief that its pace of innovation is remarkable and that growth in the company’s cloud
computing unit,Amazon Web Services, remains in its early stages.
The industrials sector also proved to be an
area of strength for the fund. The Boeing
Company’s shares rose after it reported
better-than-expected earnings and raised its
full-year guidance.We believe Boeing
remains well positioned for several years of
healthy profits and free cash flow growth
due its robust backlog of orders and the
tailwind from the increase in global
air traffic.
Outside of these two sectors, notable contributors included the Chinese internet company Tencent
Holdings, Ltd.,Mastercard, Inc., and the cloud computing provider ServiceNow, Inc.
Alexion Pharmaceuticals, Inc., Facebook, Inc., and American Tower Corp.were the leading
individual detractors.
With a recent increase in volatility, how have you positioned the fund at period end?
The domestic equity market appears to be fully valued,but we don’t think that necessarily precludes
stocks from performing well for the remainder of 2018. It does, however,mean that a more
circumspect approach is appropriate at this point in the cycle. Interest rates and inflation have
started to behave a bit more like we expected,with moderate increases in both. Still,we don’t view
the Fed’s gradual and measured approach to raising rates as a headwind,but rather as
corroborating evidence that the global economy is in reasonably good shape.
While higher valuations have made the risk/reward profile of some stocks less favorable, there are
still interesting opportunities in secular growth companies with strong fundamentals.We continue
to have high conviction with regard to a number of fund holdings the information technology and
healthcare sectors,where the valuations of select companies do not appear too frothy given the
positive trajectories of the underlying businesses.On the other hand,we maintained a cautious
“The domestic equity market
appears to be fully valued,
but we don’t think that
necessarily precludes stocks
from performing well for the
remainder of 2018.”
JOHN HANCOCK BLUE CHIP GROWTH FUND | SEMIANNUAL REPORT6
JOBNAME: No Job Name PAGE: 11 SESS: 39 OUTPUT: Tue Apr 24 19:49:59 2018 SUM: 65491342/qaJobz/JohnHancock/shareholder_2015/JH457BlueChipGrowth/JH457_Blue_Chip_Growth_SA
stance toward structurally challenged industries like
retail, cyclical sectors such as industrials, and
defensive sectors like consumer staples.
More broadly speaking,we remained focused on
business fundamentals to uncover opportunities in
companies we think can outperform without the help
of tax reform or other policy actions.We continue to
believe our strategy of investing in all-season growth companies (those with experienced
management teams, leading market positions, and growth that is not heavily reliant on the overall
direction of the economy) should position the fund to deliver attractive risk-adjusted returns over
full market cycles.
MANAGED BYLarry J. Puglia, CFA, CPAOn the fund since 2005Investing since 1989
The views expressed in this report are exclusively those of Larry J. Puglia,CFA,CPA,T.Rowe Price Associates, Inc., and are subject to change.They are not meant as investment advice. Please note that the holdings discussed in this report may not have been held by the fund for theentire period. Portfolio composition is subject to review in accordance with the fund’s investment strategy and may vary in the future.Currentand future portfolio holdings are subject to risk.
SEMIANNUAL REPORT | JOHN HANCOCK BLUE CHIP GROWTH FUND 7
JOBNAME: No Job Name PAGE: 12 SESS: 39 OUTPUT: Tue Apr 24 19:49:59 2018 SUM: AD53F2AC/qaJobz/JohnHancock/shareholder_2015/JH457BlueChipGrowth/JH457_Blue_Chip_Growth_SA
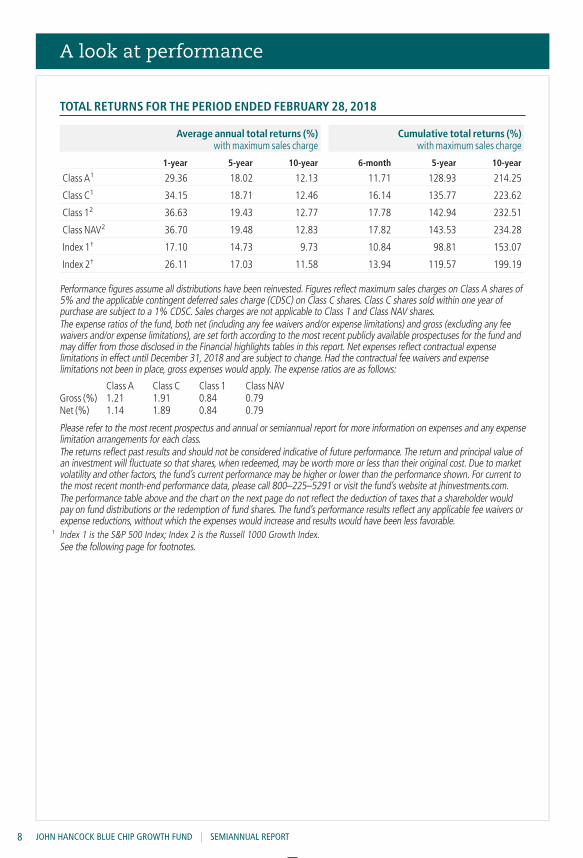
TOTAL RETURNS FOR THE PERIOD ENDED FEBRUARY 28, 2018
Average annual total returns (%)with maximum sales charge
Cumulative total returns (%)with maximum sales charge
1-year 5-year 10-year 6-month 5-year 10-year
Class A1 29.36 18.02 12.13 11.71 128.93 214.25
Class C1 34.15 18.71 12.46 16.14 135.77 223.62
Class 12 36.63 19.43 12.77 17.78 142.94 232.51
Class NAV2 36.70 19.48 12.83 17.82 143.53 234.28
Index 1† 17.10 14.73 9.73 10.84 98.81 153.07
Index 2† 26.11 17.03 11.58 13.94 119.57 199.19
Performance figures assume all distributions have been reinvested. Figures reflect maximum sales charges on Class A shares of5% and the applicable contingent deferred sales charge (CDSC) on Class C shares. Class C shares sold within one year ofpurchase are subject to a 1% CDSC. Sales charges are not applicable to Class 1 and Class NAV shares.The expense ratios of the fund, both net (including any fee waivers and/or expense limitations) and gross (excluding any feewaivers and/or expense limitations), are set forth according to the most recent publicly available prospectuses for the fund andmay differ from those disclosed in the Financial highlights tables in this report. Net expenses reflect contractual expenselimitations in effect until December 31, 2018 and are subject to change. Had the contractual fee waivers and expenselimitations not been in place, gross expenses would apply. The expense ratios are as follows:
Class A Class C Class 1 Class NAVGross (%) 1.21 1.91 0.84 0.79Net (%) 1.14 1.89 0.84 0.79
Please refer to the most recent prospectus and annual or semiannual report for more information on expenses and any expenselimitation arrangements for each class.The returns reflect past results and should not be considered indicative of future performance. The return and principal value ofan investment will fluctuate so that shares, when redeemed, may be worth more or less than their original cost. Due to marketvolatility and other factors, the fund’s current performance may be higher or lower than the performance shown. For current tothe most recent month-end performance data, please call 800–225–5291 or visit the fund’s website at jhinvestments.com.The performance table above and the chart on the next page do not reflect the deduction of taxes that a shareholder wouldpay on fund distributions or the redemption of fund shares. The fund’s performance results reflect any applicable fee waivers orexpense reductions, without which the expenses would increase and results would have been less favorable.
† Index 1 is the S&P 500 Index; Index 2 is the Russell 1000 Growth Index.See the following page for footnotes.
A look at performance
JOHN HANCOCK BLUE CHIP GROWTH FUND | SEMIANNUAL REPORT8
JOBNAME: No Job Name PAGE: 13 SESS: 39 OUTPUT: Tue Apr 24 19:49:59 2018 SUM: C341F8AE/qaJobz/JohnHancock/shareholder_2015/JH457BlueChipGrowth/JH457_Blue_Chip_Growth_SA
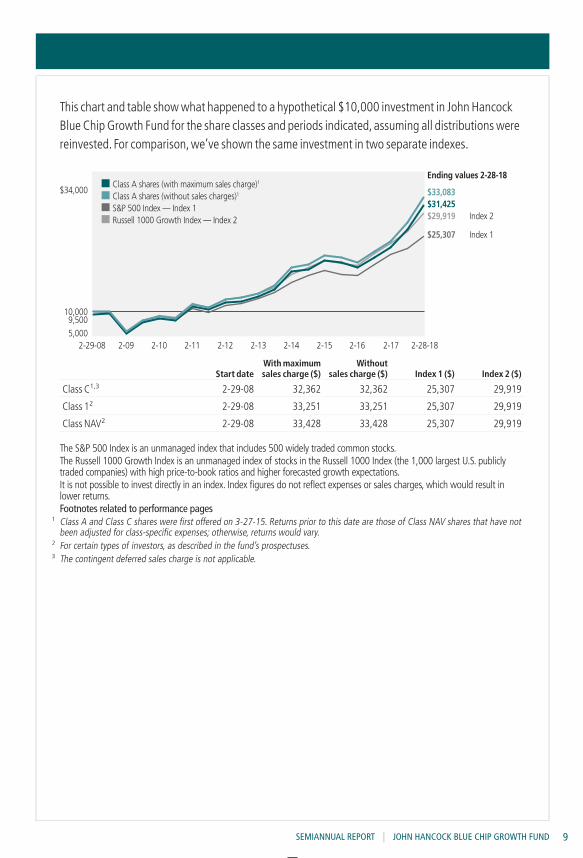
This chart and table show what happened to a hypothetical $10,000 investment in John HancockBlue Chip Growth Fund for the share classes and periods indicated, assuming all distributions werereinvested. For comparison,we’ve shown the same investment in two separate indexes.
$33,083$31,425$29,919
$25,307
Ending values 2-28-18
5,000
$34,000
Index 2
Index 1
Class A shares (with maximum sales charge)1
Class A shares (without sales charges)1
S&P 500 Index — Index 1Russell 1000 Growth Index — Index 2
10,0009,500
2-28-182-172-162-152-142-132-122-112-102-092-29-08
Start dateWith maximumsales charge ($)
Withoutsales charge ($) Index 1 ($) Index 2 ($)
Class C1,3 2-29-08 32,362 32,362 25,307 29,919
Class 12 2-29-08 33,251 33,251 25,307 29,919
Class NAV2 2-29-08 33,428 33,428 25,307 29,919
The S&P 500 Index is an unmanaged index that includes 500 widely traded common stocks.The Russell 1000 Growth Index is an unmanaged index of stocks in the Russell 1000 Index (the 1,000 largest U.S. publiclytraded companies) with high price-to-book ratios and higher forecasted growth expectations.It is not possible to invest directly in an index. Index figures do not reflect expenses or sales charges, which would result inlower returns.Footnotes related to performance pages
1 Class A and Class C shares were first offered on 3-27-15. Returns prior to this date are those of Class NAV shares that have notbeen adjusted for class-specific expenses; otherwise, returns would vary.
2 For certain types of investors, as described in the fund’s prospectuses.3 The contingent deferred sales charge is not applicable.
SEMIANNUAL REPORT | JOHN HANCOCK BLUE CHIP GROWTH FUND 9
JOBNAME: No Job Name PAGE: 14 SESS: 39 OUTPUT: Tue Apr 24 19:49:59 2018 SUM: 73D71178/qaJobz/JohnHancock/shareholder_2015/JH457BlueChipGrowth/JH457_Blue_Chip_Growth_SA
These examples are intended to help you understand your ongoing operating expenses ofinvesting in the fund so you can compare these costs with the ongoing costs of investing in othermutual funds.
Understanding fund expenses
As a shareholder of the fund, you incur two types of costs:
n Transaction costs, which include sales charges (loads) on purchases or redemptions (variesby share class), minimum account fee charge, etc.
n Ongoing operating expenses, including management fees, distribution and service fees(if applicable), and other fund expenses.
We are presenting only your ongoing operating expenses here.
Actual expenses/actual returns
The first line of each share class in the table on the following page is intended to provideinformation about the fund’s actual ongoing operating expenses, and is based on the fund’sactual return. It assumes an account value of $1,000.00 on September 1, 2017, with the sameinvestment held until February 28, 2018.
Together with the value of your account, you may use this information to estimate the operatingexpenses that you paid over the period. Simply divide your account value at February 28, 2018, by$1,000.00, then multiply it by the “expenses paid” for your share class from the table. Forexample, for an account value of $8,600.00, the operating expenses should be calculatedas follows:
Example
[ My account value / $1,000.00 = 8.6 ] x $[ “expenses paid” ] = My actual
$8,600.00 from table expenses
Hypothetical example for comparison purposes
The second line of each share class in the table on the following page allows you to compare thefund’s ongoing operating expenses with those of any other fund. It provides an example of thefund’s hypothetical account values and hypothetical expenses based on each class’s actualexpense ratio and an assumed 5% annualized return before expenses (which is not the fund’sactual return). It assumes an account value of $1,000.00 on September 1, 2017, with the sameinvestment held until February 28, 2018. Look in any other fund shareholder report to find itshypothetical example and you will be able to compare these expenses. Please remember thatthese hypothetical account values and expenses may not be used to estimate the actual endingaccount balance or expenses you paid for the period.
Remember, these examples do not include any transaction costs, therefore, these examples willnot help you to determine the relative total costs of owning different funds. If transaction costswere included, your expenses would have been higher. See the prospectuses for details regardingtransaction costs.
Your expenses
JOHN HANCOCK BLUE CHIP GROWTH FUND | SEMIANNUAL REPORT10
JOBNAME: No Job Name PAGE: 15 SESS: 39 OUTPUT: Tue Apr 24 19:49:59 2018 SUM: 04FD4A46/qaJobz/JohnHancock/shareholder_2015/JH457BlueChipGrowth/JH457_Blue_Chip_Growth_SA
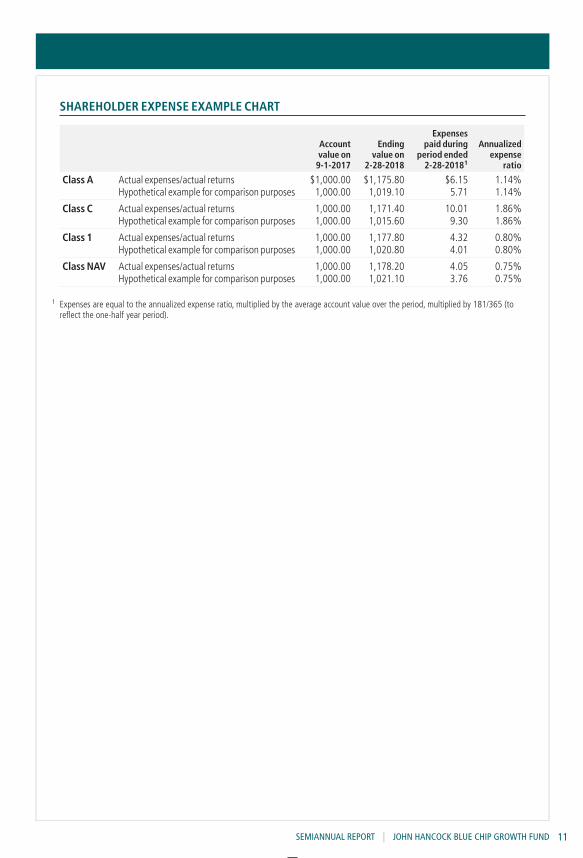
SHAREHOLDER EXPENSE EXAMPLE CHART
Accountvalue on
9-1-2017
Endingvalue on
2-28-2018
Expensespaid during
period ended2-28-20181
Annualizedexpense
ratio
Class A Actual expenses/actual returns $1,000.00 $1,175.80 $6.15 1.14%Hypothetical example for comparison purposes 1,000.00 1,019.10 5.71 1.14%
Class C Actual expenses/actual returns 1,000.00 1,171.40 10.01 1.86%Hypothetical example for comparison purposes 1,000.00 1,015.60 9.30 1.86%
Class 1 Actual expenses/actual returns 1,000.00 1,177.80 4.32 0.80%Hypothetical example for comparison purposes 1,000.00 1,020.80 4.01 0.80%
Class NAV Actual expenses/actual returns 1,000.00 1,178.20 4.05 0.75%Hypothetical example for comparison purposes 1,000.00 1,021.10 3.76 0.75%
1 Expenses are equal to the annualized expense ratio, multiplied by the average account value over the period, multiplied by 181/365 (toreflect the one-half year period).
SEMIANNUAL REPORT | JOHN HANCOCK BLUE CHIP GROWTH FUND 11
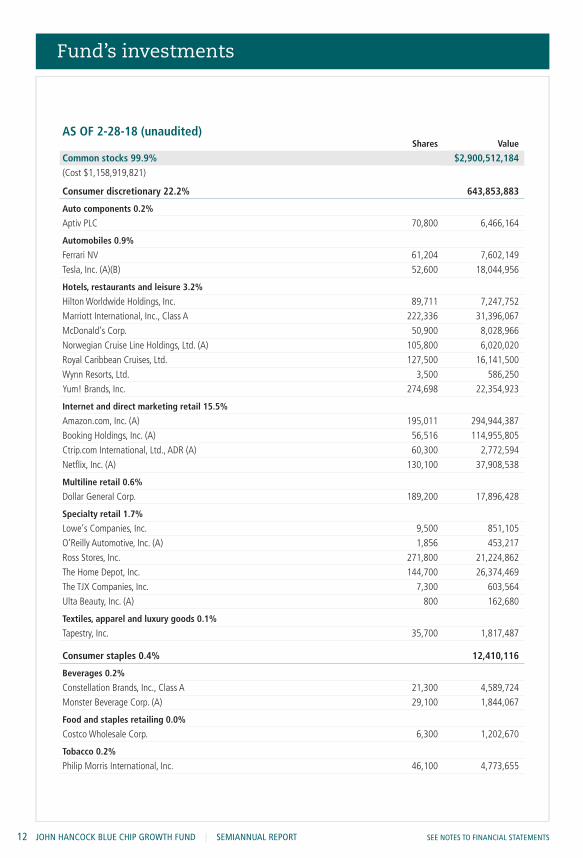
AS OF 2-28-18 (unaudited)Shares Value
Common stocks 99.9% $2,900,512,184(Cost $1,158,919,821)
Consumer discretionary 22.2% 643,853,883
Auto components 0.2%
Aptiv PLC 70,800 6,466,164
Automobiles 0.9%
Ferrari NV 61,204 7,602,149
Tesla, Inc. (A)(B) 52,600 18,044,956
Hotels, restaurants and leisure 3.2%
Hilton Worldwide Holdings, Inc. 89,711 7,247,752
Marriott International, Inc., Class A 222,336 31,396,067
McDonald’s Corp. 50,900 8,028,966
Norwegian Cruise Line Holdings, Ltd. (A) 105,800 6,020,020
Royal Caribbean Cruises, Ltd. 127,500 16,141,500
Wynn Resorts, Ltd. 3,500 586,250
Yum! Brands, Inc. 274,698 22,354,923
Internet and direct marketing retail 15.5%
Amazon.com, Inc. (A) 195,011 294,944,387
Booking Holdings, Inc. (A) 56,516 114,955,805
Ctrip.com International, Ltd., ADR (A) 60,300 2,772,594
Netflix, Inc. (A) 130,100 37,908,538
Multiline retail 0.6%
Dollar General Corp. 189,200 17,896,428
Specialty retail 1.7%
Lowe’s Companies, Inc. 9,500 851,105
O’Reilly Automotive, Inc. (A) 1,856 453,217
Ross Stores, Inc. 271,800 21,224,862
The Home Depot, Inc. 144,700 26,374,469
The TJX Companies, Inc. 7,300 603,564
Ulta Beauty, Inc. (A) 800 162,680
Textiles, apparel and luxury goods 0.1%
Tapestry, Inc. 35,700 1,817,487
Consumer staples 0.4% 12,410,116
Beverages 0.2%
Constellation Brands, Inc., Class A 21,300 4,589,724
Monster Beverage Corp. (A) 29,100 1,844,067
Food and staples retailing 0.0%
Costco Wholesale Corp. 6,300 1,202,670
Tobacco 0.2%
Philip Morris International, Inc. 46,100 4,773,655
Fund’s investments
12 JOHN HANCOCK BLUE CHIP GROWTH FUND | SEMIANNUAL REPORT SEE NOTES TO FINANCIAL STATEMENTS
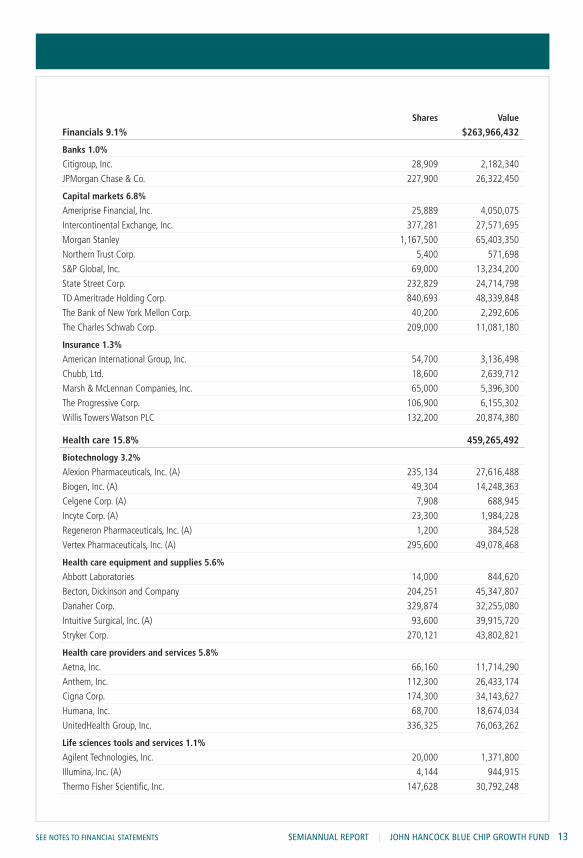
Shares Value
Financials 9.1% $263,966,432
Banks 1.0%
Citigroup, Inc. 28,909 2,182,340
JPMorgan Chase & Co. 227,900 26,322,450
Capital markets 6.8%
Ameriprise Financial, Inc. 25,889 4,050,075
Intercontinental Exchange, Inc. 377,281 27,571,695
Morgan Stanley 1,167,500 65,403,350
Northern Trust Corp. 5,400 571,698
S&P Global, Inc. 69,000 13,234,200
State Street Corp. 232,829 24,714,798
TD Ameritrade Holding Corp. 840,693 48,339,848
The Bank of New York Mellon Corp. 40,200 2,292,606
The Charles Schwab Corp. 209,000 11,081,180
Insurance 1.3%
American International Group, Inc. 54,700 3,136,498
Chubb, Ltd. 18,600 2,639,712
Marsh & McLennan Companies, Inc. 65,000 5,396,300
The Progressive Corp. 106,900 6,155,302
Willis Towers Watson PLC 132,200 20,874,380
Health care 15.8% 459,265,492
Biotechnology 3.2%
Alexion Pharmaceuticals, Inc. (A) 235,134 27,616,488
Biogen, Inc. (A) 49,304 14,248,363
Celgene Corp. (A) 7,908 688,945
Incyte Corp. (A) 23,300 1,984,228
Regeneron Pharmaceuticals, Inc. (A) 1,200 384,528
Vertex Pharmaceuticals, Inc. (A) 295,600 49,078,468
Health care equipment and supplies 5.6%
Abbott Laboratories 14,000 844,620
Becton, Dickinson and Company 204,251 45,347,807
Danaher Corp. 329,874 32,255,080
Intuitive Surgical, Inc. (A) 93,600 39,915,720
Stryker Corp. 270,121 43,802,821
Health care providers and services 5.8%
Aetna, Inc. 66,160 11,714,290
Anthem, Inc. 112,300 26,433,174
Cigna Corp. 174,300 34,143,627
Humana, Inc. 68,700 18,674,034
UnitedHealth Group, Inc. 336,325 76,063,262
Life sciences tools and services 1.1%
Agilent Technologies, Inc. 20,000 1,371,800
Illumina, Inc. (A) 4,144 944,915
Thermo Fisher Scientific, Inc. 147,628 30,792,248
SEE NOTES TO FINANCIAL STATEMENTS SEMIANNUAL REPORT | JOHN HANCOCK BLUE CHIP GROWTH FUND 13
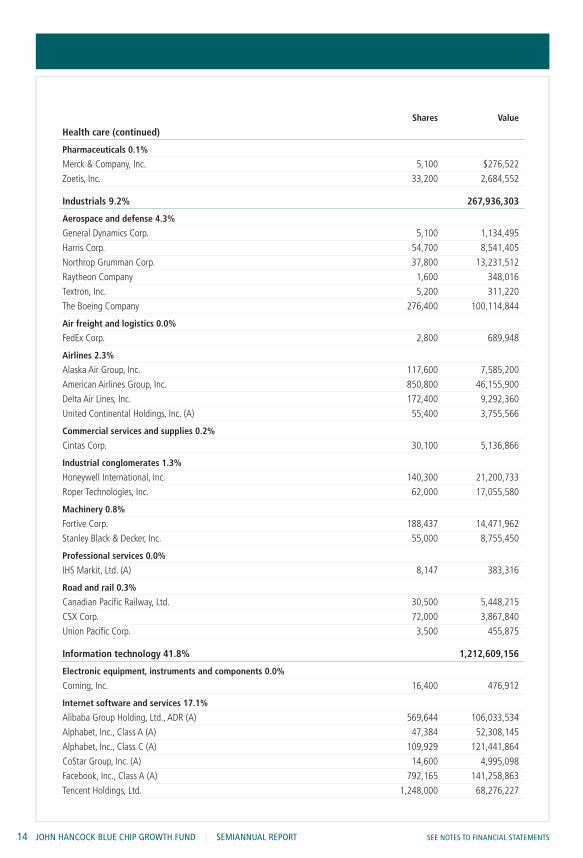
Shares Value
Health care (continued)
Pharmaceuticals 0.1%
Merck & Company, Inc. 5,100 $276,522
Zoetis, Inc. 33,200 2,684,552
Industrials 9.2% 267,936,303
Aerospace and defense 4.3%
General Dynamics Corp. 5,100 1,134,495
Harris Corp. 54,700 8,541,405
Northrop Grumman Corp. 37,800 13,231,512
Raytheon Company 1,600 348,016
Textron, Inc. 5,200 311,220
The Boeing Company 276,400 100,114,844
Air freight and logistics 0.0%
FedEx Corp. 2,800 689,948
Airlines 2.3%
Alaska Air Group, Inc. 117,600 7,585,200
American Airlines Group, Inc. 850,800 46,155,900
Delta Air Lines, Inc. 172,400 9,292,360
United Continental Holdings, Inc. (A) 55,400 3,755,566
Commercial services and supplies 0.2%
Cintas Corp. 30,100 5,136,866
Industrial conglomerates 1.3%
Honeywell International, Inc. 140,300 21,200,733
Roper Technologies, Inc. 62,000 17,055,580
Machinery 0.8%
Fortive Corp. 188,437 14,471,962
Stanley Black & Decker, Inc. 55,000 8,755,450
Professional services 0.0%
IHS Markit, Ltd. (A) 8,147 383,316
Road and rail 0.3%
Canadian Pacific Railway, Ltd. 30,500 5,448,215
CSX Corp. 72,000 3,867,840
Union Pacific Corp. 3,500 455,875
Information technology 41.8% 1,212,609,156
Electronic equipment, instruments and components 0.0%
Corning, Inc. 16,400 476,912
Internet software and services 17.1%
Alibaba Group Holding, Ltd., ADR (A) 569,644 106,033,534
Alphabet, Inc., Class A (A) 47,384 52,308,145
Alphabet, Inc., Class C (A) 109,929 121,441,864
CoStar Group, Inc. (A) 14,600 4,995,098
Facebook, Inc., Class A (A) 792,165 141,258,863
Tencent Holdings, Ltd. 1,248,000 68,276,227
14 JOHN HANCOCK BLUE CHIP GROWTH FUND | SEMIANNUAL REPORT SEE NOTES TO FINANCIAL STATEMENTS
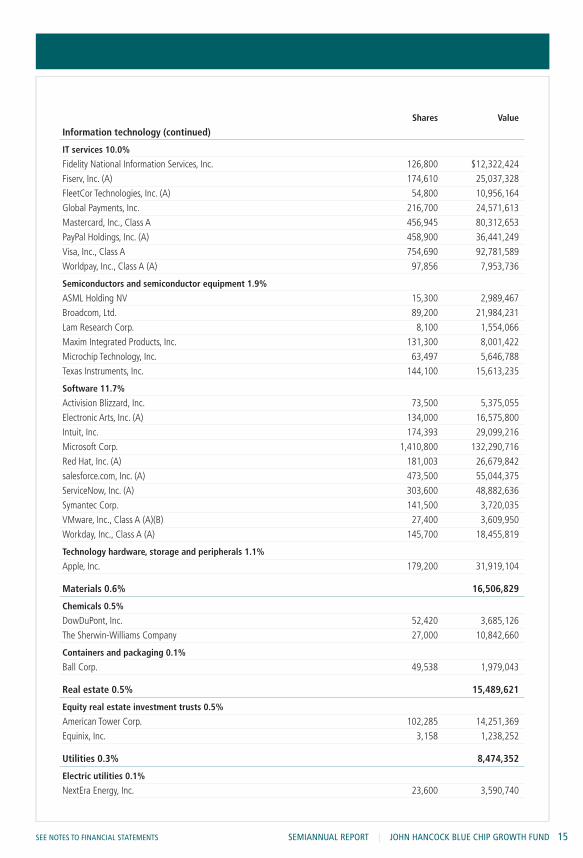
Shares Value
Information technology (continued)
IT services 10.0%
Fidelity National Information Services, Inc. 126,800 $12,322,424
Fiserv, Inc. (A) 174,610 25,037,328
FleetCor Technologies, Inc. (A) 54,800 10,956,164
Global Payments, Inc. 216,700 24,571,613
Mastercard, Inc., Class A 456,945 80,312,653
PayPal Holdings, Inc. (A) 458,900 36,441,249
Visa, Inc., Class A 754,690 92,781,589
Worldpay, Inc., Class A (A) 97,856 7,953,736
Semiconductors and semiconductor equipment 1.9%
ASML Holding NV 15,300 2,989,467
Broadcom, Ltd. 89,200 21,984,231
Lam Research Corp. 8,100 1,554,066
Maxim Integrated Products, Inc. 131,300 8,001,422
Microchip Technology, Inc. 63,497 5,646,788
Texas Instruments, Inc. 144,100 15,613,235
Software 11.7%
Activision Blizzard, Inc. 73,500 5,375,055
Electronic Arts, Inc. (A) 134,000 16,575,800
Intuit, Inc. 174,393 29,099,216
Microsoft Corp. 1,410,800 132,290,716
Red Hat, Inc. (A) 181,003 26,679,842
salesforce.com, Inc. (A) 473,500 55,044,375
ServiceNow, Inc. (A) 303,600 48,882,636
Symantec Corp. 141,500 3,720,035
VMware, Inc., Class A (A)(B) 27,400 3,609,950
Workday, Inc., Class A (A) 145,700 18,455,819
Technology hardware, storage and peripherals 1.1%
Apple, Inc. 179,200 31,919,104
Materials 0.6% 16,506,829
Chemicals 0.5%
DowDuPont, Inc. 52,420 3,685,126
The Sherwin-Williams Company 27,000 10,842,660
Containers and packaging 0.1%
Ball Corp. 49,538 1,979,043
Real estate 0.5% 15,489,621
Equity real estate investment trusts 0.5%
American Tower Corp. 102,285 14,251,369
Equinix, Inc. 3,158 1,238,252
Utilities 0.3% 8,474,352
Electric utilities 0.1%
NextEra Energy, Inc. 23,600 3,590,740
SEE NOTES TO FINANCIAL STATEMENTS SEMIANNUAL REPORT | JOHN HANCOCK BLUE CHIP GROWTH FUND 15
Shares Value
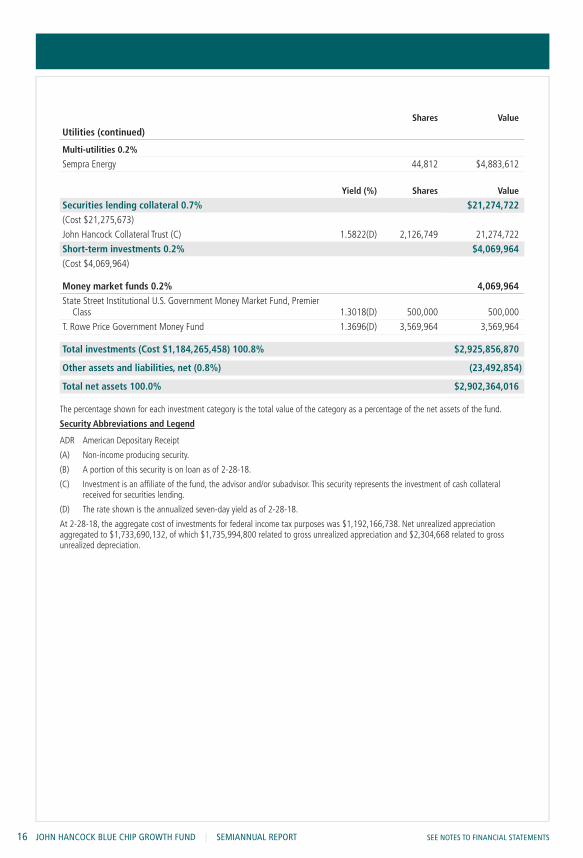
Utilities (continued)
Multi-utilities 0.2%
Sempra Energy 44,812 $4,883,612
Yield (%) Shares Value
Securities lending collateral 0.7% $21,274,722(Cost $21,275,673)
John Hancock Collateral Trust (C) 1.5822(D) 2,126,749 21,274,722
Short-term investments 0.2% $4,069,964(Cost $4,069,964)
Money market funds 0.2% 4,069,964State Street Institutional U.S. Government Money Market Fund, Premier
Class 1.3018(D) 500,000 500,000
T. Rowe Price Government Money Fund 1.3696(D) 3,569,964 3,569,964
Total investments (Cost $1,184,265,458) 100.8% $2,925,856,870
Other assets and liabilities, net (0.8%) (23,492,854)
Total net assets 100.0% $2,902,364,016
The percentage shown for each investment category is the total value of the category as a percentage of the net assets of the fund.
Security Abbreviations and Legend
ADR American Depositary Receipt
(A) Non-income producing security.
(B) A portion of this security is on loan as of 2-28-18.
(C) Investment is an affiliate of the fund, the advisor and/or subadvisor. This security represents the investment of cash collateralreceived for securities lending.
(D) The rate shown is the annualized seven-day yield as of 2-28-18.
At 2-28-18, the aggregate cost of investments for federal income tax purposes was $1,192,166,738. Net unrealized appreciationaggregated to $1,733,690,132, of which $1,735,994,800 related to gross unrealized appreciation and $2,304,668 related to grossunrealized depreciation.
16 JOHN HANCOCK BLUE CHIP GROWTH FUND | SEMIANNUAL REPORT SEE NOTES TO FINANCIAL STATEMENTS
JOBNAME: No Job Name PAGE: 17 SESS: 39 OUTPUT: Tue Apr 24 19:49:59 2018 SUM: 2B8D74EC/qaJobz/JohnHancock/shareholder_2015/JH457BlueChipGrowth/JH457_Blue_Chip_Growth_SA
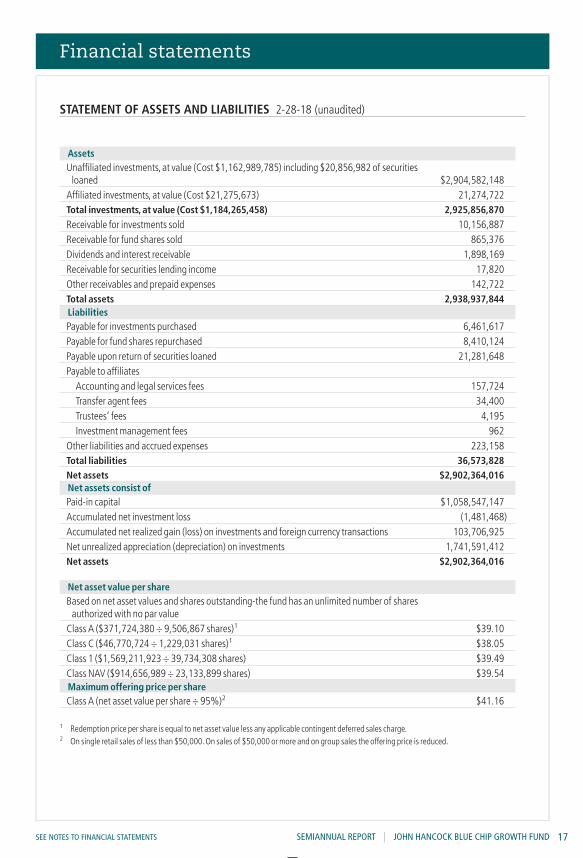
AssetsUnaffiliated investments, at value (Cost $1,162,989,785) including $20,856,982 of securities
loaned $2,904,582,148Affiliated investments, at value (Cost $21,275,673) 21,274,722Total investments, at value (Cost $1,184,265,458) 2,925,856,870
Receivable for investments sold 10,156,887Receivable for fund shares sold 865,376Dividends and interest receivable 1,898,169Receivable for securities lending income 17,820Other receivables and prepaid expenses 142,722Total assets 2,938,937,844LiabilitiesPayable for investments purchased 6,461,617Payable for fund shares repurchased 8,410,124Payable upon return of securities loaned 21,281,648Payable to affiliates
Accounting and legal services fees 157,724Transfer agent fees 34,400Trustees’ fees 4,195Investment management fees 962
Other liabilities and accrued expenses 223,158Total liabilities 36,573,828Net assets $2,902,364,016Net assets consist ofPaid-in capital $1,058,547,147Accumulated net investment loss (1,481,468)Accumulated net realized gain (loss) on investments and foreign currency transactions 103,706,925Net unrealized appreciation (depreciation) on investments 1,741,591,412Net assets $2,902,364,016
Net asset value per shareBased on net asset values and shares outstanding-the fund has an unlimited number of shares
authorized with no par valueClass A ($371,724,380 ÷ 9,506,867 shares)1 $39.10Class C ($46,770,724 ÷ 1,229,031 shares)1 $38.05Class 1 ($1,569,211,923 ÷ 39,734,308 shares) $39.49Class NAV ($914,656,989 ÷ 23,133,899 shares) $39.54Maximum offering price per shareClass A (net asset value per share ÷ 95%)2 $41.16
1 Redemption price per share is equal to net asset value less any applicable contingent deferred sales charge.2 On single retail sales of less than $50,000.On sales of $50,000 or more and on group sales the offering price is reduced.
Financial statements
STATEMENT OF ASSETS AND LIABILITIES 2-28-18 (unaudited)
SEE NOTES TO FINANCIAL STATEMENTS SEMIANNUAL REPORT | JOHN HANCOCK BLUE CHIP GROWTH FUND 17
JOBNAME: No Job Name PAGE: 18 SESS: 39 OUTPUT: Tue Apr 24 19:49:59 2018 SUM: C0E86BC2/qaJobz/JohnHancock/shareholder_2015/JH457BlueChipGrowth/JH457_Blue_Chip_Growth_SA
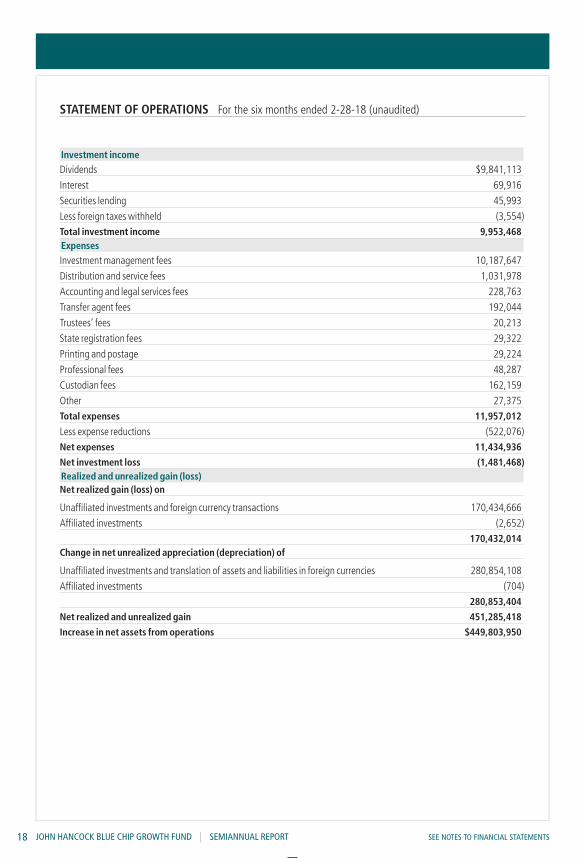
Investment income
Dividends $9,841,113
Interest 69,916
Securities lending 45,993
Less foreign taxes withheld (3,554)Total investment income 9,953,468Expenses
Investment management fees 10,187,647
Distribution and service fees 1,031,978
Accounting and legal services fees 228,763
Transfer agent fees 192,044
Trustees’ fees 20,213
State registration fees 29,322
Printing and postage 29,224
Professional fees 48,287
Custodian fees 162,159
Other 27,375Total expenses 11,957,012
Less expense reductions (522,076)Net expenses 11,434,936
Net investment loss (1,481,468)Realized and unrealized gain (loss)Net realized gain (loss) on
Unaffiliated investments and foreign currency transactions 170,434,666
Affiliated investments (2,652)170,432,014
Change in net unrealized appreciation (depreciation) of
Unaffiliated investments and translation of assets and liabilities in foreign currencies 280,854,108
Affiliated investments (704)280,853,404
Net realized and unrealized gain 451,285,418
Increase in net assets from operations $449,803,950
STATEMENT OF OPERATIONS For the six months ended 2-28-18 (unaudited)
JOHN HANCOCK BLUE CHIP GROWTH FUND | SEMIANNUAL REPORT SEE NOTES TO FINANCIAL STATEMENTS18
JOBNAME: No Job Name PAGE: 19 SESS: 39 OUTPUT: Tue Apr 24 19:49:59 2018 SUM: 6D8E319F/qaJobz/JohnHancock/shareholder_2015/JH457BlueChipGrowth/JH457_Blue_Chip_Growth_SA
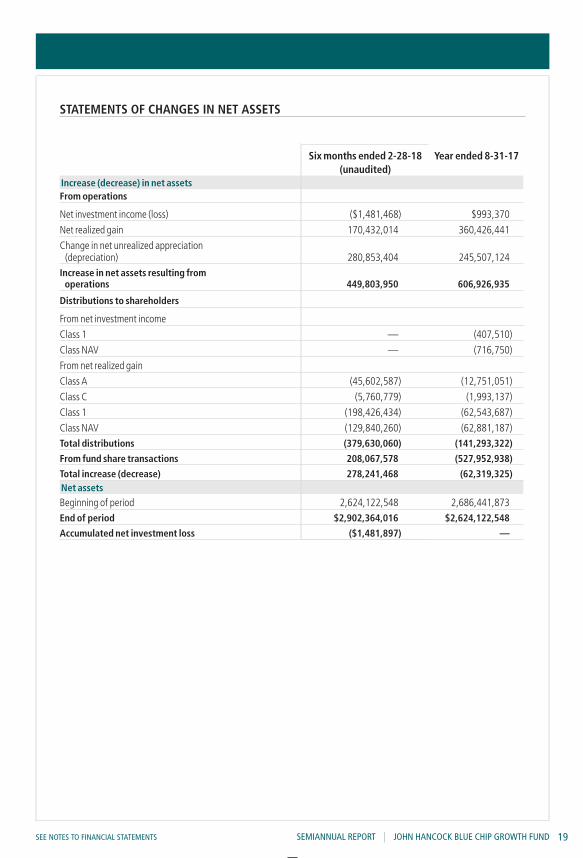
Six months ended 2-28-18 Year ended 8-31-17(unaudited)
Increase (decrease) in net assetsFrom operations
Net investment income (loss) ($1,481,468) $993,370
Net realized gain 170,432,014 360,426,441
Change in net unrealized appreciation(depreciation) 280,853,404 245,507,124
Increase in net assets resulting fromoperations 449,803,950 606,926,935
Distributions to shareholders
From net investment income
Class 1 — (407,510)
Class NAV — (716,750)
From net realized gain
Class A (45,602,587) (12,751,051)
Class C (5,760,779) (1,993,137)
Class 1 (198,426,434) (62,543,687)
Class NAV (129,840,260) (62,881,187)Total distributions (379,630,060) (141,293,322)
From fund share transactions 208,067,578 (527,952,938)
Total increase (decrease) 278,241,468 (62,319,325)Net assets
Beginning of period 2,624,122,548 2,686,441,873End of period $2,902,364,016 $2,624,122,548
Accumulated net investment loss ($1,481,897) —
STATEMENTS OF CHANGES IN NET ASSETS
SEE NOTES TO FINANCIAL STATEMENTS SEMIANNUAL REPORT | JOHN HANCOCK BLUE CHIP GROWTH FUND 19
JOBNAME: No Job Name PAGE: 20 SESS: 39 OUTPUT: Tue Apr 24 19:49:59 2018 SUM: 0ED9480A/qaJobz/JohnHancock/shareholder_2015/JH457BlueChipGrowth/JH457_Blue_Chip_Growth_SA
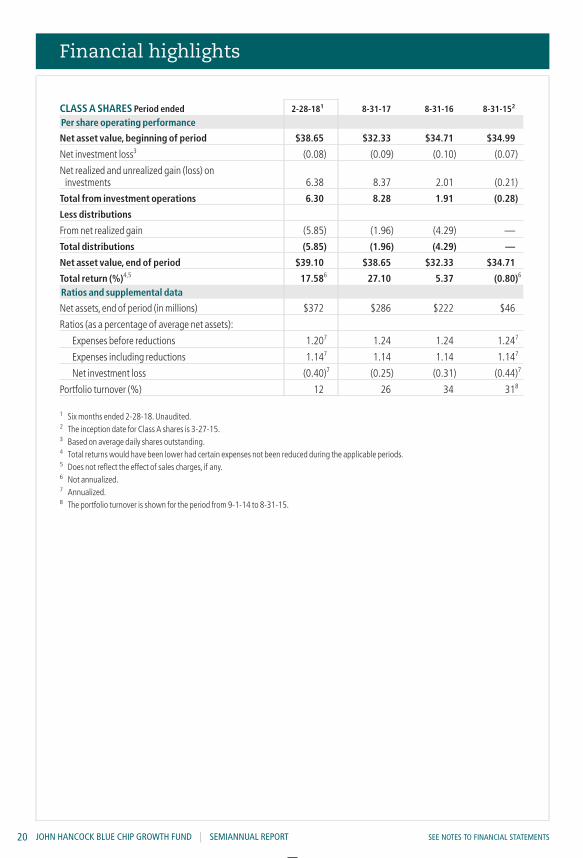
CLASS A SHARES Period ended 2-28-181 8-31-17 8-31-16 8-31-152
Per share operating performance
Net asset value, beginning of period $38.65 $32.33 $34.71 $34.99
Net investment loss3 (0.08) (0.09) (0.10) (0.07)
Net realized and unrealized gain (loss) oninvestments 6.38 8.37 2.01 (0.21)
Total from investment operations 6.30 8.28 1.91 (0.28)
Less distributions
From net realized gain (5.85) (1.96) (4.29) —
Total distributions (5.85) (1.96) (4.29) —
Net asset value, end of period $39.10 $38.65 $32.33 $34.71
Total return (%)4,5 17.586 27.10 5.37 (0.80)6
Ratios and supplemental data
Net assets, end of period (in millions) $372 $286 $222 $46
Ratios (as a percentage of average net assets):
Expenses before reductions 1.207 1.24 1.24 1.247
Expenses including reductions 1.147 1.14 1.14 1.147
Net investment loss (0.40)7 (0.25) (0.31) (0.44)7
Portfolio turnover (%) 12 26 34 318
1 Six months ended 2-28-18.Unaudited.2 The inception date for Class A shares is 3-27-15.3 Based on average daily shares outstanding.4 Total returns would have been lower had certain expenses not been reduced during the applicable periods.5 Does not reflect the effect of sales charges, if any.6 Not annualized.7 Annualized.8 The portfolio turnover is shown for the period from 9-1-14 to 8-31-15.
Financial highlights
JOHN HANCOCK BLUE CHIP GROWTH FUND | SEMIANNUAL REPORT SEE NOTES TO FINANCIAL STATEMENTS20
JOBNAME: No Job Name PAGE: 21 SESS: 39 OUTPUT: Tue Apr 24 19:49:59 2018 SUM: 0A94CF03/qaJobz/JohnHancock/shareholder_2015/JH457BlueChipGrowth/JH457_Blue_Chip_Growth_SA
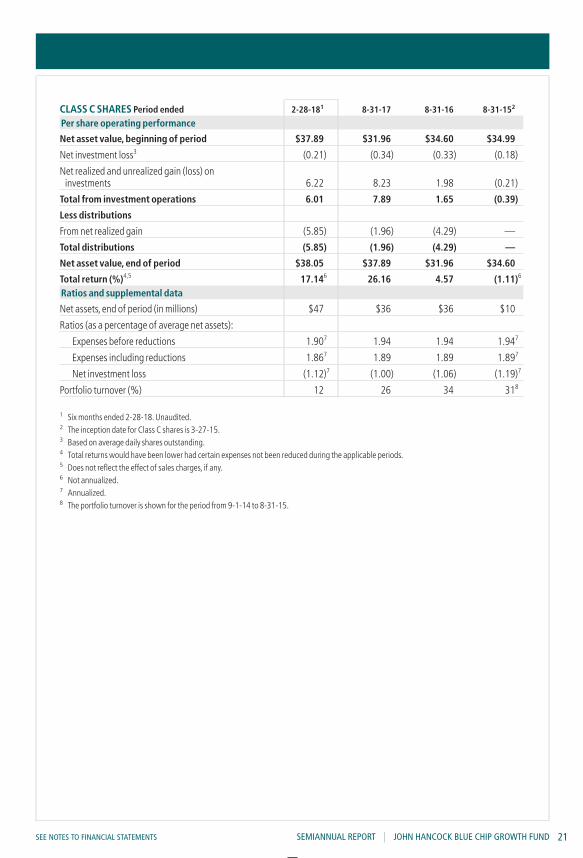
CLASS C SHARES Period ended 2-28-181 8-31-17 8-31-16 8-31-152
Per share operating performance
Net asset value, beginning of period $37.89 $31.96 $34.60 $34.99
Net investment loss3 (0.21) (0.34) (0.33) (0.18)
Net realized and unrealized gain (loss) oninvestments 6.22 8.23 1.98 (0.21)
Total from investment operations 6.01 7.89 1.65 (0.39)
Less distributions
From net realized gain (5.85) (1.96) (4.29) —
Total distributions (5.85) (1.96) (4.29) —
Net asset value, end of period $38.05 $37.89 $31.96 $34.60
Total return (%)4,5 17.146 26.16 4.57 (1.11)6
Ratios and supplemental data
Net assets, end of period (in millions) $47 $36 $36 $10
Ratios (as a percentage of average net assets):
Expenses before reductions 1.907 1.94 1.94 1.947
Expenses including reductions 1.867 1.89 1.89 1.897
Net investment loss (1.12)7 (1.00) (1.06) (1.19)7
Portfolio turnover (%) 12 26 34 318
1 Six months ended 2-28-18.Unaudited.2 The inception date for Class C shares is 3-27-15.3 Based on average daily shares outstanding.4 Total returns would have been lower had certain expenses not been reduced during the applicable periods.5 Does not reflect the effect of sales charges, if any.6 Not annualized.7 Annualized.8 The portfolio turnover is shown for the period from 9-1-14 to 8-31-15.
SEE NOTES TO FINANCIAL STATEMENTS SEMIANNUAL REPORT | JOHN HANCOCK BLUE CHIP GROWTH FUND 21
JOBNAME: No Job Name PAGE: 22 SESS: 39 OUTPUT: Tue Apr 24 19:49:59 2018 SUM: 66D284CC/qaJobz/JohnHancock/shareholder_2015/JH457BlueChipGrowth/JH457_Blue_Chip_Growth_SA
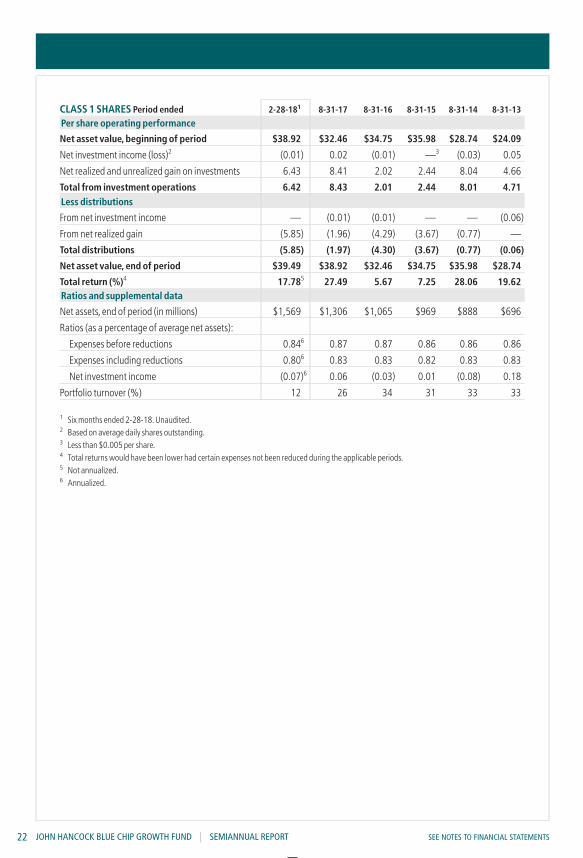
CLASS 1 SHARES Period ended 2-28-181 8-31-17 8-31-16 8-31-15 8-31-14 8-31-13
Per share operating performance
Net asset value, beginning of period $38.92 $32.46 $34.75 $35.98 $28.74 $24.09
Net investment income (loss)2 (0.01) 0.02 (0.01) —3 (0.03) 0.05
Net realized and unrealized gain on investments 6.43 8.41 2.02 2.44 8.04 4.66
Total from investment operations 6.42 8.43 2.01 2.44 8.01 4.71Less distributions
From net investment income — (0.01) (0.01) — — (0.06)
From net realized gain (5.85) (1.96) (4.29) (3.67) (0.77) —
Total distributions (5.85) (1.97) (4.30) (3.67) (0.77) (0.06)
Net asset value, end of period $39.49 $38.92 $32.46 $34.75 $35.98 $28.74
Total return (%)4 17.785 27.49 5.67 7.25 28.06 19.62Ratios and supplemental data
Net assets, end of period (in millions) $1,569 $1,306 $1,065 $969 $888 $696
Ratios (as a percentage of average net assets):
Expenses before reductions 0.846 0.87 0.87 0.86 0.86 0.86
Expenses including reductions 0.806 0.83 0.83 0.82 0.83 0.83
Net investment income (0.07)6 0.06 (0.03) 0.01 (0.08) 0.18
Portfolio turnover (%) 12 26 34 31 33 33
1 Six months ended 2-28-18.Unaudited.2 Based on average daily shares outstanding.3 Less than $0.005 per share.4 Total returns would have been lower had certain expenses not been reduced during the applicable periods.5 Not annualized.6 Annualized.
JOHN HANCOCK BLUE CHIP GROWTH FUND | SEMIANNUAL REPORT SEE NOTES TO FINANCIAL STATEMENTS22
JOBNAME: No Job Name PAGE: 23 SESS: 39 OUTPUT: Tue Apr 24 19:49:59 2018 SUM: 5DFF1850/qaJobz/JohnHancock/shareholder_2015/JH457BlueChipGrowth/JH457_Blue_Chip_Growth_SA
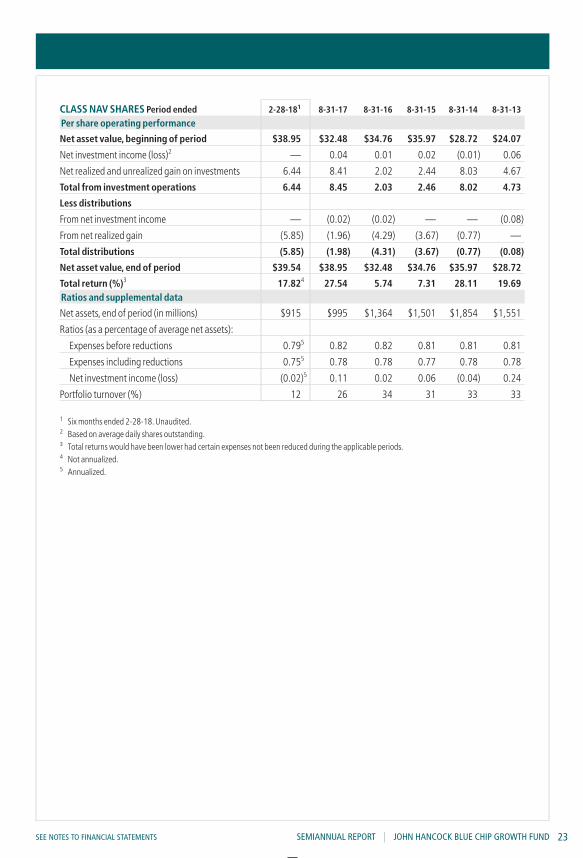
CLASS NAV SHARES Period ended 2-28-181 8-31-17 8-31-16 8-31-15 8-31-14 8-31-13
Per share operating performance
Net asset value, beginning of period $38.95 $32.48 $34.76 $35.97 $28.72 $24.07
Net investment income (loss)2 — 0.04 0.01 0.02 (0.01) 0.06
Net realized and unrealized gain on investments 6.44 8.41 2.02 2.44 8.03 4.67
Total from investment operations 6.44 8.45 2.03 2.46 8.02 4.73
Less distributions
From net investment income — (0.02) (0.02) — — (0.08)
From net realized gain (5.85) (1.96) (4.29) (3.67) (0.77) —
Total distributions (5.85) (1.98) (4.31) (3.67) (0.77) (0.08)
Net asset value, end of period $39.54 $38.95 $32.48 $34.76 $35.97 $28.72
Total return (%)3 17.824 27.54 5.74 7.31 28.11 19.69Ratios and supplemental data
Net assets, end of period (in millions) $915 $995 $1,364 $1,501 $1,854 $1,551
Ratios (as a percentage of average net assets):
Expenses before reductions 0.795 0.82 0.82 0.81 0.81 0.81
Expenses including reductions 0.755 0.78 0.78 0.77 0.78 0.78
Net investment income (loss) (0.02)5 0.11 0.02 0.06 (0.04) 0.24
Portfolio turnover (%) 12 26 34 31 33 33
1 Six months ended 2-28-18.Unaudited.2 Based on average daily shares outstanding.3 Total returns would have been lower had certain expenses not been reduced during the applicable periods.4 Not annualized.5 Annualized.
SEE NOTES TO FINANCIAL STATEMENTS SEMIANNUAL REPORT | JOHN HANCOCK BLUE CHIP GROWTH FUND 23
JOBNAME: No Job Name PAGE: 24 SESS: 39 OUTPUT: Tue Apr 24 19:49:59 2018 SUM: 84932602/qaJobz/JohnHancock/shareholder_2015/JH457BlueChipGrowth/JH457_Blue_Chip_Growth_SA
Note 1 — OrganizationJohn Hancock Blue Chip Growth Fund (the fund) is a series of John Hancock Funds II (the Trust), an open-end managementinvestment company organized as a Massachusetts business trust and registered under the Investment Company Act of1940,as amended (the 1940 Act). The investment objective of the fund is to provide long-term growth of capital.Currentincome is a secondary objective.
The fund may offer multiple classes of shares. The shares currently offered are detailed in the Statement of assets andliabilities.Class A and Class C shares are offered to all investors.Class 1 shares are offered only to certain affiliates ofManulife Financial Corporation (MFC).Class NAV shares are offered to John Hancock affiliated funds of funds, retirementplans for employees of John Hancock and/or MFC,and certain 529 plans. Shareholders of each class have exclusive votingrights to matters that affect that class. The distribution and service fees, if any, and transfer agent fees for each classmay differ.
Note 2 — Significant accounting policiesThe financial statements have been prepared in conformity with accounting principles generally accepted in the UnitedStates of America (US GAAP),which require management to make certain estimates and assumptions as of the date of thefinancial statements.Actual results could differ from those estimates and those differences could be significant. The fundqualifies as an investment company under Topic 946 of Accounting Standards Codification of US GAAP.
Events or transactions occurring after the end of the fiscal period through the date that the financial statements were issuedhave been evaluated in the preparation of the financial statements. The following summarizes the significant accountingpolicies of the fund:
Security valuation. Investments are stated at value as of the scheduled close of regular trading on the New York StockExchange (NYSE), normally at 4:00 P.M., Eastern Time. In case of emergency or other disruption resulting in the NYSE notopening for trading or the NYSE closing at a time other than the regularly scheduled close, the net asset value (NAV) may bedetermined as of the regularly scheduled close of the NYSE pursuant to the fund’s Valuation Policies and Procedures.
In order to value the securities, the fund uses the following valuation techniques: Equity securities held by the fund aretypically valued at the last sale price or official closing price on the exchange or principal market where the security trades. Inthe event there were no sales during the day or closing prices are not available, the securities are valued using the lastavailable bid price. Investments by the fund in open-end mutual funds, including John Hancock Collateral Trust (JHCT), arevalued at their respective NAVs each business day. Foreign securities and currencies are valued in U.S. dollars based onforeign currency exchange rates supplied by an independent pricing vendor.
In certain instances, the Pricing Committee may determine to value equity securities using prices obtained from anotherexchange or market if trading on the exchange or market on which prices are typically obtained did not open for trading asscheduled,or if trading closed earlier than scheduled, and trading occurred as normal on another exchange or market.
Other portfolio securities and assets, for which reliable market quotations are not readily available, are valued at fair value asdetermined in good faith by the fund’s Pricing Committee following procedures established by the Board of Trustees. Thefrequency with which these fair valuation procedures are used cannot be predicted and fair value of securities may differsignificantly from the value that would have been used had a ready market for such securities existed. Trading in foreignsecurities may be completed before the scheduled daily close of trading on the NYSE. Significant events at the issuer ormarket level may affect the values of securities between the time when the valuation of the securities is generally determinedand the close of the NYSE. If a significant event occurs, these securities may be fair valued, as determined in good faith by thefund’s Pricing Committee, following procedures established by the Board of Trustees. The fund uses fair value adjustmentfactors provided by an independent pricing vendor to value certain foreign securities in order to adjust for events that mayoccur between the close of foreign exchanges or markets and the close of the NYSE.
The fund uses a three-tier hierarchy to prioritize the pricing assumptions, referred to as inputs, used in valuation techniques tomeasure fair value. Level 1 includes securities valued using quoted prices in active markets for identical securities. Level 2
Notes to financial statements (unaudited)
JOHN HANCOCK BLUE CHIP GROWTH FUND | SEMIANNUAL REPORT24
JOBNAME: No Job Name PAGE: 25 SESS: 39 OUTPUT: Tue Apr 24 19:49:59 2018 SUM: D156FE4A/qaJobz/JohnHancock/shareholder_2015/JH457BlueChipGrowth/JH457_Blue_Chip_Growth_SA
includes securities valued using other significant observable inputs.Observable inputs may include quoted prices for similarsecurities, interest rates, prepayment speeds and credit risk. Prices for securities valued using these inputs are received fromindependent pricing vendors and brokers and are based on an evaluation of the inputs described. Level 3 includes securitiesvalued using significant unobservable inputs when market prices are not readily available or reliable, including the fund’sown assumptions in determining the fair value of investments. Factors used in determining value may include market orissuer specific events or trends, changes in interest rates and credit quality. The inputs or methodology used for valuingsecurities are not necessarily an indication of the risks associated with investing in those securities.Changes in valuationtechniques and related inputs may result in transfers into or out of an assigned level within the disclosure hierarchy.
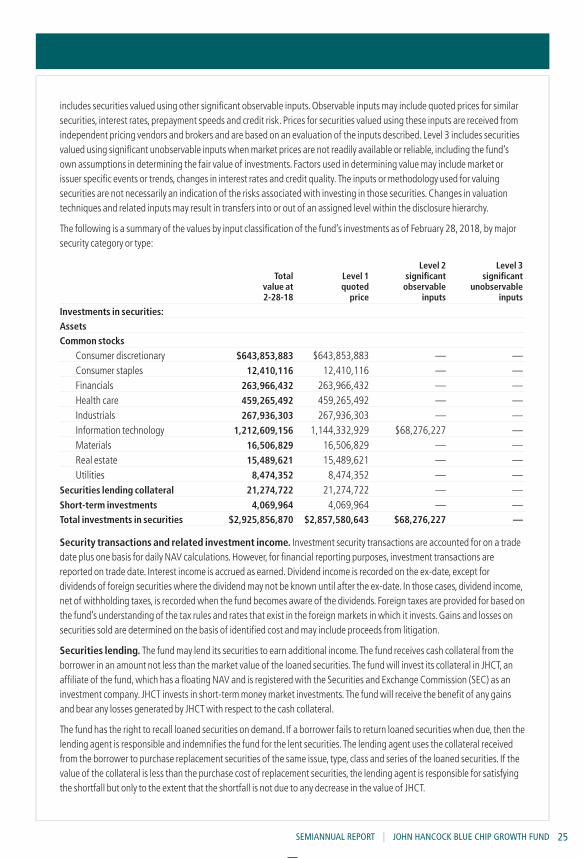
The following is a summary of the values by input classification of the fund’s investments as of February 28,2018, by majorsecurity category or type:
Totalvalue at2-28-18
Level 1quoted
price
Level 2significantobservable
inputs
Level 3significant
unobservableinputs
Investments in securities:AssetsCommon stocks
Consumer discretionary $643,853,883 $643,853,883 — —Consumer staples 12,410,116 12,410,116 — —Financials 263,966,432 263,966,432 — —Health care 459,265,492 459,265,492 — —Industrials 267,936,303 267,936,303 — —Information technology 1,212,609,156 1,144,332,929 $68,276,227 —Materials 16,506,829 16,506,829 — —Real estate 15,489,621 15,489,621 — —Utilities 8,474,352 8,474,352 — —
Securities lending collateral 21,274,722 21,274,722 — —Short-term investments 4,069,964 4,069,964 — —Total investments in securities $2,925,856,870 $2,857,580,643 $68,276,227 —
Security transactions and related investment income. Investment security transactions are accounted for on a tradedate plus one basis for daily NAV calculations.However, for financial reporting purposes, investment transactions arereported on trade date. Interest income is accrued as earned.Dividend income is recorded on the ex-date, except fordividends of foreign securities where the dividend may not be known until after the ex-date. In those cases, dividend income,net of withholding taxes, is recorded when the fund becomes aware of the dividends. Foreign taxes are provided for based onthe fund’s understanding of the tax rules and rates that exist in the foreign markets in which it invests.Gains and losses onsecurities sold are determined on the basis of identified cost and may include proceeds from litigation.
Securities lending. The fund may lend its securities to earn additional income. The fund receives cash collateral from theborrower in an amount not less than the market value of the loaned securities. The fund will invest its collateral in JHCT,anaffiliate of the fund,which has a floating NAV and is registered with the Securities and Exchange Commission (SEC) as aninvestment company. JHCT invests in short-term money market investments. The fund will receive the benefit of any gainsand bear any losses generated by JHCT with respect to the cash collateral.
The fund has the right to recall loaned securities on demand. If a borrower fails to return loaned securities when due, then thelending agent is responsible and indemnifies the fund for the lent securities. The lending agent uses the collateral receivedfrom the borrower to purchase replacement securities of the same issue, type, class and series of the loaned securities. If thevalue of the collateral is less than the purchase cost of replacement securities, the lending agent is responsible for satisfyingthe shortfall but only to the extent that the shortfall is not due to any decrease in the value of JHCT.
SEMIANNUAL REPORT | JOHN HANCOCK BLUE CHIP GROWTH FUND 25
JOBNAME: No Job Name PAGE: 26 SESS: 39 OUTPUT: Tue Apr 24 19:49:59 2018 SUM: 8461D5ED/qaJobz/JohnHancock/shareholder_2015/JH457BlueChipGrowth/JH457_Blue_Chip_Growth_SA
Although the risk of the loss of the securities lent is mitigated by receiving collateral from the borrower and through lendingagent indemnification, the fund could experience a delay in recovering securities or could experience a lower than expectedreturn if the borrower fails to return the securities on a timely basis. The fund receives compensation for lending its securitiesby retaining a portion of the return on the investment of the collateral and compensation from fees earned from borrowers ofthe securities. Securities lending income received by the fund is net of fees retained by the securities lending agent.Netincome received from JHCT is a component of securities lending income as recorded on the Statement of operations.
Obligations to repay collateral received by the fund are shown on the Statement of assets and liabilities as Payable uponreturn of securities loaned and are secured by the loaned securities.As of February 28,2018, the fund loaned common stocksvalued at $20,856,982 and received $21,281,648 of cash collateral.
Foreign investing. Assets, including investments and liabilities denominated in foreign currencies, are translated into U.S.dollar values each day at the prevailing exchange rate. Purchases and sales of securities, income and expenses are translatedinto U.S. dollars at the prevailing exchange rate on the date of the transaction. The effect of changes in foreign currencyexchange rates on the value of securities is reflected as a component of the realized and unrealized gains (losses) oninvestments. Foreign investments are subject to a decline in the value of a foreign currency versus the U.S. dollar,whichreduces the dollar value of securities denominated in that currency.
Funds that invest internationally generally carry more risk than funds that invest strictly in U.S. securities.Risks can resultfrom differences in economic and political conditions, regulations,market practices (including higher transaction costs),accounting standards and other factors.
Foreign taxes. The fund may be subject to withholding tax on income and/or capital gains or repatriation taxes imposed bycertain countries in which the fund invests. Taxes are accrued based upon investment income, realized gains or unrealizedappreciation.
Line of credit.The fund may have the ability to borrow from banks for temporary or emergency purposes, includingmeeting redemption requests that otherwise might require the untimely sale of securities. Pursuant to the fund’s custodianagreement, the custodian may loan money to the fund to make properly authorized payments. The fund is obligated to repaythe custodian for any overdraft, including any related costs or expenses. The custodian may have a lien, security interest orsecurity entitlement in any fund property that is not otherwise segregated or pledged, to the extent of any overdraft, and tothe maximum extent permitted by law.
The fund and other affiliated funds have entered into a syndicated line of credit agreement with Citibank,N.A.as theadministrative agent that enables them to participate in a $750 million unsecured committed line of credit. Excludingcommitments designated for a certain fund and subject to the needs of all other affiliated funds, the fund can borrow up toan aggregate commitment amount of $500 million, subject to asset coverage and other limitations as specified in theagreement.A commitment fee payable at the end of each calendar quarter, based on the average daily unused portion of theline of credit, is charged to each participating fund based on a combination of fixed and asset based allocations and isreflected in Other expenses on the Statement of operations. For the six months ended February 28,2018, the fund had noborrowings under the line of credit.Commitment fees for the six months ended February 28,2018,were $3,488.
Expenses. Within the John Hancock group of funds complex, expenses that are directly attributable to an individual fundare allocated to such fund. Expenses that are not readily attributable to a specific fund are allocated among all funds in anequitable manner, taking into consideration, among other things, the nature and type of expense and the fund’s relative netassets. Expense estimates are accrued in the period to which they relate and adjustments are made when actual amountsare known.
Class allocations. Income, common expenses and realized and unrealized gains (losses) are determined at the fund leveland allocated daily to each class of shares based on the net assets of the class.Class-specific expenses, such as distributionand service fees, if any, and transfer agent fees, for all classes, are charged daily at the class level based on the net assets ofeach class and the specific expense rates applicable to each class.
JOHN HANCOCK BLUE CHIP GROWTH FUND | SEMIANNUAL REPORT26
JOBNAME: No Job Name PAGE: 27 SESS: 39 OUTPUT: Tue Apr 24 19:49:59 2018 SUM: 846C0A60/qaJobz/JohnHancock/shareholder_2015/JH457BlueChipGrowth/JH457_Blue_Chip_Growth_SA
Federal income taxes. The fund intends to continue to qualify as a regulated investment company by complying with theapplicable provisions of the Internal Revenue Code and will not be subject to federal income tax on taxable income that isdistributed to shareholders. Therefore, no federal income tax provision is required.
As of August 31,2017, the fund had no uncertain tax positions that would require financial statement recognition,derecognition or disclosure. The fund’s federal tax returns are subject to examination by the Internal Revenue Service for aperiod of three years.
Distribution of income and gains. Distributions to shareholders from net investment income and net realized gains, ifany, are recorded on the ex-date. The fund generally declares and pays dividends and capital gain distributions, if any,annually.
Distributions paid by the fund with respect to each class of shares are calculated in the same manner, at the same time and inthe same amount, except for the effect of class level expenses that may be applied differently to each class.
Such distributions, on a tax basis, are determined in conformity with income tax regulations,which may differ from US GAAP.
Capital accounts within the financial statements are adjusted for permanent book-tax differences. These adjustments haveno impact on net assets or the results of operations. Temporary book-tax differences, if any,will reverse in a subsequentperiod.Book-tax differences are primarily attributable to wash sale loss deferrals.
Note 3 — Guarantees and indemnificationsUnder the Trust’s organizational documents, its Officers and Trustees are indemnified against certain liabilities arising out ofthe performance of their duties to the Trust, including the fund.Additionally, in the normal course of business, the fund entersinto contracts with service providers that contain general indemnification clauses. The fund’s maximum exposure underthese arrangements is unknown,as this would involve future claims that may be made against the fund that have not yetoccurred. The risk of material loss from such claims is considered remote.
Note 4 — Fees and transactions with affiliatesJohn Hancock Advisers, LLC (the Advisor) serves as investment advisor for the fund. John Hancock Funds, LLC (theDistributor), an affiliate of the Advisor, serves as principal underwriter of the fund. The Advisor and the Distributor areindirect,wholly owned subsidiaries of MFC.
Management fee. The fund has an investment management agreement with the Advisor under which the fund pays adaily management fee to the Advisor equivalent on an annual basis, to the sum of: a) 0.825% of the first $500 million of thefund’s aggregate net assets; b) 0.800% of the next $500 million of the fund’s aggregate net assets; and c) 0.750% of thefund’s aggregate net assets in excess of $1 billion.However,when aggregate net assets exceed $1 billion on any day, theannual rate of advisory fee for the day is 0.750% of the first $1 billion of the fund’s aggregate net assets.Aggregate netassets include the net assets of the fund and Blue Chip Growth Trust, a series of John Hancock Variable Insurance Trust. TheAdvisor has a subadvisory agreement with T.Rowe Price Associates, Inc. The fund is not responsible for payment of thesubadvisory fees.
The Advisor has contractually agreed to waive a portion of its management fee and/or reimburse expenses for certain fundsof the John Hancock group of funds complex, including the fund (the participating portfolios). This waiver is based uponaggregate net assets of all the participating portfolios. The amount of the reimbursement is calculated daily and allocatedamong all the participating portfolios in proportion to the daily net assets of each fund.During the six months endedFebruary 28,2018, this waiver amounted to 0.01% of the fund’s average net assets. This arrangement may be amended orterminated at any time by the Advisor upon notice to the fund and with the approval of the Board of Trustees.
The Advisor has contractually agreed to reduce its management fee or, if necessary,make payment to each of Class A andClass C shares in an amount equal to the amount by which the expenses of Class A and Class C shares, as applicable, exceed1.14% and 1.89%, respectively, of the average net assets (on an annualized basis) attributable to the class. For purposes ofthis agreement, “expenses of Class A and Class C shares”means all expenses of the applicable class (including fund
SEMIANNUAL REPORT | JOHN HANCOCK BLUE CHIP GROWTH FUND 27
JOBNAME: No Job Name PAGE: 28 SESS: 39 OUTPUT: Tue Apr 24 19:49:59 2018 SUM: F7E5BDD6/qaJobz/JohnHancock/shareholder_2015/JH457BlueChipGrowth/JH457_Blue_Chip_Growth_SA
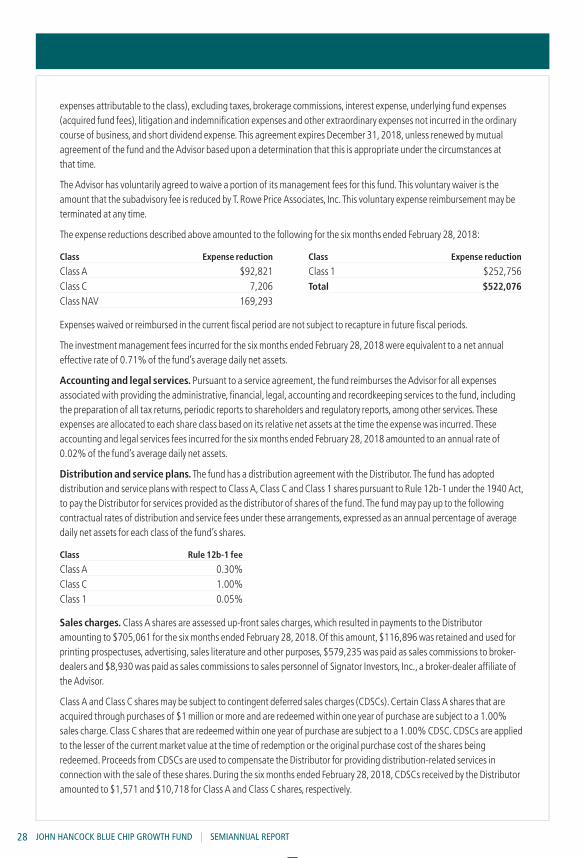
expenses attributable to the class), excluding taxes, brokerage commissions, interest expense, underlying fund expenses(acquired fund fees), litigation and indemnification expenses and other extraordinary expenses not incurred in the ordinarycourse of business, and short dividend expense. This agreement expires December 31,2018,unless renewed by mutualagreement of the fund and the Advisor based upon a determination that this is appropriate under the circumstances atthat time.
The Advisor has voluntarily agreed to waive a portion of its management fees for this fund. This voluntary waiver is theamount that the subadvisory fee is reduced by T.Rowe Price Associates, Inc. This voluntary expense reimbursement may beterminated at any time.
The expense reductions described above amounted to the following for the six months ended February 28,2018:
Class Expense reduction Class Expense reduction
Class A $92,821 Class 1 $252,756Class C 7,206 Total $522,076
Class NAV 169,293
Expenses waived or reimbursed in the current fiscal period are not subject to recapture in future fiscal periods.
The investment management fees incurred for the six months ended February 28,2018 were equivalent to a net annualeffective rate of 0.71% of the fund’s average daily net assets.
Accounting and legal services. Pursuant to a service agreement, the fund reimburses the Advisor for all expensesassociated with providing the administrative, financial, legal, accounting and recordkeeping services to the fund, includingthe preparation of all tax returns, periodic reports to shareholders and regulatory reports, among other services. Theseexpenses are allocated to each share class based on its relative net assets at the time the expense was incurred. Theseaccounting and legal services fees incurred for the six months ended February 28,2018 amounted to an annual rate of0.02% of the fund’s average daily net assets.
Distribution and service plans.The fund has a distribution agreement with the Distributor. The fund has adopteddistribution and service plans with respect to Class A,Class C and Class 1 shares pursuant to Rule 12b-1 under the 1940 Act,to pay the Distributor for services provided as the distributor of shares of the fund. The fund may pay up to the followingcontractual rates of distribution and service fees under these arrangements, expressed as an annual percentage of averagedaily net assets for each class of the fund’s shares.
Class Rule 12b-1 fee
Class A 0.30%Class C 1.00%Class 1 0.05%
Sales charges. Class A shares are assessed up-front sales charges,which resulted in payments to the Distributoramounting to $705,061 for the six months ended February 28,2018.Of this amount, $116,896 was retained and used forprinting prospectuses, advertising, sales literature and other purposes, $579,235 was paid as sales commissions to broker-dealers and $8,930 was paid as sales commissions to sales personnel of Signator Investors, Inc., a broker-dealer affiliate ofthe Advisor.
Class A and Class C shares may be subject to contingent deferred sales charges (CDSCs).Certain Class A shares that areacquired through purchases of $1 million or more and are redeemed within one year of purchase are subject to a 1.00%sales charge.Class C shares that are redeemed within one year of purchase are subject to a 1.00% CDSC.CDSCs are appliedto the lesser of the current market value at the time of redemption or the original purchase cost of the shares beingredeemed.Proceeds from CDSCs are used to compensate the Distributor for providing distribution-related services inconnection with the sale of these shares.During the six months ended February 28,2018,CDSCs received by the Distributoramounted to $1,571 and $10,718 for Class A and Class C shares, respectively.
JOHN HANCOCK BLUE CHIP GROWTH FUND | SEMIANNUAL REPORT28
JOBNAME: No Job Name PAGE: 29 SESS: 39 OUTPUT: Tue Apr 24 19:49:59 2018 SUM: 5DE3F136/qaJobz/JohnHancock/shareholder_2015/JH457BlueChipGrowth/JH457_Blue_Chip_Growth_SA
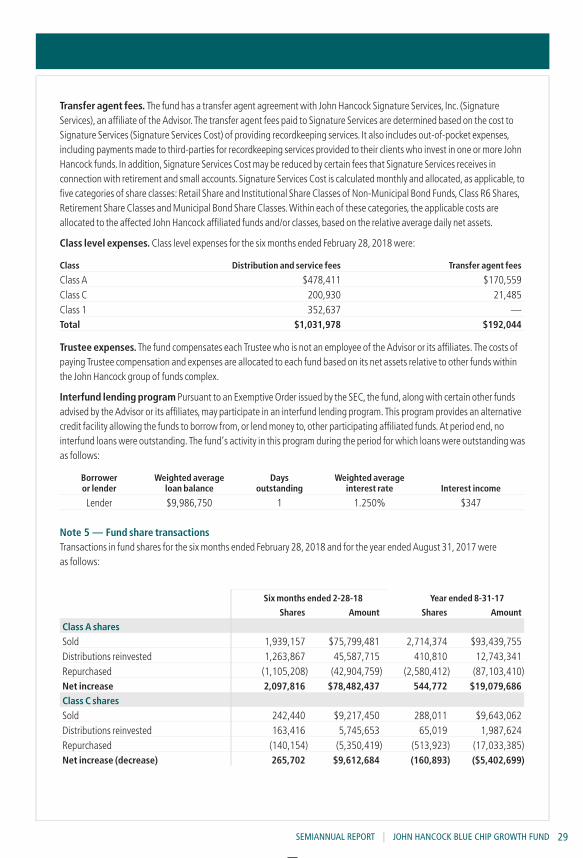
Transfer agent fees. The fund has a transfer agent agreement with John Hancock Signature Services, Inc. (SignatureServices), an affiliate of the Advisor. The transfer agent fees paid to Signature Services are determined based on the cost toSignature Services (Signature Services Cost) of providing recordkeeping services. It also includes out-of-pocket expenses,including payments made to third-parties for recordkeeping services provided to their clients who invest in one or more JohnHancock funds. In addition, Signature Services Cost may be reduced by certain fees that Signature Services receives inconnection with retirement and small accounts. Signature Services Cost is calculated monthly and allocated, as applicable, tofive categories of share classes:Retail Share and Institutional Share Classes of Non-Municipal Bond Funds,Class R6 Shares,Retirement Share Classes and Municipal Bond Share Classes.Within each of these categories, the applicable costs areallocated to the affected John Hancock affiliated funds and/or classes, based on the relative average daily net assets.
Class level expenses. Class level expenses for the six months ended February 28, 2018 were:
Class Distribution and service fees Transfer agent fees
Class A $478,411 $170,559Class C 200,930 21,485Class 1 352,637 —Total $1,031,978 $192,044
Trustee expenses.The fund compensates each Trustee who is not an employee of the Advisor or its affiliates. The costs ofpaying Trustee compensation and expenses are allocated to each fund based on its net assets relative to other funds withinthe John Hancock group of funds complex.
Interfund lending program Pursuant to an Exemptive Order issued by the SEC, the fund, along with certain other fundsadvised by the Advisor or its affiliates,may participate in an interfund lending program.This program provides an alternativecredit facility allowing the funds to borrow from,or lend money to, other participating affiliated funds.At period end,nointerfund loans were outstanding. The fund’s activity in this program during the period for which loans were outstanding wasas follows:
Borroweror lender
Weighted averageloan balance
Daysoutstanding
Weighted averageinterest rate Interest income
Lender $9,986,750 1 1.250% $347
Note 5 — Fund share transactionsTransactions in fund shares for the six months ended February 28,2018 and for the year ended August 31,2017 wereas follows:
Six months ended 2-28-18 Year ended 8-31-17
Shares Amount Shares Amount
Class A shares
Sold 1,939,157 $75,799,481 2,714,374 $93,439,755Distributions reinvested 1,263,867 45,587,715 410,810 12,743,341Repurchased (1,105,208) (42,904,759) (2,580,412) (87,103,410)Net increase 2,097,816 $78,482,437 544,772 $19,079,686Class C shares
Sold 242,440 $9,217,450 288,011 $9,643,062Distributions reinvested 163,416 5,745,653 65,019 1,987,624Repurchased (140,154) (5,350,419) (513,923) (17,033,385)Net increase (decrease) 265,702 $9,612,684 (160,893) ($5,402,699)
SEMIANNUAL REPORT | JOHN HANCOCK BLUE CHIP GROWTH FUND 29
JOBNAME: No Job Name PAGE: 30 SESS: 39 OUTPUT: Tue Apr 24 19:49:59 2018 SUM: 2EC360E6/qaJobz/JohnHancock/shareholder_2015/JH457BlueChipGrowth/JH457_Blue_Chip_Growth_SA
Six months ended 2-28-18 Year ended 8-31-17
Shares Amount Shares Amount
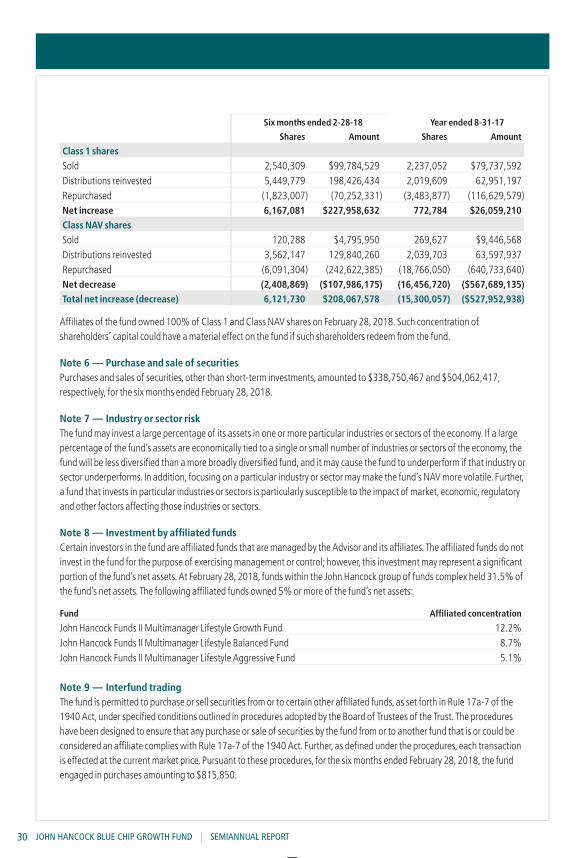
Class 1 shares
Sold 2,540,309 $99,784,529 2,237,052 $79,737,592Distributions reinvested 5,449,779 198,426,434 2,019,609 62,951,197Repurchased (1,823,007) (70,252,331) (3,483,877) (116,629,579)Net increase 6,167,081 $227,958,632 772,784 $26,059,210Class NAV shares
Sold 120,288 $4,795,950 269,627 $9,446,568Distributions reinvested 3,562,147 129,840,260 2,039,703 63,597,937Repurchased (6,091,304) (242,622,385) (18,766,050) (640,733,640)Net decrease (2,408,869) ($107,986,175) (16,456,720) ($567,689,135)Total net increase (decrease) 6,121,730 $208,067,578 (15,300,057) ($527,952,938)
Affiliates of the fund owned 100% of Class 1 and Class NAV shares on February 28,2018. Such concentration ofshareholders’ capital could have a material effect on the fund if such shareholders redeem from the fund.
Note 6 — Purchase and sale of securitiesPurchases and sales of securities, other than short-term investments, amounted to $338,750,467 and $504,062,417,respectively, for the six months ended February 28,2018.
Note 7 — Industry or sector riskThe fund may invest a large percentage of its assets in one or more particular industries or sectors of the economy. If a largepercentage of the fund’s assets are economically tied to a single or small number of industries or sectors of the economy, thefund will be less diversified than a more broadly diversified fund, and it may cause the fund to underperform if that industry orsector underperforms. In addition, focusing on a particular industry or sector may make the fund’s NAV more volatile. Further,a fund that invests in particular industries or sectors is particularly susceptible to the impact of market, economic, regulatoryand other factors affecting those industries or sectors.
Note 8 — Investment by affiliated fundsCertain investors in the fund are affiliated funds that are managed by the Advisor and its affiliates. The affiliated funds do notinvest in the fund for the purpose of exercising management or control; however, this investment may represent a significantportion of the fund’s net assets.At February 28,2018, funds within the John Hancock group of funds complex held 31.5% ofthe fund’s net assets. The following affiliated funds owned 5% or more of the fund’s net assets:
Fund Affiliated concentration
John Hancock Funds II Multimanager Lifestyle Growth Fund 12.2%John Hancock Funds II Multimanager Lifestyle Balanced Fund 8.7%John Hancock Funds II Multimanager Lifestyle Aggressive Fund 5.1%
Note 9 — Interfund tradingThe fund is permitted to purchase or sell securities from or to certain other affiliated funds, as set forth in Rule 17a-7 of the1940 Act, under specified conditions outlined in procedures adopted by the Board of Trustees of the Trust. The procedureshave been designed to ensure that any purchase or sale of securities by the fund from or to another fund that is or could beconsidered an affiliate complies with Rule 17a-7 of the 1940 Act. Further, as defined under the procedures, each transactionis effected at the current market price. Pursuant to these procedures, for the six months ended February 28,2018, the fundengaged in purchases amounting to $815,850.
JOHN HANCOCK BLUE CHIP GROWTH FUND | SEMIANNUAL REPORT30
JOBNAME: No Job Name PAGE: 31 SESS: 39 OUTPUT: Tue Apr 24 19:49:59 2018 SUM: B9B4702F/qaJobz/JohnHancock/shareholder_2015/JH457BlueChipGrowth/JH457_Blue_Chip_Growth_SA
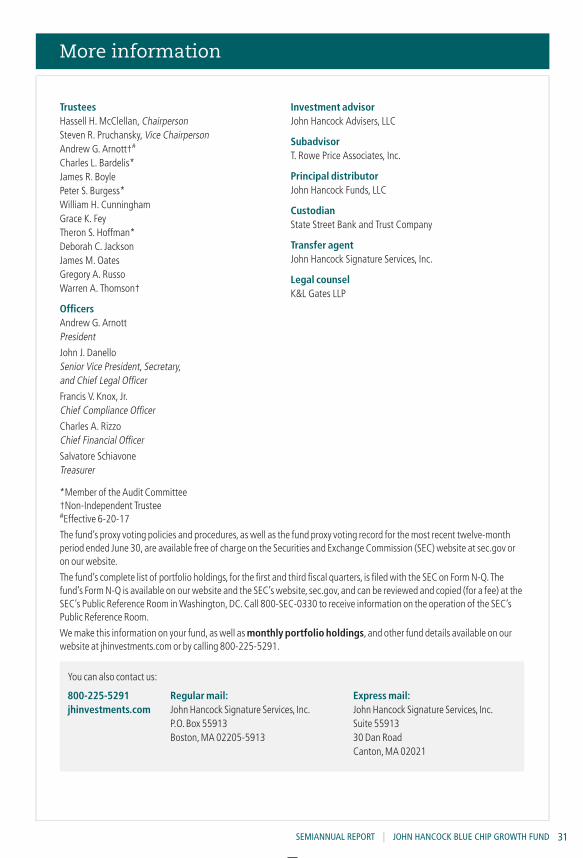
TrusteesHassell H. McClellan, ChairpersonSteven R. Pruchansky, Vice ChairpersonAndrew G. Arnott†#
Charles L. Bardelis*James R. BoylePeter S. Burgess*William H. CunninghamGrace K. FeyTheron S. Hoffman*Deborah C. JacksonJames M. OatesGregory A. RussoWarren A. Thomson†
OfficersAndrew G. ArnottPresident
John J. DanelloSenior Vice President, Secretary,and Chief Legal Officer
Francis V. Knox, Jr.Chief Compliance Officer
Charles A. RizzoChief Financial Officer
Salvatore SchiavoneTreasurer
Investment advisorJohn Hancock Advisers, LLC
SubadvisorT. Rowe Price Associates, Inc.
Principal distributorJohn Hancock Funds, LLC
CustodianState Street Bank and Trust Company
Transfer agentJohn Hancock Signature Services, Inc.
Legal counselK&L Gates LLP
*Member of the Audit Committee†Non-Independent Trustee#Effective 6-20-17
The fund’s proxy voting policies and procedures, as well as the fund proxy voting record for the most recent twelve-monthperiod ended June 30,are available free of charge on the Securities and Exchange Commission (SEC) website at sec.gov oron our website.
The fund’s complete list of portfolio holdings, for the first and third fiscal quarters, is filed with the SEC on Form N-Q.Thefund’s Form N-Q is available on our website and the SEC’s website, sec.gov, and can be reviewed and copied (for a fee) at theSEC’s Public Reference Room in Washington,DC.Call 800-SEC-0330 to receive information on the operation of the SEC’sPublic Reference Room.
We make this information on your fund, as well as monthly portfolio holdings, and other fund details available on ourwebsite at jhinvestments.com or by calling 800-225-5291.
You can also contact us:
800-225-5291jhinvestments.com
Regular mail:John Hancock Signature Services, Inc.P.O.Box 55913Boston,MA 02205-5913
Express mail:John Hancock Signature Services, Inc.Suite 5591330 Dan RoadCanton,MA 02021
More information
SEMIANNUAL REPORT | JOHN HANCOCK BLUE CHIP GROWTH FUND 31
JOBNAME: No Job Name PAGE: 32 SESS: 39 OUTPUT: Tue Apr 24 19:49:59 2018 SUM: B1D203B6/qaJobz/JohnHancock/shareholder_2015/JH457BlueChipGrowth/JH457_Blue_Chip_Growth_SA
DOMESTIC EQUITY FUNDS
Balanced
Blue Chip Growth
Classic Value
Disciplined Value
Disciplined Value Mid Cap
Equity Income
Fundamental All Cap Core
Fundamental Large Cap Core
Fundamental Large Cap Value
New Opportunities
Small Cap Core
Small Cap Growth
Small Cap Value
Strategic Growth
U.S.Global Leaders Growth
U.S.Growth
Value Equity
GLOBAL AND INTERNATIONAL EQUITY FUNDS
Disciplined Value International
Emerging Markets
Emerging Markets Equity
Fundamental Global Franchise
Global Equity
Global Shareholder Yield
Greater China Opportunities
International Growth
International Small Company
International Value Equity
INCOME FUNDS
Bond
California Tax-Free Income
Emerging Markets Debt
Floating Rate Income
Global Income
Government Income
High Yield
High Yield Municipal Bond
Income
Investment Grade Bond
Money Market
Short Duration Credit Opportunities
Spectrum Income
Strategic Income Opportunities
Tax-Free Bond
ALTERNATIVE AND SPECIALTY FUNDS
Absolute Return Currency
Alternative Asset Allocation
Enduring Assets
Financial Industries
Global Absolute Return Strategies
Global Conservative Absolute Return
Global Focused Strategies
Natural Resources
Redwood
Regional Bank
Seaport
Technical Opportunities
A fund’s investment objectives, risks, charges, and expenses should be considered carefully before investing.The prospectus contains this and other important information about the fund. To obtain a prospectus,contact your financial professional, call John Hancock Investments at 800-225-5291, or visit our website atjhinvestments.com. Please read the prospectus carefully before investing or sending money.
John Hancock family of funds

JOBNAME: No Job Name PAGE: 33 SESS: 39 OUTPUT: Tue Apr 24 19:49:59 2018 SUM: 92F2E170/qaJobz/JohnHancock/shareholder_2015/JH457BlueChipGrowth/JH457_Blue_Chip_Growth_SA
ASSET ALLOCATION
Income Allocation
Multi-Index Lifetime Portfolios
Multi-Index Preservation Portfolios
Multimanager Lifestyle Portfolios
Multimanager Lifetime Portfolios
Retirement Income 2040
EXCHANGE-TRADED FUNDS
John Hancock Multifactor Consumer Discretionary ETF
John Hancock Multifactor Consumer Staples ETF
John Hancock Multifactor Developed International ETF
John Hancock Multifactor Energy ETF
John Hancock Multifactor Financials ETF
John Hancock Multifactor Healthcare ETF
John Hancock Multifactor Industrials ETF
John Hancock Multifactor Large Cap ETF
John Hancock Multifactor Materials ETF
John Hancock Multifactor Mid Cap ETF
John Hancock Multifactor Small Cap ETF
John Hancock Multifactor Technology ETF
John Hancock Multifactor Utilities ETF
ENVIRONMENTAL, SOCIAL, AND GOVERNANCEFUNDS
ESG All Cap Core
ESG Core Bond
ESG International Equity
ESG Large Cap Core
CLOSED-END FUNDS
Financial Opportunities
Hedged Equity & Income
Income Securities Trust
Investors Trust
Preferred Income
Preferred Income II
Preferred Income III
Premium Dividend
Tax-Advantaged Dividend Income
Tax-Advantaged Global Shareholder Yield
John Hancock Multifactor ETF shares are bought and sold at market price (not NAV), and are not individually redeemedfrom the fund.Brokerage commissions will reduce returns.
John Hancock ETFs are distributed by Foreside Fund Services, LLC, and are subadvised by Dimensional Fund Advisors LP.Foreside is not affiliated with John Hancock Funds, LLC or Dimensional Fund Advisors LP.
Dimensional Fund Advisors LP receives compensation from John Hancock in connection with licensing rights to theJohn Hancock Dimensional indexes.Dimensional Fund Advisors LP does not sponsor, endorse, or sell, and makes norepresentation as to the advisability of investing in, John Hancock Multifactor ETFs.

JOBNAME: No Job Name PAGE: 34 SESS: 39 OUTPUT: Tue Apr 24 19:49:59 2018 SUM: 6AB34A24/qaJobz/JohnHancock/shareholder_2015/JH457BlueChipGrowth/JH457_Blue_Chip_Growth_SA
Connect with John Hancock Investments: @JH_Investments | jhinvestmentsblog.com
John Hancock Investments
A trusted brand
John Hancock Investments is a premier asset manager representing one of
America’s most trusted brands, with a heritage of financial stewardship dating
back to 1862. Helping our shareholders pursue their financial goals is at the
core of everything we do. It’s why we support the role of professional financial
advice and operate with the highest standards of conduct and integrity.
A better way to invest
We serve investors globally through a unique multimanager approach:
We search the world to find proven portfolio teams with specialized
expertise for every strategy we offer, then we apply robust investment
oversight to ensure they continue to meet our uncompromising standards
and serve the best interests of our shareholders.
Results for investors
Our unique approach to asset management enables us to provide a diverse set
of investments backed by some of the world’s best managers, along with strong
risk-adjusted returns across asset classes.
John Hancock Funds, LLC n Member FINRA, SIPC601 Congress Street n Boston, MA 02210-2805800-225-5291 n jhinvestments.com
This report is for the information of the shareholders of John Hancock Blue ChipGrowth Fund. It is not authorized for distribution to prospective investors unlesspreceded or accompanied by a prospectus.
MF437136 457SA 2/184/18


