48
Semiannual report John Hancock Global Shareholder Yield Fund International equity September 30, 2021
Semiannual report
John HancockGlobalShareholderYield FundInternational equitySeptember 30, 2021

Dear shareholder,
The global equity markets posted a gain during the six months endedSeptember 30, 2021, despite late period volatility. New variants of COVID-19,China’s aggressive tightening of its regulatory policies, and the debt problems of alarge Chinese property developer combined to depress sentiment. In addition, theU.S. Federal Reserve and other central banks indicated that they may soon begin totighten monetary policy to combat inflation. Still, equities held up reasonably well inthe face of these headwinds.
In these uncertain times, your financial professional can assist with positioning yourportfolio so that it’s sufficiently diversified to help meet your long-term objectivesand to withstand the inevitable bouts of market volatility along the way.
On behalf of everyone at John Hancock Investment Management, I’d like to take thisopportunity to welcome new shareholders and thank existing shareholders for thecontinued trust you’ve placed in us.
Sincerely,
Andrew G. ArnottPresident and CEO,John Hancock Investment ManagementHead of Wealth and Asset Management,United States and Europe
This commentary reflects the CEO’s views as of this report’s period end and are subjectto change at any time. Diversification does not guarantee investment returns and doesnot eliminate risk of loss. All investments entail risks, including the possible loss ofprincipal. For more up-to-date information, you can visit our website atjhinvestments.com.
A message to shareholders

Table of contents
2 Your fund at a glance
3 Portfolio summary
5 A look at performance
7 Your expenses
9 Fund’s investments
13 Financial statements
16 Financial highlights
22 Notes to financial statements
31 Evaluation of advisory and subadvisory agreements by the Board of Trustees
38 More information
John HancockGlobal Shareholder Yield Fund
SEMIANNUAL REPORT | JOHN HANCOCK GLOBAL SHAREHOLDER YIELD FUND 1

INVESTMENT OBJECTIVE
The fund seeks to provide a high level of income as its primary objective. Capitalappreciation is a secondary investment objective.
AVERAGE ANNUAL TOTAL RETURNS AS OF 9/30/2021 (%)
6 month(cumulative)
1 year 3 year 5 year 10 year
2.72
7.74
2.70
22.61
28.8229.74
6.21
13.14
6.88 6.36
13.74
8.51 8.00
12.68
9.45
Class A shares (without sales charge)
MSCI World Index
Morningstar world large stock fund category average
The MSCI World Index tracks the performance of publicly traded large- and mid-cap stocks ofdeveloped-market companies.It is not possible to invest directly in an index. Index figures do not reflect expenses or sales charges,which would result in lower returns.The fund’s Morningstar category average is a group of funds with similar investment objectives andstrategies and is the equal-weighted return of all funds per category. Morningstar places funds incertain categories based on their historical portfolio holdings. Figures from Morningstar, Inc. includereinvested distributions and do not take into account sales charges. Actual load-adjusted performanceis lower.The past performance shown here reflects reinvested distributions and the beneficial effect of anyexpense reductions, and does not guarantee future results. Performance of the other share classeswill vary based on the difference in the fees and expenses of those classes. Shares will fluctuate invalue and, when redeemed, may be worth more or less than their original cost. Current month-endperformance may be lower or higher than the performance cited, and can be found atjhinvestments.com or by calling 800-225-5291. For further information on the fund’s objectives, risks,and strategy, see the fund’s prospectus.
Your fund at a glance
2 JOHN HANCOCK GLOBAL SHAREHOLDER YIELD FUND | SEMIANNUAL REPORT

SECTOR COMPOSITION AS OF 9/30/2021 (% of net assets)
Information technology 15.3Financials 15.2Health care 11.8Consumer staples 10.0Industrials 9.1Utilities 8.8Communication services 7.6Consumer discretionary 7.1Materials 5.0Energy 4.6Real estate 3.2Other assets and liabilities, net 2.3
TOP 10 HOLDINGS AS OF 9/30/2021 (% of net assets)
Microsoft Corp. 2.0Nutrien, Ltd. (New York Stock Exchange) 1.9Analog Devices, Inc. 1.7Broadcom, Inc. 1.7AbbVie, Inc. 1.7IBM Corp. 1.5Iron Mountain, Inc. 1.5MetLife, Inc. 1.5Allianz SE 1.5Restaurant Brands International, Inc. 1.5TOTAL 16.5
Cash and cash equivalents are not included.
Portfolio summary
SEMIANNUAL REPORT | JOHN HANCOCK GLOBAL SHAREHOLDER YIELD FUND 3

TOP 10 COUNTRIES AS OF 9/30/2021 (% of net assets)
United States 55.5Canada 8.5Germany 8.0United Kingdom 7.5France 5.0Italy 2.8Japan 2.3Switzerland 2.0Norway 1.4South Korea 1.4TOTAL 94.4
Cash and cash equivalents are not included.
Notes about risk
The fund is subject to various risks as described in the fund’s prospectus. The novel COVID-19 diseasehas resulted in significant disruptions to global business activity. A widespread health crisis such as aglobal pandemic could cause substantial market volatility, exchange trading suspensions and closures,which may lead to less liquidity in certain instruments, industries, sectors or the markets generally, andmay ultimately affect fund performance. For more information, please refer to the “Principal risks”section of the prospectus.
4 JOHN HANCOCK GLOBAL SHAREHOLDER YIELD FUND | SEMIANNUAL REPORT

TOTAL RETURNS FOR THE PERIOD ENDED SEPTEMBER 30, 2021
Average annual total returns (%)with maximum sales charge
Cumulative total returns (%)with maximum sales charge
SEC 30-dayyield (%)subsidized
SEC 30-dayyield (%)
unsubsidized†
1-year 5-year 10-year 6-month 5-year 10-yearas of
9-30-21as of
9-30-21
Class A 16.43 5.28 7.45 -2.42 29.36 105.12 2.15 1.96
Class C 20.55 5.55 7.21 1.24 31.01 100.68 1.49 1.35
Class I1 22.82 6.61 8.32 2.75 37.70 122.36 2.53 2.38
Class R21,2 22.31 6.19 7.87 2.54 35.05 113.27 2.15 2.01
Class R61 22.98 6.73 8.41 2.81 38.48 124.30 2.63 2.48
Class NAV1 22.96 6.72 8.43 2.80 38.44 124.72 2.64 2.50
Index†† 28.82 13.74 12.68 7.74 90.37 229.96 — —
Performance figures assume all distributions have been reinvested. Figures reflect maximum salescharges on Class A shares of 5%, and the applicable contingent deferred sales charge (CDSC) onClass C shares. Class C shares sold within one year of purchase are subject to a 1% CDSC. Salescharges are not applicable to Class I, Class R2, Class R6, and Class NAV shares.The expense ratios of the fund, both net (including any fee waivers and/or expense limitations) andgross (excluding any fee waivers and/or expense limitations), are set forth according to the most recentpublicly available prospectuses for the fund and may differ from those disclosed in the Financialhighlights tables in this report. Net expenses reflect contractual fee waivers and expense limitations ineffect until July 31, 2022 and are subject to change. Had the contractual fee waivers and expenselimitations not been in place, gross expenses would apply. The expense ratios are as follows:
Class A Class C Class I Class R2 Class R6 Class NAVGross (%) 1.29 1.99 0.99 1.38 0.88 0.87Net (%) 1.09 1.84 0.84 1.24 0.74 0.86
Please refer to the most recent prospectus and annual or semiannual report for more information onexpenses and any expense limitation arrangements for each class.The returns reflect past results and should not be considered indicative of future performance. Thereturn and principal value of an investment will fluctuate so that shares, when redeemed, may be worthmore or less than their original cost. Due to market volatility and other factors, the fund’s currentperformance may be higher or lower than the performance shown. For current to the most recentmonth-end performance data, please call 800–225–5291 or visit the fund’s website atjhinvestments.com.The performance table above and the chart on the next page do not reflect the deduction of taxes thata shareholder would pay on fund distributions or the redemption of fund shares. The fund’sperformance results reflect any applicable fee waivers or expense reductions, without which theexpenses would increase and results would have been less favorable.
† Unsubsidized yield reflects what the yield would have been without the effect of reimbursements andwaivers.
†† Index is the MSCI World Index.See the following page for footnotes.
A look at performance
SEMIANNUAL REPORT | JOHN HANCOCK GLOBAL SHAREHOLDER YIELD FUND 5

This chart and table show what happened to a hypothetical $10,000 investment inJohn Hancock Global Shareholder Yield Fund for the share classes and periodsindicated, assuming all distributions were reinvested. For comparison, we’ve shownthe same investment in the MSCI World Index.
Ending values 9-30-21
Class A shares (with maximum sales charge)Class A shares (without sales charges)MSCI World Index
9-30-219-209-199-189-179-169-159-149-139-30-11 9-12
$35,000
5,000
10,0009,500
$20,512$21,594
$32,996
Start dateWith maximumsales charge ($)
Withoutsales charge ($) Index ($)
Class C3 9-30-11 20,068 20,068 32,996Class I1 9-30-11 22,236 22,236 32,996Class R21,2 9-30-11 21,327 21,327 32,996Class R61 9-30-11 22,430 22,430 32,996Class NAV1 9-30-11 22,472 22,472 32,996
The MSCI World Index tracks the performance of publicly traded large- and mid-cap stocks ofdeveloped-market companies.It is not possible to invest directly in an index. Index figures do not reflect expenses or sales charges,which would result in lower returns.Footnotes related to performance pages
1 For certain types of investors, as described in the fund’s prospectuses.2 Class R2 shares were first offered on 3-1-12. The returns prior to this date are those of Class A shares that have not
been adjusted for class-specific expenses; otherwise, returns would vary.3 The contingent deferred sales charge is not applicable.
6 JOHN HANCOCK GLOBAL SHAREHOLDER YIELD FUND | SEMIANNUAL REPORT

These examples are intended to help you understand your ongoing operatingexpenses of investing in the fund so you can compare these costs with the ongoingcosts of investing in other mutual funds.
Understanding fund expensesAs a shareholder of the fund, you incur two types of costs:
▪ Transaction costs, which include sales charges (loads) on purchases orredemptions (varies by share class), minimum account fee charge, etc.
▪ Ongoing operating expenses, including management fees, distribution andservice fees (if applicable), and other fund expenses.
We are presenting only your ongoing operating expenses here.
Actual expenses/actual returnsThe first line of each share class in the table on the following page is intended toprovide information about the fund’s actual ongoing operating expenses, and isbased on the fund’s actual return. It assumes an account value of $1,000.00 onApril 1, 2021, with the same investment held until September 30, 2021.
Together with the value of your account, you may use this information to estimatethe operating expenses that you paid over the period. Simply divide your accountvalue at September 30, 2021, by $1,000.00, then multiply it by the “expensespaid” for your share class from the table. For example, for an account value of$8,600.00, the operating expenses should be calculated as follows:
Hypothetical example for comparison purposesThe second line of each share class in the table on the following page allows youto compare the fund’s ongoing operating expenses with those of any other fund. Itprovides an example of the fund’s hypothetical account values and hypotheticalexpenses based on each class’s actual expense ratio and an assumed 5%annualized return before expenses (which is not the class’s actual return). Itassumes an account value of $1,000.00 on April 1, 2021, with the sameinvestment held until September 30, 2021. Look in any other fund shareholderreport to find its hypothetical example and you will be able to compare theseexpenses. Please remember that these hypothetical account values and expensesmay not be used to estimate the actual ending account balance or expenses youpaid for the period.
Your expenses
SEMIANNUAL REPORT | JOHN HANCOCK GLOBAL SHAREHOLDER YIELD FUND 7

Remember, these examples do not include any transaction costs, therefore, theseexamples will not help you to determine the relative total costs of owning differentfunds. If transaction costs were included, your expenses would have been higher.See the prospectuses for details regarding transaction costs.
SHAREHOLDER EXPENSE EXAMPLE CHART
Accountvalue on4-1-2021
Endingvalue on
9-30-2021
Expensespaid during
period ended9-30-20211
Annualizedexpense
ratio
Class A Actual expenses/actual returns $1,000.00 $1,027.20 $5.54 1.09%Hypothetical example 1,000.00 1,019.60 5.52 1.09%
Class C Actual expenses/actual returns 1,000.00 1,022.40 9.33 1.84%Hypothetical example 1,000.00 1,015.80 9.30 1.84%
Class I Actual expenses/actual returns 1,000.00 1,027.50 4.27 0.84%Hypothetical example 1,000.00 1,020.90 4.26 0.84%
Class R2 Actual expenses/actual returns 1,000.00 1,025.40 6.14 1.21%Hypothetical example 1,000.00 1,019.00 6.12 1.21%
Class R6 Actual expenses/actual returns 1,000.00 1,028.10 3.76 0.74%Hypothetical example 1,000.00 1,021.40 3.75 0.74%
Class NAV Actual expenses/actual returns 1,000.00 1,028.00 3.76 0.74%Hypothetical example 1,000.00 1,021.40 3.75 0.74%
1 Expenses are equal to the annualized expense ratio, multiplied by the average account value over the period,multiplied by 183/365 (to reflect the one-half year period).
8 JOHN HANCOCK GLOBAL SHAREHOLDER YIELD FUND | SEMIANNUAL REPORT

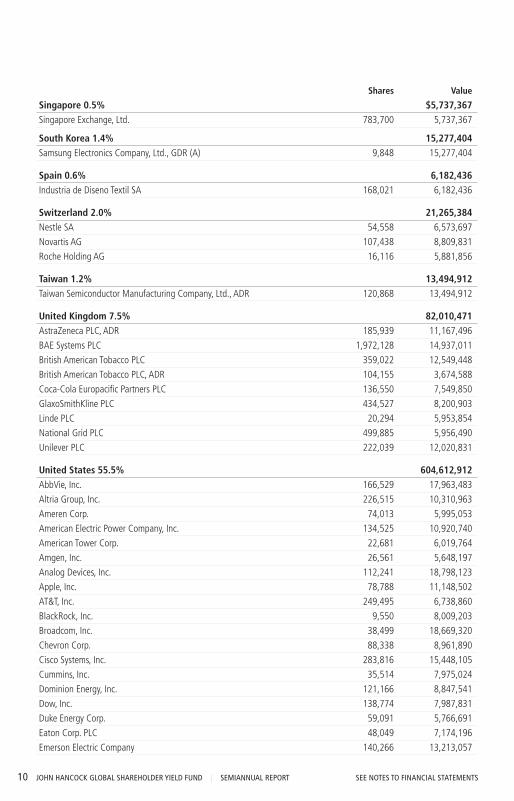
AS OF 9-30-21 (unaudited)Shares Value
Common stocks 97.7% $1,065,464,263(Cost $761,044,769)
Canada 8.5% 92,477,968BCE, Inc. 186,478 9,341,567
Fortis, Inc. 136,088 6,037,253
Great-West Lifeco, Inc. 316,047 9,616,652
Nutrien, Ltd. (New York Stock Exchange) 326,194 21,147,157
Restaurant Brands International, Inc. 267,127 16,345,501
Rogers Communications, Inc., Class B 122,360 5,714,191
Royal Bank of Canada 140,863 14,016,236
TELUS Corp. 466,759 10,259,411
France 5.0% 54,990,988AXA SA 425,276 11,785,738
Danone SA 82,966 5,656,432
Orange SA 844,284 9,130,785
Sanofi 132,208 12,726,832
TotalEnergies SE 328,283 15,691,201
Germany 8.0% 87,221,458Allianz SE 74,013 16,582,237
BASF SE 158,173 11,991,097
Bayer AG 98,485 5,345,304
Deutsche Post AG 213,682 13,399,911
Deutsche Telekom AG 725,725 14,553,781
Muenchener Rueckversicherungs-Gesellschaft AG 59,091 16,124,064
Siemens AG 56,405 9,225,064
Ireland 1.0% 10,894,169Medtronic PLC 86,910 10,894,169
Italy 2.8% 30,334,210Assicurazioni Generali SpA 521,671 11,048,532
Snam SpA 2,421,539 13,395,641
Terna - Rete Elettrica Nazionale 829,959 5,890,037
Japan 2.3% 25,449,796Takeda Pharmaceutical Company, Ltd. 335,000 11,049,231
Tokio Marine Holdings, Inc. 143,500 7,692,319
Toyota Motor Corp. 376,500 6,708,246
Norway 1.4% 15,514,788Orkla ASA 628,613 5,769,532
Telenor ASA 578,972 9,745,256
Fund’s investments
SEE NOTES TO FINANCIAL STATEMENTS SEMIANNUAL REPORT | JOHN HANCOCK GLOBAL SHAREHOLDER YIELD FUND 9
Shares Value
Singapore 0.5% $5,737,367Singapore Exchange, Ltd. 783,700 5,737,367
South Korea 1.4% 15,277,404Samsung Electronics Company, Ltd., GDR (A) 9,848 15,277,404
Spain 0.6% 6,182,436Industria de Diseno Textil SA 168,021 6,182,436
Switzerland 2.0% 21,265,384Nestle SA 54,558 6,573,697
Novartis AG 107,438 8,809,831
Roche Holding AG 16,116 5,881,856
Taiwan 1.2% 13,494,912Taiwan Semiconductor Manufacturing Company, Ltd., ADR 120,868 13,494,912
United Kingdom 7.5% 82,010,471AstraZeneca PLC, ADR 185,939 11,167,496
BAE Systems PLC 1,972,128 14,937,011
British American Tobacco PLC 359,022 12,549,448
British American Tobacco PLC, ADR 104,155 3,674,588
Coca-Cola Europacific Partners PLC 136,550 7,549,850
GlaxoSmithKline PLC 434,527 8,200,903
Linde PLC 20,294 5,953,854
National Grid PLC 499,885 5,956,490
Unilever PLC 222,039 12,020,831
United States 55.5% 604,612,912AbbVie, Inc. 166,529 17,963,483
Altria Group, Inc. 226,515 10,310,963
Ameren Corp. 74,013 5,995,053
American Electric Power Company, Inc. 134,525 10,920,740
American Tower Corp. 22,681 6,019,764
Amgen, Inc. 26,561 5,648,197
Analog Devices, Inc. 112,241 18,798,123
Apple, Inc. 78,788 11,148,502
AT&T, Inc. 249,495 6,738,860
BlackRock, Inc. 9,550 8,009,203
Broadcom, Inc. 38,499 18,669,320
Chevron Corp. 88,338 8,961,890
Cisco Systems, Inc. 283,816 15,448,105
Cummins, Inc. 35,514 7,975,024
Dominion Energy, Inc. 121,166 8,847,541
Dow, Inc. 138,774 7,987,831
Duke Energy Corp. 59,091 5,766,691
Eaton Corp. PLC 48,049 7,174,196
Emerson Electric Company 140,266 13,213,057
10 JOHN HANCOCK GLOBAL SHAREHOLDER YIELD FUND | SEMIANNUAL REPORT SEE NOTES TO FINANCIAL STATEMENTS
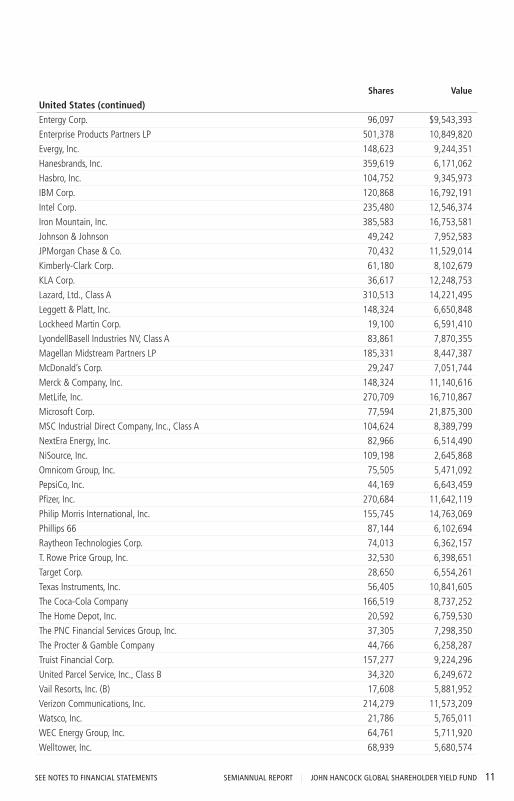
Shares Value
United States (continued)Entergy Corp. 96,097 $9,543,393
Enterprise Products Partners LP 501,378 10,849,820
Evergy, Inc. 148,623 9,244,351
Hanesbrands, Inc. 359,619 6,171,062
Hasbro, Inc. 104,752 9,345,973
IBM Corp. 120,868 16,792,191
Intel Corp. 235,480 12,546,374
Iron Mountain, Inc. 385,583 16,753,581
Johnson & Johnson 49,242 7,952,583
JPMorgan Chase & Co. 70,432 11,529,014
Kimberly-Clark Corp. 61,180 8,102,679
KLA Corp. 36,617 12,248,753
Lazard, Ltd., Class A 310,513 14,221,495
Leggett & Platt, Inc. 148,324 6,650,848
Lockheed Martin Corp. 19,100 6,591,410
LyondellBasell Industries NV, Class A 83,861 7,870,355
Magellan Midstream Partners LP 185,331 8,447,387
McDonald’s Corp. 29,247 7,051,744
Merck & Company, Inc. 148,324 11,140,616
MetLife, Inc. 270,709 16,710,867
Microsoft Corp. 77,594 21,875,300
MSC Industrial Direct Company, Inc., Class A 104,624 8,389,799
NextEra Energy, Inc. 82,966 6,514,490
NiSource, Inc. 109,198 2,645,868
Omnicom Group, Inc. 75,505 5,471,092
PepsiCo, Inc. 44,169 6,643,459
Pfizer, Inc. 270,684 11,642,119
Philip Morris International, Inc. 155,745 14,763,069
Phillips 66 87,144 6,102,694
Raytheon Technologies Corp. 74,013 6,362,157
T. Rowe Price Group, Inc. 32,530 6,398,651
Target Corp. 28,650 6,554,261
Texas Instruments, Inc. 56,405 10,841,605
The Coca-Cola Company 166,519 8,737,252
The Home Depot, Inc. 20,592 6,759,530
The PNC Financial Services Group, Inc. 37,305 7,298,350
The Procter & Gamble Company 44,766 6,258,287
Truist Financial Corp. 157,277 9,224,296
United Parcel Service, Inc., Class B 34,320 6,249,672
Vail Resorts, Inc. (B) 17,608 5,881,952
Verizon Communications, Inc. 214,279 11,573,209
Watsco, Inc. 21,786 5,765,011
WEC Energy Group, Inc. 64,761 5,711,920
Welltower, Inc. 68,939 5,680,574
SEE NOTES TO FINANCIAL STATEMENTS SEMIANNUAL REPORT | JOHN HANCOCK GLOBAL SHAREHOLDER YIELD FUND 11

Shares Value
United States (continued)WP Carey, Inc. 80,877 $5,907,256
Total investments (Cost $761,044,769) 97.7% $1,065,464,263
Other assets and liabilities, net 2.3% 24,856,801
Total net assets 100.0% $1,090,321,064
The percentage shown for each investment category is the total value of the category as a percentage of the net assets ofthe fund.
Security Abbreviations and Legend
ADR American Depositary Receipt
GDR Global Depositary Receipt
(A) These securities are exempt from registration under Rule 144A of the Securities Act of 1933. Such securities may be resold,normally to qualified institutional buyers, in transactions exempt from registration.
(B) Non-income producing security.
At 9-30-21, the aggregate cost of investments for federal income tax purposes was $763,964,214. Net unrealized appreciationaggregated to $301,500,049, of which $313,699,146 related to gross unrealized appreciation and $12,199,097 related to grossunrealized depreciation.
12 JOHN HANCOCK GLOBAL SHAREHOLDER YIELD FUND | SEMIANNUAL REPORT SEE NOTES TO FINANCIAL STATEMENTS
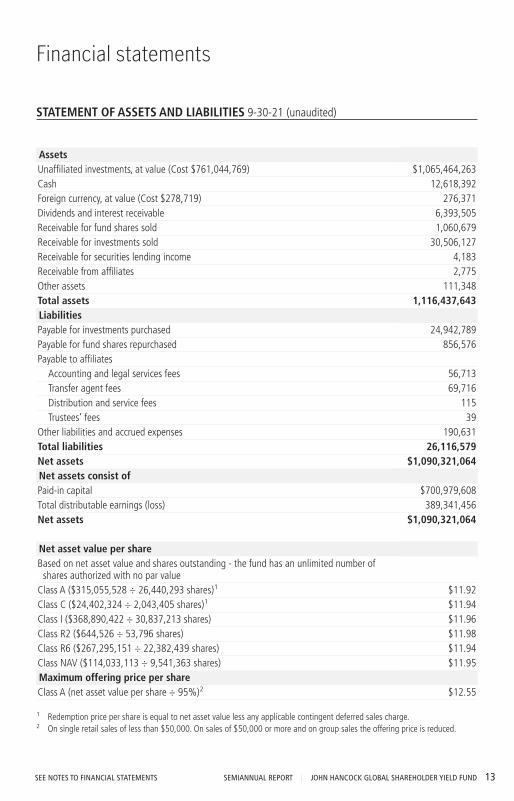
STATEMENT OF ASSETS AND LIABILITIES 9-30-21 (unaudited)
AssetsUnaffiliated investments, at value (Cost $761,044,769) $1,065,464,263Cash 12,618,392Foreign currency, at value (Cost $278,719) 276,371Dividends and interest receivable 6,393,505Receivable for fund shares sold 1,060,679Receivable for investments sold 30,506,127Receivable for securities lending income 4,183Receivable from affiliates 2,775Other assets 111,348Total assets 1,116,437,643LiabilitiesPayable for investments purchased 24,942,789Payable for fund shares repurchased 856,576Payable to affiliates
Accounting and legal services fees 56,713Transfer agent fees 69,716Distribution and service fees 115Trustees’ fees 39
Other liabilities and accrued expenses 190,631Total liabilities 26,116,579Net assets $1,090,321,064Net assets consist ofPaid-in capital $700,979,608Total distributable earnings (loss) 389,341,456Net assets $1,090,321,064
Net asset value per shareBased on net asset value and shares outstanding - the fund has an unlimited number of
shares authorized with no par valueClass A ($315,055,528 ÷ 26,440,293 shares)1 $11.92Class C ($24,402,324 ÷ 2,043,405 shares)1 $11.94Class I ($368,890,422 ÷ 30,837,213 shares) $11.96Class R2 ($644,526 ÷ 53,796 shares) $11.98Class R6 ($267,295,151 ÷ 22,382,439 shares) $11.94Class NAV ($114,033,113 ÷ 9,541,363 shares) $11.95Maximum offering price per shareClass A (net asset value per share ÷ 95%)2 $12.55
1 Redemption price per share is equal to net asset value less any applicable contingent deferred sales charge.2 On single retail sales of less than $50,000. On sales of $50,000 or more and on group sales the offering price is reduced.
Financial statements
SEE NOTES TO FINANCIAL STATEMENTS SEMIANNUAL REPORT | JOHN HANCOCK GLOBAL SHAREHOLDER YIELD FUND 13

STATEMENT OF OPERATIONS For the six months ended 9-30-21 (unaudited)
Investment incomeDividends $24,054,893Securities lending 122,232Interest 6,426Less foreign taxes withheld (1,482,805)Total investment income 22,700,746ExpensesInvestment management fees 4,617,327Distribution and service fees 633,018Accounting and legal services fees 81,385Transfer agent fees 444,805Trustees’ fees 14,486Custodian fees 133,582State registration fees 64,918Printing and postage 61,895Professional fees 47,233Other 41,781Total expenses 6,140,430Less expense reductions (940,361)Net expenses 5,200,069Net investment income 17,500,677Realized and unrealized gain (loss)Net realized gain (loss) onUnaffiliated investments and foreign currency transactions 48,117,721Affiliated investments 5,177
48,122,898Change in net unrealized appreciation (depreciation) ofUnaffiliated investments and translation of assets and liabilities in foreign currencies (32,522,792)Affiliated investments (6,201)
(32,528,993)Net realized and unrealized gain 15,593,905Increase in net assets from operations $33,094,582
14 JOHN HANCOCK GLOBAL SHAREHOLDER YIELD FUND | SEMIANNUAL REPORT SEE NOTES TO FINANCIAL STATEMENTS

STATEMENTS OF CHANGES IN NET ASSETS
Six months ended9-30-21
(unaudited)Year ended
3-31-21Increase (decrease) in net assetsFrom operationsNet investment income $17,500,677 $44,096,658Net realized gain 48,122,898 126,471,147Change in net unrealized appreciation (depreciation) (32,528,993) 367,816,897Increase in net assets resulting from operations 33,094,582 538,384,702Distributions to shareholdersFrom earningsClass A (4,324,149) (8,005,340)Class B
1— (5,944)
Class C (260,596) (722,643)Class I (5,689,901) (17,667,353)Class R2 (8,132) (15,041)Class R6 (4,152,887) (8,126,137)Class NAV (1,770,334) (9,486,100)Total distributions (16,205,999) (44,028,558)From fund share transactions (64,576,611) (833,898,075)Total decrease (47,688,028) (339,541,931)Net assetsBeginning of period 1,138,009,092 1,477,551,023End of period $1,090,321,064 $1,138,009,092
1 Share class was redesignated during the period. Refer to Note 5 for further details.
SEE NOTES TO FINANCIAL STATEMENTS SEMIANNUAL REPORT | JOHN HANCOCK GLOBAL SHAREHOLDER YIELD FUND 15

CLASS A SHARES Period ended 9-30-211 3-31-21 3-31-20 3-31-19 3-31-182 2-28-18 2-28-17
Per share operating performanceNet asset value, beginning of period $11.76 $8.62 $11.03 $11.14 $11.31 $10.78 $9.89Net investment income3 0.17 0.27 0.33 0.35 0.04 0.32 0.27
Net realized and unrealized gain (loss) oninvestments 0.15 3.16 (2.21) 0.16 (0.16) 0.53 0.92
Total from investment operations 0.32 3.43 (1.88) 0.51 (0.12) 0.85 1.19Less distributionsFrom net investment income (0.16) (0.29) (0.33) (0.35) (0.05) (0.32) (0.30)
From net realized gain — — (0.20) (0.27) — — —
Total distributions (0.16) (0.29) (0.53) (0.62) (0.05) (0.32) (0.30)Net asset value, end of period $11.92 $11.76 $8.62 $11.03 $11.14 $11.31 $10.78Total return (%)4,5 2.726 40.22 (17.96) 4.86 (1.03)6 7.87 12.21Ratios and supplemental dataNet assets, end of period (in millions) $315 $318 $257 $334 $348 $355 $381
Ratios (as a percentage of average netassets):
Expenses before reductions 1.297 1.29 1.29 1.28 1.307 1.27 1.29
Expenses including reductions 1.097 1.09 1.09 1.09 1.097 1.09 1.26
Net investment income 2.837 2.58 2.96 3.18 3.787 2.85 2.62
Portfolio turnover (%) 10 30 33 16 2 19 25
1 Six months ended 9-30-21. Unaudited.2 For the one-month period ended 3-31-18. The fund changed its fiscal year end from February 28 to March 31.3 Based on average daily shares outstanding.4 Total returns would have been lower had certain expenses not been reduced during the applicable periods.5 Does not reflect the effect of sales charges, if any.6 Not annualized.7 Annualized.
Financial highlights
16 JOHN HANCOCK GLOBAL SHAREHOLDER YIELD FUND | SEMIANNUAL REPORT SEE NOTES TO FINANCIAL STATEMENTS
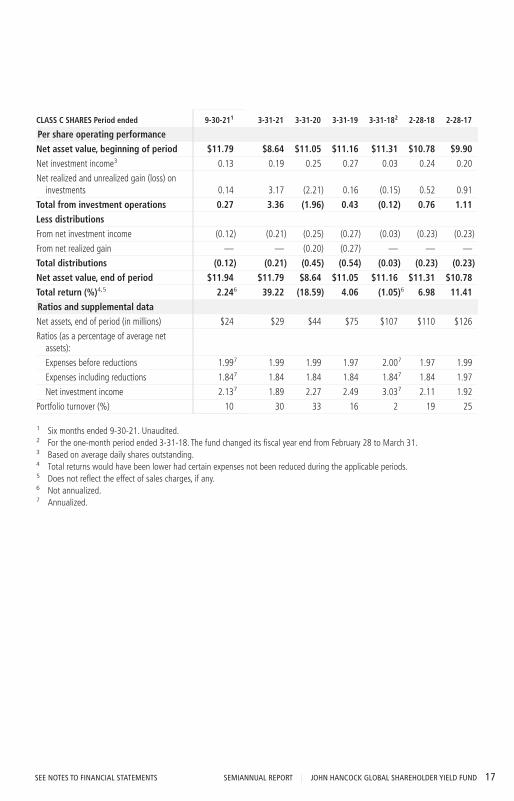
CLASS C SHARES Period ended 9-30-211 3-31-21 3-31-20 3-31-19 3-31-182 2-28-18 2-28-17
Per share operating performanceNet asset value, beginning of period $11.79 $8.64 $11.05 $11.16 $11.31 $10.78 $9.90Net investment income3 0.13 0.19 0.25 0.27 0.03 0.24 0.20
Net realized and unrealized gain (loss) oninvestments 0.14 3.17 (2.21) 0.16 (0.15) 0.52 0.91
Total from investment operations 0.27 3.36 (1.96) 0.43 (0.12) 0.76 1.11Less distributionsFrom net investment income (0.12) (0.21) (0.25) (0.27) (0.03) (0.23) (0.23)
From net realized gain — — (0.20) (0.27) — — —
Total distributions (0.12) (0.21) (0.45) (0.54) (0.03) (0.23) (0.23)Net asset value, end of period $11.94 $11.79 $8.64 $11.05 $11.16 $11.31 $10.78Total return (%)4,5 2.246 39.22 (18.59) 4.06 (1.05)6 6.98 11.41Ratios and supplemental dataNet assets, end of period (in millions) $24 $29 $44 $75 $107 $110 $126
Ratios (as a percentage of average netassets):
Expenses before reductions 1.997 1.99 1.99 1.97 2.007 1.97 1.99
Expenses including reductions 1.847 1.84 1.84 1.84 1.847 1.84 1.97
Net investment income 2.137 1.89 2.27 2.49 3.037 2.11 1.92
Portfolio turnover (%) 10 30 33 16 2 19 25
1 Six months ended 9-30-21. Unaudited.2 For the one-month period ended 3-31-18. The fund changed its fiscal year end from February 28 to March 31.3 Based on average daily shares outstanding.4 Total returns would have been lower had certain expenses not been reduced during the applicable periods.5 Does not reflect the effect of sales charges, if any.6 Not annualized.7 Annualized.
SEE NOTES TO FINANCIAL STATEMENTS SEMIANNUAL REPORT | JOHN HANCOCK GLOBAL SHAREHOLDER YIELD FUND 17
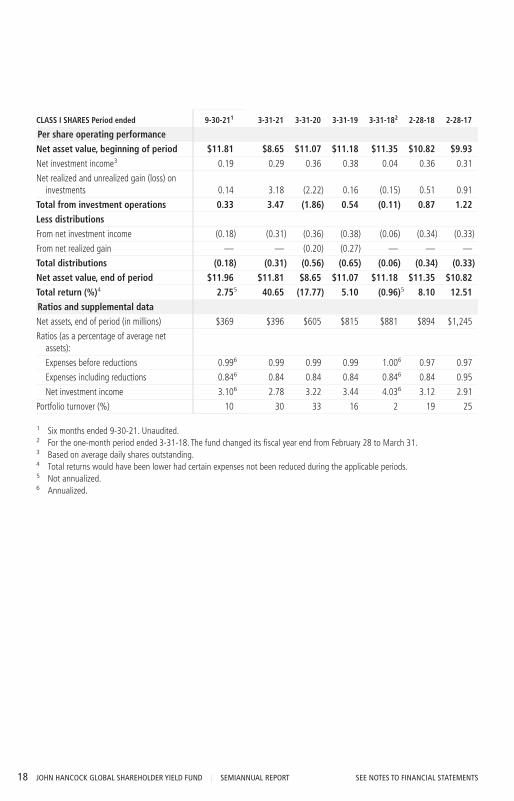
CLASS I SHARES Period ended 9-30-211 3-31-21 3-31-20 3-31-19 3-31-182 2-28-18 2-28-17
Per share operating performanceNet asset value, beginning of period $11.81 $8.65 $11.07 $11.18 $11.35 $10.82 $9.93Net investment income3 0.19 0.29 0.36 0.38 0.04 0.36 0.31
Net realized and unrealized gain (loss) oninvestments 0.14 3.18 (2.22) 0.16 (0.15) 0.51 0.91
Total from investment operations 0.33 3.47 (1.86) 0.54 (0.11) 0.87 1.22Less distributionsFrom net investment income (0.18) (0.31) (0.36) (0.38) (0.06) (0.34) (0.33)
From net realized gain — — (0.20) (0.27) — — —
Total distributions (0.18) (0.31) (0.56) (0.65) (0.06) (0.34) (0.33)Net asset value, end of period $11.96 $11.81 $8.65 $11.07 $11.18 $11.35 $10.82Total return (%)4 2.755 40.65 (17.77) 5.10 (0.96)5 8.10 12.51Ratios and supplemental dataNet assets, end of period (in millions) $369 $396 $605 $815 $881 $894 $1,245
Ratios (as a percentage of average netassets):
Expenses before reductions 0.996 0.99 0.99 0.99 1.006 0.97 0.97
Expenses including reductions 0.846 0.84 0.84 0.84 0.846 0.84 0.95
Net investment income 3.106 2.78 3.22 3.44 4.036 3.12 2.91
Portfolio turnover (%) 10 30 33 16 2 19 25
1 Six months ended 9-30-21. Unaudited.2 For the one-month period ended 3-31-18. The fund changed its fiscal year end from February 28 to March 31.3 Based on average daily shares outstanding.4 Total returns would have been lower had certain expenses not been reduced during the applicable periods.5 Not annualized.6 Annualized.
18 JOHN HANCOCK GLOBAL SHAREHOLDER YIELD FUND | SEMIANNUAL REPORT SEE NOTES TO FINANCIAL STATEMENTS

CLASS R2 SHARES Period ended 9-30-211 3-31-21 3-31-20 3-31-19 3-31-182 2-28-18 2-28-17
Per share operating performanceNet asset value, beginning of period $11.83 $8.66 $11.08 $11.19 $11.35 $10.82 $9.93Net investment income3 0.17 0.25 0.32 0.33 0.03 0.30 0.26
Net realized and unrealized gain (loss) oninvestments 0.13 3.19 (2.22) 0.16 (0.14) 0.53 0.92
Total from investment operations 0.30 3.44 (1.90) 0.49 (0.11) 0.83 1.18Less distributionsFrom net investment income (0.15) (0.27) (0.32) (0.33) (0.05) (0.30) (0.29)
From net realized gain — — (0.20) (0.27) — — —
Total distributions (0.15) (0.27) (0.52) (0.60) (0.05) (0.30) (0.29)Net asset value, end of period $11.98 $11.83 $8.66 $11.08 $11.19 $11.35 $10.82Total return (%)4 2.545 40.19 (18.10) 4.68 (0.98)5 7.68 12.04Ratios and supplemental dataNet assets, end of period (in millions) $1 $1 $1 $1 $1 $1 $1
Ratios (as a percentage of average netassets):
Expenses before reductions 1.346 1.35 1.34 1.36 1.386 1.37 1.36
Expenses including reductions 1.216 1.23 1.22 1.22 1.246 1.24 1.34
Net investment income 2.726 2.45 2.86 3.02 3.626 2.62 2.50
Portfolio turnover (%) 10 30 33 16 2 19 25
1 Six months ended 9-30-21. Unaudited.2 For the one-month period ended 3-31-18. The fund changed its fiscal year end from February 28 to March 31.3 Based on average daily shares outstanding.4 Total returns would have been lower had certain expenses not been reduced during the applicable periods.5 Not annualized.6 Annualized.
SEE NOTES TO FINANCIAL STATEMENTS SEMIANNUAL REPORT | JOHN HANCOCK GLOBAL SHAREHOLDER YIELD FUND 19

CLASS R6 SHARES Period ended 9-30-211 3-31-21 3-31-20 3-31-19 3-31-182 2-28-18 2-28-17
Per share operating performanceNet asset value, beginning of period $11.79 $8.64 $11.06 $11.16 $11.34 $10.81 $9.92Net investment income3 0.20 0.30 0.37 0.39 0.04 0.31 0.30
Net realized and unrealized gain (loss) oninvestments 0.14 3.17 (2.22) 0.17 (0.16) 0.57 0.93
Total from investment operations 0.34 3.47 (1.85) 0.56 (0.12) 0.88 1.23Less distributionsFrom net investment income (0.19) (0.32) (0.37) (0.39) (0.06) (0.35) (0.34)
From net realized gain — — (0.20) (0.27) — — —
Total distributions (0.19) (0.32) (0.57) (0.66) (0.06) (0.35) (0.34)Net asset value, end of period $11.94 $11.79 $8.64 $11.06 $11.16 $11.34 $10.81Total return (%)4 2.815 40.72 (17.69) 5.31 (1.03)5 8.22 12.66Ratios and supplemental dataNet assets, end of period (in millions) $267 $275 $245 $351 $477 $483 $2
Ratios (as a percentage of average netassets):
Expenses before reductions 0.896 0.88 0.88 0.88 0.896 0.87 0.87
Expenses including reductions 0.746 0.74 0.74 0.74 0.746 0.74 0.85
Net investment income 3.196 2.94 3.34 3.57 4.136 2.61 2.85
Portfolio turnover (%) 10 30 33 16 2 19 25
1 Six months ended 9-30-21. Unaudited.2 For the one-month period ended 3-31-18. The fund changed its fiscal year end from February 28 to March 31.3 Based on average daily shares outstanding.4 Total returns would have been lower had certain expenses not been reduced during the applicable periods.5 Not annualized.6 Annualized.
20 JOHN HANCOCK GLOBAL SHAREHOLDER YIELD FUND | SEMIANNUAL REPORT SEE NOTES TO FINANCIAL STATEMENTS

CLASS NAV SHARES Period ended 9-30-211 3-31-21 3-31-20 3-31-19 3-31-182 2-28-18 2-28-17
Per share operating performanceNet asset value, beginning of period $11.80 $8.64 $11.06 $11.17 $11.34 $10.81 $9.92Net investment income3 0.20 0.29 0.37 0.39 0.04 0.36 0.32
Net realized and unrealized gain (loss) oninvestments 0.14 3.19 (2.22) 0.16 (0.15) 0.52 0.91
Total from investment operations 0.34 3.48 (1.85) 0.55 (0.11) 0.88 1.23Less distributionsFrom net investment income (0.19) (0.32) (0.37) (0.39) (0.06) (0.35) (0.34)
From net realized gain — — (0.20) (0.27) — — —
Total distributions (0.19) (0.32) (0.57) (0.66) (0.06) (0.35) (0.34)Net asset value, end of period $11.95 $11.80 $8.64 $11.06 $11.17 $11.34 $10.81Total return (%)4 2.805 40.83 (17.77) 5.30 (0.94)5 8.11 12.76Ratios and supplemental dataNet assets, end of period (in millions) $114 $120 $325 $458 $511 $514 $535
Ratios (as a percentage of average netassets):
Expenses before reductions 0.876 0.87 0.87 0.87 0.886 0.86 0.86
Expenses including reductions 0.746 0.74 0.74 0.74 0.746 0.74 0.85
Net investment income 3.206 2.87 3.32 3.54 4.136 3.19 3.03
Portfolio turnover (%) 10 30 33 16 2 19 25
1 Six months ended 9-30-21. Unaudited.2 For the one-month period ended 3-31-18. The fund changed its fiscal year end from February 28 to March 31.3 Based on average daily shares outstanding.4 Total returns would have been lower had certain expenses not been reduced during the applicable periods.5 Not annualized.6 Annualized.
SEE NOTES TO FINANCIAL STATEMENTS SEMIANNUAL REPORT | JOHN HANCOCK GLOBAL SHAREHOLDER YIELD FUND 21

Note 1 — Organization
John Hancock Global Shareholder Yield Fund (the fund) is a series of John Hancock Funds III (the Trust), anopen-end management investment company organized as a Massachusetts business trust and registered underthe Investment Company Act of 1940, as amended (the 1940 Act). The investment objective of the fund is to seekto provide a high level of income as its primary objective. Capital appreciation is a secondary investment objective.
The fund may offer multiple classes of shares. The shares currently outstanding are detailed in the Statement ofassets and liabilities. Class A and Class C shares are offered to all investors. Class I shares are offered toinstitutions and certain investors. Class R2 shares are available only to certain retirement and 529 plans. Class R6shares are only available to certain retirement plans, institutions and other investors. Class NAV shares are offeredto John Hancock affiliated funds of funds, retirement plans for employees of John Hancock and/or ManulifeFinancial Corporation, and certain 529 plans. Class C shares convert to Class A shares eight years after purchase(certain exclusions may apply). Shareholders of each class have exclusive voting rights to matters that affect thatclass. The distribution and service fees, if any, and transfer agent fees for each class may differ.
Note 2 — Significant accounting policies
The financial statements have been prepared in conformity with accounting principles generally accepted in theUnited States of America (US GAAP), which require management to make certain estimates and assumptions as ofthe date of the financial statements. Actual results could differ from those estimates and those differences couldbe significant. The fund qualifies as an investment company under Topic 946 of Accounting Standards Codificationof US GAAP.
Events or transactions occurring after the end of the fiscal period through the date that the financial statementswere issued have been evaluated in the preparation of the financial statements. The following summarizes thesignificant accounting policies of the fund:
Security valuation. Investments are stated at value as of the scheduled close of regular trading on the New YorkStock Exchange (NYSE), normally at 4:00 P.M., Eastern Time. In case of emergency or other disruption resulting inthe NYSE not opening for trading or the NYSE closing at a time other than the regularly scheduled close, the netasset value (NAV) may be determined as of the regularly scheduled close of the NYSE pursuant to the fund’sValuation Policies and Procedures.
In order to value the securities, the fund uses the following valuation techniques: Equity securities, includingexchange-traded or closed-end funds, are typically valued at the last sale price or official closing price on theexchange or principal market where the security trades. In the event there were no sales during the day or closingprices are not available, the securities are valued using the last available bid price. Foreign securities andcurrencies are valued in U.S. dollars based on foreign currency exchange rates supplied by an independent pricingvendor.
In certain instances, the Pricing Committee may determine to value equity securities using prices obtained fromanother exchange or market if trading on the exchange or market on which prices are typically obtained did notopen for trading as scheduled, or if trading closed earlier than scheduled, and trading occurred as normal onanother exchange or market.
Other portfolio securities and assets, for which reliable market quotations are not readily available, are valued atfair value as determined in good faith by the fund’s Pricing Committee following procedures established by theBoard of Trustees. The frequency with which these fair valuation procedures are used cannot be predicted and fairvalue of securities may differ significantly from the value that would have been used had a ready market for suchsecurities existed. Trading in foreign securities may be completed before the scheduled daily close of trading on theNYSE. Significant events at the issuer or market level may affect the values of securities between the time whenthe valuation of the securities is generally determined and the close of the NYSE. If a significant event occurs,these securities may be fair valued, as determined in good faith by the fund’s Pricing Committee, following
Notes to financial statements (unaudited)
22 JOHN HANCOCK GLOBAL SHAREHOLDER YIELD FUND | SEMIANNUAL REPORT

procedures established by the Board of Trustees. The fund uses fair value adjustment factors provided by anindependent pricing vendor to value certain foreign securities in order to adjust for events that may occur betweenthe close of foreign exchanges or markets and the close of the NYSE.
The fund uses a three-tier hierarchy to prioritize the pricing assumptions, referred to as inputs, used in valuationtechniques to measure fair value. Level 1 includes securities valued using quoted prices in active markets foridentical securities, including registered investment companies. Level 2 includes securities valued using othersignificant observable inputs. Observable inputs may include quoted prices for similar securities, interest rates,prepayment speeds and credit risk. Prices for securities valued using these inputs are received from independentpricing vendors and brokers and are based on an evaluation of the inputs described. Level 3 includes securitiesvalued using significant unobservable inputs when market prices are not readily available or reliable, including thefund’s own assumptions in determining the fair value of investments. Factors used in determining value mayinclude market or issuer specific events or trends, changes in interest rates and credit quality. The inputs ormethodology used for valuing securities are not necessarily an indication of the risks associated with investing inthose securities. Changes in valuation techniques and related inputs may result in transfers into or out of anassigned level within the disclosure hierarchy.
The following is a summary of the values by input classification of the fund’s investments as of September 30,2021, by major security category or type:
Totalvalue at9-30-21
Level 1quoted
price
Level 2significantobservable
inputs
Level 3significant
unobservableinputs
Investments in securities:
Assets
Common stocks
Canada $92,477,968 $92,477,968 — —
France 54,990,988 — $54,990,988 —
Germany 87,221,458 — 87,221,458 —
Ireland 10,894,169 10,894,169 — —
Italy 30,334,210 — 30,334,210 —
Japan 25,449,796 — 25,449,796 —
Norway 15,514,788 — 15,514,788 —
Singapore 5,737,367 — 5,737,367 —
South Korea 15,277,404 — 15,277,404 —
Spain 6,182,436 — 6,182,436 —
Switzerland 21,265,384 — 21,265,384 —
Taiwan 13,494,912 13,494,912 — —
United Kingdom 82,010,471 28,345,788 53,664,683 —
United States 604,612,912 604,612,912 — —
Total investments in securities $1,065,464,263 $749,825,749 $315,638,514 —
Real estate investment trusts. The fund may invest in real estate investment trusts (REITs). Distributions fromREITs may be recorded as income and subsequently characterized by the REIT at the end of their fiscal year as areduction of cost of investments and/or as a realized gain. As a result, the fund will estimate the components ofdistributions from these securities. Such estimates are revised when the actual components of the distributions areknown.
SEMIANNUAL REPORT | JOHN HANCOCK GLOBAL SHAREHOLDER YIELD FUND 23

Security transactions and related investment income. Investment security transactions are accounted foron a trade date plus one basis for daily NAV calculations. However, for financial reporting purposes, investmenttransactions are reported on trade date. Interest income is accrued as earned. Dividend income is recorded onex-date, except for dividends of certain foreign securities where the dividend may not be known until after theex-date. In those cases, dividend income, net of withholding taxes, is recorded when the fund becomes aware ofthe dividends. Non-cash dividends, if any, are recorded at the fair market value of the securities received. Gainsand losses on securities sold are determined on the basis of identified cost and may include proceeds fromlitigation.
Securities lending. The fund may lend its securities to earn additional income. The fund receives collateral fromthe borrower in an amount not less than the market value of the loaned securities. The fund will invest its cashcollateral in John Hancock Collateral Trust (JHCT), an affiliate of the fund, which has a floating NAV and isregistered with the Securities and Exchange Commission (SEC) as an investment company. JHCT invests inshort-term money market investments. The fund will receive the benefit of any gains and bear any lossesgenerated by JHCT with respect to the cash collateral.
The fund has the right to recall loaned securities on demand. If a borrower fails to return loaned securities whendue, then the lending agent is responsible and indemnifies the fund for the lent securities. The lending agent usesthe collateral received from the borrower to purchase replacement securities of the same issue, type, class andseries of the loaned securities. If the value of the collateral is less than the purchase cost of replacement securities,the lending agent is responsible for satisfying the shortfall but only to the extent that the shortfall is not due toany decrease in the value of JHCT.
Although the risk of loss on securities lent is mitigated by receiving collateral from the borrower and throughlending agent indemnification, the fund could experience a delay in recovering securities or could experience alower than expected return if the borrower fails to return the securities on a timely basis. The fund receivescompensation for lending its securities by retaining a portion of the return on the investment of the collateral andcompensation from fees earned from borrowers of the securities. Securities lending income received by the fund isnet of fees retained by the securities lending agent. Net income received from JHCT is a component of securitieslending income as recorded on the Statement of operations. As of September 30, 2021, there were no securitieson loan.
Foreign investing. Assets, including investments, and liabilities denominated in foreign currencies are translatedinto U.S. dollar values each day at the prevailing exchange rate. Purchases and sales of securities, income andexpenses are translated into U.S. dollars at the prevailing exchange rate on the date of the transaction. The effectof changes in foreign currency exchange rates on the value of securities is reflected as a component of the realizedand unrealized gains (losses) on investments. Foreign investments are subject to a decline in the value of a foreigncurrency versus the U.S. dollar, which reduces the dollar value of securities denominated in that currency.
Funds that invest internationally generally carry more risk than funds that invest strictly in U.S. securities. Risks canresult from differences in economic and political conditions, regulations, market practices (including highertransaction costs), accounting standards and other factors.
Foreign taxes. The fund may be subject to withholding tax on income, capital gains or repatriations imposed bycertain countries, a portion of which may be recoverable. Foreign taxes are accrued based upon the fund’sunderstanding of the tax rules and rates that exist in the foreign markets in which it invests. Taxes are accruedbased on gains realized by the fund as a result of certain foreign security sales. In certain circumstances, estimatedtaxes are accrued based on unrealized appreciation of such securities. Investment income is recorded net offoreign withholding taxes.
Overdraft. The fund may have the ability to borrow from banks for temporary or emergency purposes, includingmeeting redemption requests that otherwise might require the untimely sale of securities. Pursuant to the fund’scustodian agreement, the custodian may loan money to the fund to make properly authorized payments. The fund
24 JOHN HANCOCK GLOBAL SHAREHOLDER YIELD FUND | SEMIANNUAL REPORT

is obligated to repay the custodian for any overdraft, including any related costs or expenses. The custodian mayhave a lien, security interest or security entitlement in any fund property that is not otherwise segregated orpledged, to the extent of any overdraft, and to the maximum extent permitted by law.
Line of credit. The fund and other affiliated funds have entered into a syndicated line of credit agreement withCitibank, N.A. as the administrative agent that enables them to participate in a $1 billion unsecured committedline of credit. Excluding commitments designated for a certain fund and subject to the needs of all other affiliatedfunds, the fund can borrow up to an aggregate commitment amount of $750 million, subject to asset coverageand other limitations as specified in the agreement. Prior to June 24, 2021, the fund could borrow up to anaggregate commitment amount of $850 million. A commitment fee payable at the end of each calendar quarter,based on the average daily unused portion of the line of credit, is charged to each participating fund based on acombination of fixed and asset-based allocations and is reflected in Other expenses on the Statement ofoperations. Commitment fees for the six months ended September 30, 2021 were $5,265.
Expenses. Within the John Hancock group of funds complex, expenses that are directly attributable to anindividual fund are allocated to such fund. Expenses that are not readily attributable to a specific fund areallocated among all funds in an equitable manner, taking into consideration, among other things, the nature andtype of expense and the fund’s relative net assets. Expense estimates are accrued in the period to which theyrelate and adjustments are made when actual amounts are known.
Class allocations. Income, common expenses and realized and unrealized gains (losses) are determined at thefund level and allocated daily to each class of shares based on the net assets of the class. Class-specific expenses,such as distribution and service fees, if any, and transfer agent fees, for all classes, are charged daily at the classlevel based on the net assets of each class and the specific expense rates applicable to each class.
Federal income taxes. The fund intends to continue to qualify as a regulated investment company by complyingwith the applicable provisions of the Internal Revenue Code and will not be subject to federal income tax ontaxable income that is distributed to shareholders. Therefore, no federal income tax provision is required.
As of March 31, 2021, the fund had no uncertain tax positions that would require financial statement recognition,derecognition or disclosure. The fund’s federal tax returns are subject to examination by the Internal RevenueService for a period of three years.
Distribution of income and gains. Distributions to shareholders from net investment income and net realizedgains, if any, are recorded on the ex-date. The fund generally declares and pays dividends quarterly. Capital gaindistributions, if any, are typically distributed annually.
Distributions paid by the fund with respect to each class of shares are calculated in the same manner, at the sametime and in the same amount, except for the effect of class level expenses that may be applied differently to eachclass.
Such distributions, on a tax basis, are determined in conformity with income tax regulations, which may differ fromUS GAAP. Distributions in excess of tax basis earnings and profits, if any, are reported in the fund’s financialstatements as a return of capital. The final determination of tax characteristics of the distribution will occur at theend of the year and will subsequently be reported to shareholders.
Capital accounts within the financial statements are adjusted for permanent book-tax differences. Theseadjustments have no impact on net assets or the results of operations. Temporary book-tax differences, if any, willreverse in a subsequent period. Book-tax differences are primarily attributable to partnerships and wash sale lossdeferrals.
SEMIANNUAL REPORT | JOHN HANCOCK GLOBAL SHAREHOLDER YIELD FUND 25

Note 3 — Guarantees and indemnifications
Under the Trust’s organizational documents, its Officers and Trustees are indemnified against certain liabilitiesarising out of the performance of their duties to the Trust, including the fund. Additionally, in the normal course ofbusiness, the fund enters into contracts with service providers that contain general indemnification clauses. Thefund’s maximum exposure under these arrangements is unknown, as this would involve future claims that may bemade against the fund that have not yet occurred. The risk of material loss from such claims is considered remote.
Note 4 — Fees and transactions with affiliates
John Hancock Investment Management LLC (the Advisor) serves as investment advisor for the fund. John HancockInvestment Management Distributors LLC (the Distributor), an affiliate of the Advisor, serves as principalunderwriter of the fund. The Advisor and the Distributor are indirect, principally owned subsidiaries of ManulifeFinancial Corporation.
Management fee. The fund has an investment management agreement with the Advisor under which the fundpays a daily management fee to the Advisor, equivalent on an annual basis to the sum of 0.800% of average dailynet assets. The Advisor has a subadvisory agreement with Epoch Investment Partners, Inc. The fund is notresponsible for payment of the subadvisory fees.
The Advisor has contractually agreed to waive a portion of its management fee and/or reimburse expenses forcertain funds of the John Hancock group of funds complex, including the fund (the participating portfolios). Thiswaiver is based upon aggregate net assets of all the participating portfolios. The amount of the reimbursement iscalculated daily and allocated among all the participating portfolios in proportion to the daily net assets of eachfund. During the six months ended September 30, 2021, this waiver amounted to 0.01% of the fund’s averagedaily net assets, on an annualized basis. This arrangement expires on July 31, 2023, unless renewed by mutualagreement of the fund and the Advisor based upon a determination that this is appropriate under thecircumstances at that time.
The Advisor contractually agrees to reduce its management fee or, if necessary, make payment to the applicableclass in an amount equal to the amount by which expenses of Class A, Class C, Class I, Class R2, and Class R6shares, as applicable, exceed 1.09%, 1.84%, 0.84%, 1.24%, and 0.74%, respectively, of average net assetsattributable to the applicable class. For purposes of this agreement, “expenses of Class A, Class C, Class I,Class R2, and Class R6 shares” means all class expenses (including fund expenses attributable to the class),excluding taxes, brokerage commissions, interest expense, litigation and indemnification expenses and otherextraordinary expenses not incurred in the ordinary course of the fund’s business, acquired fund fees and expensespaid indirectly, and short dividend expense. This agreement expires on July 31, 2022, unless renewed by mutualagreement of the fund and the Advisor based on upon a determination that this is appropriate under thecircumstances at that time.
The Advisor has voluntarily agreed to reduce its management fee for the fund, or if necessary, make payment tothe fund, in an amount equal to the amount by which the fund’s expenses exceed 0.74% of average net assets, onan annualized basis. Expenses means all the expenses of the fund, excluding taxes, brokerage commissions,interest expense, litigation and indemnification expenses and other extraordinary expenses not incurred in theordinary course of the fund’s business, class-specific expenses, prime brokerage fees, acquired fund fees andexpenses paid indirectly, and short dividend expense. This voluntary expense reduction will continue in effect untilterminated at any time by the Advisor on notice to the fund.
26 JOHN HANCOCK GLOBAL SHAREHOLDER YIELD FUND | SEMIANNUAL REPORT

For the six months ended September 30, 2021, the expense reductions described above amounted to thefollowing:
Class Expense reduction
Class A $330,239Class C 20,871Class I 301,419Class R2 451
Class Expense reduction
Class R6 $205,520Class NAV 81,861Total $940,361
Expenses waived or reimbursed in the current fiscal period are not subject to recapture in future fiscal periods.
The investment management fees, including the impact of the waivers and reimbursements as described above,incurred for the six months ended September 30, 2021, were equivalent to a net annual effective rate of 0.64% ofthe fund’s average daily net assets.
Accounting and legal services. Pursuant to a service agreement, the fund reimburses the Advisor for allexpenses associated with providing the administrative, financial, legal, compliance, accounting and recordkeepingservices to the fund, including the preparation of all tax returns, periodic reports to shareholders and regulatoryreports, among other services. These expenses are allocated to each share class based on its relative net assets atthe time the expense was incurred. These accounting and legal services fees incurred, for the six months endedSeptember 30, 2021, amounted to an annual rate of 0.01% of the fund’s average daily net assets.
Distribution and service plans. The fund has a distribution agreement with the Distributor. The fund hasadopted distribution and service plans for certain classes as detailed below pursuant to Rule 12b-1 under the1940 Act, to pay the Distributor for services provided as the distributor of shares of the fund. In addition, under aservice plan for certain classes as detailed below, the fund pays for certain other services. The fund may pay up tothe following contractual rates of distribution and service fees under these arrangements, expressed as an annualpercentage of average daily net assets for each class of the fund’s shares:
Class Rule 12b-1 Fee Service fee
Class A 0.30% —Class C 1.00% —Class R2 0.25% 0.25%
Sales charges. Class A shares are assessed up-front sales charges, which resulted in payments to the Distributoramounting to $114,238 for the six months ended September 30, 2021. Of this amount, $19,725 was retainedand used for printing prospectuses, advertising, sales literature and other purposes and $94,513 was paid as salescommissions to broker-dealers.
Class A and Class C shares may be subject to contingent deferred sales charges (CDSCs). Certain Class A sharespurchased, including those that are acquired through purchases of $1 million or more, and redeemed within oneyear of purchase are subject to a 1.00% sales charge. Class C shares that are redeemed within one year ofpurchase are subject to a 1.00% CDSC. CDSCs are applied to the lesser of the current market value at the time ofredemption or the original purchase cost of the shares being redeemed. Proceeds from CDSCs are used tocompensate the Distributor for providing distribution-related services in connection with the sale of these shares.During the six months ended September 30, 2021, CDSCs received by the Distributor amounted to $604 and $226for Class A and Class C shares, respectively.
Transfer agent fees. The John Hancock group of funds has a complex-wide transfer agent agreement with JohnHancock Signature Services, Inc. (Signature Services), an affiliate of the Advisor. The transfer agent fees paid toSignature Services are determined based on the cost to Signature Services (Signature Services Cost) of providingrecordkeeping services. It also includes out-of-pocket expenses, including payments made to third-parties forrecordkeeping services provided to their clients who invest in one or more John Hancock funds. In addition,
SEMIANNUAL REPORT | JOHN HANCOCK GLOBAL SHAREHOLDER YIELD FUND 27

Signature Services Cost may be reduced by certain fees that Signature Services receives in connection withretirement and small accounts. Signature Services Cost is calculated monthly and allocated, as applicable, to fivecategories of share classes: Retail Share and Institutional Share Classes of Non-Municipal Bond Funds, Class R6Shares, Retirement Share Classes and Municipal Bond Share Classes. Within each of these categories, theapplicable costs are allocated to the affected John Hancock affiliated funds and/or classes, based on the relativeaverage daily net assets.
Class level expenses. Class level expenses for the six months ended September 30, 2021 were as follows:
Class Distribution and service fees Transfer agent fees
Class A $491,738 $187,362Class C 139,776 15,831Class I — 228,161Class R2 1,504 32Class R6 — 13,419Total $633,018 $444,805
Trustee expenses. The fund compensates each Trustee who is not an employee of the Advisor or its affiliates. Thecosts of paying Trustee compensation and expenses are allocated to the fund based on its net assets relative toother funds within the John Hancock group of funds complex.
Interfund lending program. Pursuant to an Exemptive Order issued by the SEC, the fund, along with certainother funds advised by the Advisor or its affiliates, may participate in an interfund lending program. This programprovides an alternative credit facility allowing the fund to borrow from, or lend money to, other participatingaffiliated funds. At period end, no interfund loans were outstanding. Interest expense is included in Other expenseson the Statement of operations. The fund’s activity in this program during the period for which loans wereoutstanding was as follows:
Borroweror Lender
Weighted AverageLoan Balance
DaysOutstanding
Weighted AverageInterest Rate
Interest Income(Expense)
Borrower $5,900,000 1 0.550% ($90)
Note 5 — Fund share transactions
Transactions in fund shares for the six months ended September 30, 2021 and for the year ended March 31, 2021were as follows:
Six Months Ended 9-30-21 Year Ended 3-31-21
Shares Amount Shares Amount
Class A shares
Sold 1,554,037 $19,116,865 4,201,152 $43,177,068
Distributions reinvested 344,507 4,211,290 751,659 7,812,460
Repurchased (2,453,686) (30,125,608) (7,791,441) (80,038,962)
Net decrease (555,142) $(6,797,453) (2,838,630) $(29,049,434)
28 JOHN HANCOCK GLOBAL SHAREHOLDER YIELD FUND | SEMIANNUAL REPORT

Six Months Ended 9-30-21 Year Ended 3-31-21
Shares Amount Shares Amount
Class B shares
Sold — — 10 $85
Distributions reinvested — — 587 5,650
Repurchased — — (97,457) (974,795)
Net decrease — — (96,860) $(969,060)
Class C shares
Sold 62,298 $765,114 65,566 $667,126
Distributions reinvested 21,197 259,789 69,731 713,734
Repurchased (516,801) (6,368,331) (2,755,813) (28,402,815)
Net decrease (433,306) $(5,343,428) (2,620,516) $(27,021,955)
Class I shares
Sold 1,691,201 $20,876,995 10,347,471 $106,008,666
Distributions reinvested 457,964 5,619,638 1,702,358 17,544,070
Repurchased (4,866,130) (60,203,799) (48,411,827) (533,916,191)
Net decrease (2,716,965) $(33,707,166) (36,361,998) $(410,363,455)
Class R2 shares
Sold 1,943 $24,088 6,371 $65,071
Distributions reinvested 654 8,041 1,425 14,882
Repurchased (1,858) (23,449) (18,289) (184,126)
Net increase (decrease) 739 $8,680 (10,493) $(104,173)
Class R6 shares
Sold 1,510,917 $18,593,827 4,503,509 $46,050,096
Distributions reinvested 338,923 4,151,973 781,802 8,123,971
Repurchased (2,760,961) (33,957,721) (10,376,583) (106,946,272)
Net decrease (911,121) $(11,211,921) (5,091,272) $(52,772,205)
Class NAV shares
Sold 154,280 $1,899,935 954,449 $9,185,908
Distributions reinvested 144,393 1,770,334 931,068 9,486,100
Repurchased (906,286) (11,195,592) (29,323,493) (332,289,801)
Net decrease (607,613) $(7,525,323) (27,437,976) $(313,617,793)
Total net decrease (5,223,408) $(64,576,611) (74,457,745) $(833,898,075)
Affiliates of the fund owned 100% of shares of Class NAV on September 30, 2021. Such concentration ofshareholders’ capital could have a material effect on the fund if such shareholders redeem from the fund.
On June 25, 2020, the Board of Trustees approved redesignations of certain share classes. As a result of theredesignations, Class B was terminated, and shareholders in this class became shareholders of the respective classidentified below, with the same or lower total net expenses. The following amount is included in the amountrepurchased of the terminated class and the amount sold of the redesignated class.
SEMIANNUAL REPORT | JOHN HANCOCK GLOBAL SHAREHOLDER YIELD FUND 29
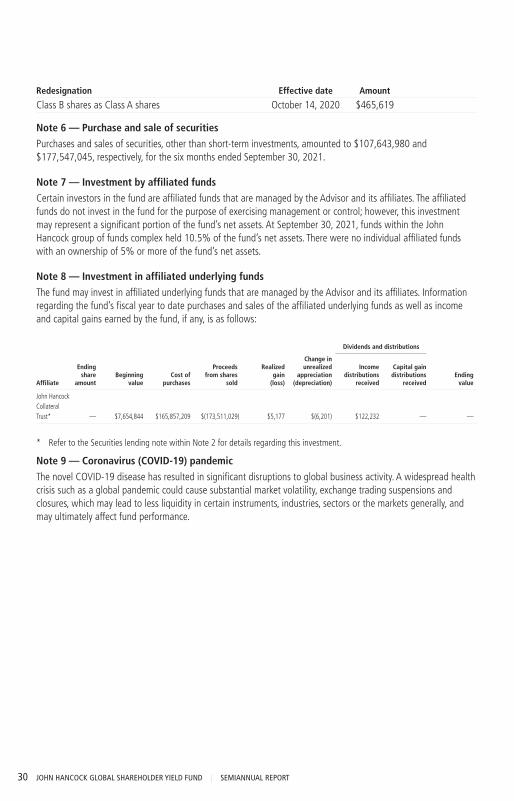
Redesignation Effective date Amount
Class B shares as Class A shares October 14, 2020 $465,619
Note 6 — Purchase and sale of securities
Purchases and sales of securities, other than short-term investments, amounted to $107,643,980 and$177,547,045, respectively, for the six months ended September 30, 2021.
Note 7 — Investment by affiliated funds
Certain investors in the fund are affiliated funds that are managed by the Advisor and its affiliates. The affiliatedfunds do not invest in the fund for the purpose of exercising management or control; however, this investmentmay represent a significant portion of the fund’s net assets. At September 30, 2021, funds within the JohnHancock group of funds complex held 10.5% of the fund’s net assets. There were no individual affiliated fundswith an ownership of 5% or more of the fund’s net assets.
Note 8 — Investment in affiliated underlying funds
The fund may invest in affiliated underlying funds that are managed by the Advisor and its affiliates. Informationregarding the fund’s fiscal year to date purchases and sales of the affiliated underlying funds as well as incomeand capital gains earned by the fund, if any, is as follows:
Dividends and distributions
Affiliate
Endingshare
amountBeginning
valueCost of
purchases
Proceedsfrom shares
sold
Realizedgain
(loss)
Change inunrealized
appreciation(depreciation)
Incomedistributions
received
Capital gaindistributions
receivedEnding
value
John HancockCollateralTrust* — $7,654,844 $165,857,209 $(173,511,029) $5,177 $(6,201) $122,232 — —
* Refer to the Securities lending note within Note 2 for details regarding this investment.
Note 9 — Coronavirus (COVID-19) pandemic
The novel COVID-19 disease has resulted in significant disruptions to global business activity. A widespread healthcrisis such as a global pandemic could cause substantial market volatility, exchange trading suspensions andclosures, which may lead to less liquidity in certain instruments, industries, sectors or the markets generally, andmay ultimately affect fund performance.
30 JOHN HANCOCK GLOBAL SHAREHOLDER YIELD FUND | SEMIANNUAL REPORT

EVALUATION OF ADVISORY AND SUBADVISORY AGREEMENTS BY THE BOARD OFTRUSTEES
This section describes the evaluation by the Board of Trustees (the Board) of John Hancock Funds III (the Trust) ofthe Advisory Agreement (the Advisory Agreement) with John Hancock Investment Management, LLC (the Advisor)and the Subadvisory Agreement (the Subadvisory Agreement) with Epoch Investment Partners, Inc. (theSubadvisor), for John Hancock Global Shareholder Yield Fund (the fund). The Advisory Agreement and SubadvisoryAgreement are collectively referred to as the Agreements. Prior to the June 22-24, 2021 videoconference1 meetingat which the Agreements were approved, the Board also discussed and considered information regarding theproposed continuation of the Agreements at the videoconference meeting held on May 25-26, 2021. The Trusteeswho are not “interested persons” of the Trust as defined by the Investment Company Act of 1940, as amended(the “1940 Act”) (the “Independent Trustees”) also met separately to evaluate and discuss the informationpresented, including with counsel to the Independent Trustees and a third-party consulting firm.
Approval of Advisory and Subadvisory Agreements
At videoconference meetings held on June 22-24, 2021, the Board, including the Trustees who are not parties toany Agreement or considered to be interested persons of the Trust under the 1940 Act, reapproved for an annualperiod the continuation of the Advisory Agreement between the Trust and the Advisor and the SubadvisoryAgreement between the Advisor and the Subadvisor with respect to the fund.
In considering the Advisory Agreement and the Subadvisory Agreement, the Board received in advance of themeetings a variety of materials relating to the fund, the Advisor and the Subadvisor, including comparativeperformance, fee and expense information for a peer group of similar funds prepared by an independentthird-party provider of fund data, performance information for an applicable benchmark index; and, with respectto the Subadvisor, comparative performance information for comparably managed accounts, as applicable, andother information provided by the Advisor and the Subadvisor regarding the nature, extent and quality of servicesprovided by the Advisor and the Subadvisor under their respective Agreements, as well as information regardingthe Advisor’s revenues and costs of providing services to the fund and any compensation paid to affiliates of theAdvisor. At the meetings at which the renewal of the Advisory Agreement and Subadvisory Agreement areconsidered, particular focus is given to information concerning fund performance, comparability of fees and totalexpenses, and profitability. However, the Board notes that the evaluation process with respect to the Advisor andthe Subadvisor is an ongoing one. In this regard, the Board also took into account discussions with managementand information provided to the Board (including its various committees) at prior meetings with respect to theservices provided by the Advisor and the Subadvisor to the fund, including quarterly performance reports preparedby management containing reviews of investment results and prior presentations from the Subadvisor with respectto the fund. The information received and considered by the Board in connection with the May and June meetingsand throughout the year was both written and oral. The Board also considered the nature, quality, and extent ofnon-advisory services, if any, to be provided to the fund by the Advisor’s affiliates, including distribution services.The Board considered the Advisory Agreement and the Subadvisory Agreement separately in the course of itsreview. In doing so, the Board noted the respective roles of the Advisor and Subadvisor in providing services to thefund.
1 On June 19, 2020, as a result of health and safety measures put in place to combat the global COVID-19 pan-demic, the Securities and Exchange Commission issued an exemptive order (the “Order”) pursuant to Sections 6(c)and 38(a) of the Investment Company Act of 1940, as amended (the “1940 Act”), that temporarily exempts regis-tered investment management companies from the in-person voting requirements under the 1940 Act, subject tocertain requirements, including that votes taken pursuant to the Order are ratified at the next in-person meeting.The Board determined that reliance on the Order was necessary or appropriate due to the circumstances related tocurrent or potential effects of COVID-19 and therefore, the Board’s May and June meetings were held via video-conference in reliance on the Order. This exemptive order supersedes, in part, a similar, earlier exemptive orderissued by the SEC.
SEMIANNUAL REPORT | JOHN HANCOCK GLOBAL SHAREHOLDER YIELD FUND 31

Throughout the process, the Board asked questions of and requested additional information from management.The Board is assisted by counsel for the Trust and the Independent Trustees are also separately assisted byindependent legal counsel throughout the process. The Independent Trustees also received a memorandum fromtheir independent legal counsel discussing the legal standards for their consideration of the proposed continuationof the Agreements and discussed the proposed continuation of the Agreements in private sessions with theirindependent legal counsel at which no representatives of management were present.
Approval of Advisory Agreement
In approving the Advisory Agreement with respect to the fund, the Board, including the Independent Trustees,considered a variety of factors, including those discussed below. The Board also considered other factors (includingconditions and trends prevailing generally in the economy, the securities markets, and the industry) and did nottreat any single factor as determinative, and each Trustee may have attributed different weights to differentfactors. The Board’s conclusions may be based in part on its consideration of the advisory and subadvisoryarrangements in prior years and on the Board’s ongoing regular review of fund performance and operationsthroughout the year.
Nature, extent, and quality of services. Among the information received by the Board from the Advisor relating tothe nature, extent, and quality of services provided to the fund, the Board reviewed information provided by theAdvisor relating to its operations and personnel, descriptions of its organizational and management structure, andinformation regarding the Advisor’s compliance and regulatory history, including its Form ADV. The Board alsonoted that on a regular basis it receives and reviews information from the Trust’s Chief Compliance Officer (CCO)regarding the fund’s compliance policies and procedures established pursuant to Rule 38a-1 under the 1940 Act.The Board observed that the scope of services provided by the Advisor, and of the undertakings required of theAdvisor in connection with those services, including maintaining and monitoring its own and the fund’scompliance programs, risk management programs, liquidity management programs and cybersecurity programs,had expanded over time as a result of regulatory, market and other developments. The Board considered that theAdvisor is responsible for the management of the day-to-day operations of the fund, including, but not limited to,general supervision of and coordination of the services provided by the Subadvisor, and is also responsible formonitoring and reviewing the activities of the Subadvisor and other third-party service providers. The Board alsoconsidered the significant risks assumed by the Advisor in connection with the services provided to the fundincluding entrepreneurial risk in sponsoring new funds and ongoing risks including investment, operational,enterprise, litigation, regulatory and compliance risks with respect to all funds.
In considering the nature, extent, and quality of the services provided by the Advisor, the Trustees also took intoaccount their knowledge of the Advisor’s management and the quality of the performance of the Advisor’s duties,through Board meetings, discussions and reports during the preceding year and through each Trustee’s experienceas a Trustee of the Trust and of the other trusts in the John Hancock group of funds complex (the John HancockFund Complex).
In the course of their deliberations regarding the Advisory Agreement, the Board considered, among other things:
(a) the skills and competency with which the Advisor has in the past managed the Trust’s affairs and itssubadvisory relationship, the Advisor’s oversight and monitoring of the Subadvisor’s investmentperformance and compliance programs, such as the Subadvisor’s compliance with fund policies andobjectives, review of brokerage matters, including with respect to trade allocation and best executionand the Advisor’s timeliness in responding to performance issues;
(b) the background, qualifications and skills of the Advisor’s personnel;
(c) the Advisor’s compliance policies and procedures and its responsiveness to regulatory changes andfund industry developments;
32 JOHN HANCOCK GLOBAL SHAREHOLDER YIELD FUND | SEMIANNUAL REPORT

(d) the Advisor’s administrative capabilities, including its ability to supervise the other service providersfor the fund, as well as the Advisor’s oversight of any securities lending activity, its monitoring of classaction litigation and collection of class action settlements on behalf of the fund, and bringing lossrecovery actions on behalf of the fund;
(e) the financial condition of the Advisor and whether it has the financial wherewithal to provide a highlevel and quality of services to the fund;
(f) the Advisor’s initiatives intended to improve various aspects of the Trust’s operations and investorexperience with the fund; and
(g) the Advisor’s reputation and experience in serving as an investment advisor to the Trust and thebenefit to shareholders of investing in funds that are part of a family of funds offering a variety ofinvestments.
The Board concluded that the Advisor may reasonably be expected to continue to provide a high quality of servicesunder the Advisory Agreement with respect to the fund.
Investment performance.In considering the fund’s performance, the Board noted that it reviews at its regularlyscheduled meetings information about the fund’s performance results. In connection with the consideration of theAdvisory Agreement, the Board:
(a) reviewed information prepared by management regarding the fund’s performance;
(b) considered the comparative performance of an applicable benchmark index;
(c) considered the performance of comparable funds, if any, as included in the report prepared by anindependent third-party provider of fund data; and
(d) took into account the Advisor’s analysis of the fund’s performance and its plans andrecommendations regarding the Trust’s subadvisory arrangements generally.
The Board noted that while it found the data provided by the independent third-party generally useful itrecognized its limitations, including in particular that the data may vary depending on the end date selected andthat the results of the performance comparisons may vary depending on the selection of the peer group. The Boardnoted that the fund underperformed its benchmark index and peer group median for the one-, three-,five- andten-year periods ended December 31, 2020. The Board took into account management’s discussion of the factorsthat contributed to the fund’s performance for the benchmark index and peer group median for the one-, three-,five- and ten-year periods including the impact of past and current market conditions on the fund’s strategy andmanagement’s outlook for the fund. The Board concluded that the fund’s performance is being monitored andreasonably addressed, where appropriate.
Fees and expenses. The Board reviewed comparative information prepared by an independent third-party providerof fund data, including, among other data, the fund’s contractual and net management fees (and subadvisory fees,to the extent available) and total expenses as compared to similarly situated investment companies deemed to becomparable to the fund in light of the nature, extent and quality of the management and advisory and subadvisoryservices provided by the Advisor and the Subadvisor. The Board considered the fund’s ranking within a smallergroup of peer funds chosen by the independent third-party provider, as well as the fund’s ranking within a broadergroup of funds. In comparing the fund’s contractual and net management fees to those of comparable funds, theBoard noted that such fees include both advisory and administrative costs. The Board noted that net managementfees and total expenses for the fund are lower than the peer group median.
The Board took into account management’s discussion with respect to the overall management fee and the fees ofthe Subadvisor, including the amount of the advisory fee retained by the Advisor after payment of the subadvisoryfee, in each case in light of the services rendered for those amounts and the risks undertaken by the Advisor. The
SEMIANNUAL REPORT | JOHN HANCOCK GLOBAL SHAREHOLDER YIELD FUND 33

Board also noted that the Advisor pays the subadvisory fee, and that such fees are negotiated at arm’s length withrespect to the Subadvisor. The Board also took into account that management had agreed to implement an overallfee waiver across the complex, including the fund, which is discussed further below. The Board also noted that, inaddition, the Advisor is currently waiving fees and/or reimbursing expenses with respect to the fund. The Boardreviewed information provided by the Advisor concerning investment advisory fees charged by the Advisor or oneof its advisory affiliates to other clients (including other funds in the complex) having similar investment mandates,if any. The Board considered any differences between the Advisor’s and a Subadvisor’s services to the fund and theservices they provide to other comparable clients or funds. The Board concluded that the advisory fee paid withrespect to the fund is reasonable in light of the nature, extent and quality of the services provided to the fundunder the Advisory Agreement.
Profitability/Fall out benefits. In considering the costs of the services to be provided and the profits to be realizedby the Advisor and its affiliates from the Advisor’s relationship with the Trust, the Board:
(a) reviewed financial information of the Advisor;
(b) reviewed and considered information presented by the Advisor regarding the net profitability to theAdvisor and its affiliates with respect to the fund;
(c) received and reviewed profitability information with respect to the John Hancock Fund Complex as awhole and with respect to the fund;
(d) received information with respect to the Advisor’s allocation methodologies used in preparing theprofitability data and considered that the Advisor hired an independent third-party consultant toprovide an analysis of the Advisor’s allocation methodologies;
(e) considered that the John Hancock insurance companies that are affiliates of the Advisor, asshareholders of the Trust directly or through their separate accounts, receive certain tax credits ordeductions relating to foreign taxes paid and dividends received by certain funds of the Trust andnoted that these tax benefits, which are not available to participants in qualified retirement plansunder applicable income tax law, are reflected in the profitability information reviewed by the Board;
(f) considered that the Advisor also provides administrative services to the fund on a cost basis pursuantto an administrative services agreement;
(g) noted that affiliates of the Advisor provide transfer agency services and distribution services to thefund, and that the fund’s distributor also receives Rule 12b-1 payments to support distribution of thefund;
(h) noted that the Advisor also derives reputational and other indirect benefits from providing advisoryservices to the fund;
(i) noted that the subadvisory fee for the fund is paid by the Advisor and is negotiated at arm’s length;
(j) considered the Advisor’s ongoing costs and expenditures necessary to improve services, meet newregulatory and compliance requirements, and adapt to other challenges impacting the fund industry;and
(k) considered that the Advisor should be entitled to earn a reasonable level of profits in exchange forthe level of services it provides to the fund and the risks that it assumes as Advisor, includingentrepreneurial, operational, reputational, litigation and regulatory risk.
Based upon its review, the Board concluded that the level of profitability, if any, of the Advisor and its affiliatesfrom their relationship with the fund was reasonable and not excessive.
34 JOHN HANCOCK GLOBAL SHAREHOLDER YIELD FUND | SEMIANNUAL REPORT

Economies of scale. In considering the extent to which economies of scale would be realized as the fund growsand whether fee levels reflect these economies of scale for the benefit of fund shareholders, the Board:
(a) considered that the Advisor has contractually agreed to waive a portion of its management fee forcertain funds of the John Hancock Fund Complex, including the fund (the participating portfolios) orotherwise reimburse the expenses of the participating portfolios (the reimbursement). This waiver isbased upon aggregate net assets of all the participating portfolios. The amount of the reimbursementis calculated daily and allocated among all the participating portfolios in proportion to the daily netassets of each fund;
(b) the Board also took into account management’s discussion of the fund’s advisory fee structure; and
(c) the Board also considered the effect of the fund’s growth in size on its performance and fees. TheBoard also noted that if the fund’s assets increase over time, the fund may realize other economies ofscale.
Approval of Subadvisory Agreement
In making its determination with respect to approval of the Subadvisory Agreement, the Board reviewed:
(1) information relating to the Subadvisor’s business, including current subadvisory services to the Trust(and other funds in the John Hancock Fund Complex);
(2) the historical and current performance of the fund and comparative performance information relatingto an applicable benchmark index and comparable funds;
(3) the subadvisory fee for the fund, including any breakpoints, and to the extent available, comparablefee information prepared by an independent third party provider of fund data; and
(4) information relating to the nature and scope of any material relationships and their significance tothe Trust’s Advisor and Subadvisor.
Nature, extent, and quality of services. With respect to the services provided by the Subadvisor, the Board receivedinformation provided to the Board by the Subadvisor, including the Subadvisor’s Form ADV, as well as took intoaccount information presented throughout the past year. The Board considered the Subadvisor’s current level ofstaffing and its overall resources, as well as received information relating to the Subadvisor’s compensationprogram. The Board reviewed the Subadvisor’s history and investment experience, as well as information regardingthe qualifications, background, and responsibilities of the Subadvisor’s investment and compliance personnel whoprovide services to the fund. The Board also considered, among other things, the Subadvisor’s compliance programand any disciplinary history. The Board also considered the Subadvisor’s risk assessment and monitoring process.The Board reviewed the Subadvisor’s regulatory history, including whether it was involved in any regulatory actionsor investigations as well as material litigation, and any settlements and amelioratory actions undertaken, asappropriate. The Board noted that the Advisor conducts regular, periodic reviews of the Subadvisor and itsoperations, including regarding investment processes and organizational and staffing matters. The Board alsonoted that the Trust’s CCO and his staff conduct regular, periodic compliance reviews with the Subadvisor andpresent reports to the Independent Trustees regarding the same, which includes evaluating the regulatorycompliance systems of the Subadvisor and procedures reasonably designed to assure compliance with the federalsecurities laws. The Board also took into account the financial condition of the Subadvisor.
The Board considered the Subadvisor’s investment process and philosophy. The Board took into account that theSubadvisor’s responsibilities include the development and maintenance of an investment program for the fundthat is consistent with the fund’s investment objective, the selection of investment securities and the placement of
SEMIANNUAL REPORT | JOHN HANCOCK GLOBAL SHAREHOLDER YIELD FUND 35

orders for the purchase and sale of such securities, as well as the implementation of compliance controls related toperformance of these services. The Board also received information with respect to the Subadvisor’s brokeragepolicies and practices, including with respect to best execution and soft dollars.
Subadvisor compensation. In considering the cost of services to be provided by the Subadvisor and the profitabilityto the Subadvisor of its relationship with the fund, the Board noted that the fees under the SubadvisoryAgreement are paid by the Advisor and not the fund.
The Board also relied on the ability of the Advisor to negotiate the Subadvisory Agreement with the Subadvisor,which is not affiliated with the Advisor, and the fees thereunder at arm’s length. As a result, the costs of theservices to be provided and the profits to be realized by the Subadvisor from its relationship with the Trust werenot a material factor in the Board’s consideration of the Subadvisory Agreement.
The Board also received information regarding the nature and scope (including their significance to the Advisorand its affiliates and to the Subadvisor) of any material relationships with respect to the Subadvisor, which includearrangements in which the Subadvisor or its affiliates provide advisory, distribution, or management services inconnection with financial products sponsored by the Advisor or its affiliates, and may include other registeredinvestment companies, a 529 education savings plan, managed separate accounts and exempt group annuitycontracts sold to qualified plans. The Board also received information and took into account any other potentialconflicts of interest the Advisor might have in connection with the Subadvisory Agreement.
In addition, the Board considered other potential indirect benefits that the Subadvisor and its affiliates may receivefrom the Subadvisor’s relationship with the fund, such as the opportunity to provide advisory services to additionalfunds in the John Hancock Fund Complex and reputational benefits.
Subadvisory fees. The Board considered that the fund pays an advisory fee to the Advisor and that, in turn, theAdvisor pays a subadvisory fee to the Subadvisor. As noted above, the Board also considered the fund’ssubadvisory fees as compared to similarly situated investment companies deemed to be comparable to the fund asincluded in the report prepared by the independent third party provider of fund data, to the extent available. TheBoard noted that the limited size of the Lipper peer group was not sufficient for comparative purposes. The Boardalso took into account the subadvisory fees paid by the Advisor to the Subadvisor with respect to the fund andcompared them to fees charged by the Subadvisor to manage other subadvised portfolios and portfolios notsubject to regulation under the 1940 Act, as applicable.
Subadvisor performance. As noted above, the Board considered the fund’s performance as compared to the fund’speer group median and the benchmark index and noted that the Board reviews information about the fund’sperformance results at its regularly scheduled meetings. The Board noted the Advisor’s expertise and resources inmonitoring the performance, investment style and risk-adjusted performance of the Subadvisor. The Board wasmindful of the Advisor’s focus on the Subadvisor’s performance. The Board also noted the Subadvisor’s long-termperformance record for similar accounts, as applicable.
The Board’s decision to approve the Subadvisory Agreement was based on a number of determinations, includingthe following:
(1) the Subadvisor has extensive experience and demonstrated skills as a manager;
(2) the performance of the fund is being monitored and reasonably addressed, where appropriate;
(3) the subadvisory fee is reasonable in relation to the level and quality of services being provided underthe Subadvisory Agreement; and
(4) noted that the subadvisory fees are paid by the Advisor not the fund.
* * *
36 JOHN HANCOCK GLOBAL SHAREHOLDER YIELD FUND | SEMIANNUAL REPORT

Based on the Board’s evaluation of all factors that the Board deemed to be material, including those factorsdescribed above, the Board, including the Independent Trustees, concluded that renewal of the AdvisoryAgreement and the Subadvisory Agreement would be in the best interest of the fund and its shareholders.Accordingly, the Board, and the Independent Trustees voting separately, approved the Advisory Agreement andSubadvisory Agreement for an additional one-year period.
SEMIANNUAL REPORT | JOHN HANCOCK GLOBAL SHAREHOLDER YIELD FUND 37

TrusteesHassell H. McClellan, ChairpersonSteven R. Pruchansky, Vice ChairpersonAndrew G. Arnott†
Charles L. Bardelis*
James R. BoylePeter S. Burgess*
William H. CunninghamGrace K. FeyMarianne Harrison†
Deborah C. JacksonFrances G. Rathke*
Gregory A. Russo
OfficersAndrew G. ArnottPresidentCharles A. RizzoChief Financial OfficerSalvatore SchiavoneTreasurerChristopher (Kit) SechlerSecretary and Chief Legal OfficerTrevor SwanbergChief Compliance Officer
* Member of the Audit Committee† Non-Independent Trustee
Investment advisorJohn Hancock Investment Management LLC
SubadvisorEpoch Investment Partners, Inc.
Portfolio ManagersWilliam W. Priest, CFAJohn M. Tobin, Ph.D., CFAKera Van Valen, CFAMichael A.Welhoelter, CFA
Principal distributorJohn Hancock Investment Management Distributors LLC
CustodianCitibank, N.A.
Transfer agentJohn Hancock Signature Services, Inc.
Legal counselK&L Gates LLP
The fund’s proxy voting policies and procedures, as well as the fund proxy voting record for the most recent twelve-month periodended June 30, are available free of charge on the Securities and Exchange Commission (SEC) website at sec.gov or on ourwebsite.
All of the fund’s holdings as of the end of the third month of every fiscal quarter are filed with the SEC on Form N-PORT within 60days of the end of the fiscal quarter. The fund’s Form N-PORT filings are available on our website and the SEC’s website, sec.gov.
We make this information on your fund, as well as monthly portfolio holdings, and other fund details available on our websiteat jhinvestments.com or by calling 800-225-5291.
You can also contact us:
800-225-5291 Regular mail: Express mail:
jhinvestments.com John Hancock Signature Services, Inc.P.O. Box 219909Kansas City, MO 64121-9909
John Hancock Signature Services, Inc.430 W 7th StreetSuite 219909Kansas City, MO 64105-1407
More information
38 JOHN HANCOCK GLOBAL SHAREHOLDER YIELD FUND | SEMIANNUAL REPORT

Protect yourself by using eDelivery
Signing up for the electronic delivery of your statements and other fi nancial publications is a great way to help protect your privacy. eDelivery provides you with secure, instant access to all of your statements in one convenient location.
BENEFITS OF EDELIVERY
■ Added security: Password protection helps you safely retrieve documents online
■ Save time: Receive instant email notifi cation once statements are available
■ Reduce clutter: View documents online to reduce the amount of paper for fi ling, shredding, or recycling
SIGN UP FOR EDELIVERY TODAY!
Direct shareholders
If you receive statements directly through John Hancock Investment Management and would like to participate in eDelivery, go to jhinvestments.com/login. To log in to your account, click on the “Log in” button on the page’s top right corner. In the “Access your investments account” area, go to the “Individual retirement or mutual fund account” section and select the option that applies to you. Please be aware that you may be required to provide your account number and certain personal account information.
You may revoke your consent at any time by simply visiting jhinvestments.com/login and following the instructions above. You may also revoke consent by calling 800-225-5291 or by writing to us at the following address: John Hancock Signature Services, Inc., P.O. Box 219909, Kansas City, MO 64121-9909. We reserve the right to deliver documents to you on paper at any time should the need arise.
Brokerage account shareholdersIf you receive statements directly from your bank or broker and would like toparticipate in eDelivery, go to icsdelivery/live or contact your fi nancial representative.
Not part of the shareholder report
jhinvestments.com/login

Not part of the shareholder report
ONLINE
■ Visit jhinvestments.com to access a range of resources for individual investors, from account details and fund information to forms and our latest insight on the markets and economy.
■ Use our Fund Compare tool to compare thousands of funds and ETFs across dozens of risk and performance metrics—all powered by Morningstar.
■ Visit our online Tax Center, where you’ll fi nd helpful taxpayer resources all year long, including tax forms, planning guides, and other fund-specifi c information.
■ Follow us on Facebook, Twitter, and LinkedIn to get the latest updates on the markets and what’s trending now.
BY PHONE
Call our customer service representatives at 800-225-5291, Monday to Thursday, 8:00 A.M. to 7:00 P.M., and Friday, 8:00 A.M. to 6:00 P.M., Eastern time. We’re here to help!
Get your questions answered by using ourshareholder resources


U.S. EQUITY FUNDS
Blue Chip Growth
Classic Value
Disciplined Value
Disciplined Value Mid Cap
Equity Income
Financial Industries
Fundamental All Cap Core
Fundamental Large Cap Core
Mid Cap Growth
New Opportunities
Regional Bank
Small Cap Core
Small Cap Growth
Small Cap Value
U.S. Global Leaders Growth
U.S. Growth
INTERNATIONAL EQUITY FUNDS
Disciplined Value International
Emerging Markets
Emerging Markets Equity
Fundamental Global Franchise
Global Environmental Opportunities
Global Equity
Global Shareholder Yield
Global Thematic Opportunities
International Dynamic Growth
International Growth
International Small Company
FIXED-INCOME FUNDS
Bond
California Tax-Free Income
Emerging Markets Debt
Floating Rate Income
Government Income
High Yield
High Yield Municipal Bond
Income
Investment Grade Bond
Money Market
Opportunistic Fixed Income
Short Duration Bond
Short Duration Credit Opportunities
Strategic Income Opportunities
Tax-Free Bond
ALTERNATIVE FUNDS
Absolute Return Currency
Alternative Asset Allocation
Diversified Macro
Infrastructure
Multi-Asset Absolute Return
Real Estate Securities
Seaport Long/Short
A fund’s investment objectives, risks, charges, and expenses should be considered carefully beforeinvesting. The prospectus contains this and other important information about the fund. To obtaina prospectus, contact your financial professional, call John Hancock Investments at 800-225-5291,or visit our website at jhinvestments.com. Please read the prospectus carefully before investing orsending money.
John Hancock family of funds

EXCHANGE-TRADED FUNDS
John Hancock Corporate Bond ETF
John Hancock Mortgage-Backed Securities ETF
John Hancock Multifactor Consumer Discretionary ETF
John Hancock Multifactor Consumer Staples ETF
John Hancock Multifactor Developed International ETF
John Hancock Multifactor Emerging Markets ETF
John Hancock Multifactor Energy ETF
John Hancock Multifactor Financials ETF
John Hancock Multifactor Healthcare ETF
John Hancock Multifactor Industrials ETF
John Hancock Multifactor Large Cap ETF
John Hancock Multifactor Materials ETF
John Hancock Multifactor Media and
Communications ETF
John Hancock Multifactor Mid Cap ETF
John Hancock Multifactor Small Cap ETF
John Hancock Multifactor Technology ETF
John Hancock Multifactor Utilities ETF
ENVIRONMENTAL, SOCIAL, ANDGOVERNANCE FUNDS
ESG Core Bond
ESG International Equity
ESG Large Cap Core
ASSET ALLOCATION/TARGET DATE FUNDS
Balanced
Multi-Asset High Income
Multi-Index Lifetime Portfolios
Multi-Index Preservation Portfolios
Multimanager Lifestyle Portfolios
Multimanager Lifetime Portfolios
Retirement Income 2040
CLOSED-END FUNDS
Financial Opportunities
Hedged Equity & Income
Income Securities Trust
Investors Trust
Preferred Income
Preferred Income II
Preferred Income III
Premium Dividend
Tax-Advantaged Dividend Income
Tax-Advantaged Global Shareholder Yield
John Hancock ETF shares are bought and sold at market price (not NAV), and are not individually redeemed fromthe fund. Brokerage commissions will reduce returns.
John Hancock ETFs are distributed by Foreside Fund Services, LLC, and are subadvised by Manulife InvestmentManagement (US) LLC or Dimensional Fund Advisors LP. Foreside is not affiliated with John Hancock InvestmentManagement Distributors LLC, Manulife Investment Management (US) LLC or Dimensional Fund Advisors LP.
Dimensional Fund Advisors LP receives compensation from John Hancock in connection with licensing rights to theJohn Hancock Dimensional indexes. Dimensional Fund Advisors LP does not sponsor, endorse, or sell, and makesno representation as to the advisability of investing in, John Hancock Multifactor ETFs.

A trusted brandJohn Hancock Investment Management is a premier asset managerwith a heritage of financial stewardship dating back to 1862. Helpingour shareholders pursue their financial goals is at the core of everythingwe do. It’s why we support the role of professional financial adviceand operate with the highest standards of conduct and integrity.
A better way to investWe serve investors globally through a unique multimanager approach:We search the world to find proven portfolio teams with specializedexpertise for every strategy we offer, then we apply robust investmentoversight to ensure they continue to meet our uncompromisingstandards and serve the best interests of our shareholders.
Results for investorsOur unique approach to asset management enables us to providea diverse set of investments backed by some of the world’s bestmanagers, along with strong risk-adjusted returns across asset classes.
“A trusted brand” is based on a survey of 6,651 respondents conducted by Medalliabetween 3/18/20 and 5/13/20.
John Hancock Investment Management Distributors LLC, Member FINRA, SIPC200 Berkeley Street, Boston, MA 02116-5010, 800-225-5291,jhinvestments.com
Manulife Investment Management, the Stylized M Design, and Manulife InvestmentManagement & Stylized M Design are trademarks of The Manufacturers LifeInsurance Company and are used by its affiliates under license.
NOT FDIC INSURED. MAY LOSE VALUE. NO BANK GUARANTEE. NOT INSURED BYANY GOVERNMENT AGENCY.
This report is for the information of the shareholders of John Hancock GlobalShareholder Yield Fund. It is not authorized for distribution to prospectiveinvestors unless preceded or accompanied by a prospectus.
MF1860920 320SA 9/2111/2021


