Some responses of Australian researchers to drought and climate variability? John Williams, Commissioner NSW Natural Resources Commission. 14-15 th November 2008 Hedley Bull Centre Australian National University Drought - Past and Future An Australian National University Water Initiative
Transcript
Some responses of Australian researchers to drought and climate
variability?
John Williams,
Commissioner
NSW Natural Resources Commission.
14-15th November 2008Hedley Bull Centre
Australian National University
Drought - Past and Future
An Australian National University Water Initiative
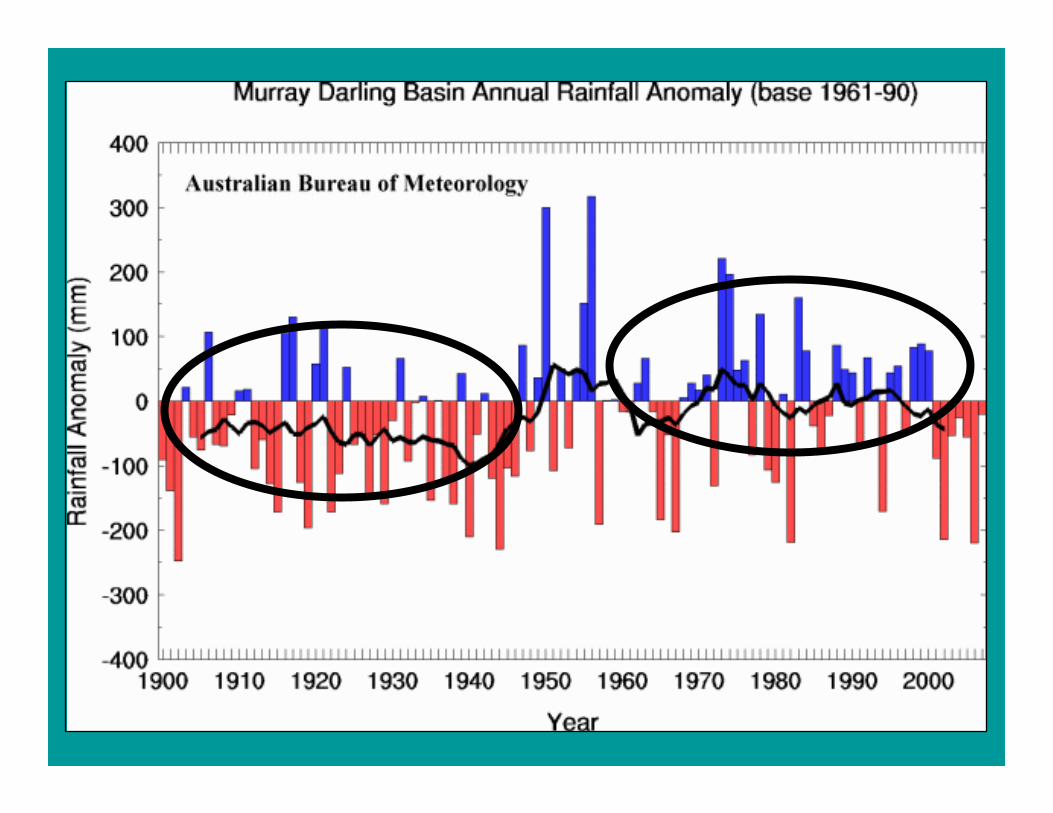
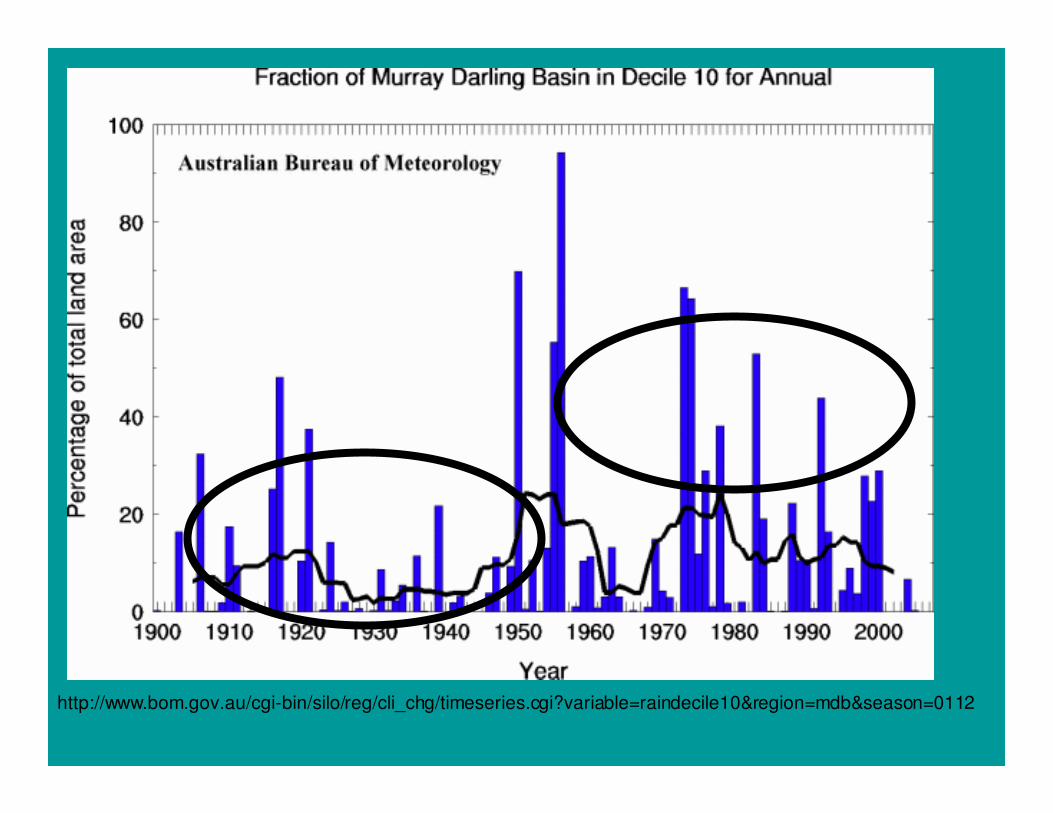
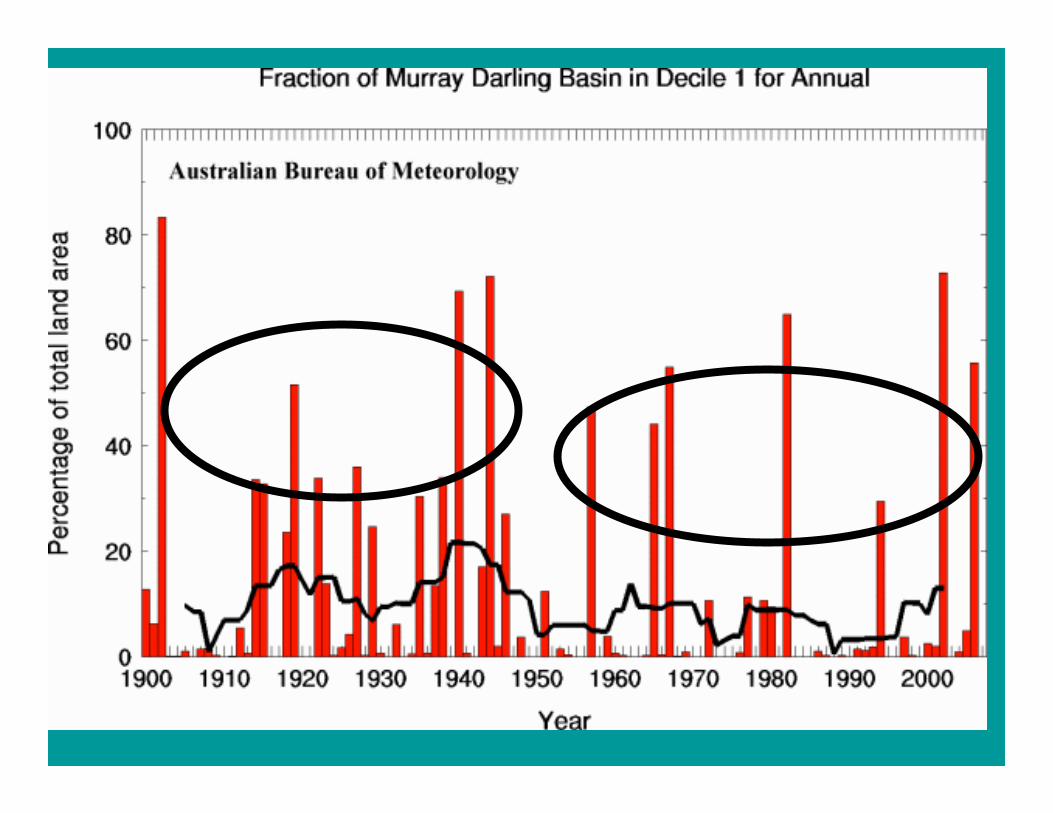
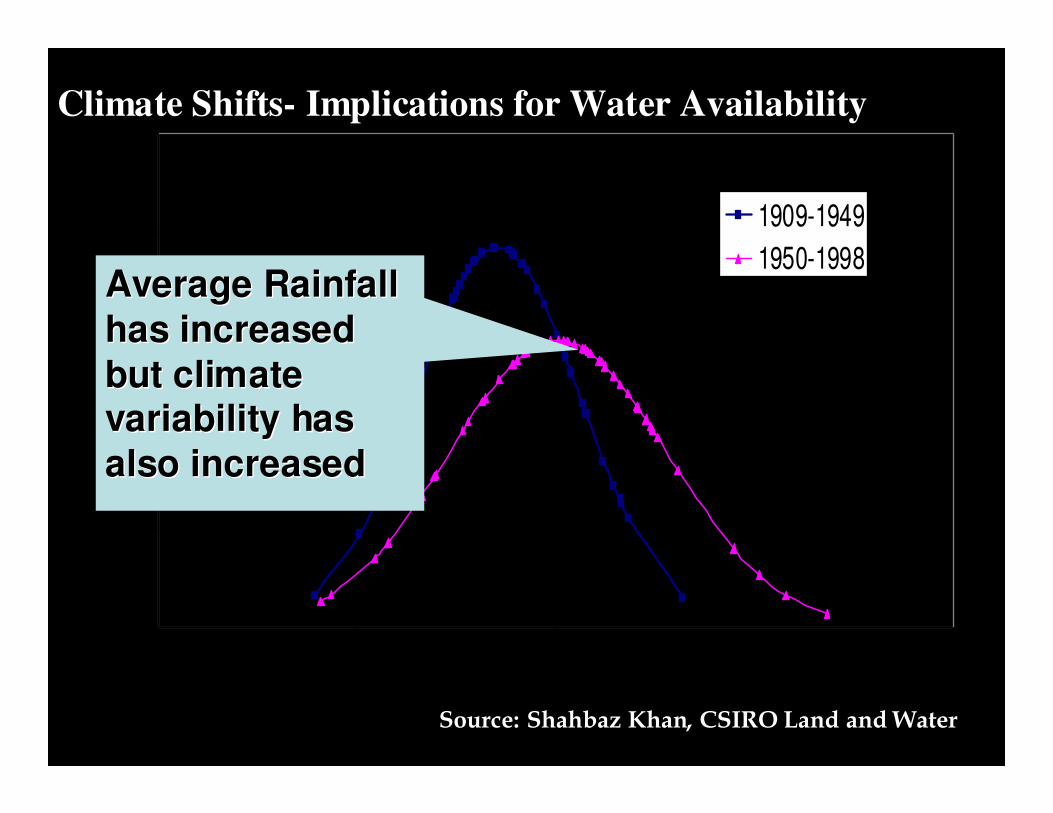
Climate Shifts- Implications for Water Availability
Average Rainfall Average Rainfall
has increasedhas increased
but climate but climate
variability has variability has
also increasedalso increased
Source: Shahbaz Khan, CSIRO Land and Water
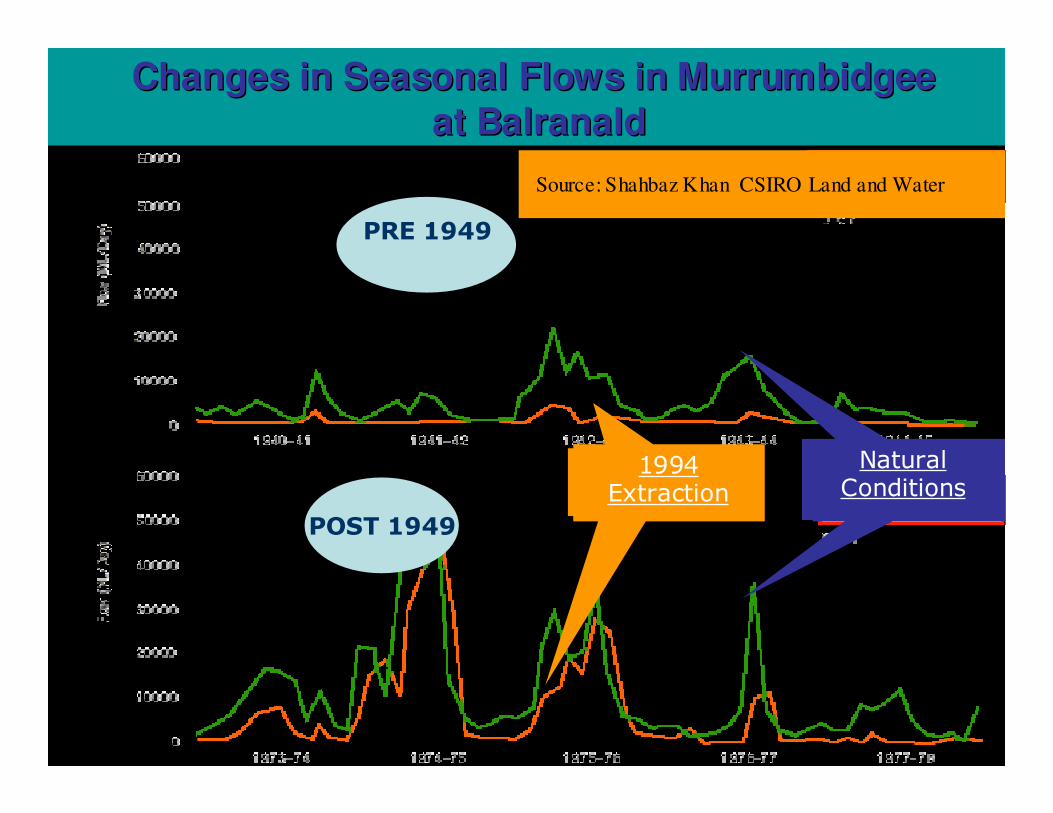
Changes in Seasonal Flows in MurrumbidgeeChanges in Seasonal Flows in Murrumbidgee
at Balranaldat Balranald
Natural
Conditions
PRE 1949
POST 1949
Natural
Conditions1994
Extraction
Source: Shahbaz Khan CSIRO Land and Water
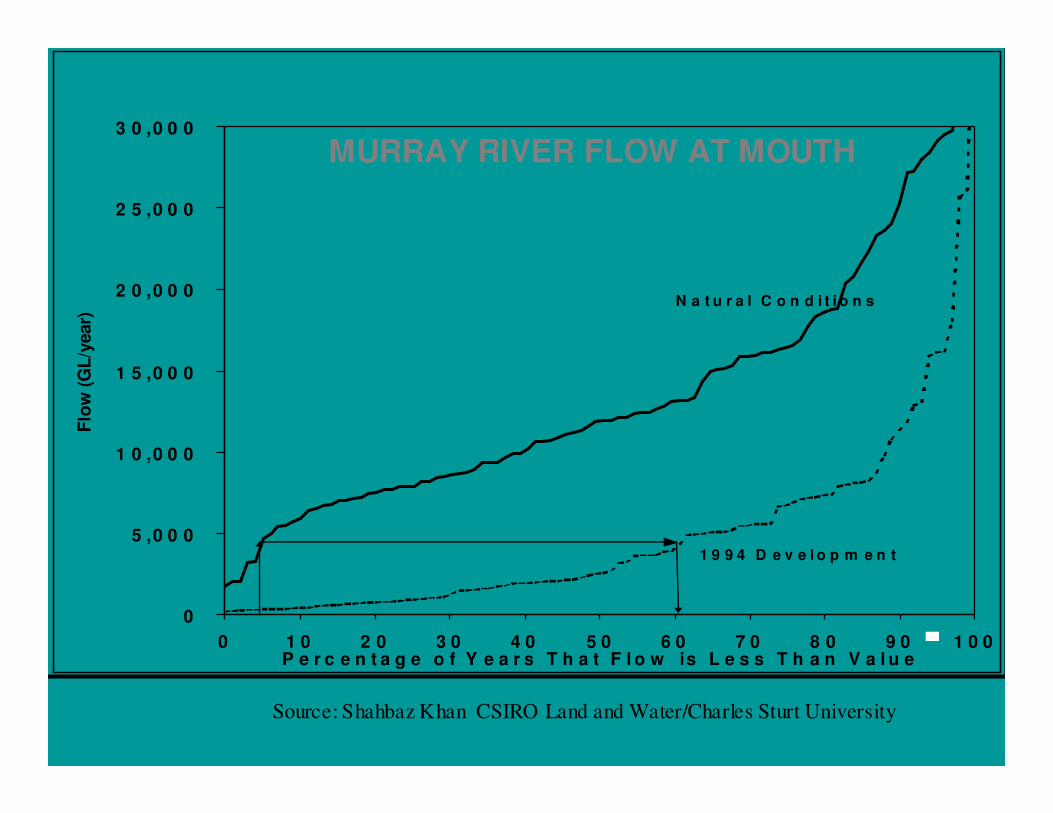
0
5 ,0 0 0
1 0 ,0 0 0
1 5 ,0 0 0
2 0 ,0 0 0
2 5 ,0 0 0
3 0 ,0 0 0
0 1 0 2 0 3 0 4 0 5 0 6 0 7 0 8 0 9 0 1 0 0P e r c e n t a g e o f Y e a r s T h a t F l o w is L e s s T h a n V a l u e
Flo
w (
GL
/year)
1 9 9 4 D e v e l o p m e n t
N a t u r a l C o n d i t i o n s
MURRAY RIVER FLOW AT MOUTH
Source: Shahbaz Khan CSIRO Land and Water/Charles Sturt University
Drought and water management– land use
• Change distribution of land-uses to minimise
impacts
• Hazard assessment of economic and
environmental vulnerability to drought
develop maps and analysis
build in climate change
• Use medium-term weather forecasts to predict how drought risk can be minimised
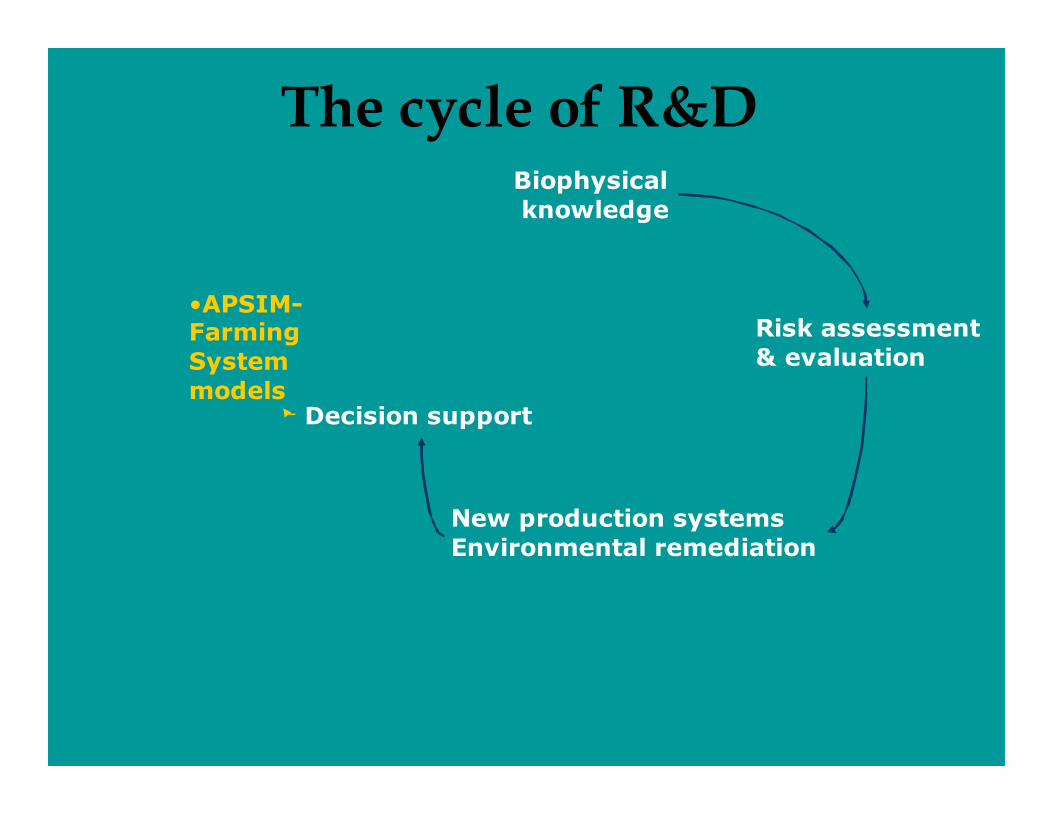
The cycle of R&DBiophysical
knowledge
Risk assessment
& evaluation
•APSIM-Farming
System
models
New production systems
Environmental remediation
Decision support
Drought and water management
- rain fed areas•Risk assessment of current dryland farming
• driven by historical climate and climate
change data
Yield (tonnes/ha)
Probability
Clay soil
Loam soil
Analysis of Drought at Walgett
Soil water store is 190mm
Soil water store is 100mm
Soil water store is 190mm
Location: Walgett
Crop: wheat
Sowing window: 1 May – 31 JulSoil Type: Vertosols, PAWC=240mm
Planting Rules: when 60cm depth 75% full
N Level: N=75kg/ha
NonReset = Continuous simulation from 1889-2000 without resetting the soil profile
Reset = Reset soil nitrogen/organic carbon every year to the same level
Sow date=15-Apr
Sow date=15-May
Sow date=15-Jun
Sow date=15-Jul
Yield (kg/ha)
55005000450040003500300025002000
Pro
bab
ility
90
80
70
60
50
40
30
20
10
Location: Walgett Crop: wheat
Sowing Dates: Fixed sowing on: 15-Apr, 15-May, 15-Jun, 15-Jul
Soil Type: Vertosols, PAWC=240mm
Planting Rules: Assuming profile 2/3 full with water at sowing date
N Level: N=75kg/ha
Weather Data: 1889-2000
Drought and water management
Change in land-use distribution.
• Building on more detailed analysis and measurement on the above to develop for Australia a robust set of maps and analysis that sets out the change in farming and landuse that can greatly reduce the risk of drought damage.
Drought and water management
The development of new farming and forestry systems that do not harm the environment and have capacity to buffer against drought while generating income to support communities must be an urgent goal for rural Australia.
CSIRO LAND and WATER
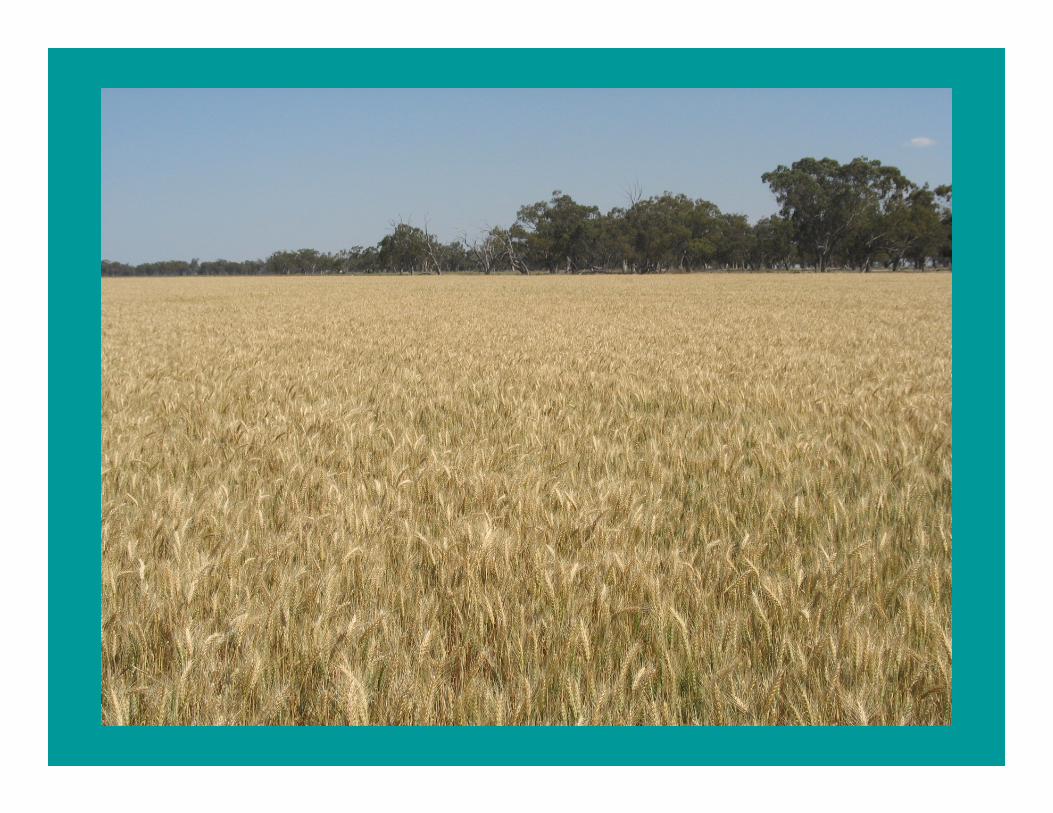
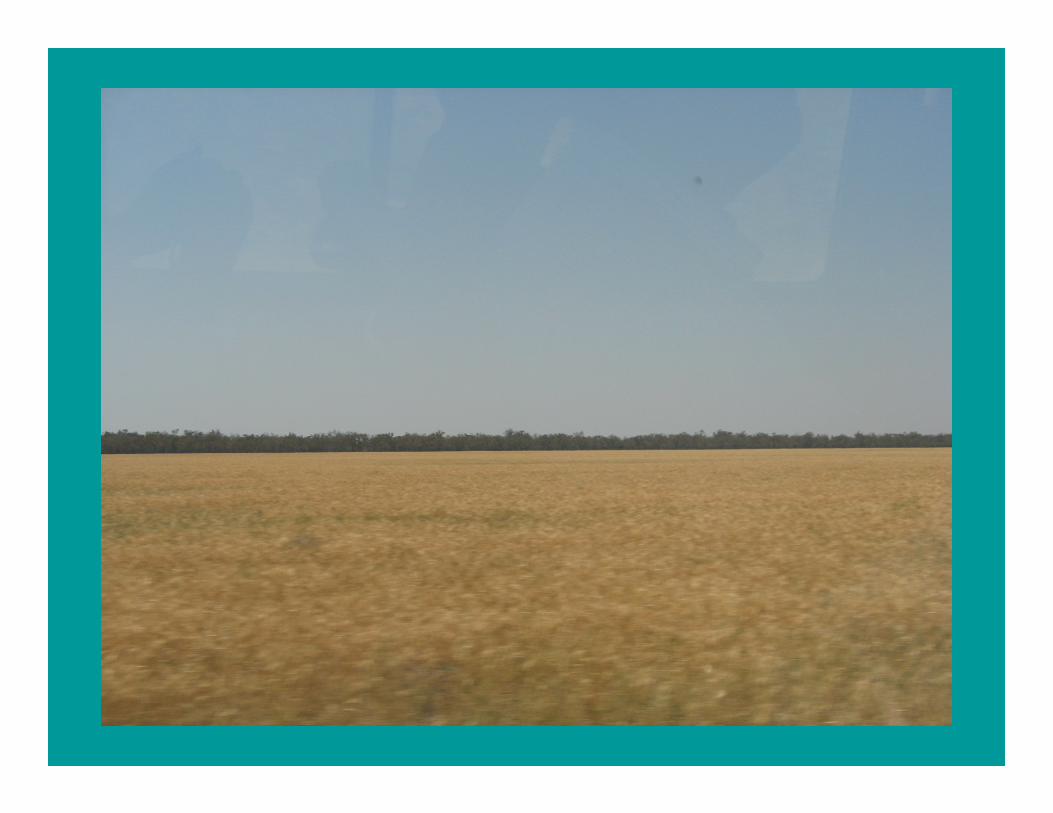
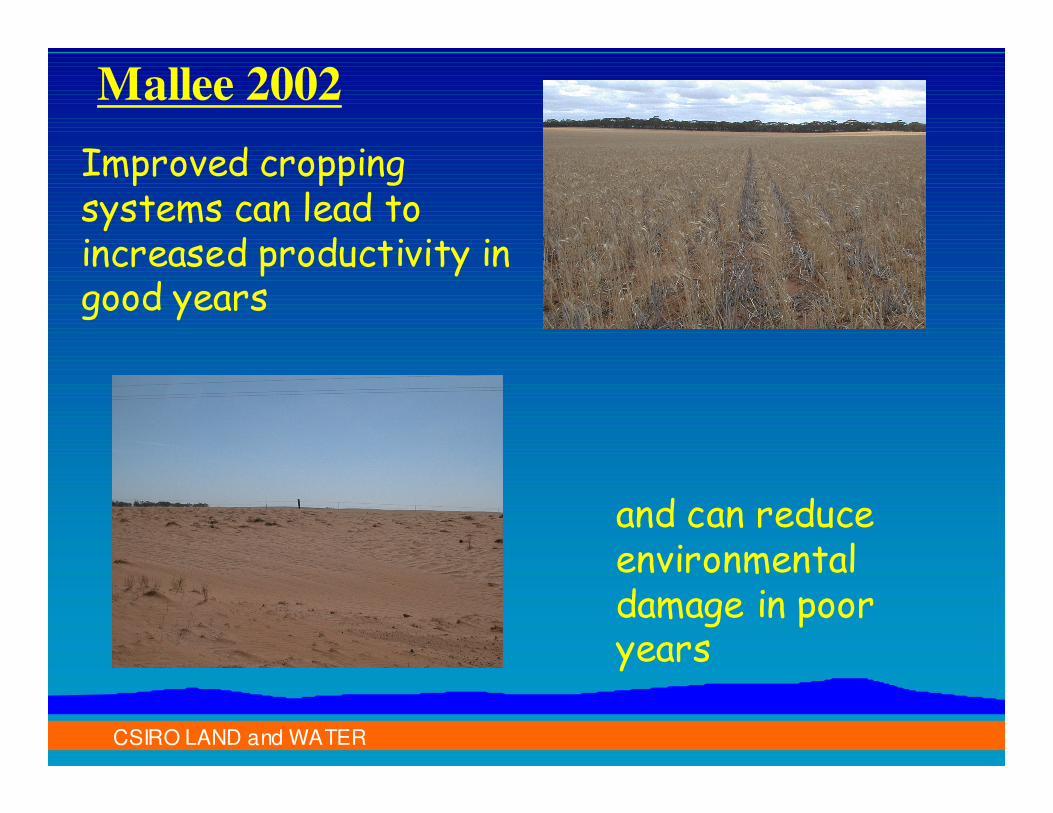
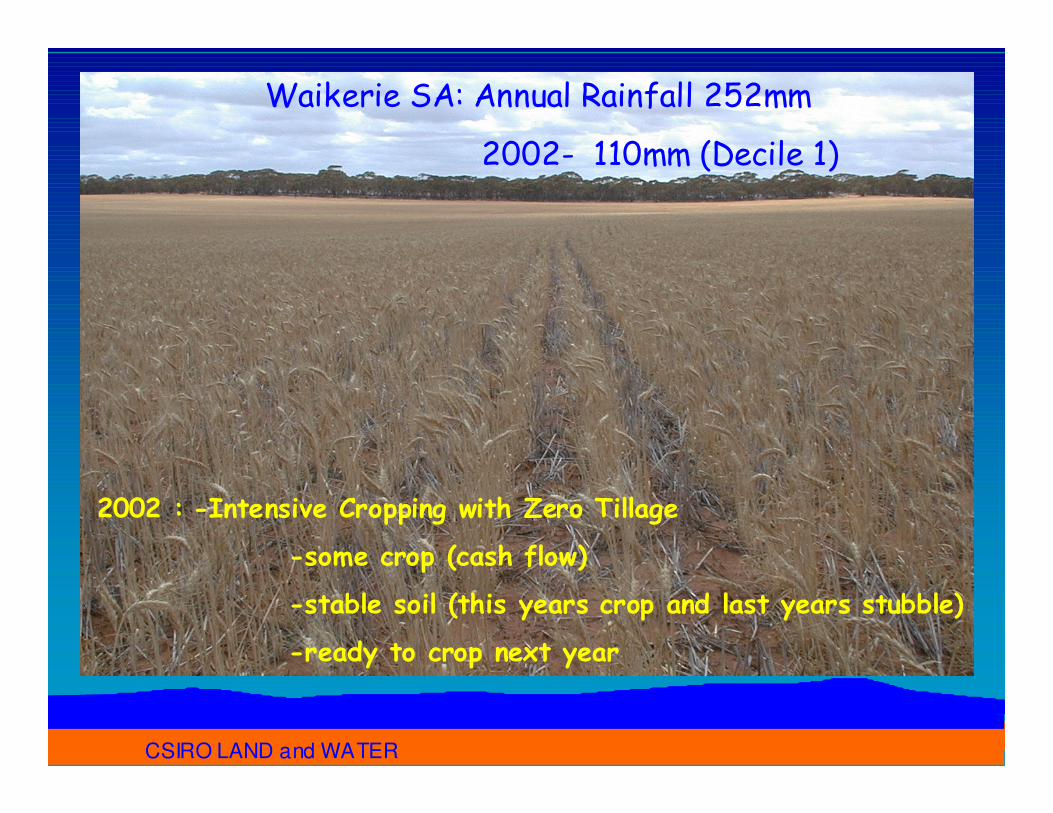
Improved cropping systems can lead to increased productivity in good years
and can reduce environmental damage in poor years
Mallee 2002
CSIRO LAND and WATERCSIRO LAND and WATER
Waikerie SA: Annual Rainfall 252mm
2002- 110mm (Decile 1)
2002 : -Intensive Cropping with Zero Tillage
-some crop (cash flow)
-stable soil (this years crop and last years stubble)
-ready to crop next year
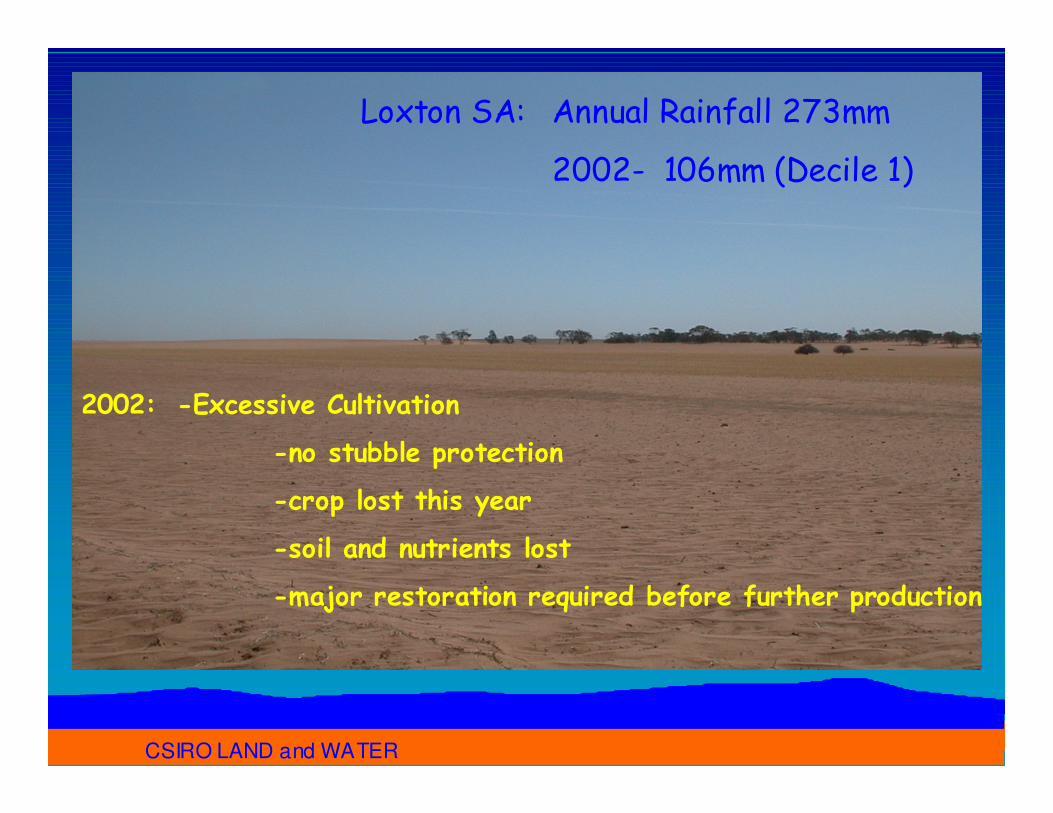
CSIRO LAND and WATERCSIRO LAND and WATER
Loxton SA: Annual Rainfall 273mm
2002- 106mm (Decile 1)
2002: -Excessive Cultivation
-no stubble protection
-crop lost this year
-soil and nutrients lost
-major restoration required before further production
Drought and water management – new industries
Develop new farming and forestry systems that
• do not harm the environment
• buffer against drought
• generate income from ecosystems service payments to support
communities
s
D
ro
u
g
ht
i
s
a
co
n
s
ta
n
t
t
h
r
ea
t
fo
r
Au
s
t
ra
l
i
an
f
ar
CSIRO Drought and Farming
Drought and farming overviewCSIRO is improving water efficiency and
developing techniques to help farms remain productive during drought conditions.
Drought is a constant threat for Australian farmers. Increasing pressure on water resources means farmers have to be constantly aware of how much water their crops use and how to get the most out of what water is available.
• precision agriculture and spatial modelling tools• developing drought tolerant plants• developing new cropping practices.
• We can reduce the impact of drought in our towns and cities by water re-use, savings and re-plumbing our cities as infrastructure is being replaced in new towns and suburbs.
• 25% of water extracted from our rivers and groundwater is used for urban domestic and industrial use.
• Cities are exporters of water. Overall we only re-use about 11% of our water in urban centers
Drought and water management
Drought and water management
• The science of how rivers and irrigation areas are linked and work as one is critical to Australia getting a water policy environment that can deal better with drought.
• How best to manage our rivers and groundwater systems against the tension between extraction for irrigation and urban use, and the need for environmental flows that can maintain health of rivers, groundwater, wetlands and estuaries
Irrigated Agriculture
CSIRO LAND and WATER
Tension between water extraction and water for river health
Water property rights• Research active in clarifing water property
rights and the obligations associated with those rights to give farmers some certainty and to enable water to be recovered for the environment.
Water LevelSerpentine
DamFeb 2002
(20% reduction in rainfall for
past
26 years)
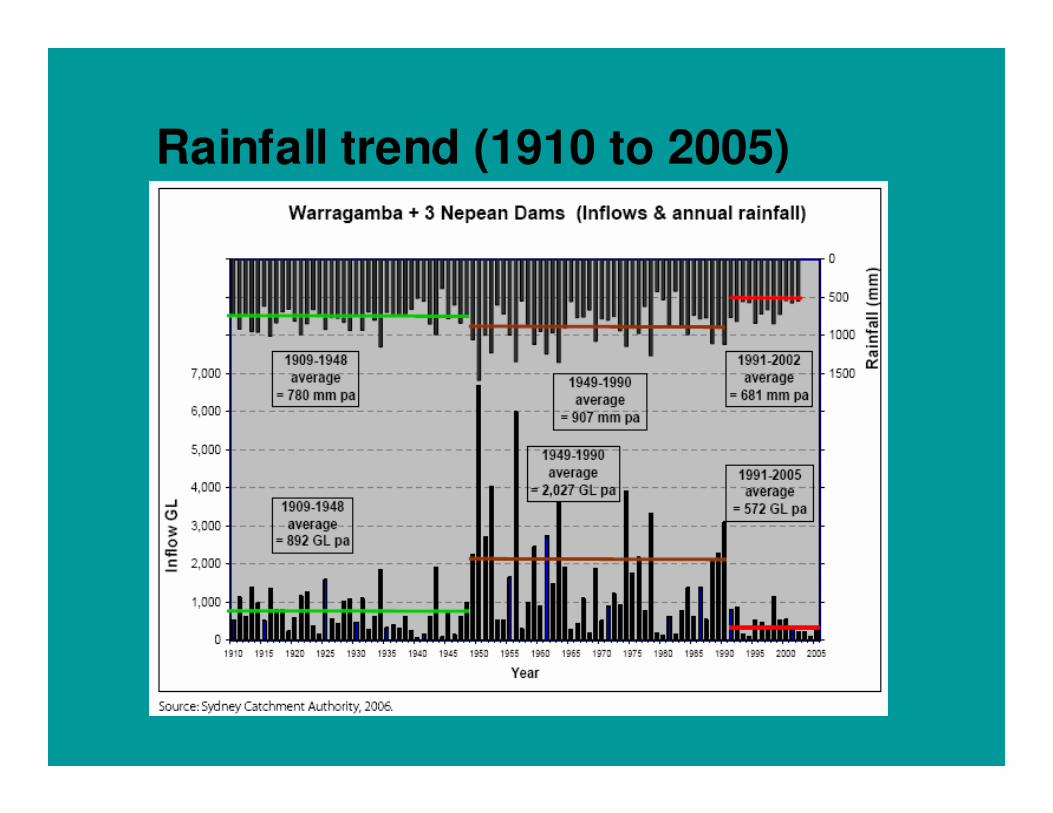
Climate variability
Climate variability: inflow decrease
0
100
200
300
400
500
600
700
800
900
1000
YE
AR
19
13
19
17
19
21
19
25
19
29
19
33
19
37
19
41
19
45
19
49
19
53
19
57
19
61
19
65
19
69
19
73
19
77
19
81
19
85
19
89
19
93
19
97
20
01
To
tal a
nn
ua
l in
flo
w (
GL
)
Inflow 1911 to 1974 (338 GL av) 1975 to 2001 (167 GL av)
Note: A year is taken as May to April and labelled year is start (winter) of year
Year 2001 inflows are not for a full year
12%
reduction in Rainfall
results in
25% reduction in
Water Yield
Climate change
Summer Winter
Autumn Spring
Projected Rainfall
Decreases
Projected Rainfall Decreases
CSIRO usually has two voices
• Status quo focus-productivity-survive
• Longer term change implication –environment/social


![arXiv:1806.09866v1 [stat.AP] 26 Jun 2018 · stock market responses [cf. 5, 6, 7]. Moreover, researchers have also demonstrated the prognostic capability of nancial disclosures with](https://static.documents.pub/doc/80x56/60dc529c005299099d5ce80b/arxiv180609866v1-statap-26-jun-2018-stock-market-responses-cf-5-6-7-moreover.jpg)


